Test: Medion Erazer Beast X10 (Tongfang GM7MPHP) - Stabil, tunn och kompakt spellaptop med bra batteritid (Sammanfattning)
Gradering | Datum | Modell | Vikt | Höjd | Storlek | Upplösning | Pris |
|---|---|---|---|---|---|---|---|
| 84.7 % v7 (old) | 12/2020 | Medion Erazer Beast X10 MD61804 i7-10750H, GeForce RTX 2070 Super Max-Q | 2.3 kg | 24.6 mm | 17.30" | 1920x1080 | |
| 85.8 % v7 (old) | Schenker XMG Neo 17 Comet Lake i7-10875H, GeForce RTX 2070 Super Mobile | 2.6 kg | 27.45 mm | 17.30" | 1920x1080 | ||
| 83.1 % v7 (old) | Asus Strix G17 G712LWS i7-10750H, GeForce RTX 2070 Super Mobile | 2.8 kg | 26.5 mm | 17.30" | 1920x1080 | ||
| 83.6 % v7 (old) | Acer Predator Helios 300 PH317-54-75G8 i7-10750H, GeForce RTX 2060 Mobile | 2.8 kg | 25 mm | 17.30" | 1920x1080 | ||
| 83.7 % v7 (old) | MSI GS75 10SF-609US i7-10875H, GeForce RTX 2070 Max-Q | 2.3 kg | 18.9 mm | 17.30" | 1920x1080 | ||
| 87.4 % v7 (old) | 06/2020 | Razer Blade Pro 17 RTX 2070 Max-Q 300 Hz i7-10875H, GeForce RTX 2070 Max-Q | 2.7 kg | 19.9 mm | 17.30" | 1920x1080 |
| Networking | |
| iperf3 transmit AX12 | |
| Acer Predator Helios 300 PH317-54-75G8 | |
| Razer Blade Pro 17 RTX 2070 Max-Q 300 Hz | |
| MSI GS75 10SF-609US | |
| Asus Strix G17 G712LWS | |
| Medion Erazer Beast X10 MD61804 | |
| Genomsnitt Intel Wi-Fi 6 AX201 (49.8 - 1775, n=324) | |
| Schenker XMG Neo 17 Comet Lake | |
| iperf3 receive AX12 | |
| Medion Erazer Beast X10 MD61804 | |
| Acer Predator Helios 300 PH317-54-75G8 | |
| Schenker XMG Neo 17 Comet Lake | |
| Asus Strix G17 G712LWS | |
| Genomsnitt Intel Wi-Fi 6 AX201 (136 - 1743, n=324) | |
| Razer Blade Pro 17 RTX 2070 Max-Q 300 Hz | |
| MSI GS75 10SF-609US | |


| |||||||||||||||||||||||||
Distribution av ljusstyrkan: 88 %
Mitt på batteriet: 313 cd/m²
Kontrast: 1159:1 (Svärta: 0.27 cd/m²)
ΔE ColorChecker Calman: 2.96 | ∀{0.5-29.43 Ø4.72}
calibrated: 1.03
ΔE Greyscale Calman: 4.9 | ∀{0.09-98 Ø4.97}
89% sRGB (Argyll 1.6.3 3D)
66% AdobeRGB 1998 (Argyll 1.6.3 3D)
65.6% AdobeRGB 1998 (Argyll 3D)
95.6% sRGB (Argyll 3D)
64.5% Display P3 (Argyll 3D)
Gamma: 2.187
CCT: 7559 K
| Medion Erazer Beast X10 MD61804 LG Phillips LP173WFG-SPB3, IPS, 1920x1080, 17.3" | Schenker XMG Neo 17 Comet Lake BOE HF NE173FHM-NZ1, IPS, 1920x1080, 17.3" | Asus Strix G17 G712LWS LG Philips LP173WFG-SPB3, IPS, 1920x1080, 17.3" | Acer Predator Helios 300 PH317-54-75G8 Chi Mei N173HCE-G33, IPS, 1920x1080, 17.3" | MSI GS75 10SF-609US Sharp LQ173M1JW05, IPS, 1920x1080, 17.3" | Razer Blade Pro 17 RTX 2070 Max-Q 300 Hz Sharp LQ173M1JW02, IPS, 1920x1080, 17.3" | |
|---|---|---|---|---|---|---|
| Display | 7% | 1% | -2% | 12% | 9% | |
| Display P3 Coverage (%) | 64.5 | 69.4 8% | 65.2 1% | 62.6 -3% | 75.6 17% | 72.2 12% |
| sRGB Coverage (%) | 95.6 | 99.2 4% | 96.8 1% | 94.3 -1% | 99.8 4% | 98.5 3% |
| AdobeRGB 1998 Coverage (%) | 65.6 | 70.9 8% | 66.4 1% | 64.7 -1% | 75.1 14% | 73 11% |
| Response Times | 31% | -2% | -11% | 50% | 33% | |
| Response Time Grey 50% / Grey 80% * (ms) | 14.4 ? | 10.8 ? 25% | 14.4 ? -0% | 16.4 ? -14% | 5 ? 65% | 5.6 ? 61% |
| Response Time Black / White * (ms) | 10 ? | 6.4 ? 36% | 10.4 ? -4% | 10.8 ? -8% | 6.6 ? 34% | 9.6 ? 4% |
| PWM Frequency (Hz) | 24510 ? | |||||
| Screen | 8% | 2% | 27% | 6% | -21% | |
| Brightness middle (cd/m²) | 313 | 327 4% | 323 3% | 322 3% | 299.4 -4% | 328 5% |
| Brightness (cd/m²) | 297 | 305 3% | 300 1% | 308 4% | 299 1% | 329 11% |
| Brightness Distribution (%) | 88 | 87 -1% | 89 1% | 92 5% | 84 -5% | 78 -11% |
| Black Level * (cd/m²) | 0.27 | 0.32 -19% | 0.31 -15% | 0.18 33% | 0.31 -15% | 0.35 -30% |
| Contrast (:1) | 1159 | 1022 -12% | 1042 -10% | 1789 54% | 966 -17% | 937 -19% |
| Colorchecker dE 2000 * | 2.96 | 2.16 27% | 3.01 -2% | 1.53 48% | 1.82 39% | 4.74 -60% |
| Colorchecker dE 2000 max. * | 9.83 | 6.14 38% | 7.65 22% | 3.14 68% | 3.91 60% | 8.99 9% |
| Colorchecker dE 2000 calibrated * | 1.03 | 0.89 14% | 1 3% | 0.74 28% | 1.59 -54% | 2.12 -106% |
| Greyscale dE 2000 * | 4.9 | 3.7 24% | 3.8 22% | 1.9 61% | 2.7 45% | 6.8 -39% |
| Gamma | 2.187 101% | 2.24 98% | 2.154 102% | 2.144 103% | 2.18 101% | 2.2 100% |
| CCT | 7559 86% | 6799 96% | 7507 87% | 6809 95% | 6837 95% | 6446 101% |
| Color Space (Percent of AdobeRGB 1998) (%) | 66 | 71 8% | 66 0% | 65 -2% | 67.1 2% | 64.8 -2% |
| Color Space (Percent of sRGB) (%) | 89 | 93 4% | 90 1% | 87 -2% | 99.8 12% | 98.6 11% |
| Totalt genomsnitt (program/inställningar) | 15% /
11% | 0% /
2% | 5% /
17% | 23% /
12% | 7% /
-9% |
* ... mindre är bättre
Visa svarstider
| ↔ Svarstid svart till vitt | ||
|---|---|---|
| 10 ms ... stiga ↗ och falla ↘ kombinerat | ↗ 5.2 ms stiga | 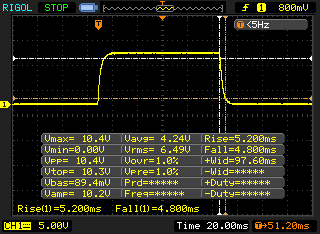 |
| ↘ 4.8 ms hösten | ||
| Skärmen visar bra svarsfrekvens i våra tester, men kan vara för långsam för konkurrenskraftiga spelare. I jämförelse sträcker sig alla testade enheter från 0.1 (minst) till 240 (maximalt) ms. » 27 % av alla enheter är bättre. Det betyder att den uppmätta svarstiden är bättre än genomsnittet av alla testade enheter (19.9 ms). | ||
| ↔ Svarstid 50 % grått till 80 % grått | ||
| 14.4 ms ... stiga ↗ och falla ↘ kombinerat | ↗ 7.6 ms stiga | 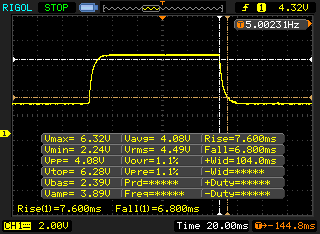 |
| ↘ 6.8 ms hösten | ||
| Skärmen visar bra svarsfrekvens i våra tester, men kan vara för långsam för konkurrenskraftiga spelare. I jämförelse sträcker sig alla testade enheter från 0.165 (minst) till 636 (maximalt) ms. » 28 % av alla enheter är bättre. Det betyder att den uppmätta svarstiden är bättre än genomsnittet av alla testade enheter (31.1 ms). | ||
Skärmflimmer / PWM (Puls-Width Modulation)
| Skärmflimmer / PWM upptäcktes inte | 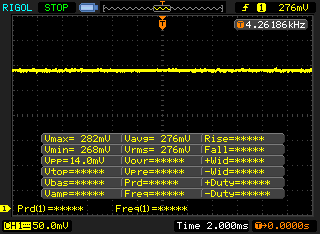 | ||
Som jämförelse: 52 % av alla testade enheter använder inte PWM för att dämpa skärmen. Om PWM upptäcktes mättes ett medelvärde av 7784 (minst: 5 - maximum: 343500) Hz. | |||
| Cinebench R15 | |
| CPU Single 64Bit | |
| Genomsnitt av klass Gaming (188.8 - 343, n=109, senaste 2 åren) | |
| Schenker XMG Neo 17 Comet Lake | |
| Schenker XMG Neo 17 Comet Lake (Overboost) | |
| Asus Strix G17 G712LWS | |
| Razer Blade Pro 17 RTX 2070 Max-Q 300 Hz | |
| MSI GS75 10SF-609US | |
| Genomsnitt Intel Core i7-10750H (184 - 213, n=45) | |
| Medion Erazer Beast X10 MD61804 | |
| Acer Predator Helios 300 PH317-54-75G8 | |
| Medion Erazer Beast X10 MD61804 (Office Mode (Eco)) | |
| CPU Multi 64Bit | |
| Genomsnitt av klass Gaming (1578 - 6271, n=109, senaste 2 åren) | |
| Schenker XMG Neo 17 Comet Lake (Overboost) | |
| MSI GS75 10SF-609US | |
| Razer Blade Pro 17 RTX 2070 Max-Q 300 Hz | |
| Schenker XMG Neo 17 Comet Lake | |
| Medion Erazer Beast X10 MD61804 | |
| Asus Strix G17 G712LWS | |
| Acer Predator Helios 300 PH317-54-75G8 | |
| Genomsnitt Intel Core i7-10750H (804 - 1418, n=50) | |
| Medion Erazer Beast X10 MD61804 (Office Mode (Eco)) | |
| Blender - v2.79 BMW27 CPU | |
| Medion Erazer Beast X10 MD61804 (Office Mode (Eco)) | |
| Genomsnitt Intel Core i7-10750H (322 - 587, n=43) | |
| Acer Predator Helios 300 PH317-54-75G8 | |
| Asus Strix G17 G712LWS | |
| Razer Blade Pro 17 RTX 2070 Max-Q 300 Hz | |
| Medion Erazer Beast X10 MD61804 | |
| Schenker XMG Neo 17 Comet Lake | |
| MSI GS75 10SF-609US | |
| Schenker XMG Neo 17 Comet Lake (Overboost) | |
| Genomsnitt av klass Gaming (80 - 330, n=107, senaste 2 åren) | |
| 7-Zip 18.03 | |
| 7z b 4 -mmt1 | |
| Genomsnitt av klass Gaming (4199 - 7436, n=108, senaste 2 åren) | |
| Schenker XMG Neo 17 Comet Lake | |
| Schenker XMG Neo 17 Comet Lake (Overboost) | |
| Razer Blade Pro 17 RTX 2070 Max-Q 300 Hz | |
| MSI GS75 10SF-609US | |
| Medion Erazer Beast X10 MD61804 | |
| Acer Predator Helios 300 PH317-54-75G8 | |
| Asus Strix G17 G712LWS | |
| Genomsnitt Intel Core i7-10750H (4504 - 5470, n=43) | |
| Medion Erazer Beast X10 MD61804 (Office Mode (Eco)) | |
| 7z b 4 | |
| Genomsnitt av klass Gaming (33491 - 148086, n=108, senaste 2 åren) | |
| Schenker XMG Neo 17 Comet Lake (Overboost) | |
| MSI GS75 10SF-609US | |
| Schenker XMG Neo 17 Comet Lake | |
| Medion Erazer Beast X10 MD61804 | |
| Asus Strix G17 G712LWS | |
| Genomsnitt Intel Core i7-10750H (26040 - 37345, n=43) | |
| Razer Blade Pro 17 RTX 2070 Max-Q 300 Hz | |
| Acer Predator Helios 300 PH317-54-75G8 | |
| Medion Erazer Beast X10 MD61804 (Office Mode (Eco)) | |
| Cinebench R20 | |
| CPU (Single Core) | |
| Genomsnitt av klass Gaming (442 - 895, n=109, senaste 2 åren) | |
| Schenker XMG Neo 17 Comet Lake | |
| Schenker XMG Neo 17 Comet Lake (Overboost) | |
| Asus Strix G17 G712LWS | |
| Razer Blade Pro 17 RTX 2070 Max-Q 300 Hz | |
| MSI GS75 10SF-609US | |
| Genomsnitt Intel Core i7-10750H (431 - 504, n=43) | |
| Acer Predator Helios 300 PH317-54-75G8 | |
| CPU (Multi Core) | |
| Genomsnitt av klass Gaming (4029 - 16108, n=109, senaste 2 åren) | |
| Schenker XMG Neo 17 Comet Lake (Overboost) | |
| MSI GS75 10SF-609US | |
| Razer Blade Pro 17 RTX 2070 Max-Q 300 Hz | |
| Schenker XMG Neo 17 Comet Lake | |
| Asus Strix G17 G712LWS | |
| Acer Predator Helios 300 PH317-54-75G8 | |
| Genomsnitt Intel Core i7-10750H (1749 - 3325, n=43) | |
| Geekbench 5.5 | |
| Single-Core | |
| Genomsnitt av klass Gaming (986 - 2474, n=108, senaste 2 åren) | |
| Schenker XMG Neo 17 Comet Lake | |
| Medion Erazer Beast X10 MD61804 | |
| Schenker XMG Neo 17 Comet Lake (Overboost) | |
| Asus Strix G17 G712LWS | |
| Razer Blade Pro 17 RTX 2070 Max-Q 300 Hz | |
| MSI GS75 10SF-609US | |
| Genomsnitt Intel Core i7-10750H (1114 - 1333, n=43) | |
| Acer Predator Helios 300 PH317-54-75G8 | |
| Multi-Core | |
| Genomsnitt av klass Gaming (6460 - 27010, n=108, senaste 2 åren) | |
| Schenker XMG Neo 17 Comet Lake (Overboost) | |
| MSI GS75 10SF-609US | |
| Razer Blade Pro 17 RTX 2070 Max-Q 300 Hz | |
| Schenker XMG Neo 17 Comet Lake | |
| Medion Erazer Beast X10 MD61804 | |
| Asus Strix G17 G712LWS | |
| Acer Predator Helios 300 PH317-54-75G8 | |
| Genomsnitt Intel Core i7-10750H (4443 - 6674, n=43) | |
| HWBOT x265 Benchmark v2.2 - 4k Preset | |
| Genomsnitt av klass Gaming (11.5 - 44.3, n=108, senaste 2 åren) | |
| Schenker XMG Neo 17 Comet Lake (Overboost) | |
| MSI GS75 10SF-609US | |
| Schenker XMG Neo 17 Comet Lake | |
| Medion Erazer Beast X10 MD61804 | |
| Asus Strix G17 G712LWS | |
| Acer Predator Helios 300 PH317-54-75G8 | |
| Genomsnitt Intel Core i7-10750H (5.54 - 11.6, n=43) | |
| Medion Erazer Beast X10 MD61804 (Office Mode (Eco)) | |
| LibreOffice - 20 Documents To PDF | |
| Razer Blade Pro 17 RTX 2070 Max-Q 300 Hz | |
| Asus Strix G17 G712LWS | |
| Acer Predator Helios 300 PH317-54-75G8 | |
| Genomsnitt Intel Core i7-10750H (43.1 - 99.2, n=43) | |
| Schenker XMG Neo 17 Comet Lake | |
| Medion Erazer Beast X10 MD61804 (Office Mode (Eco)) | |
| MSI GS75 10SF-609US | |
| Genomsnitt av klass Gaming (19 - 88.8, n=108, senaste 2 åren) | |
| Medion Erazer Beast X10 MD61804 | |
| Schenker XMG Neo 17 Comet Lake (Overboost) | |
| R Benchmark 2.5 - Overall mean | |
| Acer Predator Helios 300 PH317-54-75G8 | |
| Medion Erazer Beast X10 MD61804 (Office Mode (Eco)) | |
| Genomsnitt Intel Core i7-10750H (0.578 - 0.708, n=42) | |
| Asus Strix G17 G712LWS | |
| Medion Erazer Beast X10 MD61804 | |
| MSI GS75 10SF-609US | |
| Schenker XMG Neo 17 Comet Lake (Overboost) | |
| Schenker XMG Neo 17 Comet Lake | |
| Genomsnitt av klass Gaming (0.3439 - 0.759, n=109, senaste 2 åren) | |
* ... mindre är bättre
| PCMark 8 Home Score Accelerated v2 | 4350 poäng | |
| PCMark 8 Creative Score Accelerated v2 | 4277 poäng | |
| PCMark 8 Work Score Accelerated v2 | 5792 poäng | |
| PCMark 10 Score | 5581 poäng | |
Hjälp | ||
| PCMark 10 - Score | |
| Genomsnitt av klass Gaming (5828 - 11574, n=94, senaste 2 åren) | |
| MSI GS75 10SF-609US | |
| Razer Blade Pro 17 RTX 2070 Max-Q 300 Hz | |
| Genomsnitt Intel Core i7-10750H, NVIDIA GeForce RTX 2070 Super Max-Q (5581 - 6093, n=2) | |
| Schenker XMG Neo 17 Comet Lake | |
| Medion Erazer Beast X10 MD61804 | |
| Asus Strix G17 G712LWS | |
| Acer Predator Helios 300 PH317-54-75G8 | |
| PCMark 8 | |
| Home Score Accelerated v2 | |
| Genomsnitt av klass Gaming (n=1senaste 2 åren) | |
| Razer Blade Pro 17 RTX 2070 Max-Q 300 Hz | |
| MSI GS75 10SF-609US | |
| Asus Strix G17 G712LWS | |
| Schenker XMG Neo 17 Comet Lake | |
| Medion Erazer Beast X10 MD61804 | |
| Genomsnitt Intel Core i7-10750H, NVIDIA GeForce RTX 2070 Super Max-Q (n=1) | |
| Acer Predator Helios 300 PH317-54-75G8 | |
| Work Score Accelerated v2 | |
| Razer Blade Pro 17 RTX 2070 Max-Q 300 Hz | |
| MSI GS75 10SF-609US | |
| Asus Strix G17 G712LWS | |
| Acer Predator Helios 300 PH317-54-75G8 | |
| Schenker XMG Neo 17 Comet Lake | |
| Medion Erazer Beast X10 MD61804 | |
| Genomsnitt Intel Core i7-10750H, NVIDIA GeForce RTX 2070 Super Max-Q (n=1) | |
| Genomsnitt av klass Gaming (n=1senaste 2 åren) | |
| DPC Latencies / LatencyMon - interrupt to process latency (max), Web, Youtube, Prime95 | |
| Asus Strix G17 G712LWS | |
| Razer Blade Pro 17 RTX 2070 Max-Q 300 Hz | |
| Medion Erazer Beast X10 MD61804 | |
| Acer Predator Helios 300 PH317-54-75G8 | |
| Schenker XMG Neo 17 Comet Lake | |
| MSI GS75 10SF-609US | |
* ... mindre är bättre

| Medion Erazer Beast X10 MD61804 Samsung PM981a MZVLB1T0HBLR | Schenker XMG Neo 17 Comet Lake Samsung SSD 970 EVO Plus 1TB | Asus Strix G17 G712LWS Intel SSD 660p 1TB SSDPEKNW010T8 | Acer Predator Helios 300 PH317-54-75G8 WDC PC SN730 SDBQNTY-1T00 | MSI GS75 10SF-609US WDC PC SN730 SDBPNTY-512G | Razer Blade Pro 17 RTX 2070 Max-Q 300 Hz Lite-On CA5-8D512 | Genomsnitt Samsung PM981a MZVLB1T0HBLR | |
|---|---|---|---|---|---|---|---|
| CrystalDiskMark 5.2 / 6 | 35% | 0% | 24% | 32% | 21% | 18% | |
| Write 4K (MB/s) | 151 | 158.6 5% | 141.1 -7% | 141.9 -6% | 177.9 18% | 119 -21% | 139.7 ? -7% |
| Read 4K (MB/s) | 49.29 | 53.6 9% | 60.9 24% | 48.75 -1% | 47.42 -4% | 51.9 5% | 49.9 ? 1% |
| Write Seq (MB/s) | 1109 | 2671 141% | 1681 52% | 2734 147% | 2707 144% | 2258 104% | 2036 ? 84% |
| Read Seq (MB/s) | 1049 | 2130 103% | 1602 53% | 1921 83% | 2369 126% | 2283 118% | 2014 ? 92% |
| Write 4K Q32T1 (MB/s) | 494.4 | 525 6% | 406.6 -18% | 422.6 -15% | 427.8 -13% | 491 -1% | 461 ? -7% |
| Read 4K Q32T1 (MB/s) | 569 | 609 7% | 470.2 -17% | 509 -11% | 543 -5% | 540 -5% | 499 ? -12% |
| Write Seq Q32T1 (MB/s) | 3017 | 3308 10% | 1759 -42% | 3055 1% | 2703 -10% | 2253 -25% | 2903 ? -4% |
| Read Seq Q32T1 (MB/s) | 3542 | 3557 0% | 1932 -45% | 3257 -8% | 3387 -4% | 3172 -10% | 3479 ? -2% |
| AS SSD | 5% | -46% | -6% | -39% | -82% | -10% | |
| Seq Read (MB/s) | 2470 | 2882 17% | 1778 -28% | 2828 14% | 2327 -6% | 2019 -18% | 2553 ? 3% |
| Seq Write (MB/s) | 2473 | 2764 12% | 1478 -40% | 2677 8% | 2479 0% | 1314 -47% | 2084 ? -16% |
| 4K Read (MB/s) | 50.2 | 55.9 11% | 49.76 -1% | 39.94 -20% | 45.46 -9% | 46.61 -7% | 53.1 ? 6% |
| 4K Write (MB/s) | 124.4 | 129.4 4% | 117.9 -5% | 100.9 -19% | 157.4 27% | 90.2 -27% | 131.2 ? 5% |
| 4K-64 Read (MB/s) | 1711 | 1793 5% | 591 -65% | 1562 -9% | 1050 -39% | 665 -61% | 1477 ? -14% |
| 4K-64 Write (MB/s) | 1848 | 2140 16% | 875 -53% | 1867 1% | 938 -49% | 813 -56% | 1805 ? -2% |
| Access Time Read * (ms) | 0.039 | 0.054 -38% | 0.082 -110% | 0.076 -95% | 0.058 -49% | 0.04983 ? -28% | |
| Access Time Write * (ms) | 0.029 | 0.03 -3% | 0.041 -41% | 0.037 -28% | 0.071 -145% | 0.167 -476% | 0.04222 ? -46% |
| Score Read (Points) | 2008 | 2137 6% | 818 -59% | 1885 -6% | 1328 -34% | 913 -55% | 1786 ? -11% |
| Score Write (Points) | 2220 | 2546 15% | 1140 -49% | 2236 1% | 1343 -40% | 1034 -53% | 2144 ? -3% |
| Score Total (Points) | 5257 | 5774 10% | 2377 -55% | 5076 -3% | 3366 -36% | 2392 -54% | 4826 ? -8% |
| Totalt genomsnitt (program/inställningar) | 20% /
18% | -23% /
-27% | 9% /
7% | -4% /
-9% | -31% /
-39% | 4% /
2% |
* ... mindre är bättre
DiskSpd Read Loop, Queue Depth 8


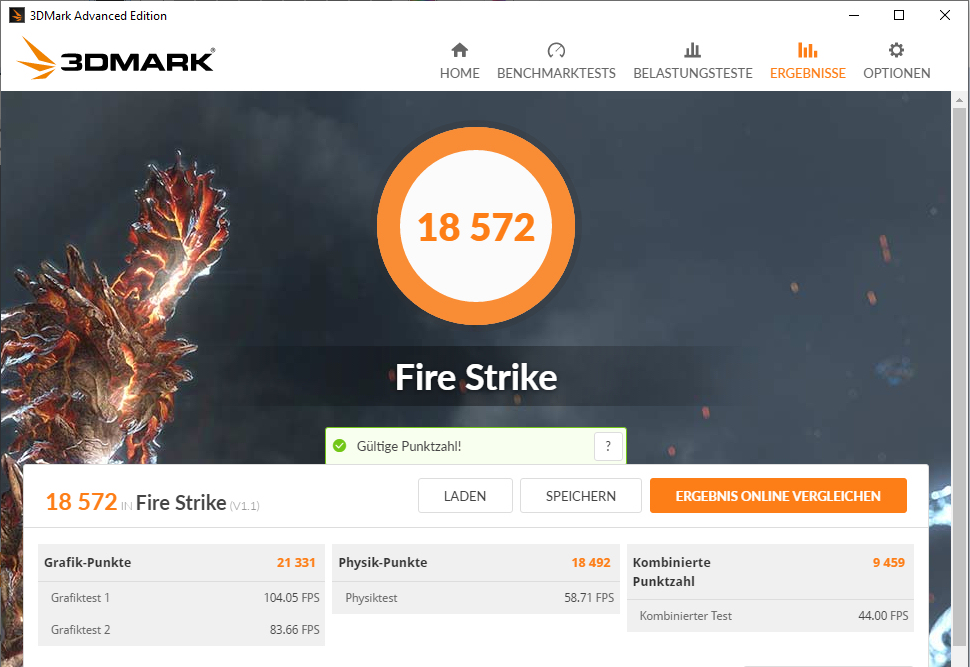


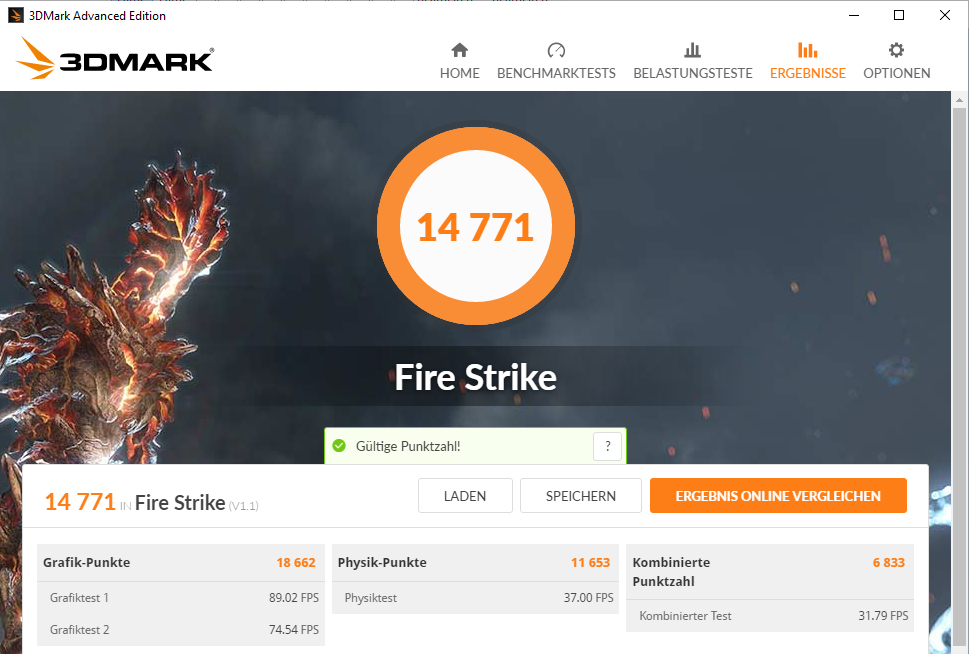
| 3DMark 11 Performance | 21735 poäng | |
| 3DMark Cloud Gate Standard Score | 40152 poäng | |
| 3DMark Fire Strike Score | 18534 poäng | |
| 3DMark Time Spy Score | 7736 poäng | |
Hjälp | ||
| 3DMark 11 - 1280x720 Performance GPU | |
| Genomsnitt av klass Gaming (21841 - 80022, n=106, senaste 2 åren) | |
| Asus Strix G17 G712LWS | |
| Schenker XMG Neo 17 Comet Lake | |
| Razer Blade Pro 17 RTX 2070 Max-Q 300 Hz | |
| Medion Erazer Beast X10 MD61804 | |
| Genomsnitt NVIDIA GeForce RTX 2070 Super Max-Q (24244 - 28900, n=10) | |
| MSI GS75 10SF-609US | |
| Acer Predator Helios 300 PH317-54-75G8 | |
| The Witcher 3 - 1920x1080 Ultra Graphics & Postprocessing (HBAO+) | |
| Genomsnitt av klass Gaming (95 - 240, n=8, senaste 2 åren) | |
| Medion Erazer Beast X10 MD61804 | |
| Schenker XMG Neo 17 Comet Lake | |
| Asus Strix G17 G712LWS | |
| Razer Blade Pro 17 RTX 2070 Max-Q 300 Hz | |
| Genomsnitt NVIDIA GeForce RTX 2070 Super Max-Q (62.7 - 92.5, n=10) | |
| Acer Predator Helios 300 PH317-54-75G8 | |
| MSI GS75 10SF-609US | |
| Horizon Zero Dawn - 1920x1080 Ultimate Quality | |
| Schenker XMG Neo 17 Comet Lake | |
| Medion Erazer Beast X10 MD61804 | |
| Genomsnitt NVIDIA GeForce RTX 2070 Super Max-Q (n=1) | |
| Asus Strix G17 G712LWS | |
| Acer Predator Helios 300 PH317-54-75G8 | |
| Serious Sam 4 - 1920x1080 Ultra (DX12) AA:2xMS | |
| Schenker XMG Neo 17 Comet Lake | |
| Asus Strix G17 G712LWS | |
| Medion Erazer Beast X10 MD61804 | |
| Genomsnitt NVIDIA GeForce RTX 2070 Super Max-Q (n=1) | |
| Acer Predator Helios 300 PH317-54-75G8 | |
| Watch Dogs Legion - 1920x1080 Ultra Preset (DX12) | |
| Schenker XMG Neo 17 Comet Lake | |
| Medion Erazer Beast X10 MD61804 | |
| Genomsnitt NVIDIA GeForce RTX 2070 Super Max-Q (n=1) | |
| Dirt 5 - 1920x1080 Ultra High Preset | |
| Medion Erazer Beast X10 MD61804 | |
| Genomsnitt NVIDIA GeForce RTX 2070 Super Max-Q (n=1) | |
| Schenker XMG Neo 17 Comet Lake | |
| Doom Eternal - 1920x1080 Ultra Preset | |
| Asus Strix G17 G712LWS | |
| Schenker XMG Neo 17 Comet Lake | |
| Medion Erazer Beast X10 MD61804 | |
| Genomsnitt NVIDIA GeForce RTX 2070 Super Max-Q (130.2 - 146.4, n=4) | |
| Acer Predator Helios 300 PH317-54-75G8 | |
| låg | med. | hög | ultra | |
|---|---|---|---|---|
| The Witcher 3 (2015) | 326.3 | 254.1 | 163.1 | 92.5 |
| Total War: Three Kingdoms (2019) | 260.9 | 141.2 | 97.5 | 68.7 |
| Doom Eternal (2020) | 229.6 | 164.1 | 149.4 | 146.4 |
| Horizon Zero Dawn (2020) | 145 | 120 | 107 | 93 |
| Serious Sam 4 (2020) | 127 | 87.7 | 81.9 | 67.7 |
| Watch Dogs Legion (2020) | 100 | 96 | 84 | 59 |
| Dirt 5 (2020) | 160 | 95.6 | 78.2 | 65.1 |
| Assassin´s Creed Valhalla (2020) | 118 | 81 | 70 | 60 |
| Call of Duty Black Ops Cold War (2020) | 163.7 | 93.6 | 86.2 | 77.4 |
| Yakuza Like a Dragon (2020) | 135.7 | 102.6 | 101.6 | 86.1 |
Ljudnivå
| Låg belastning |
| 26 / 29 / 35 dB(A) |
| Hög belastning |
| 52 / 55 dB(A) |
 | ||
30 dB tyst 40 dB(A) hörbar 50 dB(A) högt ljud |
||
min: | ||
| Medion Erazer Beast X10 MD61804 i7-10750H, GeForce RTX 2070 Super Max-Q | Schenker XMG Neo 17 Comet Lake i7-10875H, GeForce RTX 2070 Super Mobile | Asus Strix G17 G712LWS i7-10750H, GeForce RTX 2070 Super Mobile | Acer Predator Helios 300 PH317-54-75G8 i7-10750H, GeForce RTX 2060 Mobile | MSI GS75 10SF-609US i7-10875H, GeForce RTX 2070 Max-Q | Razer Blade Pro 17 RTX 2070 Max-Q 300 Hz i7-10875H, GeForce RTX 2070 Max-Q | Genomsnitt NVIDIA GeForce RTX 2070 Super Max-Q | Genomsnitt av klass Gaming | |
|---|---|---|---|---|---|---|---|---|
| Noise | 3% | -5% | 3% | -4% | 2% | -5% | 8% | |
| av / miljö * (dB) | 25 | 25 -0% | 25 -0% | 24 4% | 26.2 -5% | 28.2 -13% | 27.9 ? -12% | 24.1 ? 4% |
| Idle Minimum * (dB) | 26 | 26 -0% | 32 -23% | 25 4% | 31.2 -20% | 28.2 -8% | 30.8 ? -18% | 25.8 ? 1% |
| Idle Average * (dB) | 29 | 30 -3% | 34 -17% | 30 -3% | 31.4 -8% | 28.2 3% | 32.1 ? -11% | 27.4 ? 6% |
| Idle Maximum * (dB) | 35 | 33 6% | 37 -6% | 37 -6% | 34 3% | 30.5 13% | 35.8 ? -2% | 29.9 ? 15% |
| Load Average * (dB) | 52 | 50 4% | 51 2% | 48 8% | 49.5 5% | 42.2 19% | 47.5 ? 9% | 43 ? 17% |
| Witcher 3 ultra * (dB) | 53 | 50 6% | 50 6% | 50 6% | 50.6 5% | 53 -0% | ||
| Load Maximum * (dB) | 55 | 52 5% | 53 4% | 52 5% | 60.7 -10% | 55.5 -1% | 52.3 ? 5% | 54 ? 2% |
* ... mindre är bättre
(-) Den maximala temperaturen på ovansidan är 51 °C / 124 F, jämfört med genomsnittet av 40.4 °C / 105 F , allt från 21.2 till 68.8 °C för klassen Gaming.
(-) Botten värms upp till maximalt 56 °C / 133 F, jämfört med genomsnittet av 43.2 °C / 110 F
(+) Vid tomgångsbruk är medeltemperaturen för ovansidan 28.8 °C / 84 F, jämfört med enhetsgenomsnittet på 33.9 °C / ### class_avg_f### F.
(-) När du spelar The Witcher 3 är medeltemperaturen för ovansidan 43 °C / 109 F, jämfört med enhetsgenomsnittet på 33.9 °C / ## #class_avg_f### F.
(-) Handledsstöden och pekplattan kan bli väldigt varma vid beröring med maximalt 40 °C / 104 F.
(-) Medeltemperaturen för handledsstödsområdet på liknande enheter var 28.8 °C / 83.8 F (-11.2 °C / -20.2 F).
| Medion Erazer Beast X10 MD61804 i7-10750H, GeForce RTX 2070 Super Max-Q | Schenker XMG Neo 17 Comet Lake i7-10875H, GeForce RTX 2070 Super Mobile | Asus Strix G17 G712LWS i7-10750H, GeForce RTX 2070 Super Mobile | Acer Predator Helios 300 PH317-54-75G8 i7-10750H, GeForce RTX 2060 Mobile | MSI GS75 10SF-609US i7-10875H, GeForce RTX 2070 Max-Q | Razer Blade Pro 17 RTX 2070 Max-Q 300 Hz i7-10875H, GeForce RTX 2070 Max-Q | Genomsnitt NVIDIA GeForce RTX 2070 Super Max-Q | Genomsnitt av klass Gaming | |
|---|---|---|---|---|---|---|---|---|
| Heat | 1% | -0% | -3% | 1% | -6% | -1% | 3% | |
| Maximum Upper Side * (°C) | 51 | 48 6% | 53 -4% | 53 -4% | 49.8 2% | 40.8 20% | 49.5 ? 3% | 45.2 ? 11% |
| Maximum Bottom * (°C) | 56 | 54 4% | 56 -0% | 59 -5% | 55.6 1% | 48.4 14% | 58.4 ? -4% | 47.9 ? 14% |
| Idle Upper Side * (°C) | 31 | 30 3% | 29 6% | 29 6% | 28.2 9% | 36.8 -19% | 29.3 ? 5% | 31.1 ? -0% |
| Idle Bottom * (°C) | 30 | 33 -10% | 31 -3% | 32 -7% | 32.2 -7% | 41.2 -37% | 31.9 ? -6% | 34.2 ? -14% |
* ... mindre är bättre
Medion Erazer Beast X10 MD61804 ljudanalys
(±) | högtalarljudstyrkan är genomsnittlig men bra (76 dB)
Bas 100 - 315 Hz
(-) | nästan ingen bas - i genomsnitt 21.7% lägre än medianen
(±) | linjäriteten för basen är genomsnittlig (13.7% delta till föregående frekvens)
Mellan 400 - 2000 Hz
(+) | balanserad mellan - endast 2.6% från medianen
(+) | mids är linjära (4.7% delta till föregående frekvens)
Högsta 2 - 16 kHz
(+) | balanserade toppar - endast 3.1% från medianen
(+) | toppar är linjära (5.7% delta till föregående frekvens)
Totalt 100 - 16 000 Hz
(±) | linjäriteten för det totala ljudet är genomsnittlig (17.1% skillnad mot median)
Jämfört med samma klass
» 46% av alla testade enheter i den här klassen var bättre, 12% liknande, 43% sämre
» Den bästa hade ett delta på 6%, genomsnittet var 18%, sämst var 132%
Jämfört med alla testade enheter
» 31% av alla testade enheter var bättre, 8% liknande, 61% sämre
» Den bästa hade ett delta på 4%, genomsnittet var 24%, sämst var 134%
| Låg belastning | |
| Hög belastning |
|
Förklaring:
min: | |
| Medion Erazer Beast X10 MD61804 i7-10750H, GeForce RTX 2070 Super Max-Q | Schenker XMG Neo 17 Comet Lake i7-10875H, GeForce RTX 2070 Super Mobile | Asus Strix G17 G712LWS i7-10750H, GeForce RTX 2070 Super Mobile | Acer Predator Helios 300 PH317-54-75G8 i7-10750H, GeForce RTX 2060 Mobile | MSI GS75 10SF-609US i7-10875H, GeForce RTX 2070 Max-Q | Razer Blade Pro 17 RTX 2070 Max-Q 300 Hz i7-10875H, GeForce RTX 2070 Max-Q | Genomsnitt NVIDIA GeForce RTX 2070 Super Max-Q | Genomsnitt av klass Gaming | |
|---|---|---|---|---|---|---|---|---|
| Power Consumption | 2% | 16% | 37% | 2% | 2% | 9% | 16% | |
| Idle Minimum * (Watt) | 19 | 17 11% | 10 47% | 6 68% | 19.2 -1% | 19.6 -3% | 15.3 ? 19% | 13.2 ? 31% |
| Idle Average * (Watt) | 22 | 20 9% | 14 36% | 11 50% | 22.4 -2% | 21.7 1% | 19.3 ? 12% | 18.9 ? 14% |
| Idle Maximum * (Watt) | 30 | 29 3% | 25 17% | 19 37% | 34.7 -16% | 36.1 -20% | 30.5 ? -2% | 24.3 ? 19% |
| Load Average * (Watt) | 118 | 121 -3% | 134 -14% | 96 19% | 106.7 10% | 115.6 2% | 108.5 ? 8% | 108.3 ? 8% |
| Witcher 3 ultra * (Watt) | 176 | 199 -13% | 186 -6% | 144 18% | 160.5 9% | 157 11% | ||
| Load Maximum * (Watt) | 274 | 258 6% | 230 16% | 197 28% | 248.7 9% | 219.9 20% | 246 ? 10% | 254 ? 7% |
* ... mindre är bättre
| Medion Erazer Beast X10 MD61804 i7-10750H, GeForce RTX 2070 Super Max-Q, 91.2 Wh | Schenker XMG Neo 17 Comet Lake i7-10875H, GeForce RTX 2070 Super Mobile, 62.32 Wh | Asus Strix G17 G712LWS i7-10750H, GeForce RTX 2070 Super Mobile, 66 Wh | Acer Predator Helios 300 PH317-54-75G8 i7-10750H, GeForce RTX 2060 Mobile, 59 Wh | MSI GS75 10SF-609US i7-10875H, GeForce RTX 2070 Max-Q, 80.25 Wh | Razer Blade Pro 17 RTX 2070 Max-Q 300 Hz i7-10875H, GeForce RTX 2070 Max-Q, 70 Wh | Genomsnitt av klass Gaming | |
|---|---|---|---|---|---|---|---|
| Batteridrifttid | -44% | -19% | -19% | 17% | -28% | -12% | |
| Reader / Idle (h) | 11.4 | 9.1 -20% | 8.2 -28% | 8.6 -25% | 8.71 ? -24% | ||
| H.264 (h) | 8.5 | 7.1 -16% | 5.9 -31% | 8.26 ? -3% | |||
| WiFi v1.3 (h) | 6.8 | 3.8 -44% | 5.5 -19% | 5.1 -25% | 4.9 -28% | 4.9 -28% | 7.04 ? 4% |
| Load (h) | 2 | 1.6 -20% | 2.2 10% | 4.1 105% | 1.47 ? -26% |
För
Emot
Läs den fullständiga versionen av den här recensionen på engelska här.
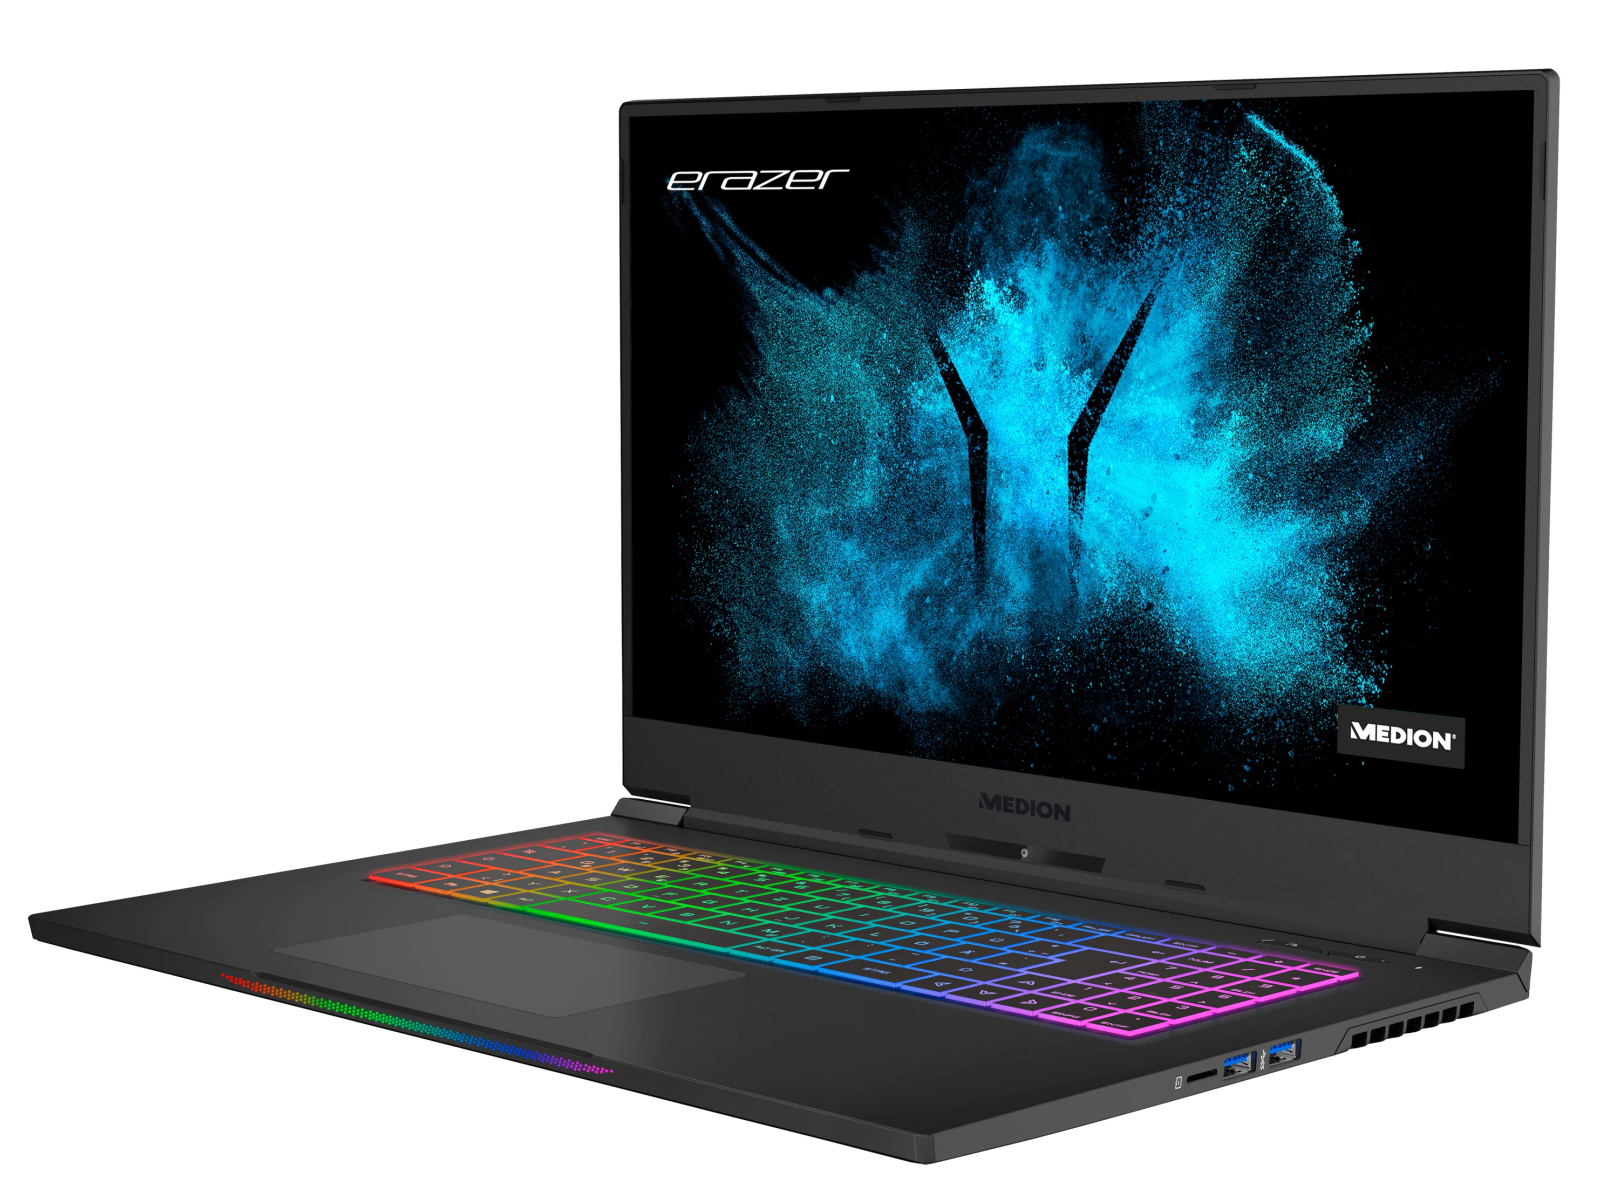
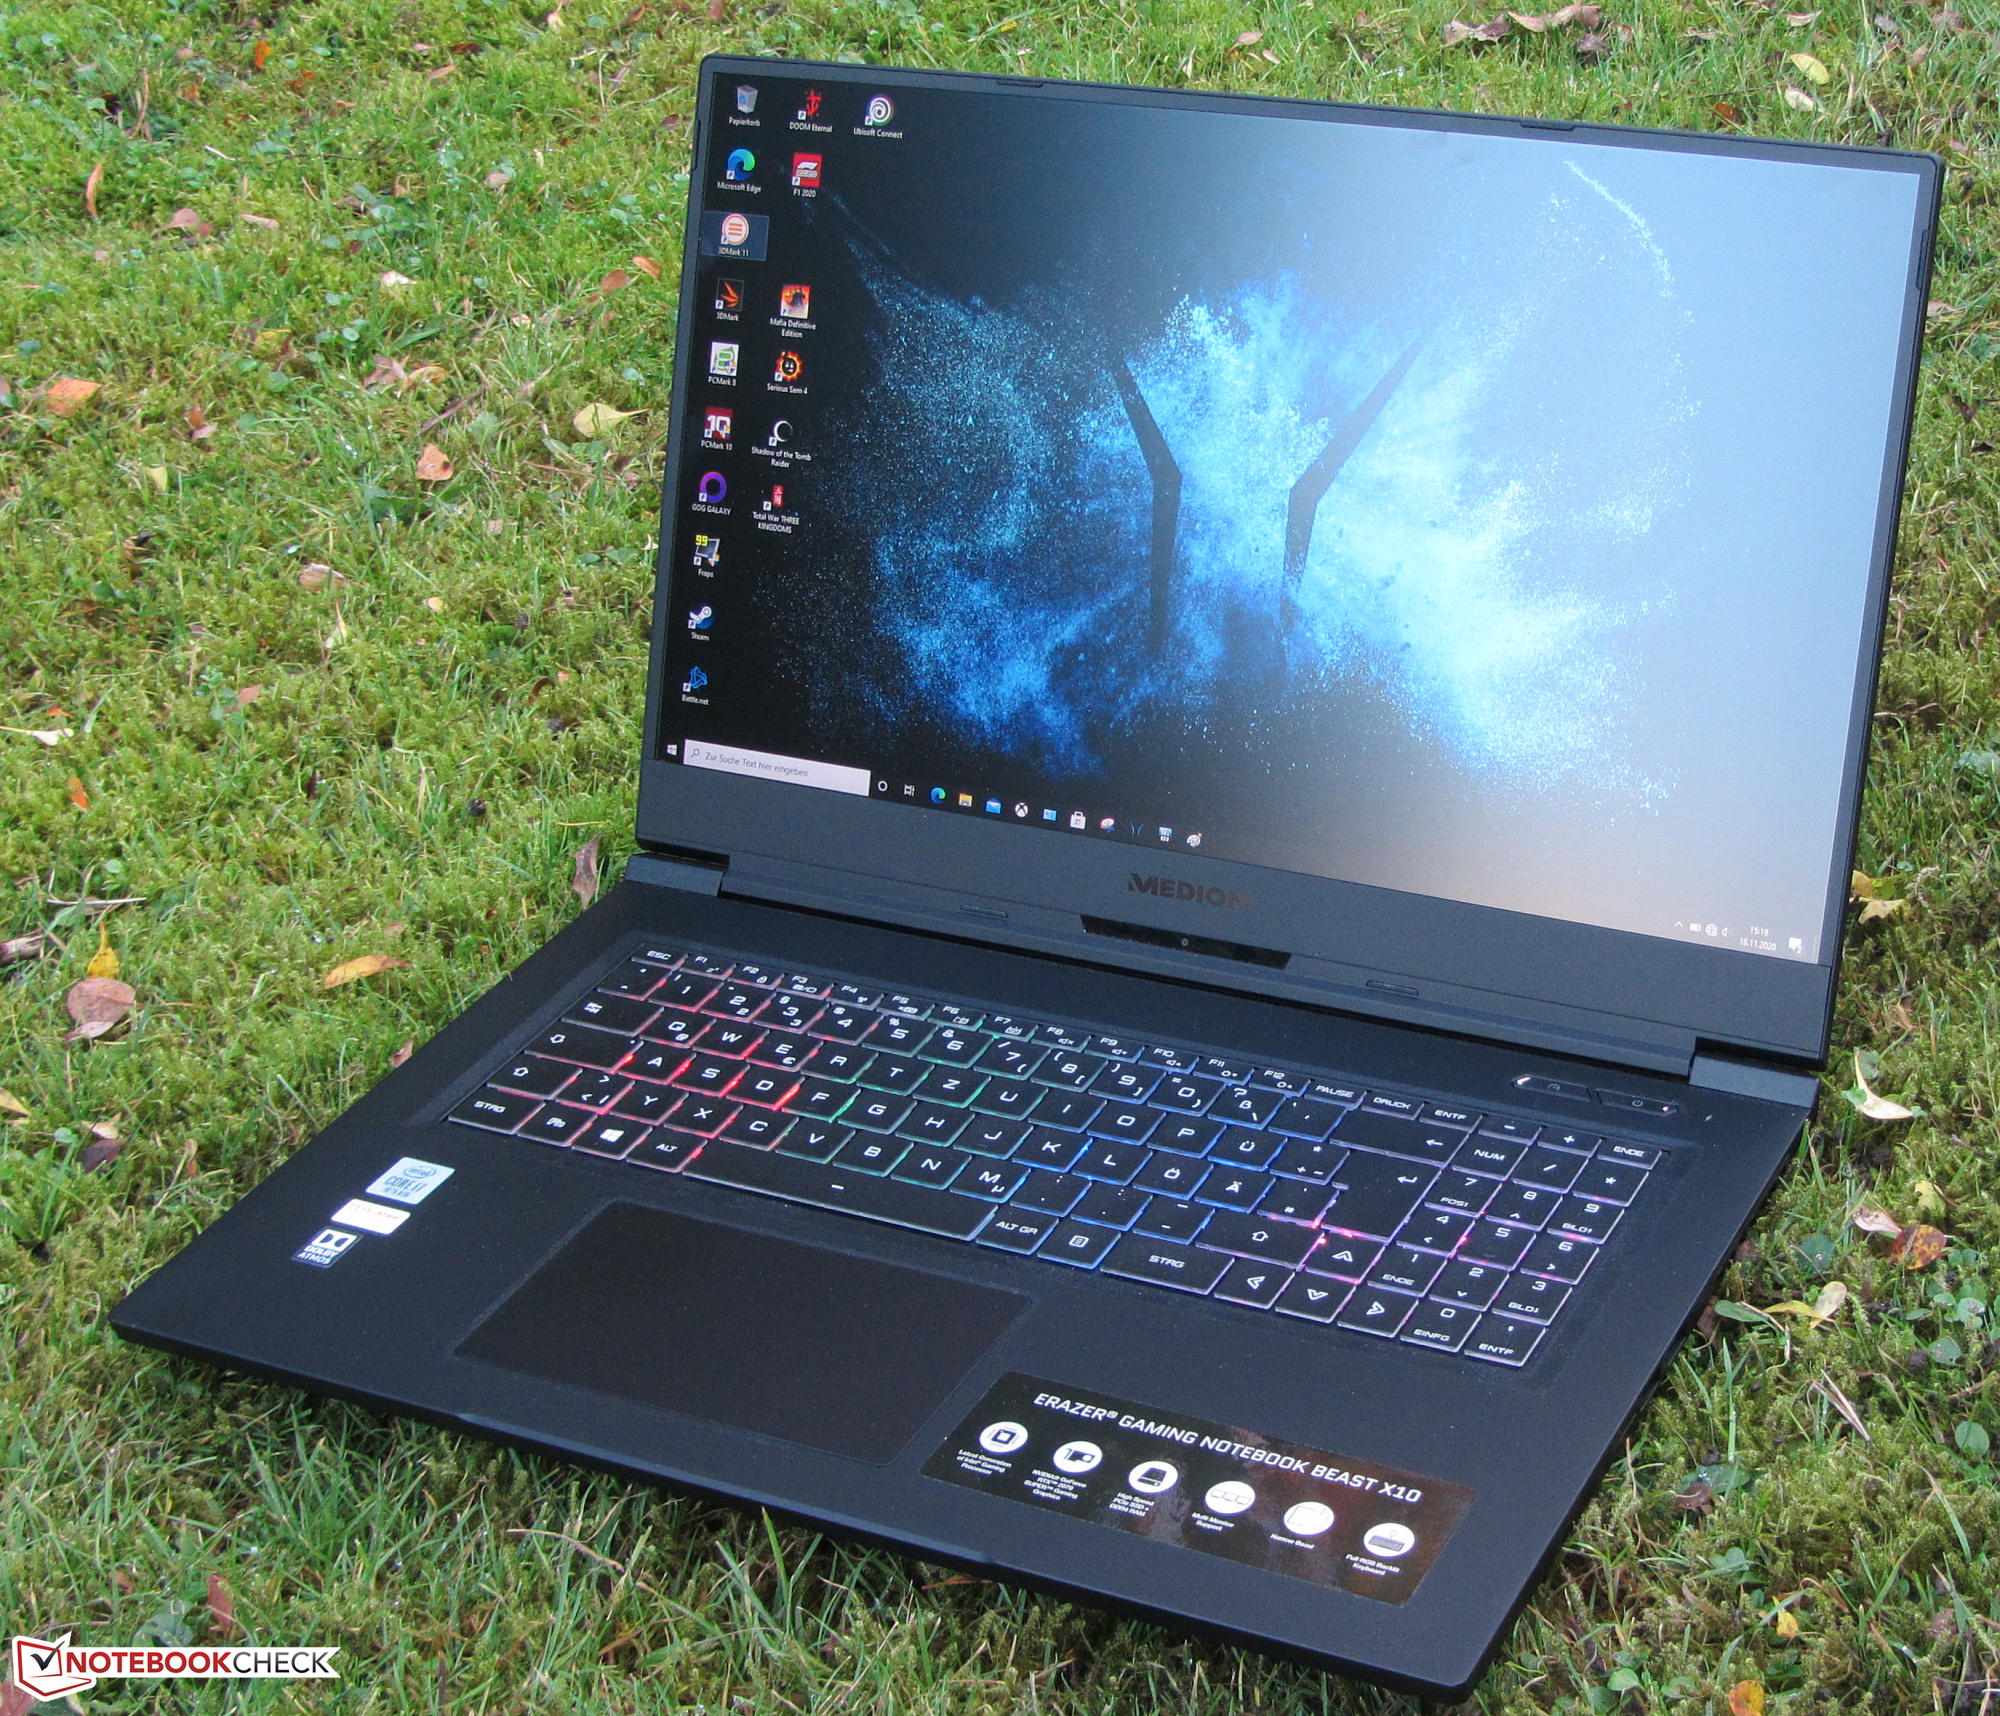
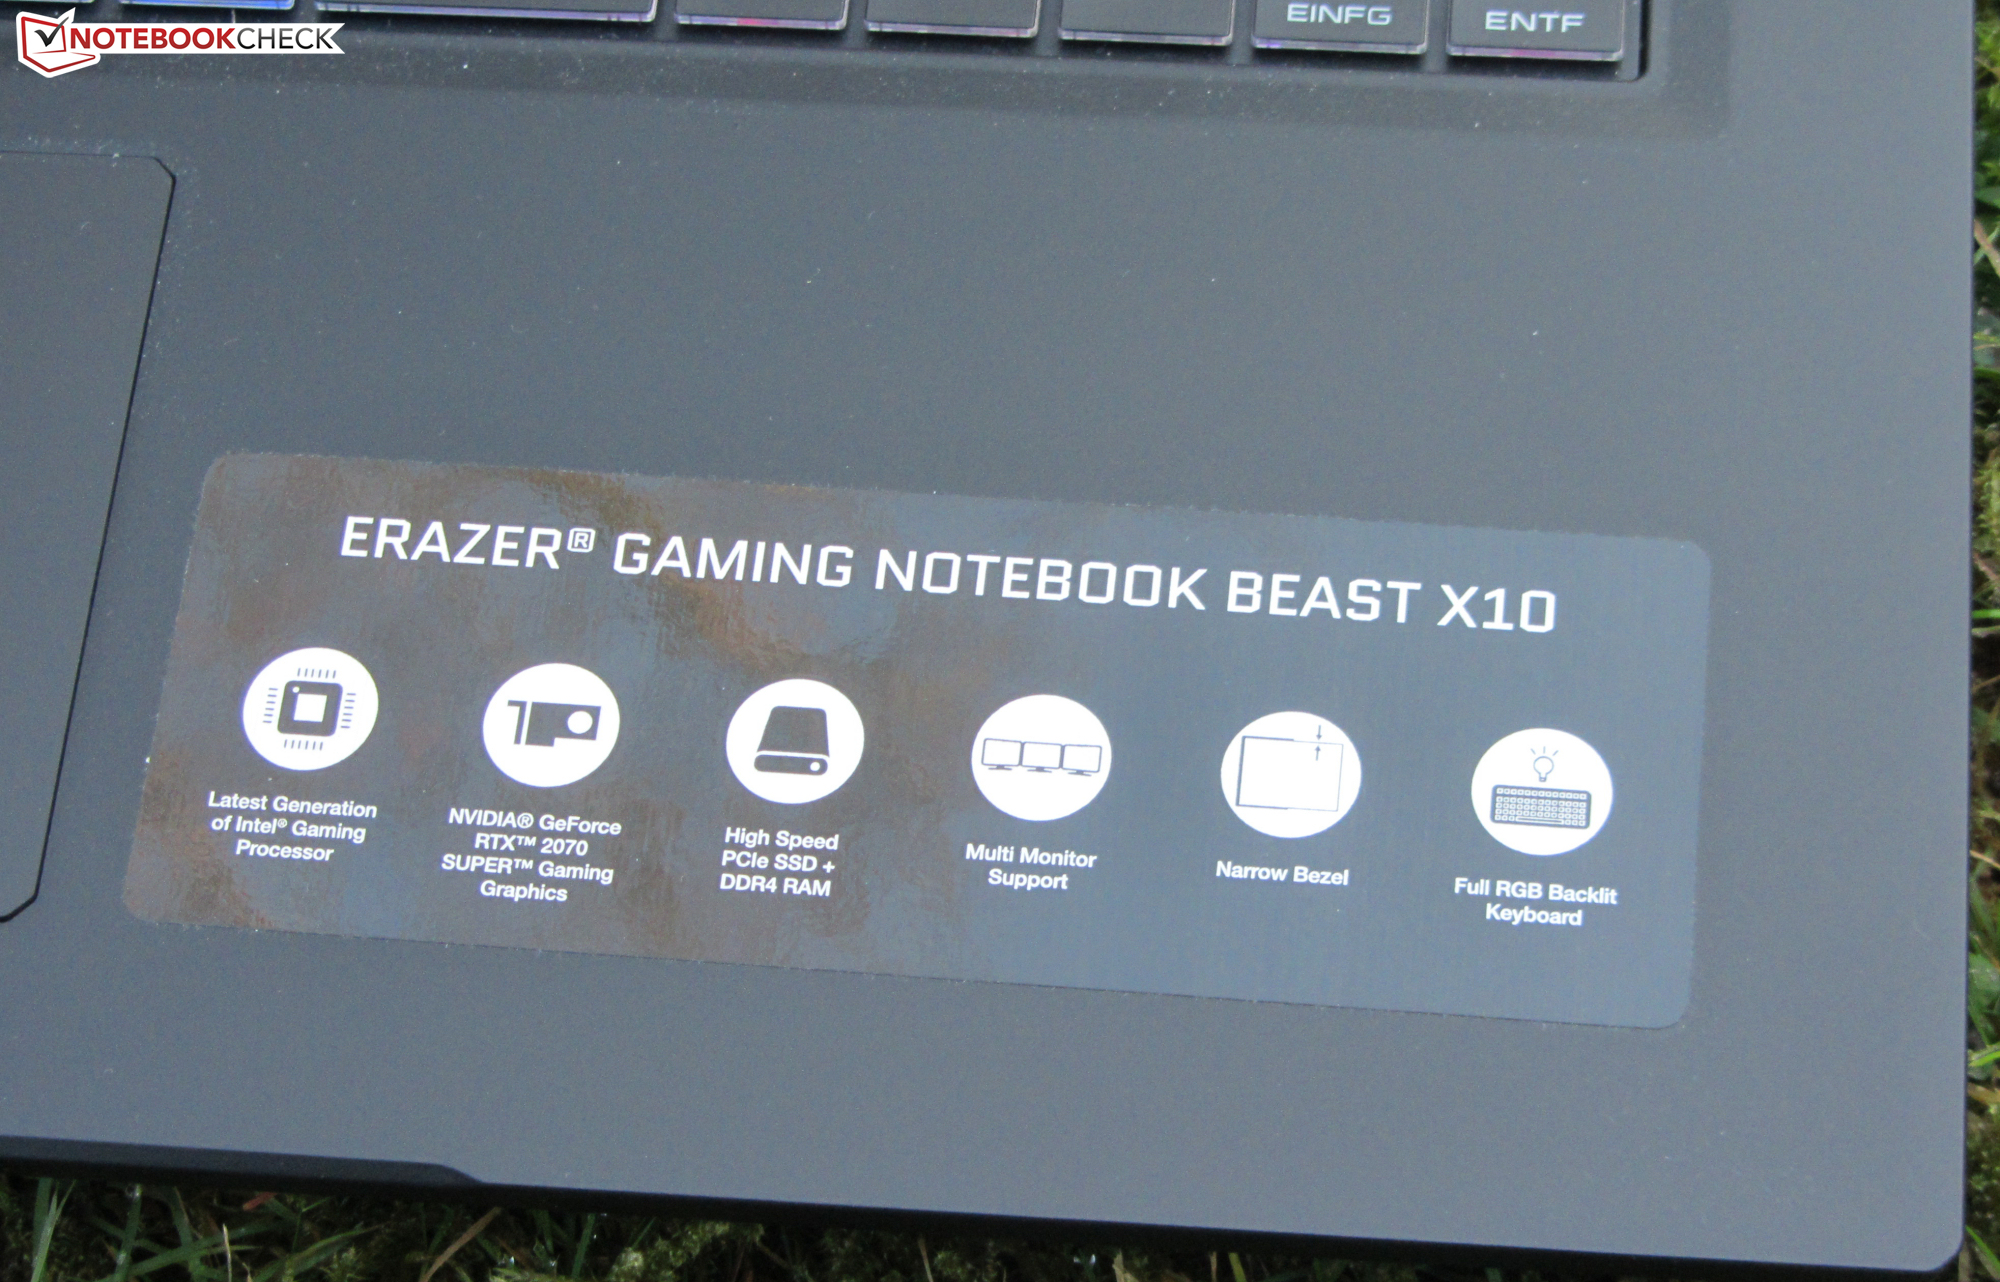
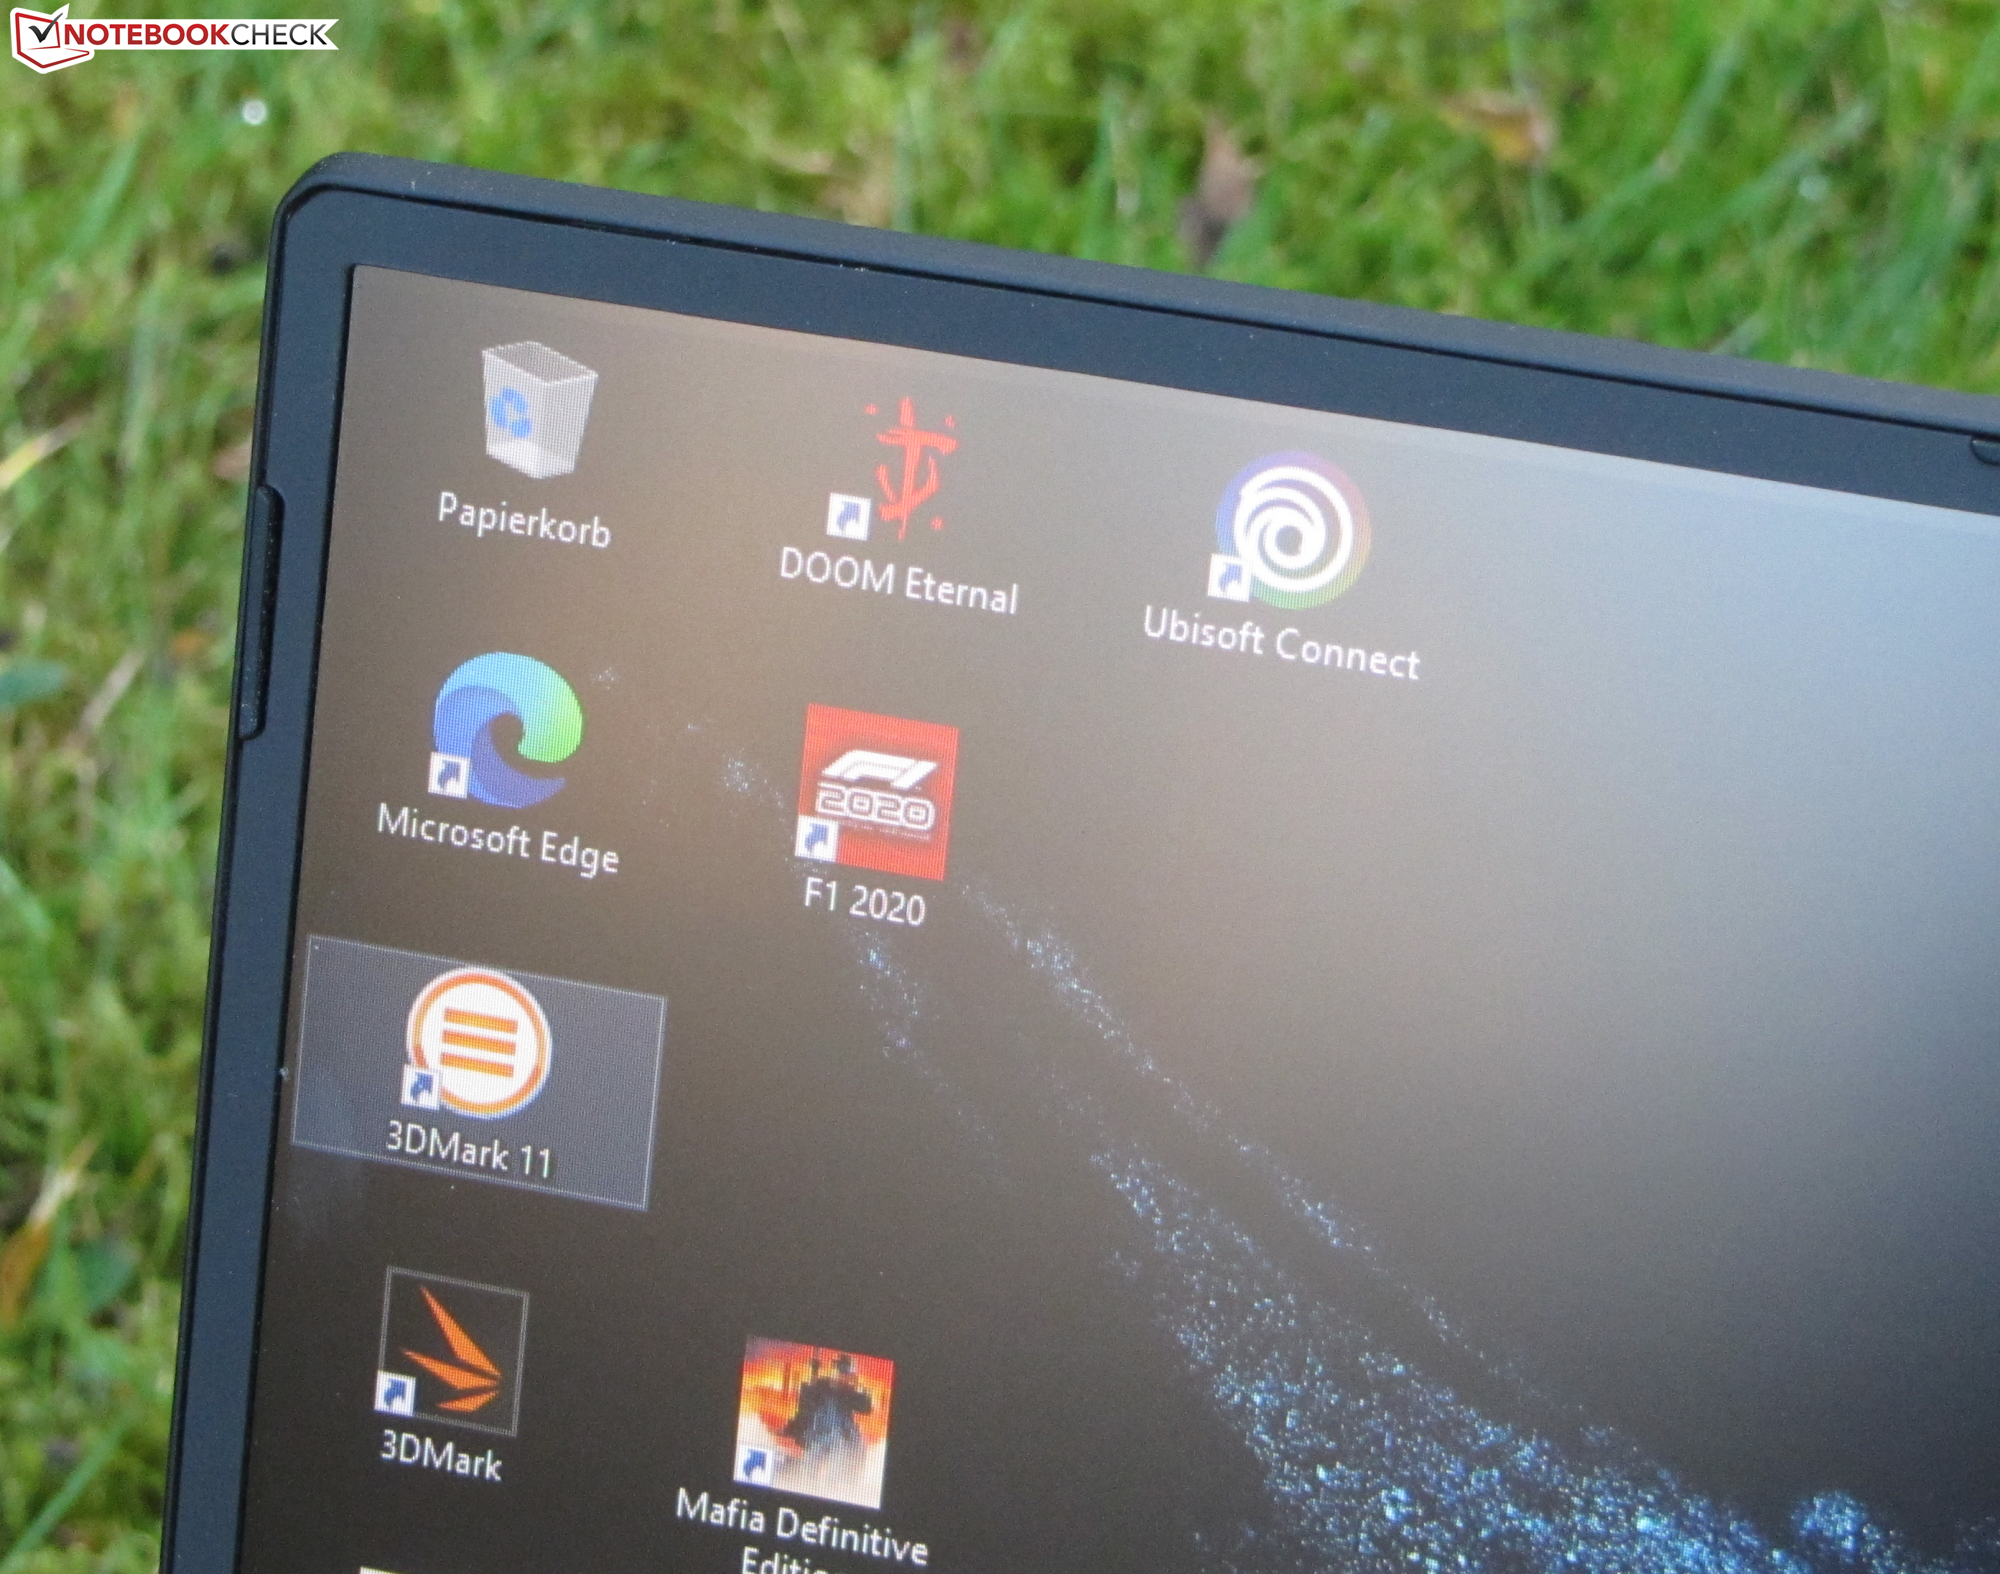
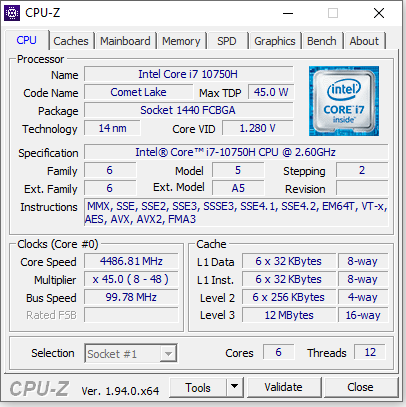
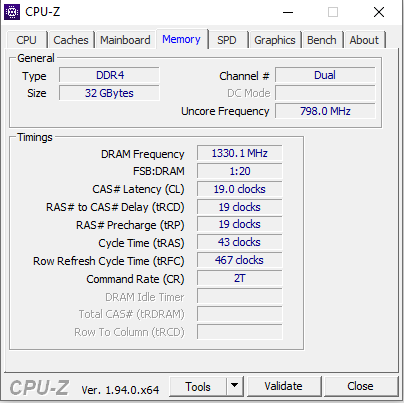
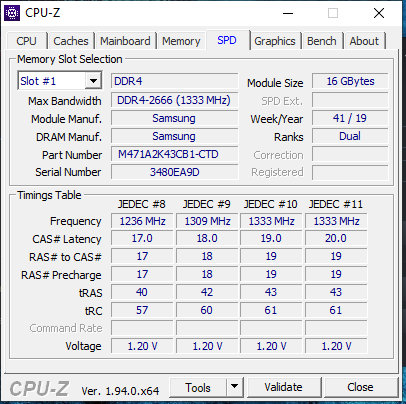
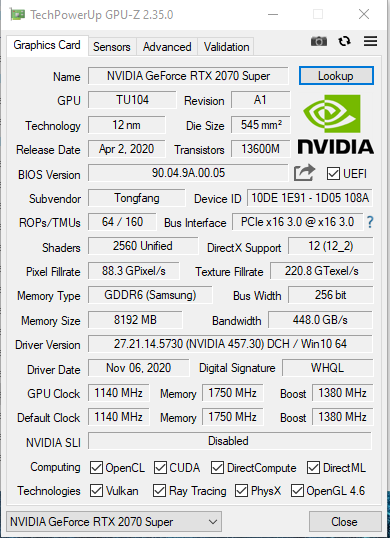
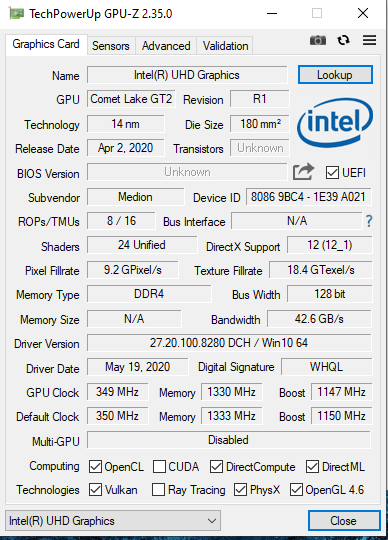
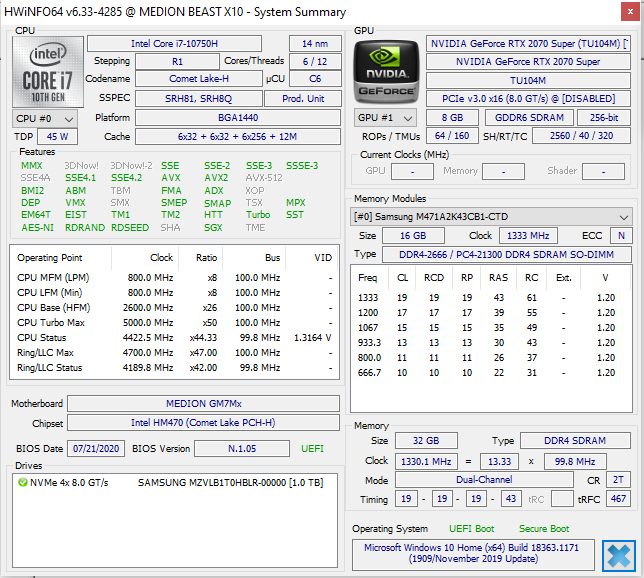
Medions spellaptop på 17.3 tum visar alla de senaste spelen smidigt på sin skärm tack vare en Core i7-10750H processor och en GeForce RTX 2070 Super GPU. Hårdvaran kommer med 32 GB RAM (dubbla kanaler, max. 64 GB) samt en NVMe SSD-enhet på 1 TB.
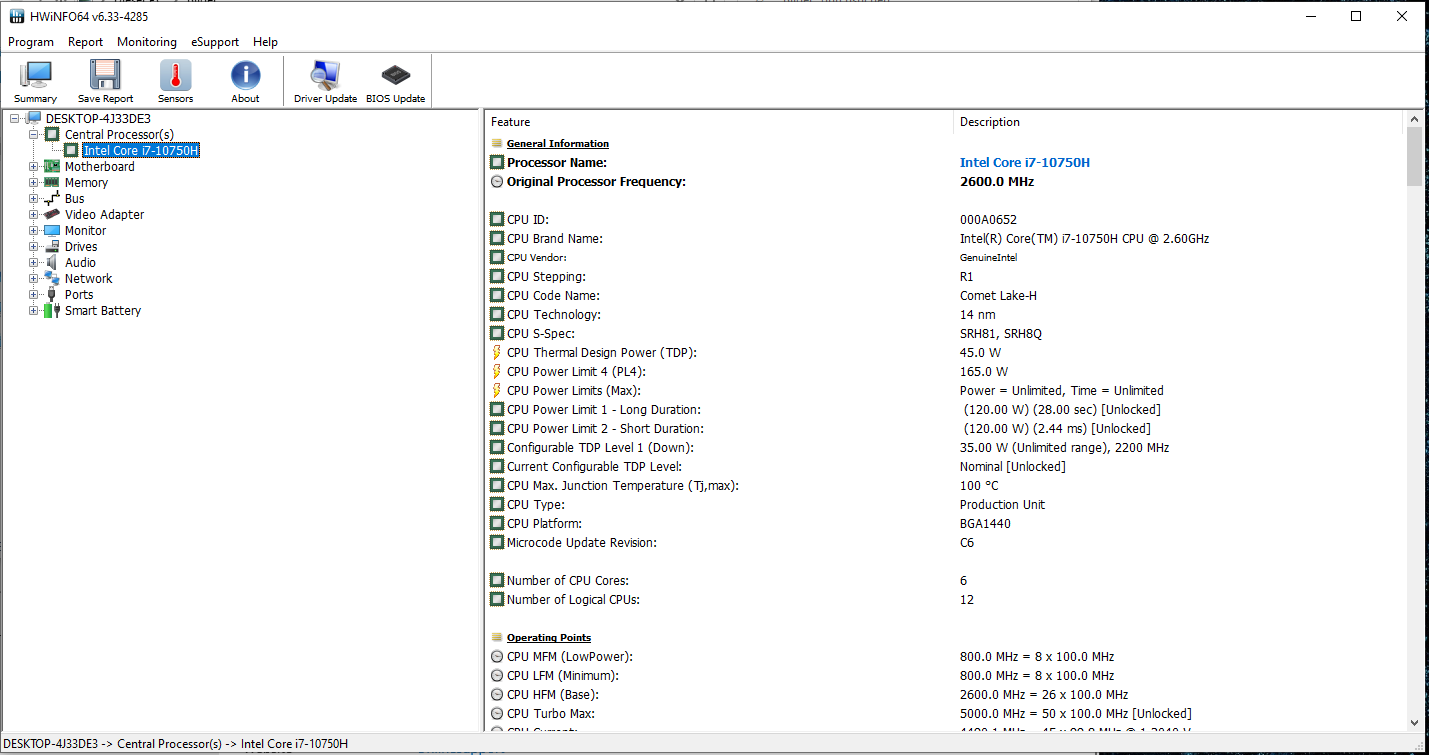
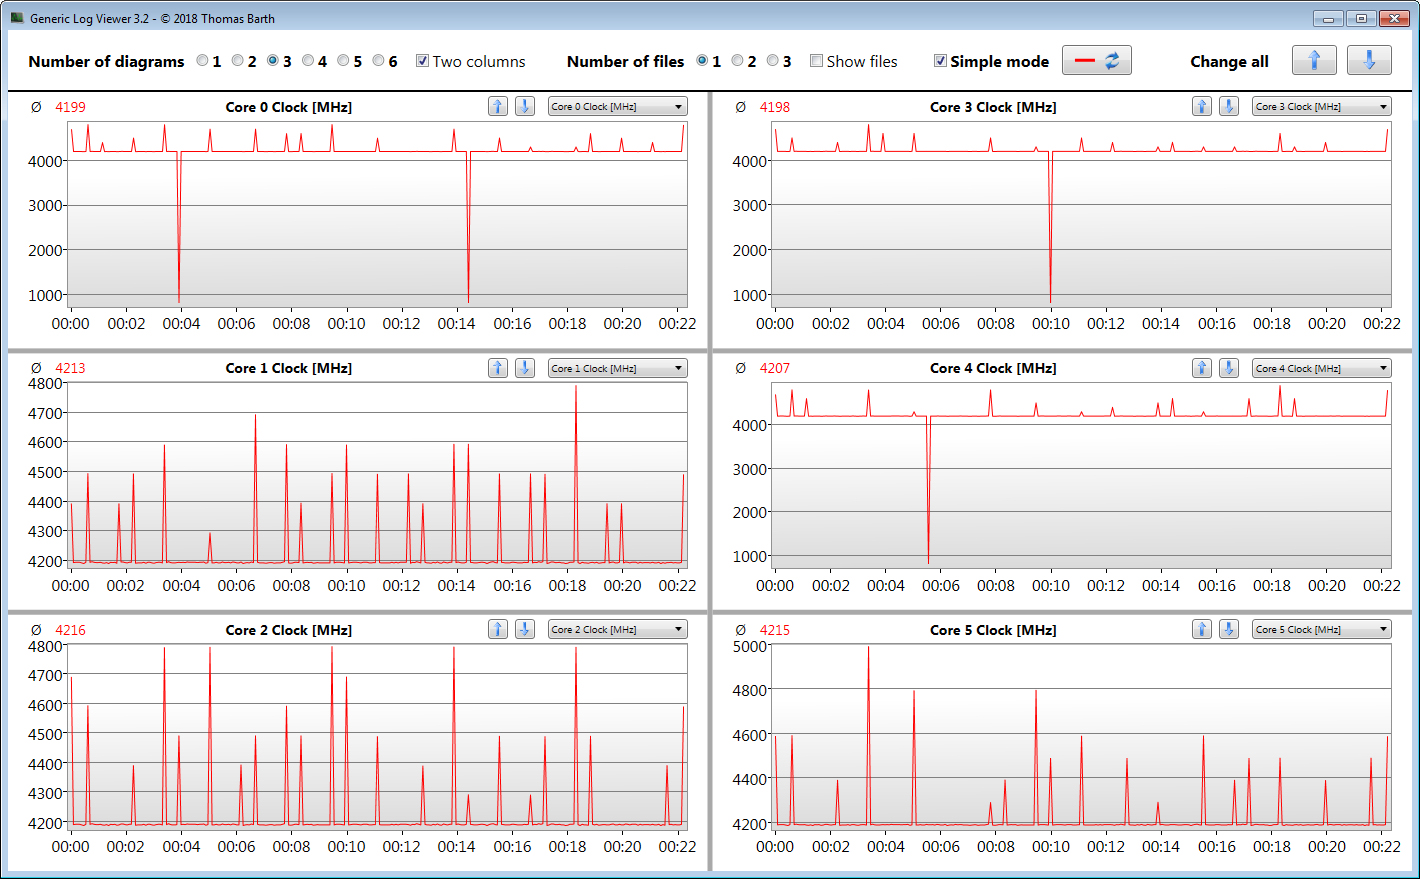
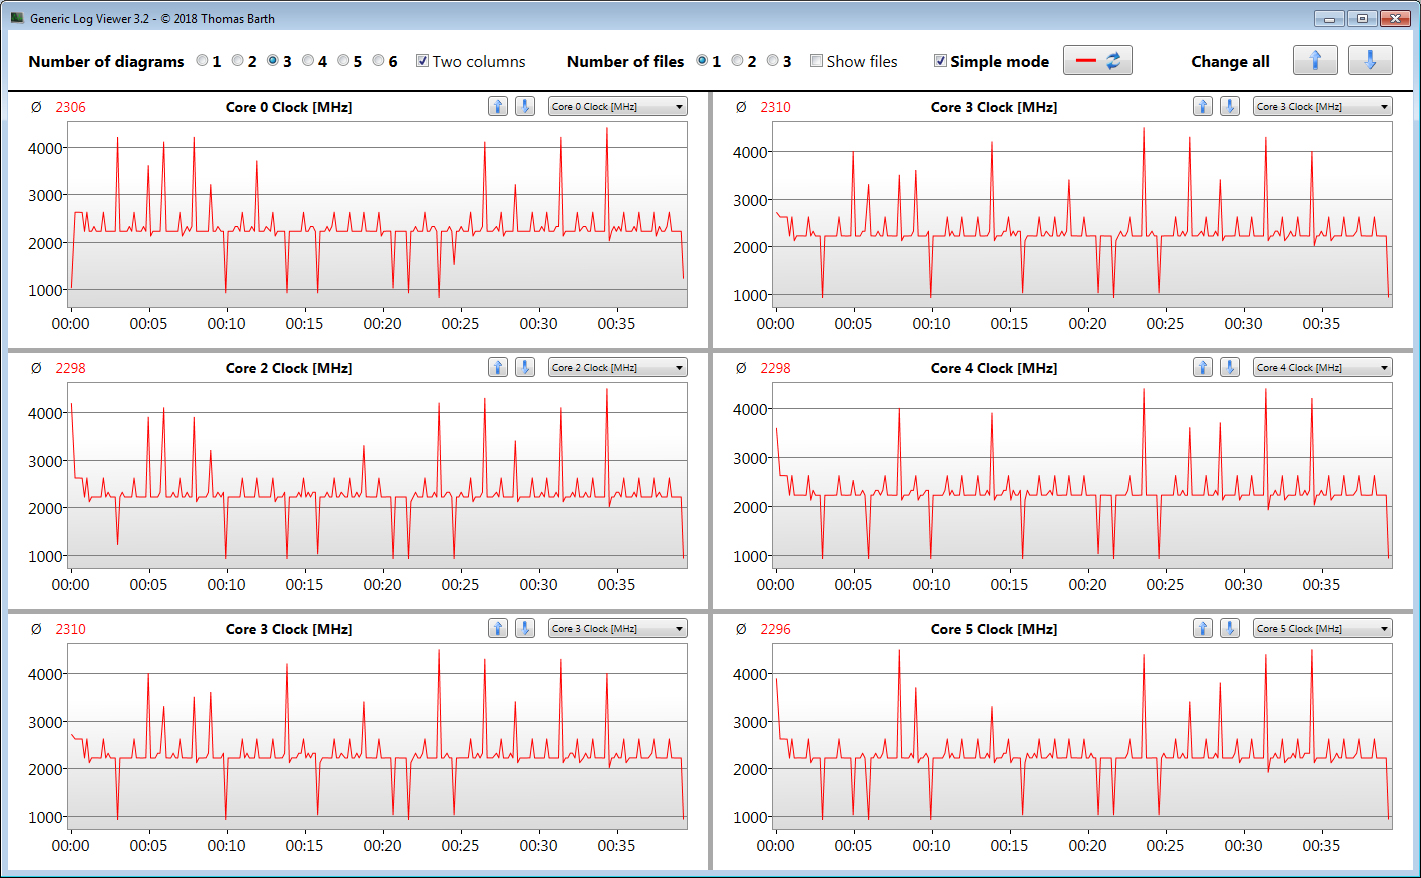
Ljudnivån, som är ganska hög i spelläget, går att sänka till en nivå som är bekväm vid användning till vardags. Ett "Eko"-läge sänker processorns prestanda och således också ljudutvecklingen. Core i7-processorn hamnar då på i princip samma nivå som en ULV CPU - tillräckligt för kontors- och internetapplikationer.
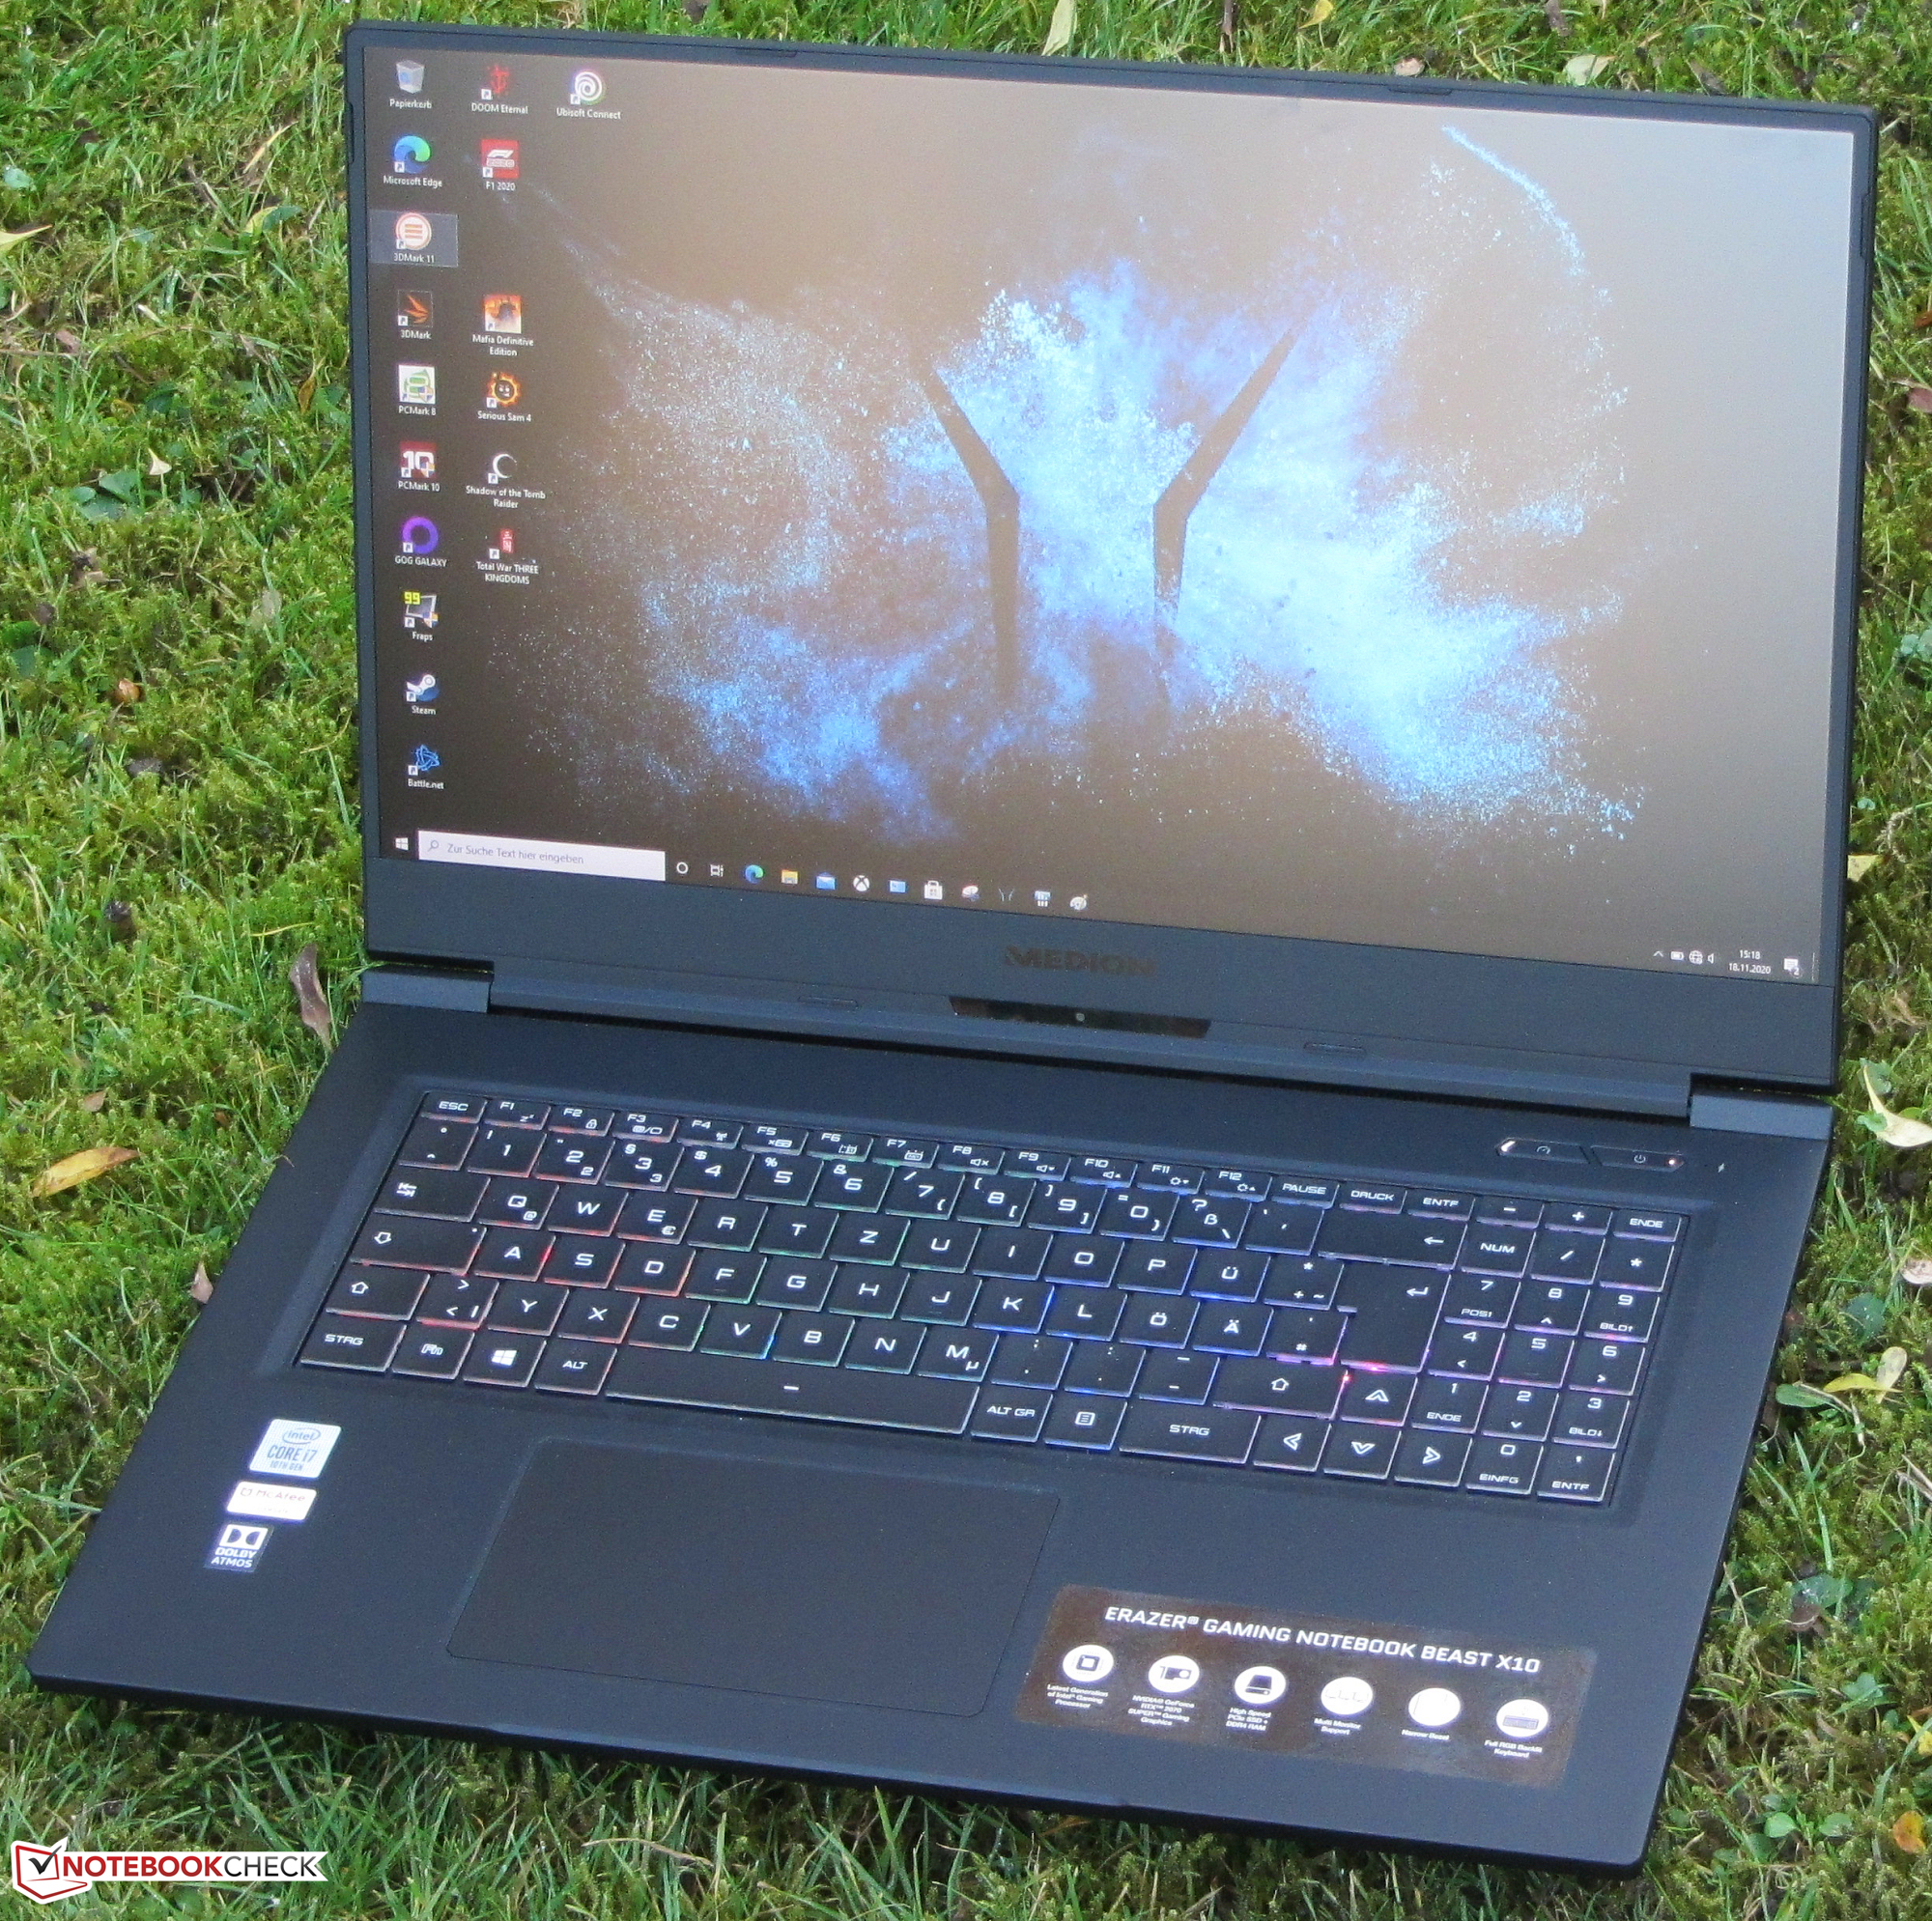
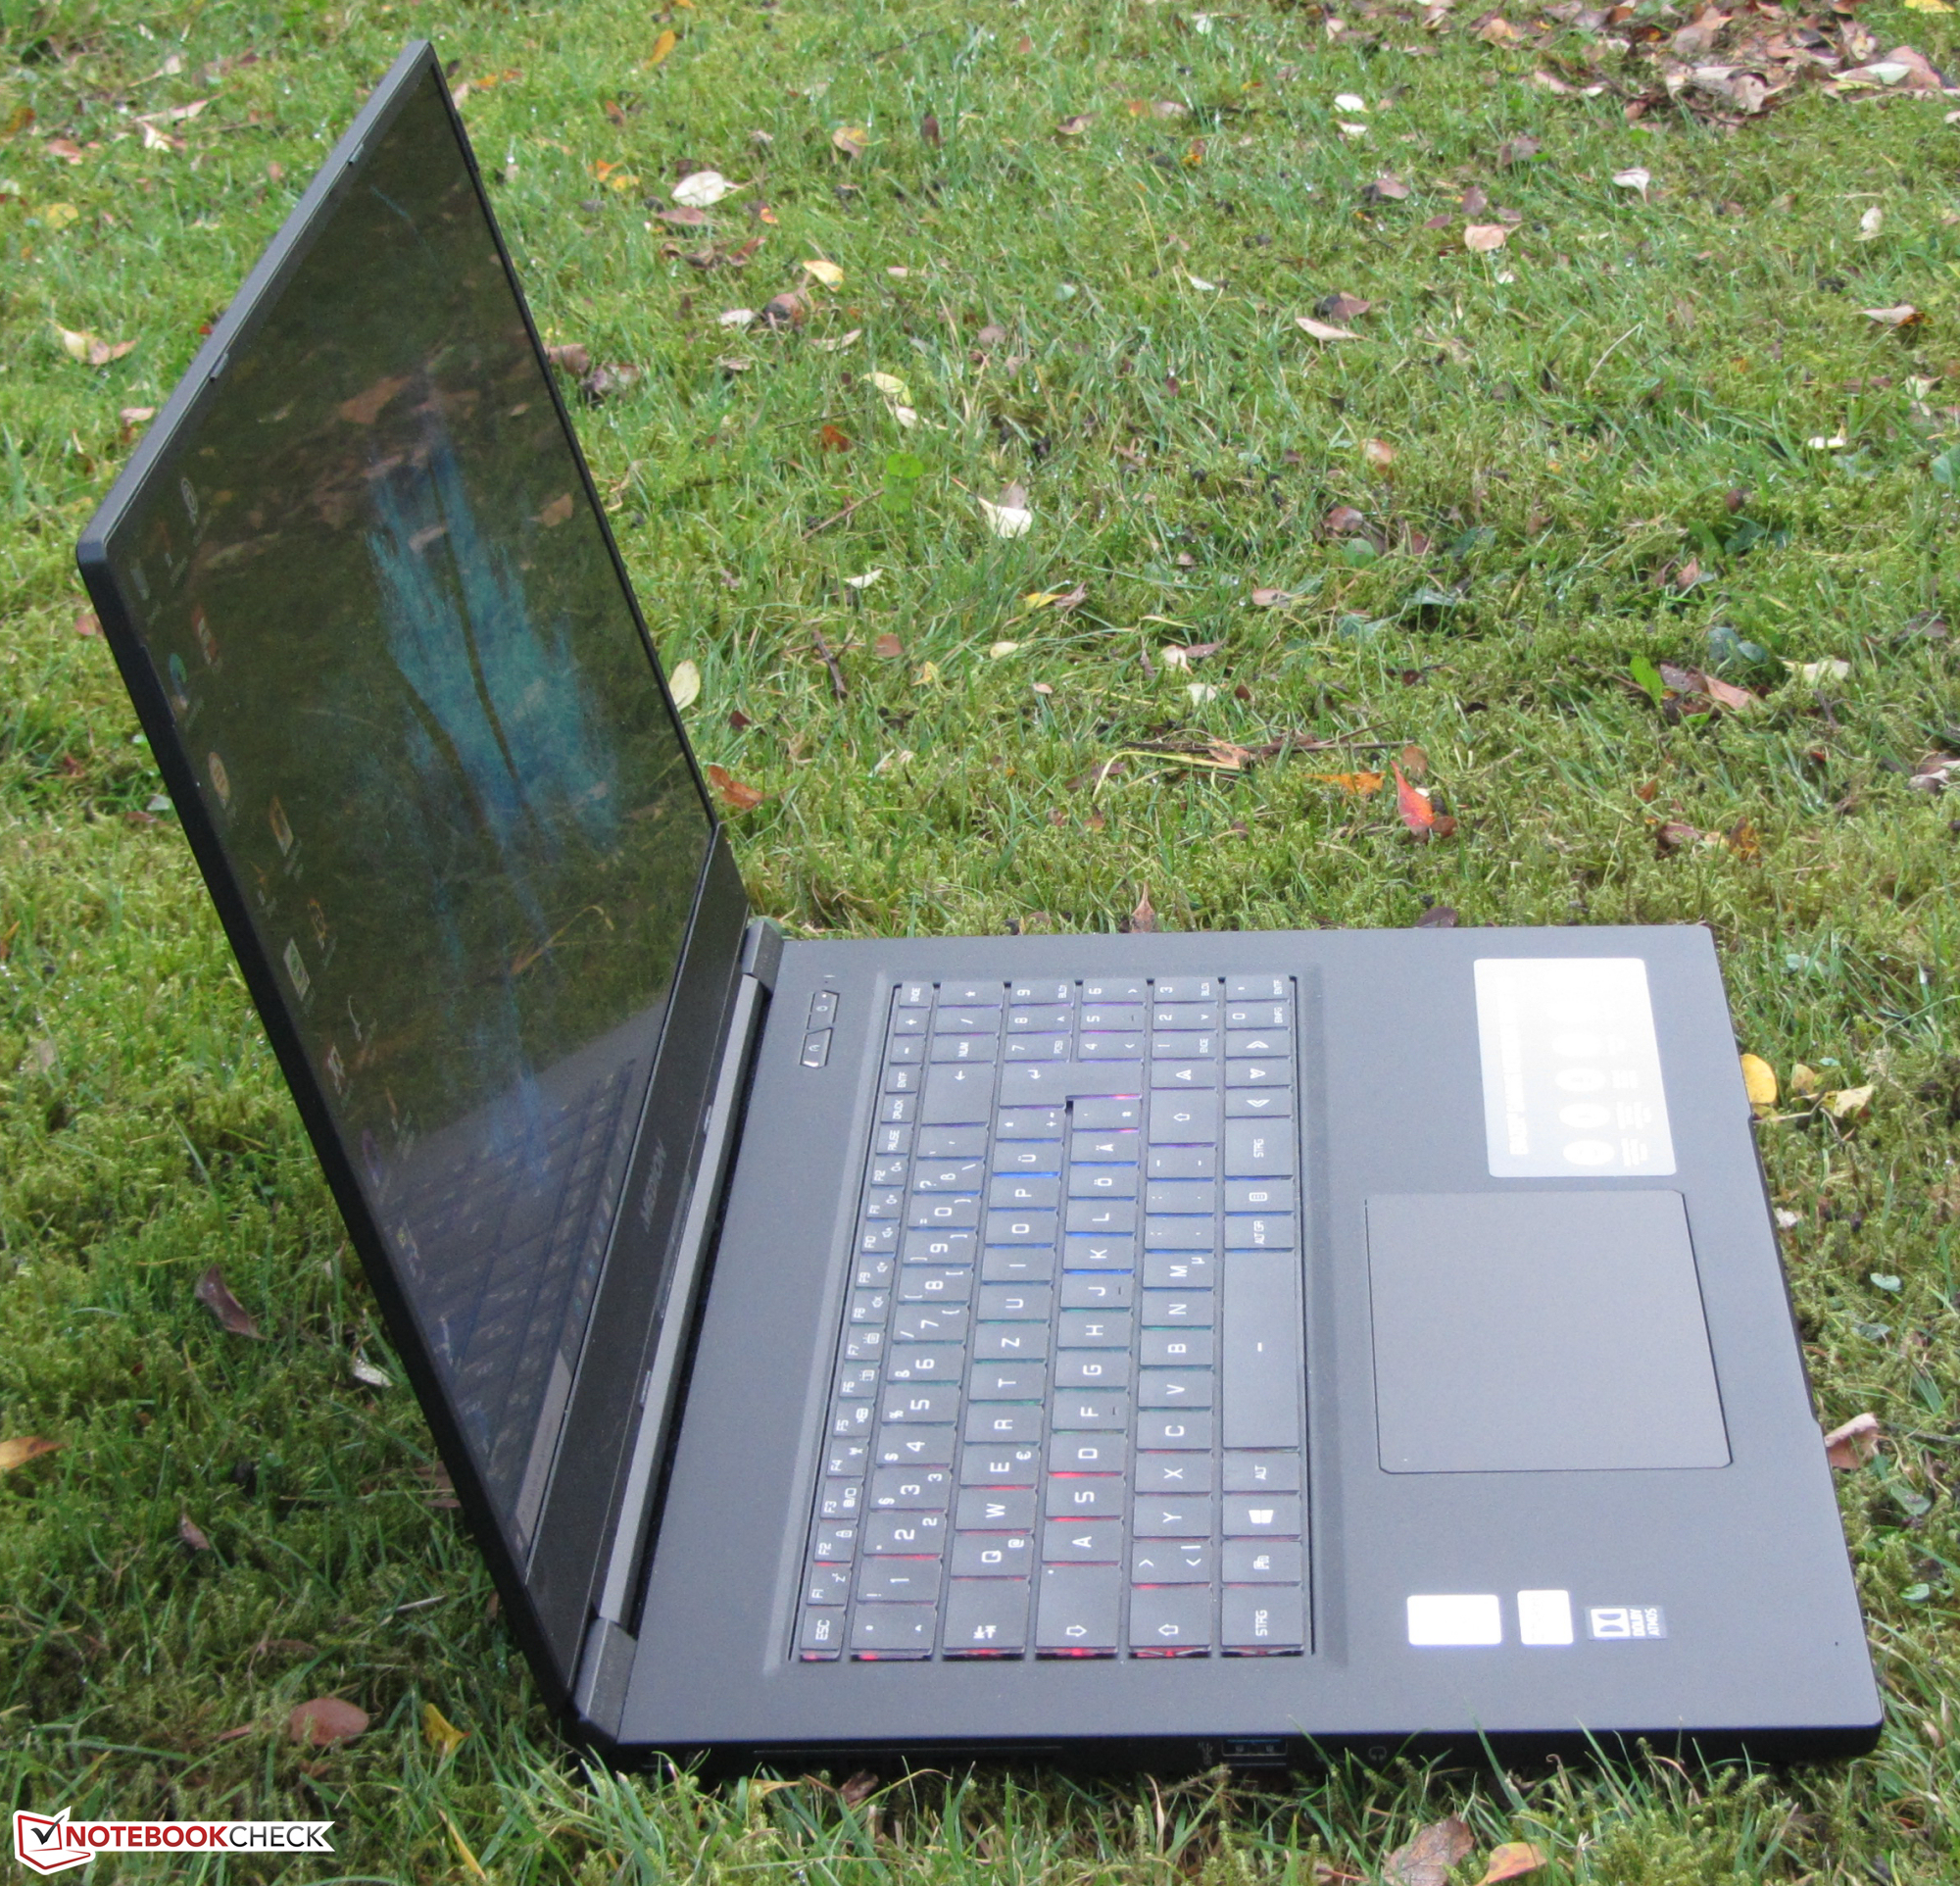
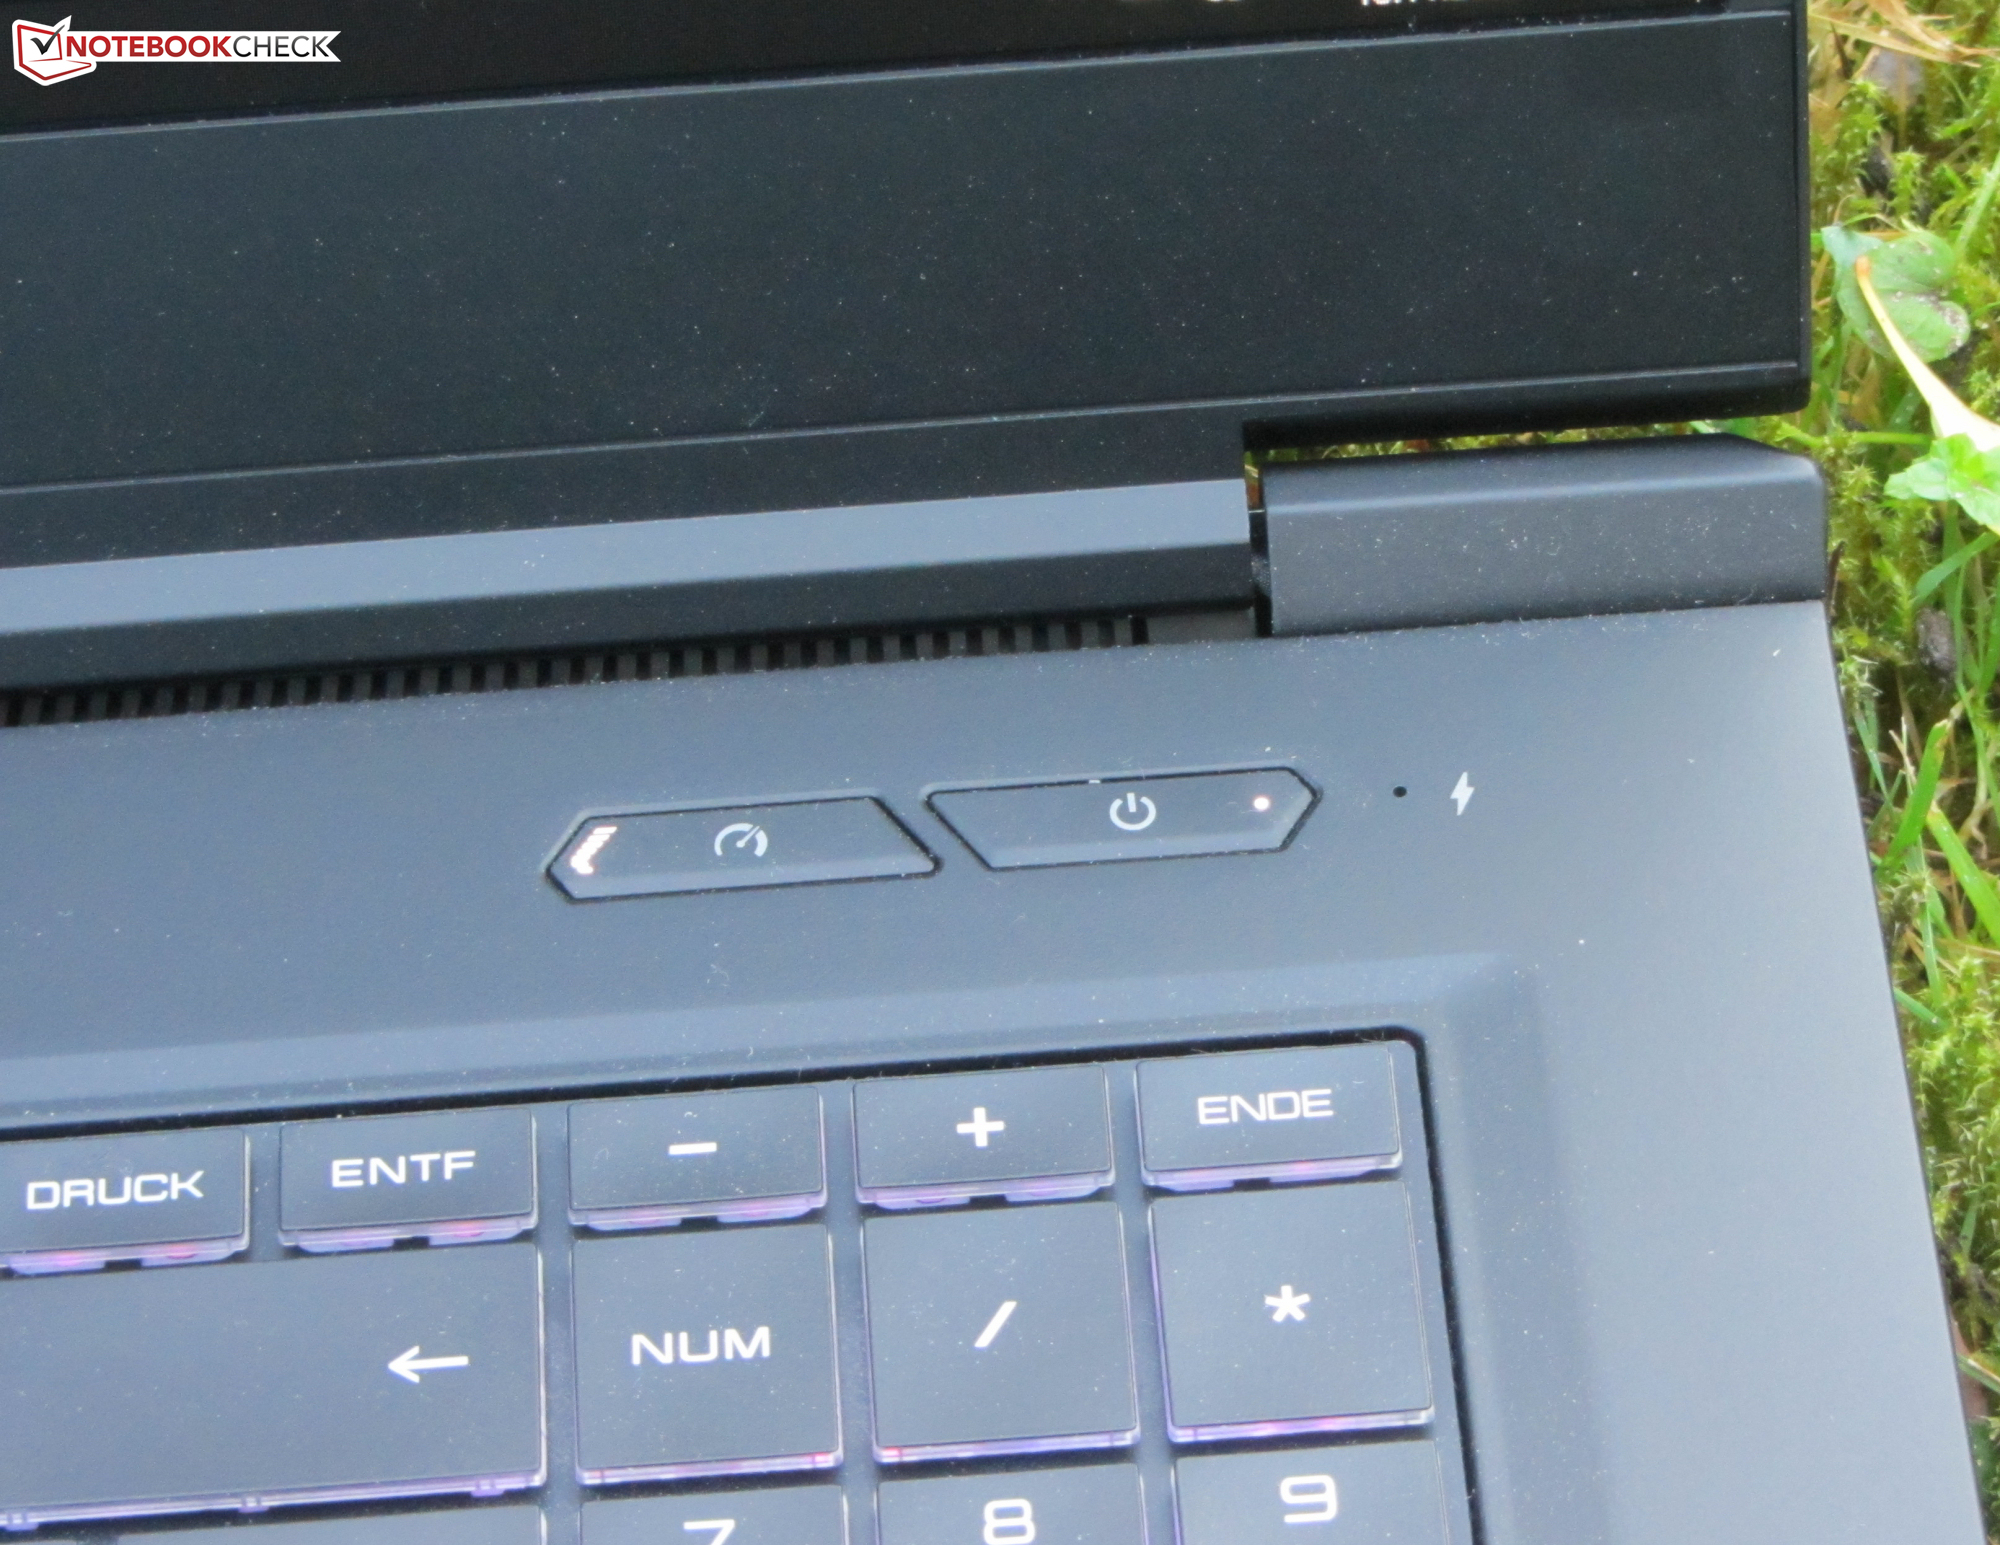
Med sin Erazer Beast X10 levererar Medion en tunn och kompakt spellaptop som kan beskrivas som lyckad.
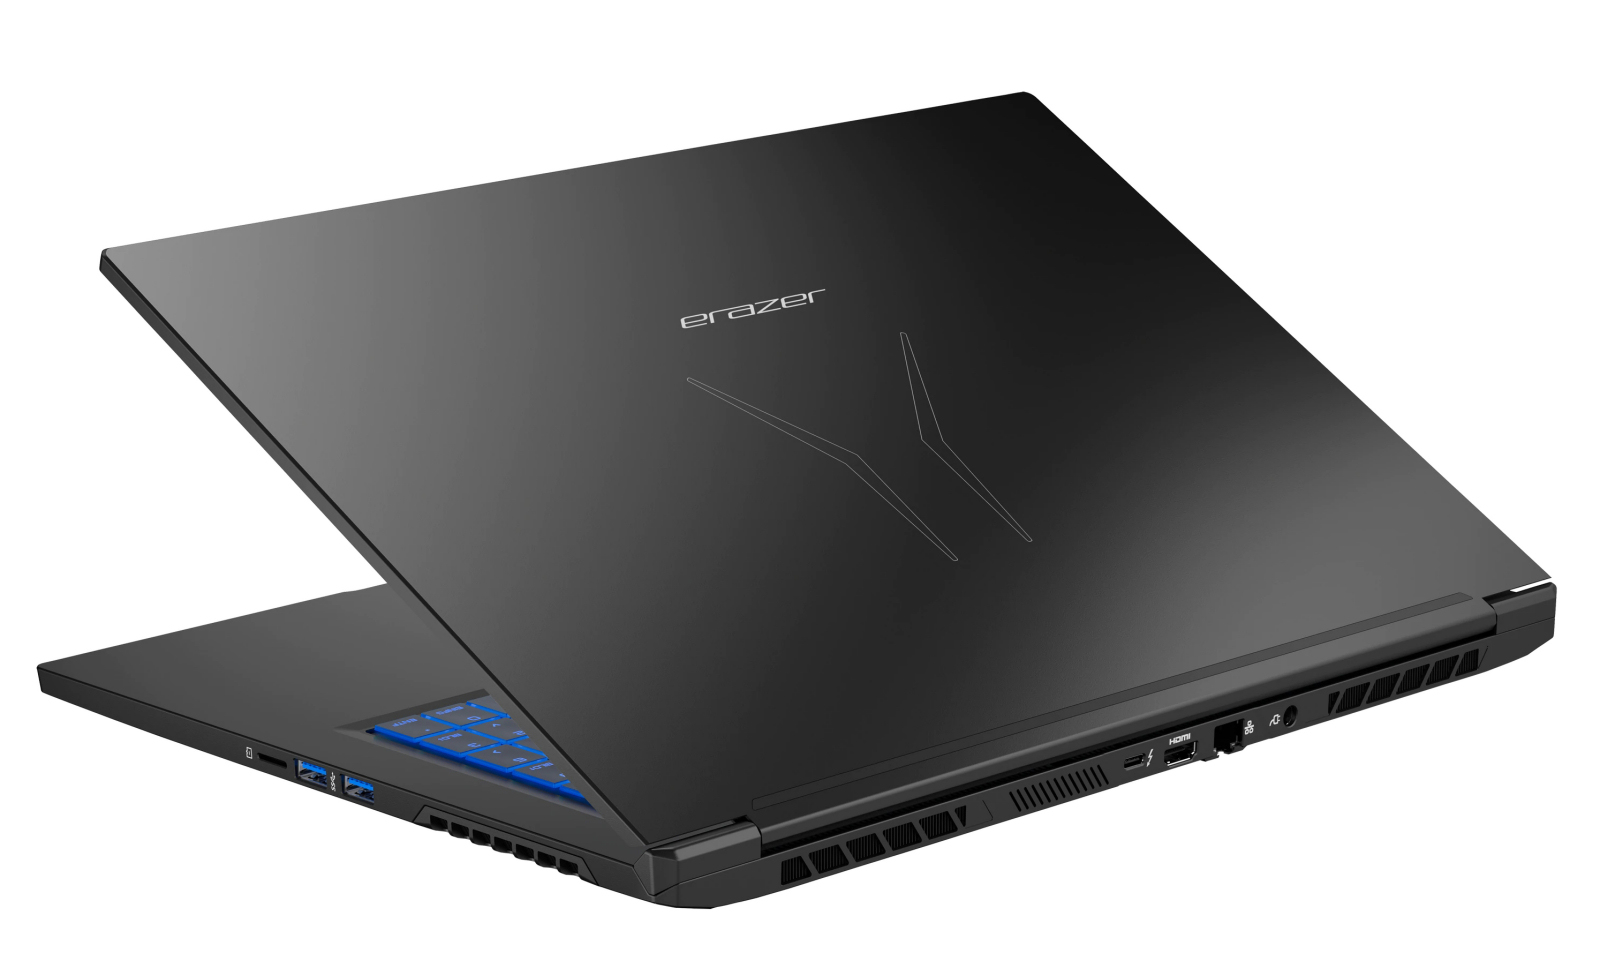
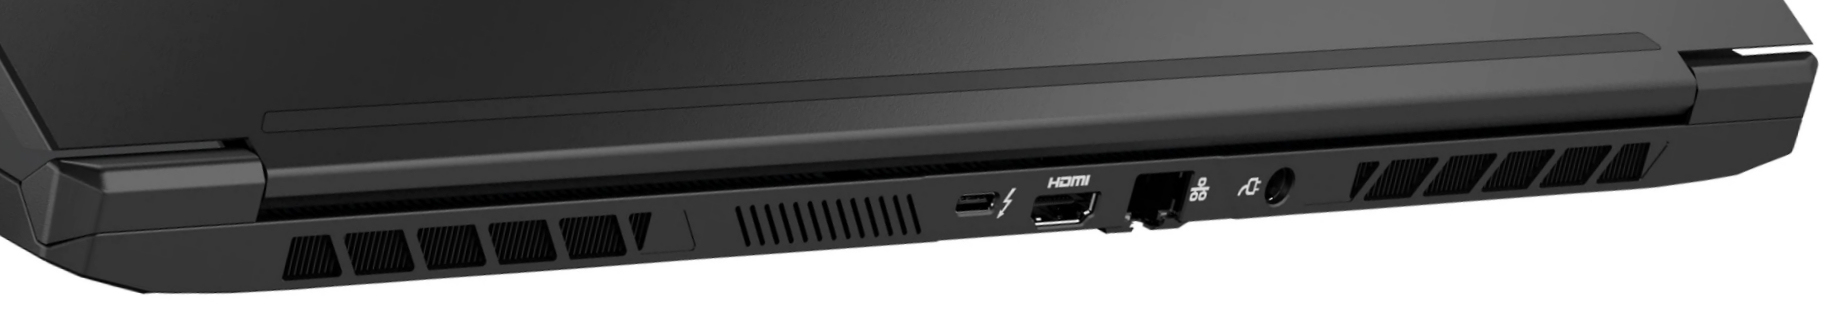
Datorn kommer med ett batteri på 91 Wh, vilket ger en praktisk batteritid (WLAN-drift, videouppspelning, ordbehandling) på 7 till 8 timmar. Den responsiva skärmen (Full HD, IPS, 144 Hz) har breda betraktningsvinklar och god färgåtergivning. Den har okej ljusstyrka och kontrast. En Thunderbolt 3-port gör det möjligt att ansluta avancerade dockningslösningar såsom en extern GPU. Dessutom förtjänar det tjusiga och väldigt stabila metallhöljet beröm.
Tips: Under perioden från 28:e Augusti 2020 till 28:e Februari 2021 ingår spelet "Marvel's Avengers" som en gratis nerladdning om man köper Beast X10. Det kommer dock inte från Medion utan från Intel. Erbjudandekoden skickas ("så länge lagret räcker") via epost och måste lösas in hos Intel innan 31:e Mars 2021. Medion har informerat oss om att detaljerna om hur detta går till står i mailet. Erbjudandet är heller inte begränsat till Medion. Andra laptoptillverkare deltar också i Intels kampanj.
Medion Erazer Beast X10 MD61804
- 11/26/2020 v7 (old)
Sascha Mölck
Price comparison
