Test: Lenovo ThinkPad Yoga 370 (7200U, FHD) (sammanfattning)
| SD Card Reader | |
| average JPG Copy Test (av. of 3 runs) | |
| Lenovo ThinkPad Yoga 370-20JJS00100 | |
| Dell XPS 13-9365 2-in-1 | |
| Lenovo ThinkPad X1 Carbon 2017-20HQS03P00 | |
| maximum AS SSD Seq Read Test (1GB) | |
| Dell XPS 13-9365 2-in-1 | |
| Lenovo ThinkPad Yoga 370-20JJS00100 | |
| Lenovo ThinkPad X1 Carbon 2017-20HQS03P00 | |
Skärmflimmer / PWM (Puls-Width Modulation)
| Skärmflimmer / PWM upptäckt | 217.4 Hz | ≤ 50 % ljusstyrka inställning | 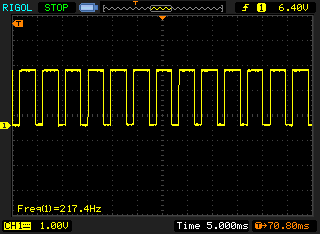 |
Displayens bakgrundsbelysning flimrar vid 217.4 Hz (i värsta fall, t.ex. med PWM) Flimrande upptäckt vid en ljusstyrkeinställning på 50 % och lägre. Det ska inte finnas något flimmer eller PWM över denna ljusstyrkeinställning. Frekvensen för 217.4 Hz är relativt låg, så känsliga användare kommer sannolikt att märka flimmer och uppleva ansträngda ögon vid den angivna ljusstyrkeinställningen och nedan. Som jämförelse: 52 % av alla testade enheter använder inte PWM för att dämpa skärmen. Om PWM upptäcktes mättes ett medelvärde av 7748 (minst: 5 - maximum: 343500) Hz. | |||
| |||||||||||||||||||||||||
Distribution av ljusstyrkan: 87 %
Mitt på batteriet: 373 cd/m²
Kontrast: 1133:1 (Svärta: 0.33 cd/m²)
ΔE ColorChecker Calman: 4.7 | ∀{0.5-29.43 Ø4.71}
ΔE Greyscale Calman: 6.5 | ∀{0.09-98 Ø4.96}
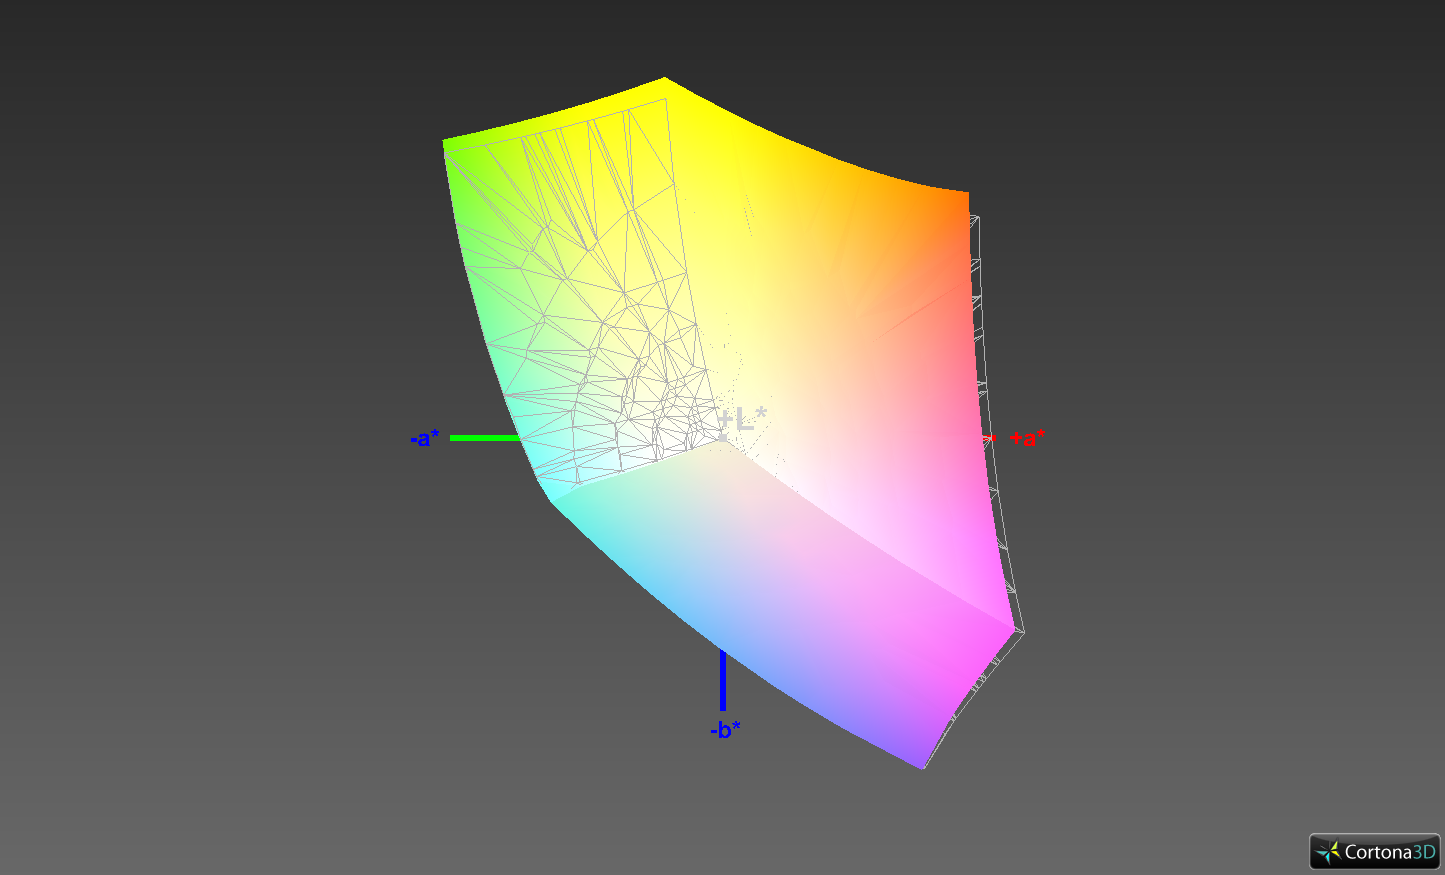
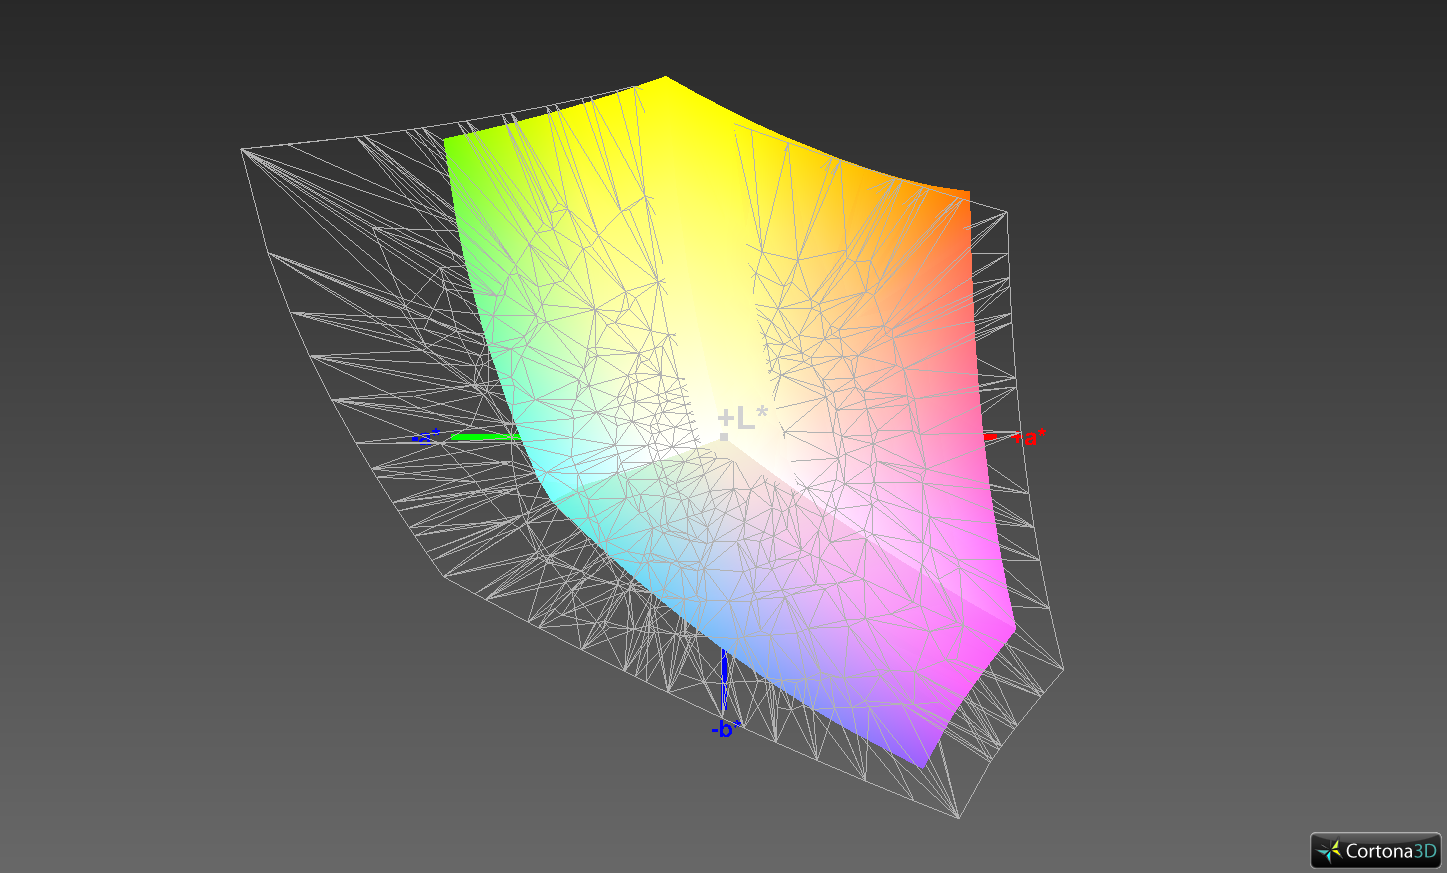
97.2% sRGB (Argyll 1.6.3 3D)
63.1% AdobeRGB 1998 (Argyll 1.6.3 3D)
69.9% AdobeRGB 1998 (Argyll 3D)
97.3% sRGB (Argyll 3D)
67.9% Display P3 (Argyll 3D)
Gamma: 2.19
CCT: 7086 K
| Lenovo ThinkPad Yoga 370-20JJS00100 Sharp LQ133M1JX15, , 1920x1080, 13.3" | Lenovo ThinkPad Yoga 260 20FD001XGE LEN40E6 N125HCE-GN1, , 1920x1080, 12.5" | Lenovo Thinkpad X1 Yoga 20FQ-000QUS VVX14T058J10, , 2560x1440, 14" | Lenovo ThinkPad X1 Carbon 2017-20HQS03P00 B140HAN03_1, , 1920x1080, 14" | HP EliteBook x360 1030 G2 CMN1374, , 1920x1080, 13.3" | Dell XPS 13-9365 2-in-1 1920x1080, 13.3" | |
|---|---|---|---|---|---|---|
| Display | -36% | 0% | -11% | -7% | -29% | |
| Display P3 Coverage (%) | 67.9 | 42.98 -37% | 68.1 0% | 61.4 -10% | 65.5 -4% | 47.32 -30% |
| sRGB Coverage (%) | 97.3 | 62.8 -35% | 97.2 0% | 85.9 -12% | 88.8 -9% | 71.1 -27% |
| AdobeRGB 1998 Coverage (%) | 69.9 | 44.55 -36% | 70.2 0% | 62.4 -11% | 64.9 -7% | 48.83 -30% |
| Response Times | -22% | 9% | 3% | -7% | -7% | |
| Response Time Grey 50% / Grey 80% * (ms) | 42 ? | 64 ? -52% | 38 ? 10% | 41.6 ? 1% | 55.2 ? -31% | 48 ? -14% |
| Response Time Black / White * (ms) | 32.8 ? | 30 ? 9% | 30.4 ? 7% | 31.6 ? 4% | 27.2 ? 17% | 32.8 ? -0% |
| PWM Frequency (Hz) | 217.4 ? | 219 ? | 1042 ? | |||
| Screen | -29% | -13% | -3% | -7% | -9% | |
| Brightness middle (cd/m²) | 374 | 371 -1% | 284.7 -24% | 311 -17% | 262 -30% | 322.6 -14% |
| Brightness (cd/m²) | 356 | 335 -6% | 272 -24% | 288 -19% | 256 -28% | 306 -14% |
| Brightness Distribution (%) | 87 | 84 -3% | 89 2% | 85 -2% | 83 -5% | 91 5% |
| Black Level * (cd/m²) | 0.33 | 0.29 12% | 0.383 -16% | 0.24 27% | 0.25 24% | 0.19 42% |
| Contrast (:1) | 1133 | 1279 13% | 743 -34% | 1296 14% | 1048 -8% | 1698 50% |
| Colorchecker dE 2000 * | 4.7 | 8.51 -81% | 5.24 -11% | 5.5 -17% | 5.13 -9% | 7.7 -64% |
| Colorchecker dE 2000 max. * | 9.5 | 20.43 -115% | 11.22 -18% | 9 5% | 9.46 -0% | 11.1 -17% |
| Greyscale dE 2000 * | 6.5 | 9.23 -42% | 7.32 -13% | 6.2 5% | 6.23 4% | 7.9 -22% |
| Gamma | 2.19 100% | 2.24 98% | 2.22 99% | 2.02 109% | 2.45 90% | 2.88 76% |
| CCT | 7086 92% | 6759 96% | 6277 104% | 5950 109% | 6413 101% | 7044 92% |
| Color Space (Percent of AdobeRGB 1998) (%) | 63.1 | 41 -35% | 70.17 11% | 55.96 -11% | 57.84 -8% | 44.1 -30% |
| Color Space (Percent of sRGB) (%) | 97.2 | 62 -36% | 94.68 -3% | 85.77 -12% | 88.57 -9% | 69.9 -28% |
| Totalt genomsnitt (program/inställningar) | -29% /
-30% | -1% /
-8% | -4% /
-4% | -7% /
-7% | -15% /
-13% |
* ... mindre är bättre
Visa svarstider
| ↔ Svarstid svart till vitt | ||
|---|---|---|
| 32.8 ms ... stiga ↗ och falla ↘ kombinerat | ↗ 19.2 ms stiga | 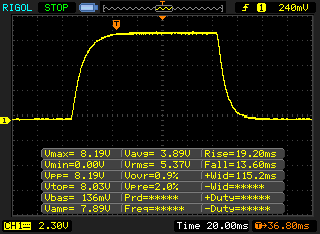 |
| ↘ 13.6 ms hösten | ||
| Skärmen visar långsamma svarsfrekvenser i våra tester och kommer att vara otillfredsställande för spelare. I jämförelse sträcker sig alla testade enheter från 0.1 (minst) till 240 (maximalt) ms. » 88 % av alla enheter är bättre. Detta innebär att den uppmätta svarstiden är sämre än genomsnittet av alla testade enheter (19.8 ms). | ||
| ↔ Svarstid 50 % grått till 80 % grått | ||
| 42 ms ... stiga ↗ och falla ↘ kombinerat | ↗ 21.2 ms stiga | 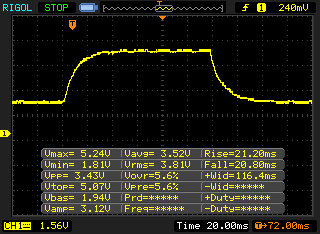 |
| ↘ 20.8 ms hösten | ||
| Skärmen visar långsamma svarsfrekvenser i våra tester och kommer att vara otillfredsställande för spelare. I jämförelse sträcker sig alla testade enheter från 0.165 (minst) till 636 (maximalt) ms. » 67 % av alla enheter är bättre. Detta innebär att den uppmätta svarstiden är sämre än genomsnittet av alla testade enheter (30.9 ms). | ||
| PCMark 8 Home Score Accelerated v2 | 3539 poäng | |
| PCMark 8 Creative Score Accelerated v2 | 4504 poäng | |
| PCMark 8 Work Score Accelerated v2 | 4314 poäng | |
Hjälp | ||
| Lenovo ThinkPad Yoga 370-20JJS00100 Toshiba NVMe THNSF5512GPUK | Lenovo ThinkPad Yoga 260 20FD001XGE Samsung SSD PM871 MZNLN256HCHP | Lenovo Thinkpad X1 Yoga 20FQ-000QUS Samsung SSD PM871 MZNLN512HCJH | Lenovo ThinkPad X1 Carbon 2017-20HQS03P00 Samsung PM961 NVMe MZVLW512HMJP | HP EliteBook x360 1030 G2 Sandisk SD8TN8U-256G-1006 | Dell XPS 13-9365 2-in-1 Toshiba NVMe THNSN5256GPUK | |
|---|---|---|---|---|---|---|
| CrystalDiskMark 3.0 | -35% | -30% | 74% | -35% | 3% | |
| Read Seq (MB/s) | 1070 | 468.9 -56% | 512 -52% | 1827 71% | 467.1 -56% | 1206 13% |
| Write Seq (MB/s) | 484.5 | 297.3 -39% | 443.8 -8% | 1383 185% | 443.6 -8% | 629 30% |
| Read 512 (MB/s) | 680 | 397.9 -41% | 363.1 -47% | 814 20% | 312.3 -54% | 966 42% |
| Write 512 (MB/s) | 483.1 | 297.1 -39% | 377.8 -22% | 1098 127% | 372.5 -23% | 410.7 -15% |
| Read 4k (MB/s) | 30.55 | 33.11 8% | 33.99 11% | 61 100% | 29.43 -4% | 32.93 8% |
| Write 4k (MB/s) | 127.3 | 85.1 -33% | 81.9 -36% | 172.2 35% | 56.5 -56% | 121.2 -5% |
| Read 4k QD32 (MB/s) | 460.8 | 398.3 -14% | 327.4 -29% | 601 30% | 311.3 -32% | 411 -11% |
| Write 4k QD32 (MB/s) | 414.5 | 136.6 -67% | 189.2 -54% | 495.6 20% | 225.2 -46% | 250.2 -40% |

| 3DMark 11 Performance | 1439 poäng | |
| 3DMark Ice Storm Standard Score | 51316 poäng | |
| 3DMark Cloud Gate Standard Score | 5704 poäng | |
| 3DMark Fire Strike Score | 773 poäng | |
Hjälp | ||
| låg | med. | hög | ultra | |
|---|---|---|---|---|
| BioShock Infinite (2013) | 37.6 | 23.96 | ||
| Company of Heroes 2 (2013) | 18.6 | |||
| The Witcher 3 (2015) | 12.6 | |||
| Rise of the Tomb Raider (2016) | 16.4 | |||
| Civilization 6 (2016) | 24.8 | 9.6 |
Ljudnivå
| Låg belastning |
| 28.6 / 28.6 / 31.2 dB(A) |
| Hög belastning |
| 33.7 / 36.7 dB(A) |
 | ||
30 dB tyst 40 dB(A) hörbar 50 dB(A) högt ljud |
||
min: | ||
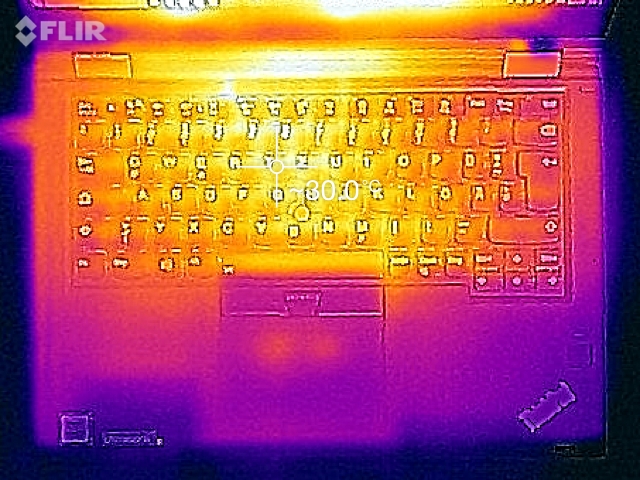
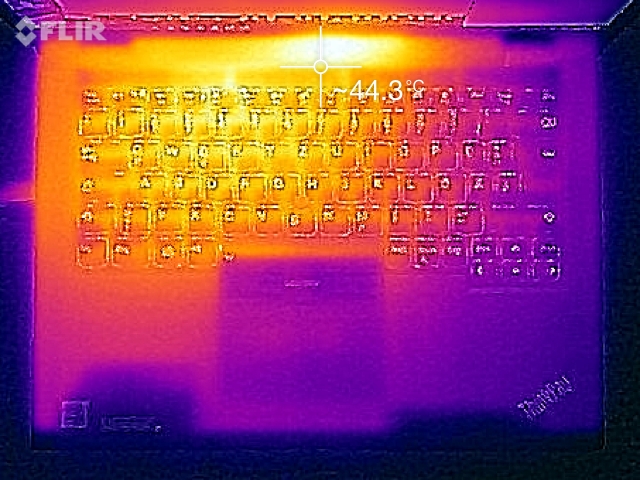
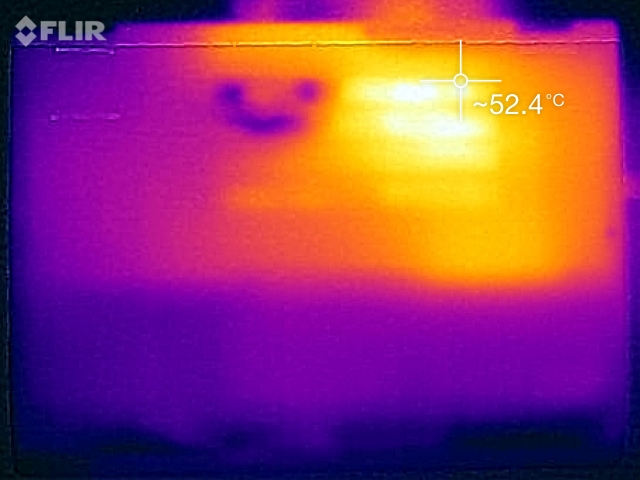
(±) Den maximala temperaturen på ovansidan är 42 °C / 108 F, jämfört med genomsnittet av 35.4 °C / 96 F , allt från 19.6 till 60 °C för klassen Convertible.
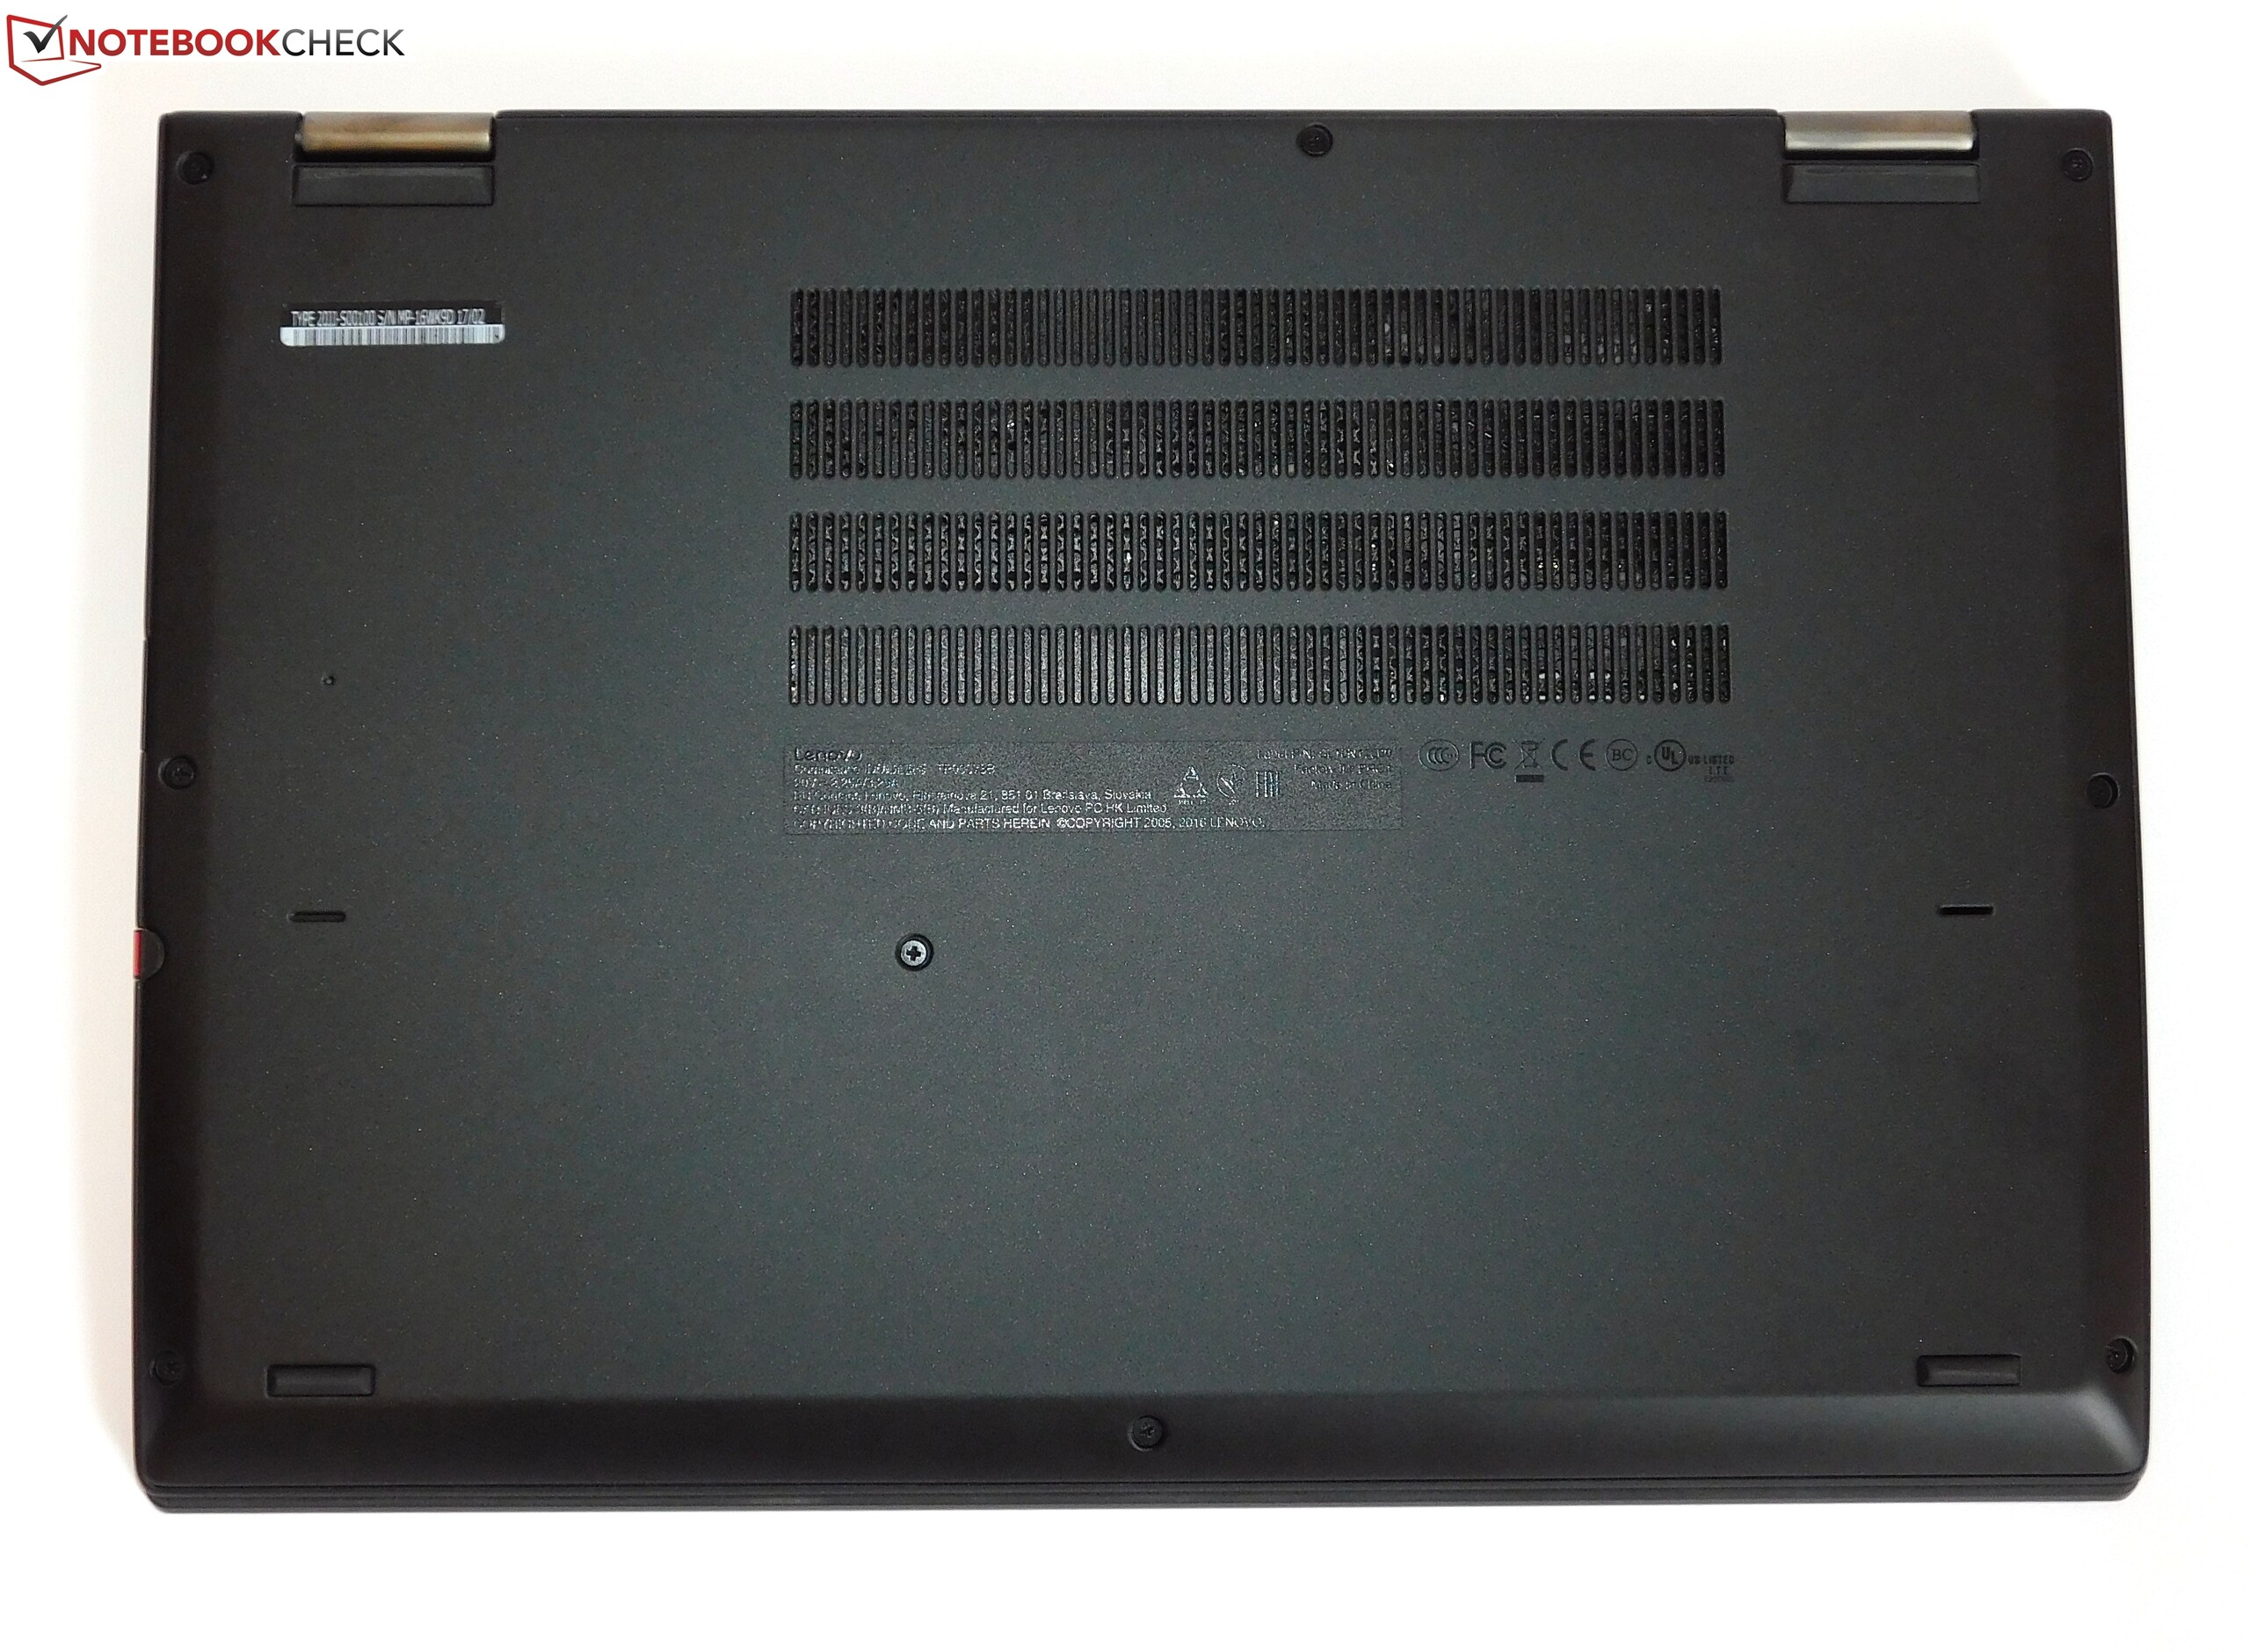
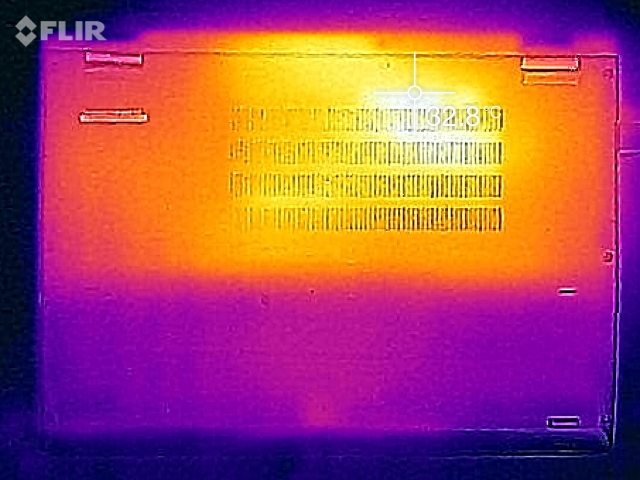
(-) Botten värms upp till maximalt 48 °C / 118 F, jämfört med genomsnittet av 36.9 °C / 98 F
(+) Vid tomgångsbruk är medeltemperaturen för ovansidan 26.5 °C / 80 F, jämfört med enhetsgenomsnittet på 30.3 °C / ### class_avg_f### F.
(+) Handledsstöden och pekplattan är kallare än hudtemperaturen med maximalt 31.1 °C / 88 F och är därför svala att ta på.
(-) Medeltemperaturen för handledsstödsområdet på liknande enheter var 28 °C / 82.4 F (-3.1 °C / -5.6 F).
Lenovo ThinkPad Yoga 370-20JJS00100 ljudanalys
(±) | högtalarljudstyrkan är genomsnittlig men bra (79.4 dB)
Bas 100 - 315 Hz
(-) | nästan ingen bas - i genomsnitt 23.5% lägre än medianen
(+) | basen är linjär (6.5% delta till föregående frekvens)
Mellan 400 - 2000 Hz
(+) | balanserad mellan - endast 4.4% från medianen
(+) | mids är linjära (6.8% delta till föregående frekvens)
Högsta 2 - 16 kHz
(+) | balanserade toppar - endast 4.6% från medianen
(+) | toppar är linjära (6.9% delta till föregående frekvens)
Totalt 100 - 16 000 Hz
(±) | linjäriteten för det totala ljudet är genomsnittlig (24.2% skillnad mot median)
Jämfört med samma klass
» 74% av alla testade enheter i den här klassen var bättre, 5% liknande, 21% sämre
» Den bästa hade ett delta på 6%, genomsnittet var 20%, sämst var 57%
Jämfört med alla testade enheter
» 73% av alla testade enheter var bättre, 6% liknande, 21% sämre
» Den bästa hade ett delta på 4%, genomsnittet var 23%, sämst var 134%
HP EliteBook x360 1030 G2 ljudanalys
(+) | högtalare kan spela relativt högt (86.3 dB)
Analysis not possible as minimum curve is missing or too high
| Av/Standby | |
| Låg belastning | |
| Hög belastning |
|
Förklaring:
min: | |
| Lenovo ThinkPad Yoga 370-20JJS00100 i5-7200U, HD Graphics 620, Toshiba NVMe THNSF5512GPUK, IPS LED, 1920x1080, 13.3" | Lenovo ThinkPad Yoga 260 20FD001XGE 6500U, HD Graphics 520, Samsung SSD PM871 MZNLN256HCHP, IPS, 1920x1080, 12.5" | Lenovo Thinkpad X1 Yoga 20FQ-000QUS 6500U, HD Graphics 520, Samsung SSD PM871 MZNLN512HCJH, IPS, 2560x1440, 14" | Lenovo ThinkPad X1 Carbon 2017-20HQS03P00 i7-7500U, HD Graphics 620, Samsung PM961 NVMe MZVLW512HMJP, IPS, 1920x1080, 14" | HP EliteBook x360 1030 G2 i5-7300U, HD Graphics 620, Sandisk SD8TN8U-256G-1006, IPS, 1920x1080, 13.3" | Dell XPS 13-9365 2-in-1 i7-7Y75, HD Graphics 615, Toshiba NVMe THNSN5256GPUK, IPS, 1920x1080, 13.3" | |
|---|---|---|---|---|---|---|
| Power Consumption | 12% | -43% | -18% | 6% | 29% | |
| Idle Minimum * (Watt) | 3.6 | 3.6 -0% | 6.82 -89% | 3.84 -7% | 3.2 11% | 3.1 14% |
| Idle Average * (Watt) | 7.2 | 6.3 12% | 8.21 -14% | 6.3 12% | 5.5 24% | 4.3 40% |
| Idle Maximum * (Watt) | 8.4 | 7.6 10% | 17.55 -109% | 8.6 -2% | 6.5 23% | 4.9 42% |
| Load Average * (Watt) | 29.9 | 27.2 9% | 28.81 4% | 41.9 -40% | 29.7 1% | 24.3 19% |
| Load Maximum * (Watt) | 32.2 | 22.8 29% | 34.07 -6% | 48.7 -51% | 41.3 -28% | 22.8 29% |
* ... mindre är bättre
| Lenovo ThinkPad Yoga 370-20JJS00100 i5-7200U, HD Graphics 620, 51 Wh | Lenovo ThinkPad Yoga 260 20FD001XGE 6500U, HD Graphics 520, 44 Wh | Lenovo Thinkpad X1 Yoga 20FQ-000QUS 6500U, HD Graphics 520, 52 Wh | Lenovo ThinkPad X1 Carbon 2017-20HQS03P00 i7-7500U, HD Graphics 620, 57 Wh | HP EliteBook x360 1030 G2 i5-7300U, HD Graphics 620, 57 Wh | Dell XPS 13-9365 2-in-1 i7-7Y75, HD Graphics 615, 46 Wh | |
|---|---|---|---|---|---|---|
| Batteridrifttid | -25% | -18% | 5% | 40% | 21% | |
| Reader / Idle (h) | 19.4 | 15.7 -19% | 15.4 -21% | 20.9 8% | 23.1 19% | 16.2 -16% |
| H.264 (h) | 9.6 | 11.9 24% | 11 15% | |||
| WiFi v1.3 (h) | 8.1 | 5.8 -28% | 5.9 -27% | 8.3 2% | 10.5 30% | 11.4 41% |
| Load (h) | 2.1 | 1.5 -29% | 2 -5% | 1.8 -14% | 4.1 95% | 2.9 38% |
Läs originaltestet på engelska här.
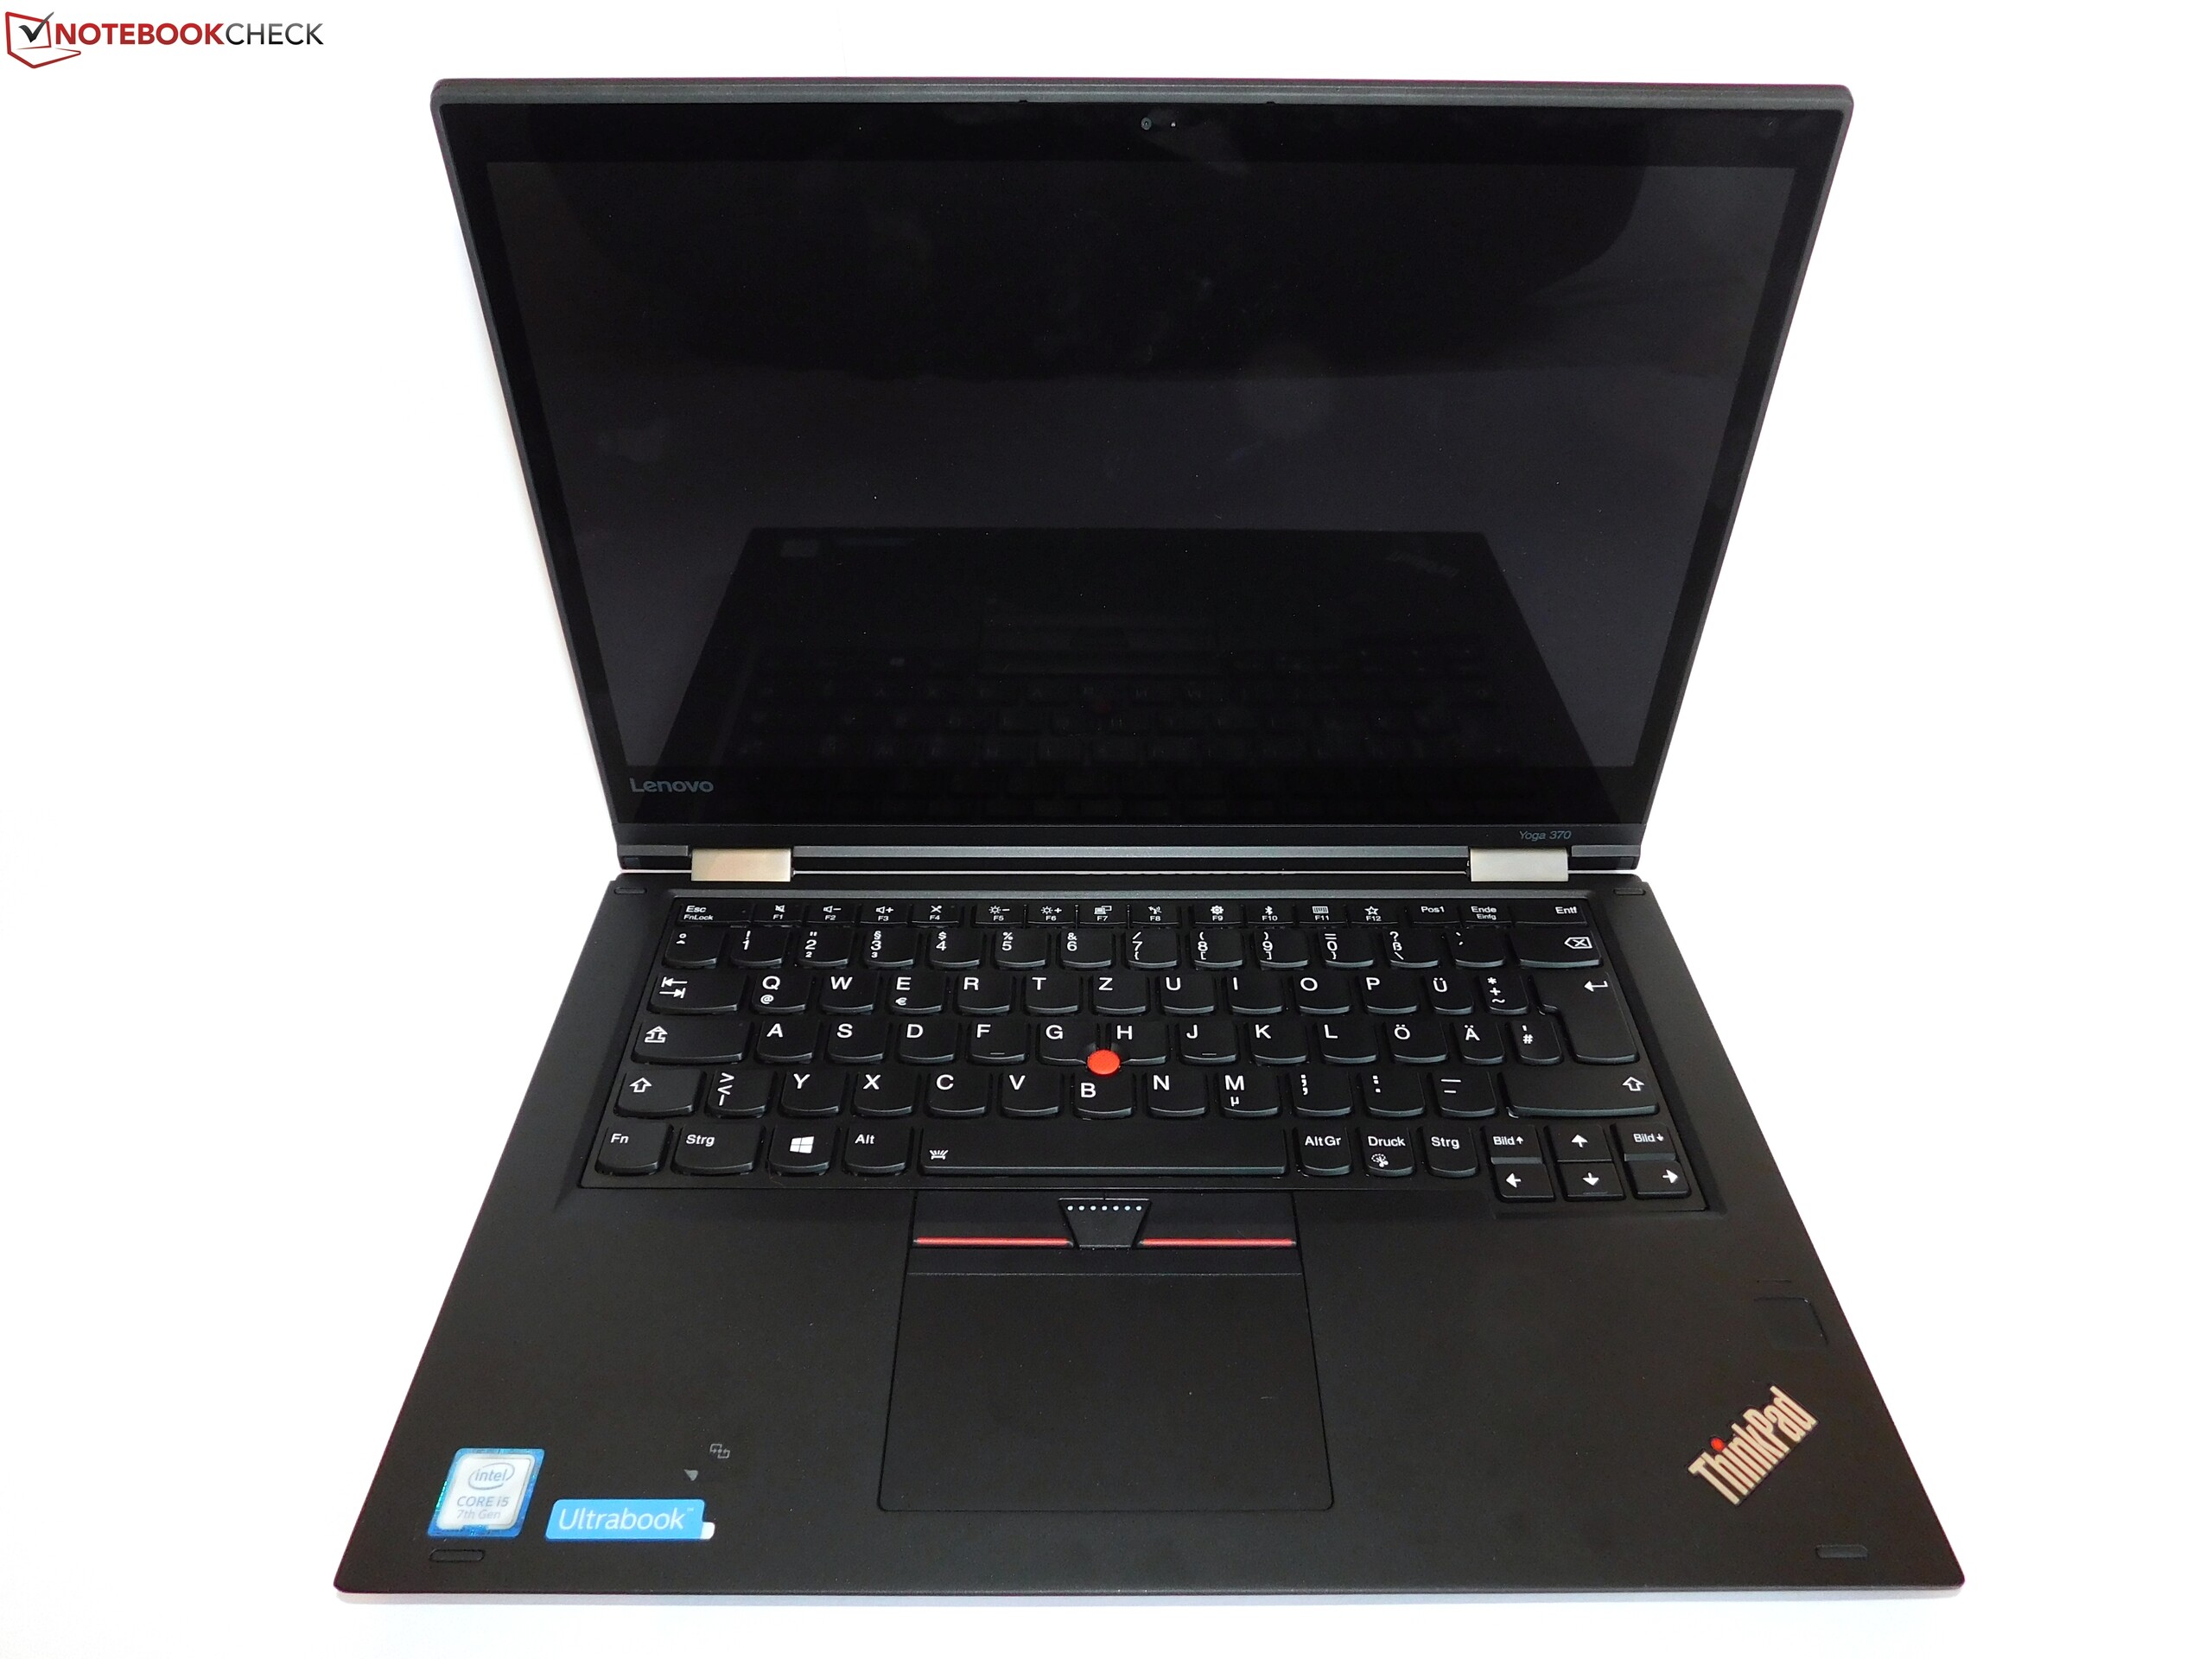
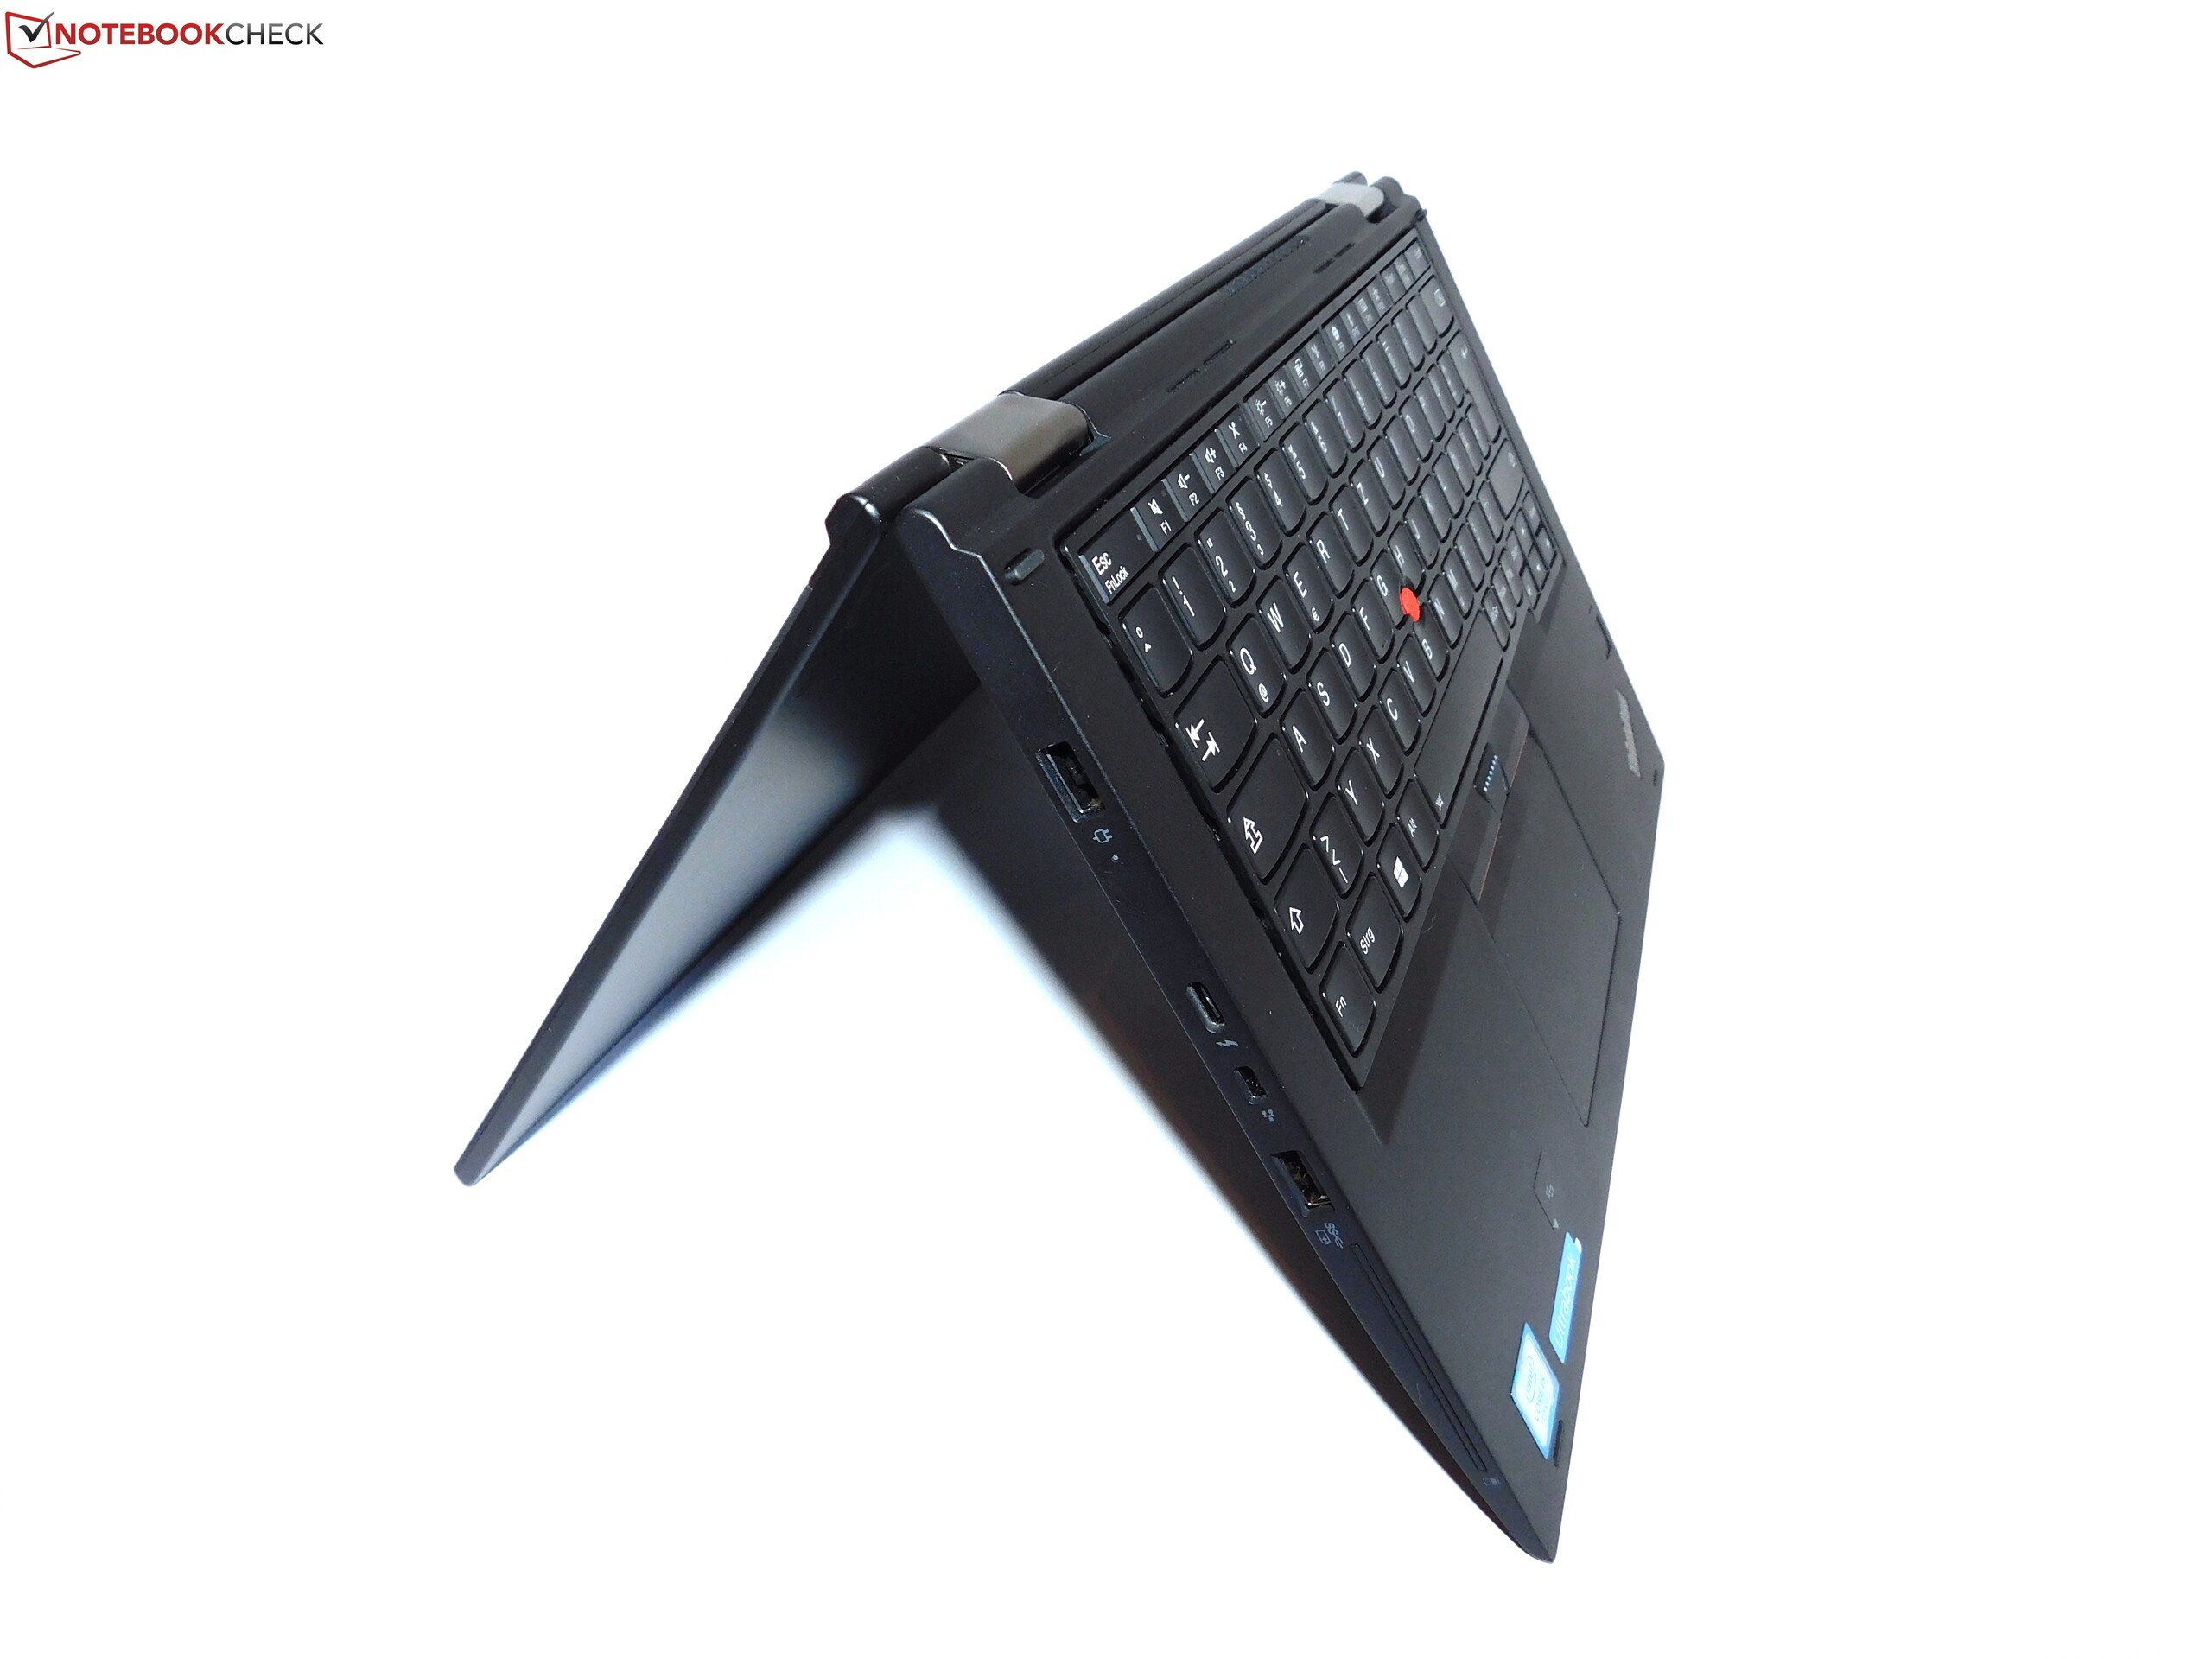
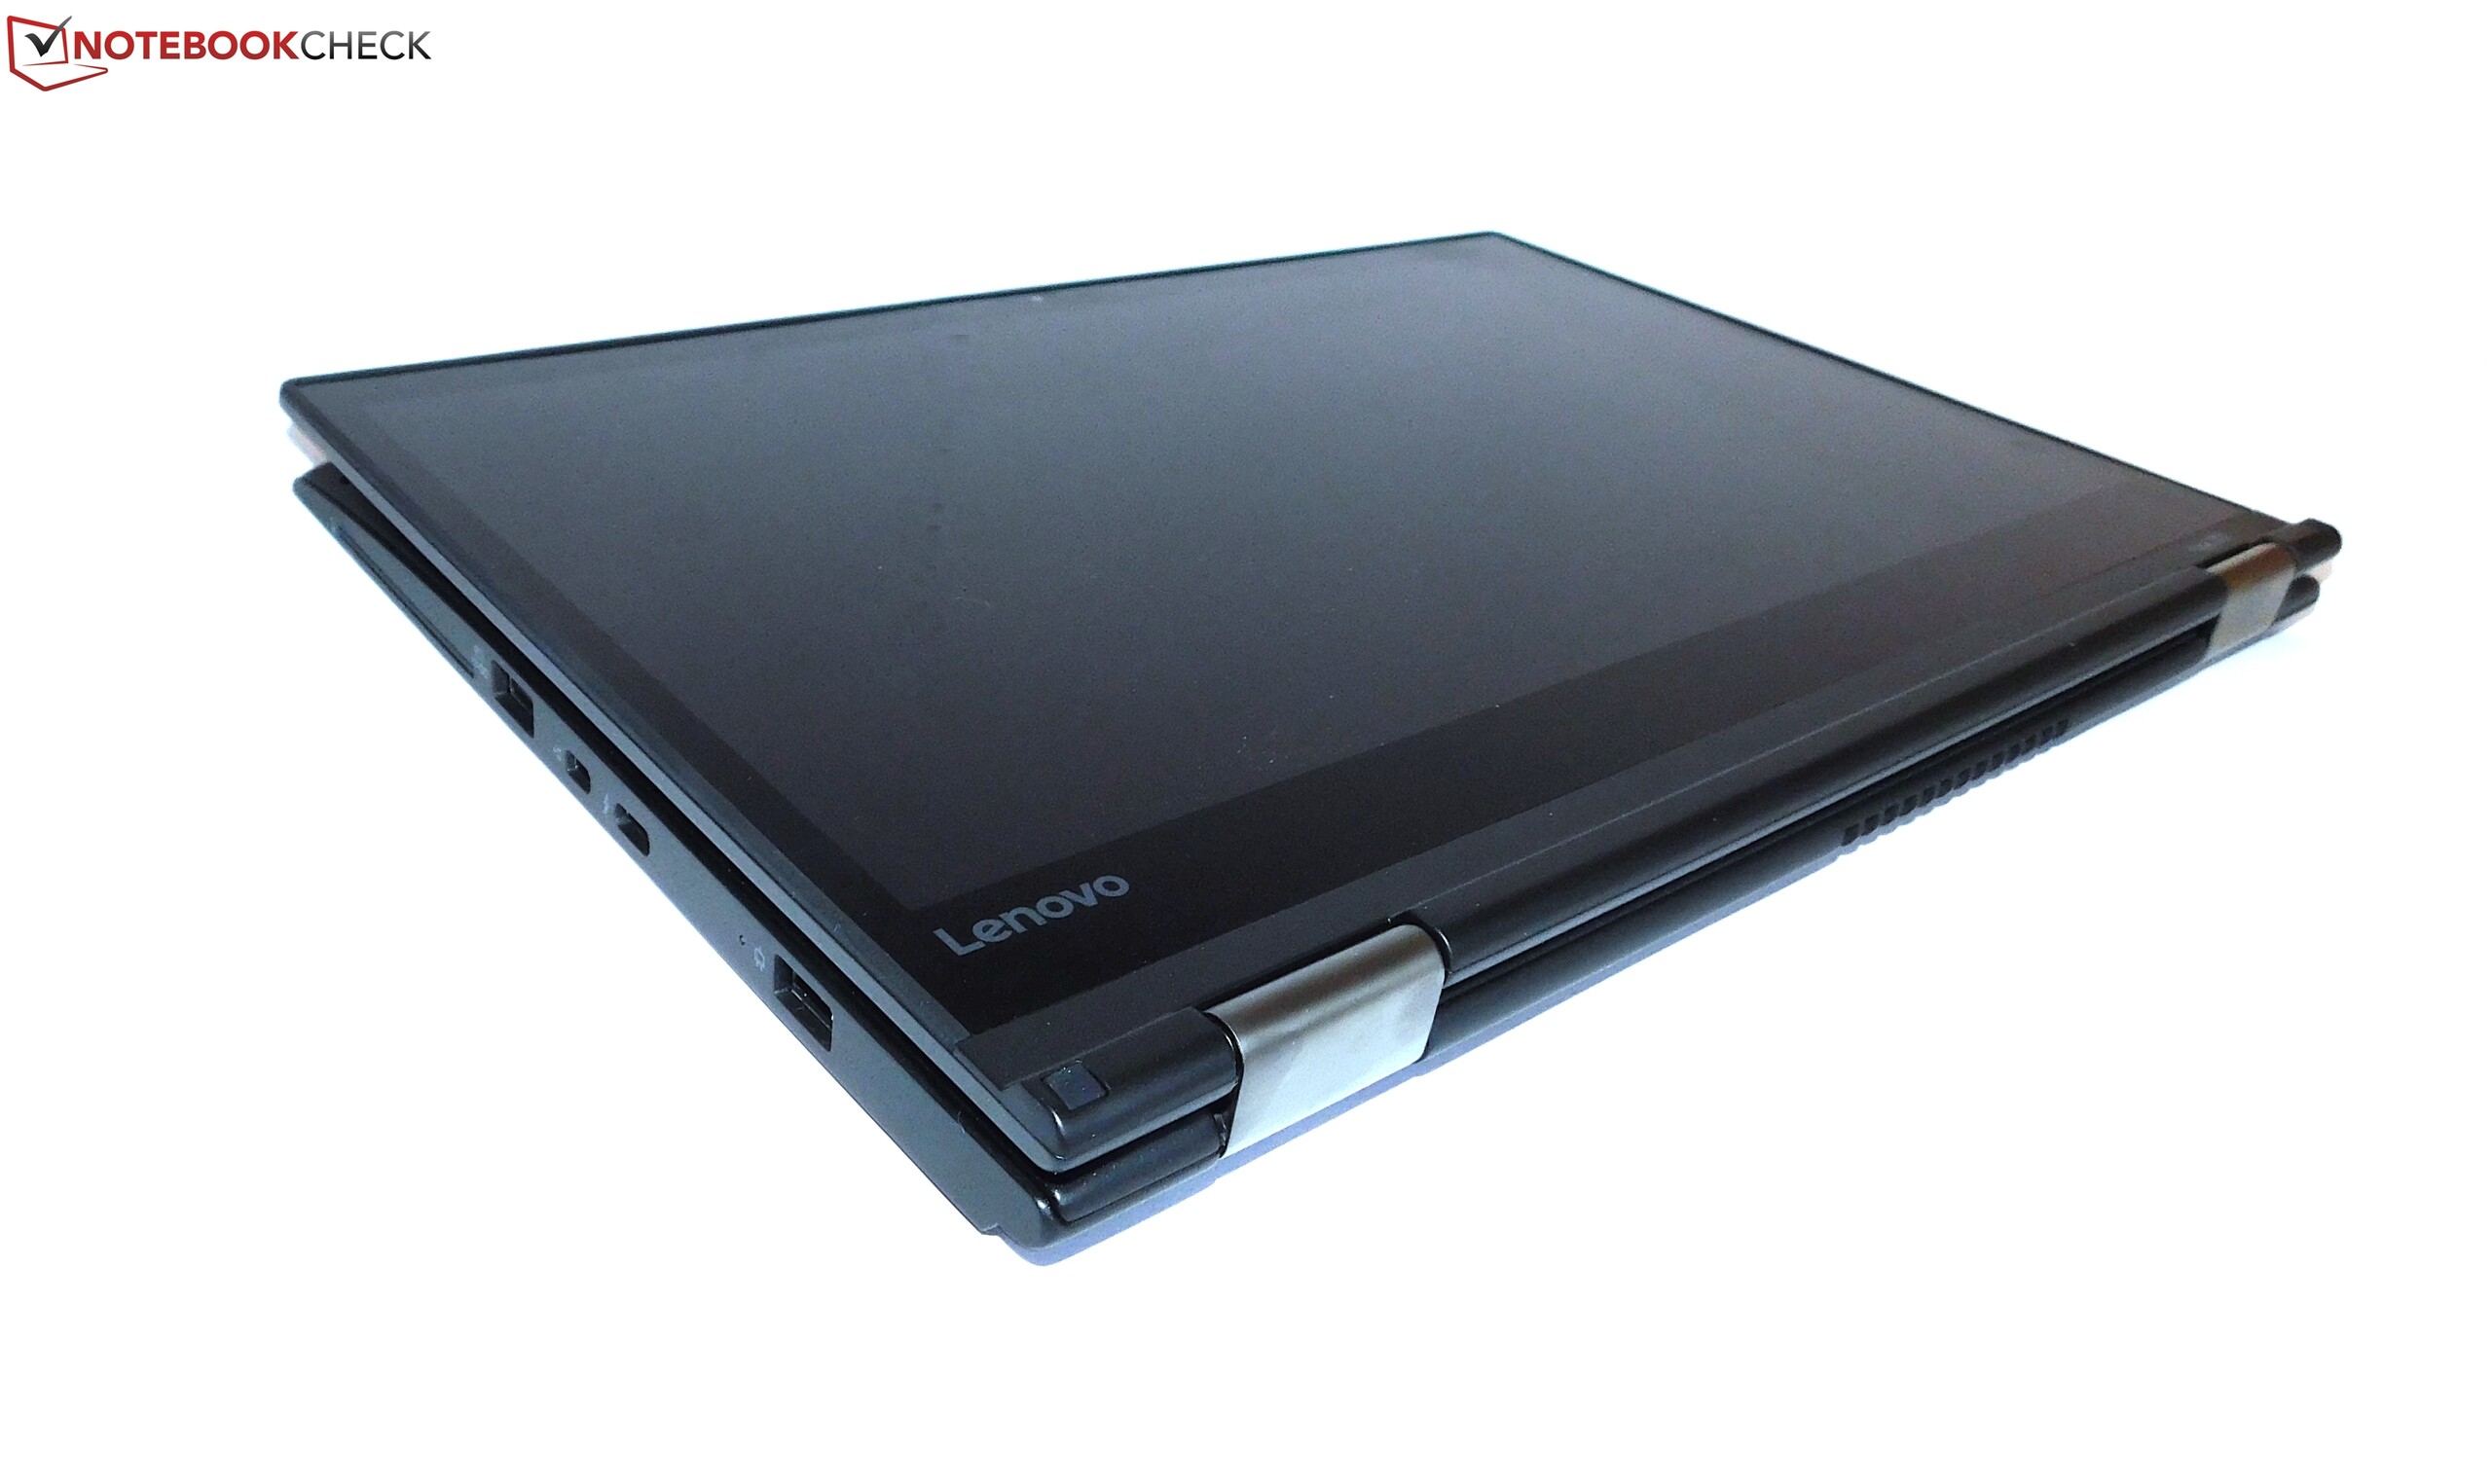
Lenovo har gjort det enkelt för oss i år. I stället för att behöva välja mellan en modell på 12,5” och en på 14” får vi bara en 13,3-tumsmodell av ThinkPad Yoga den här gången. Det är en förändring till det bättre – Lenovo har hittat rätt balans mellan bildstorlek och mobilitet.
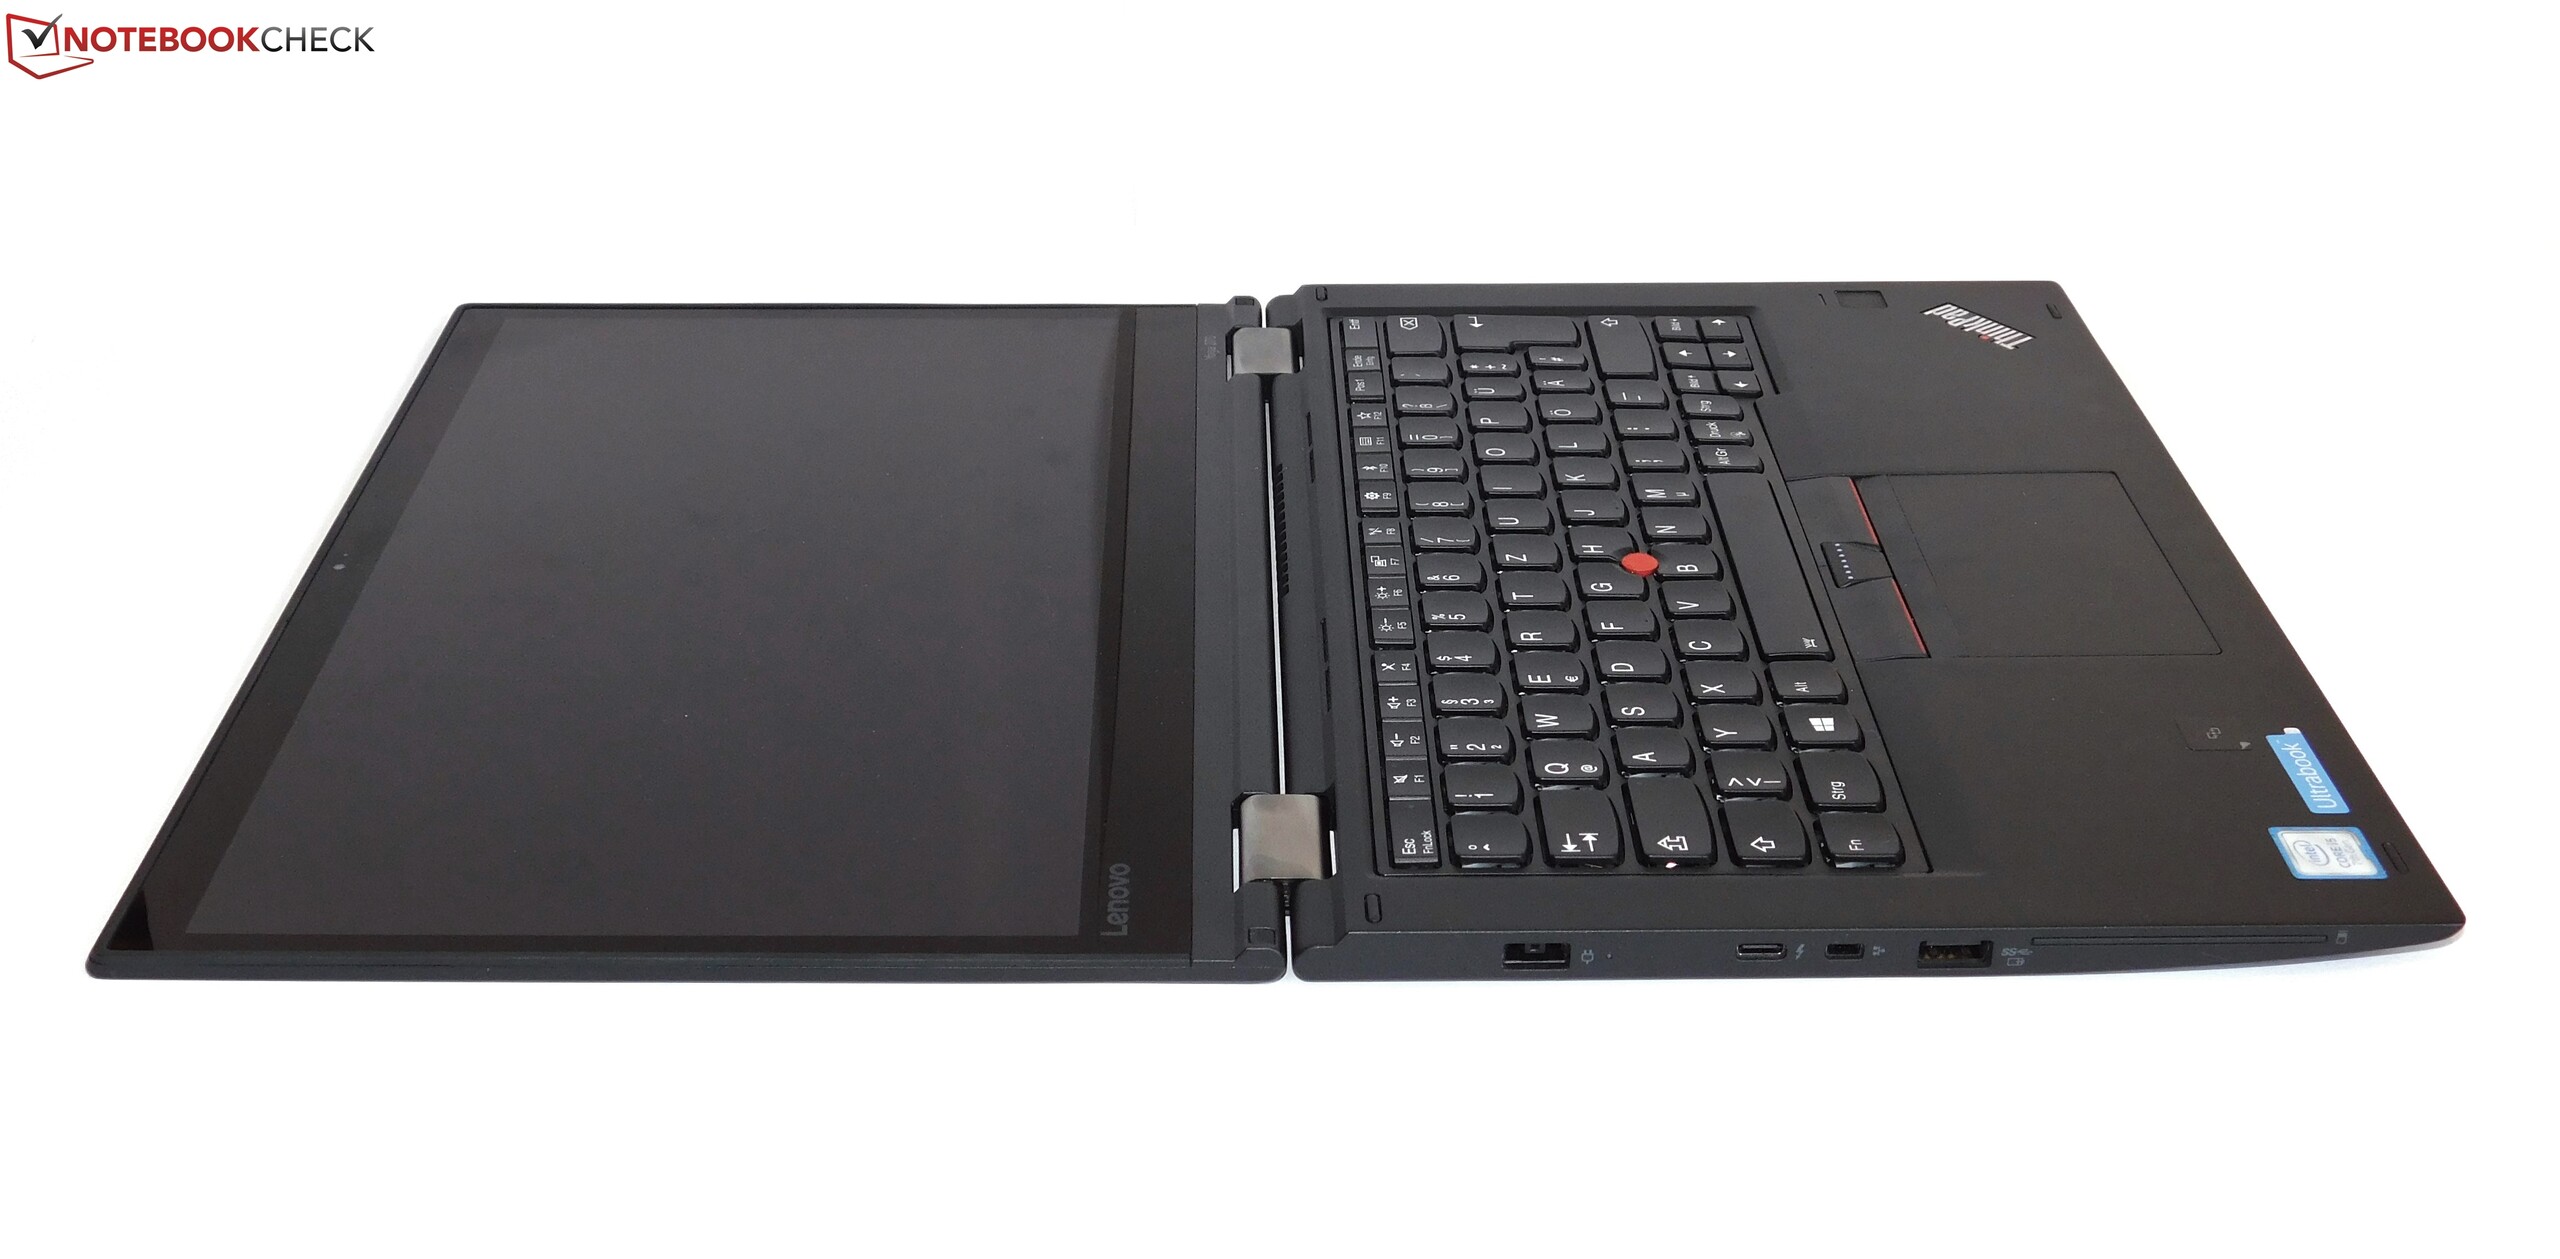
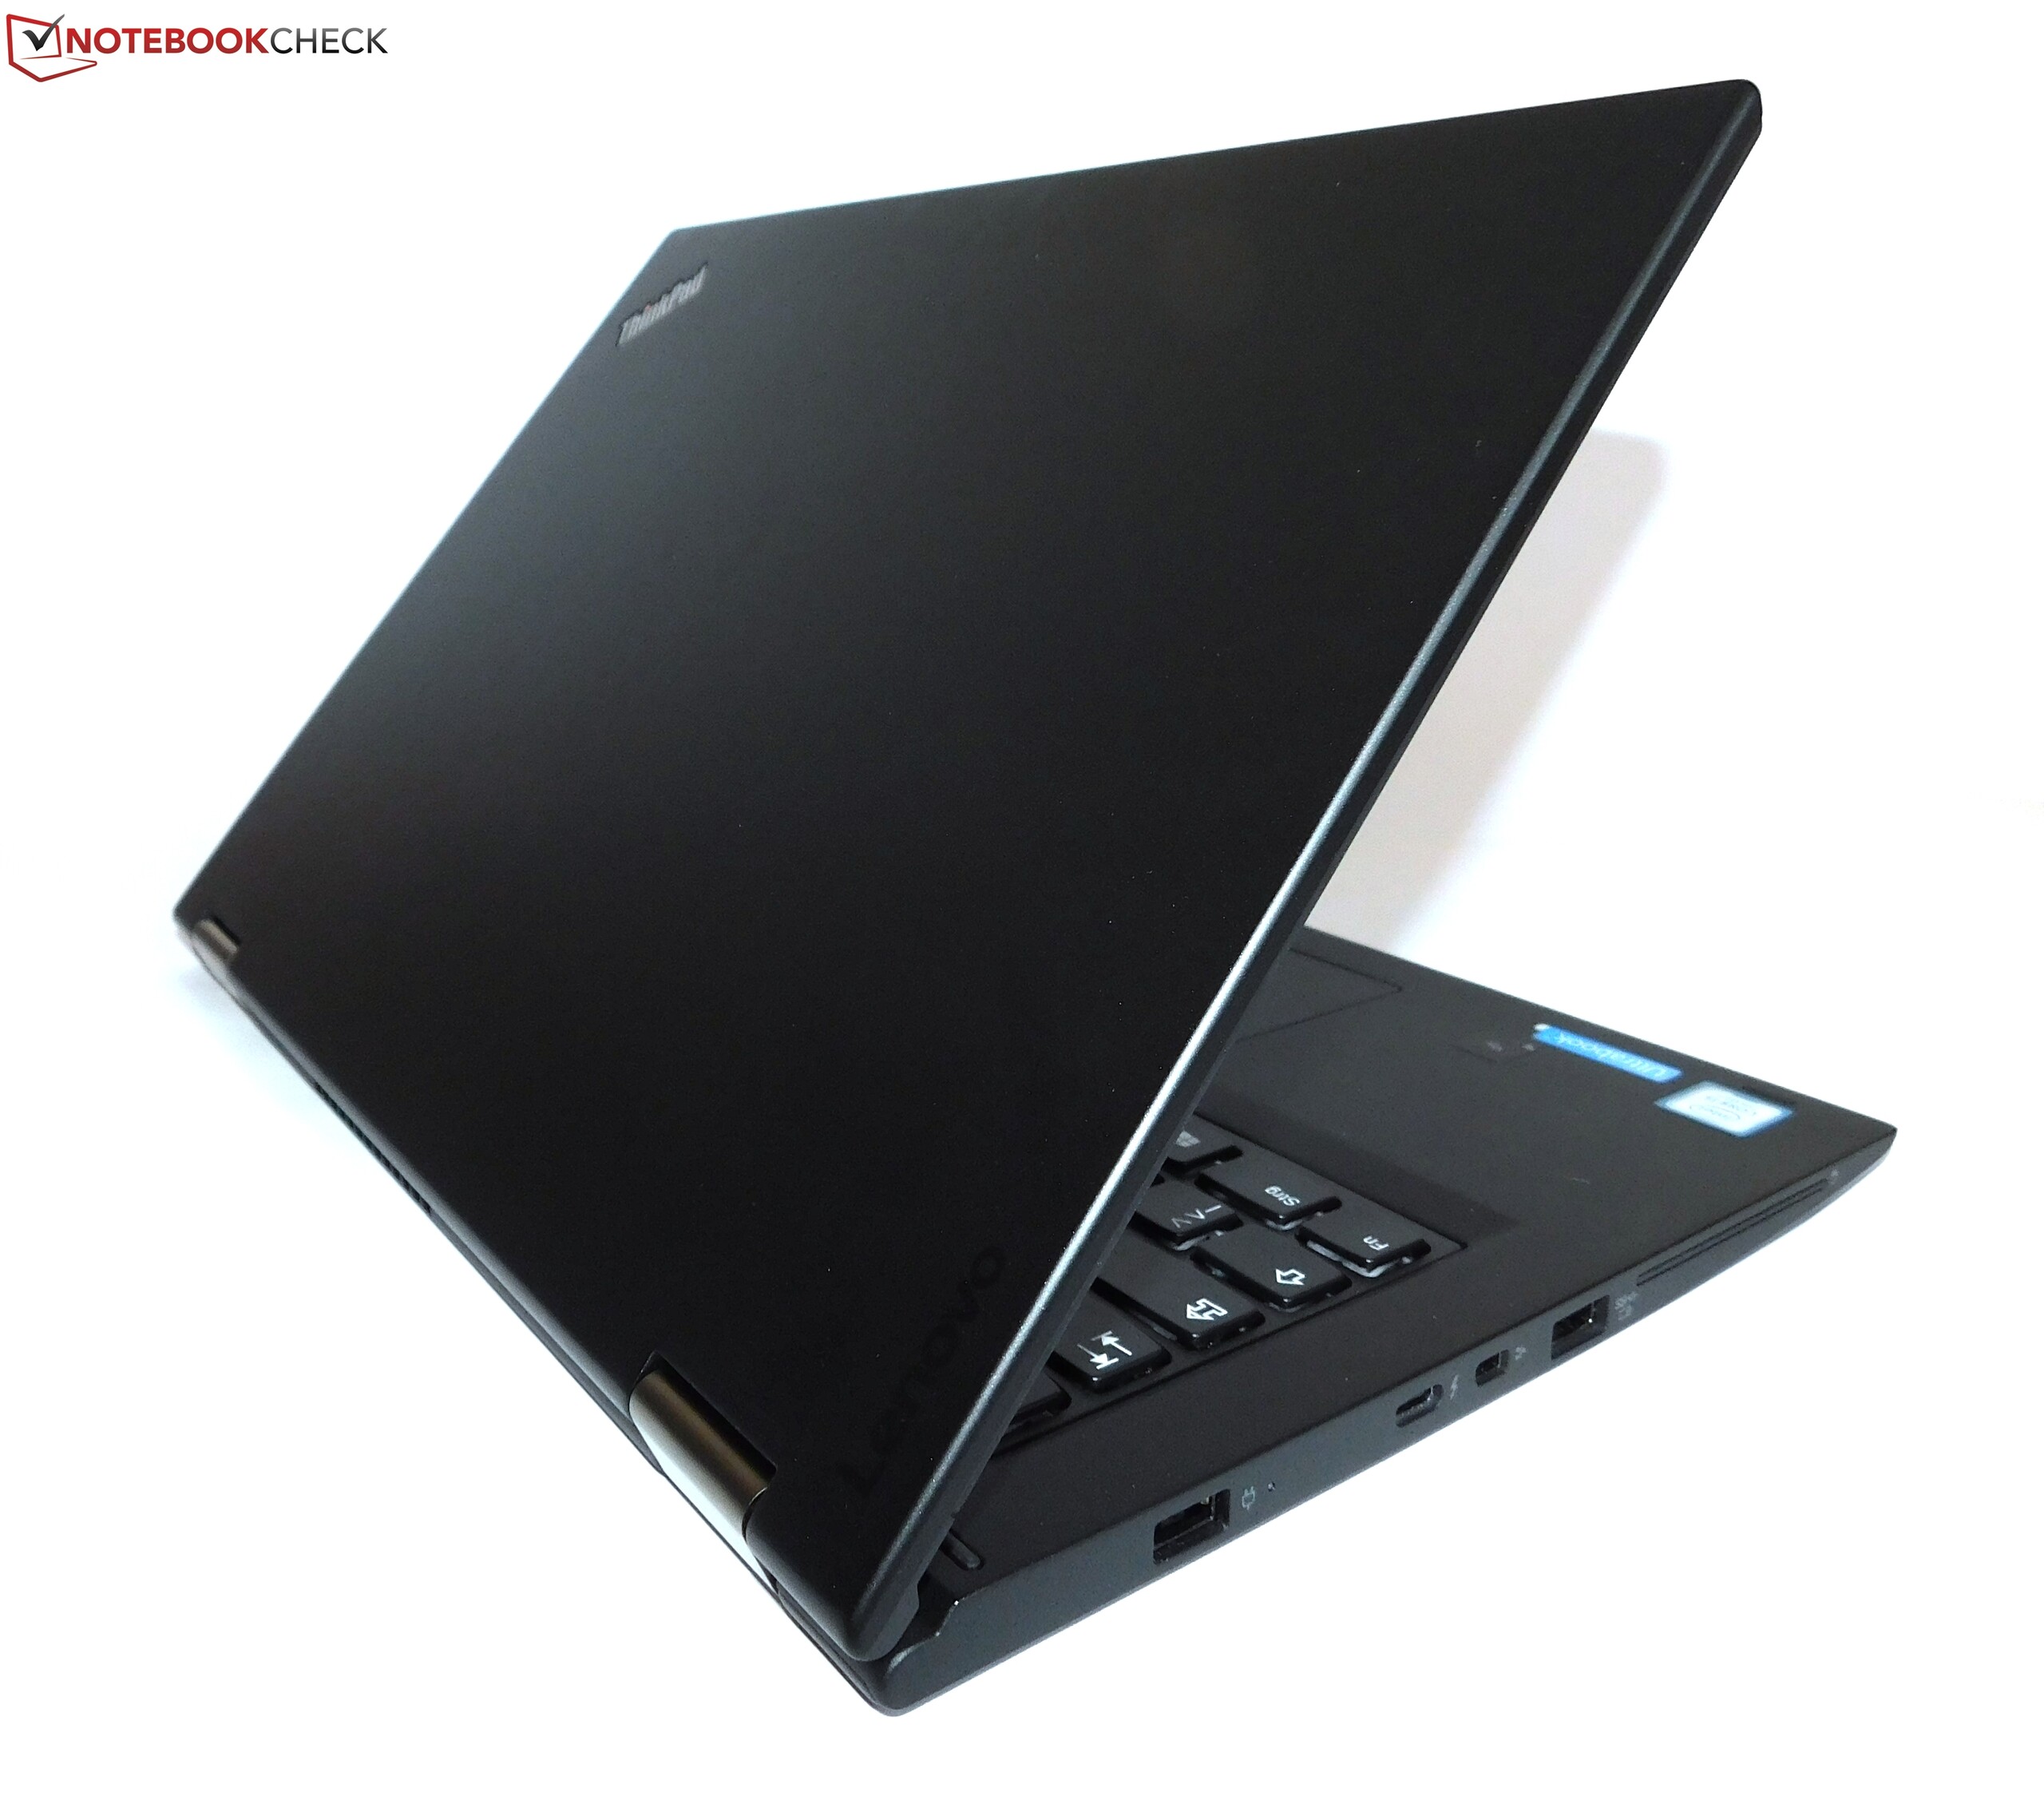
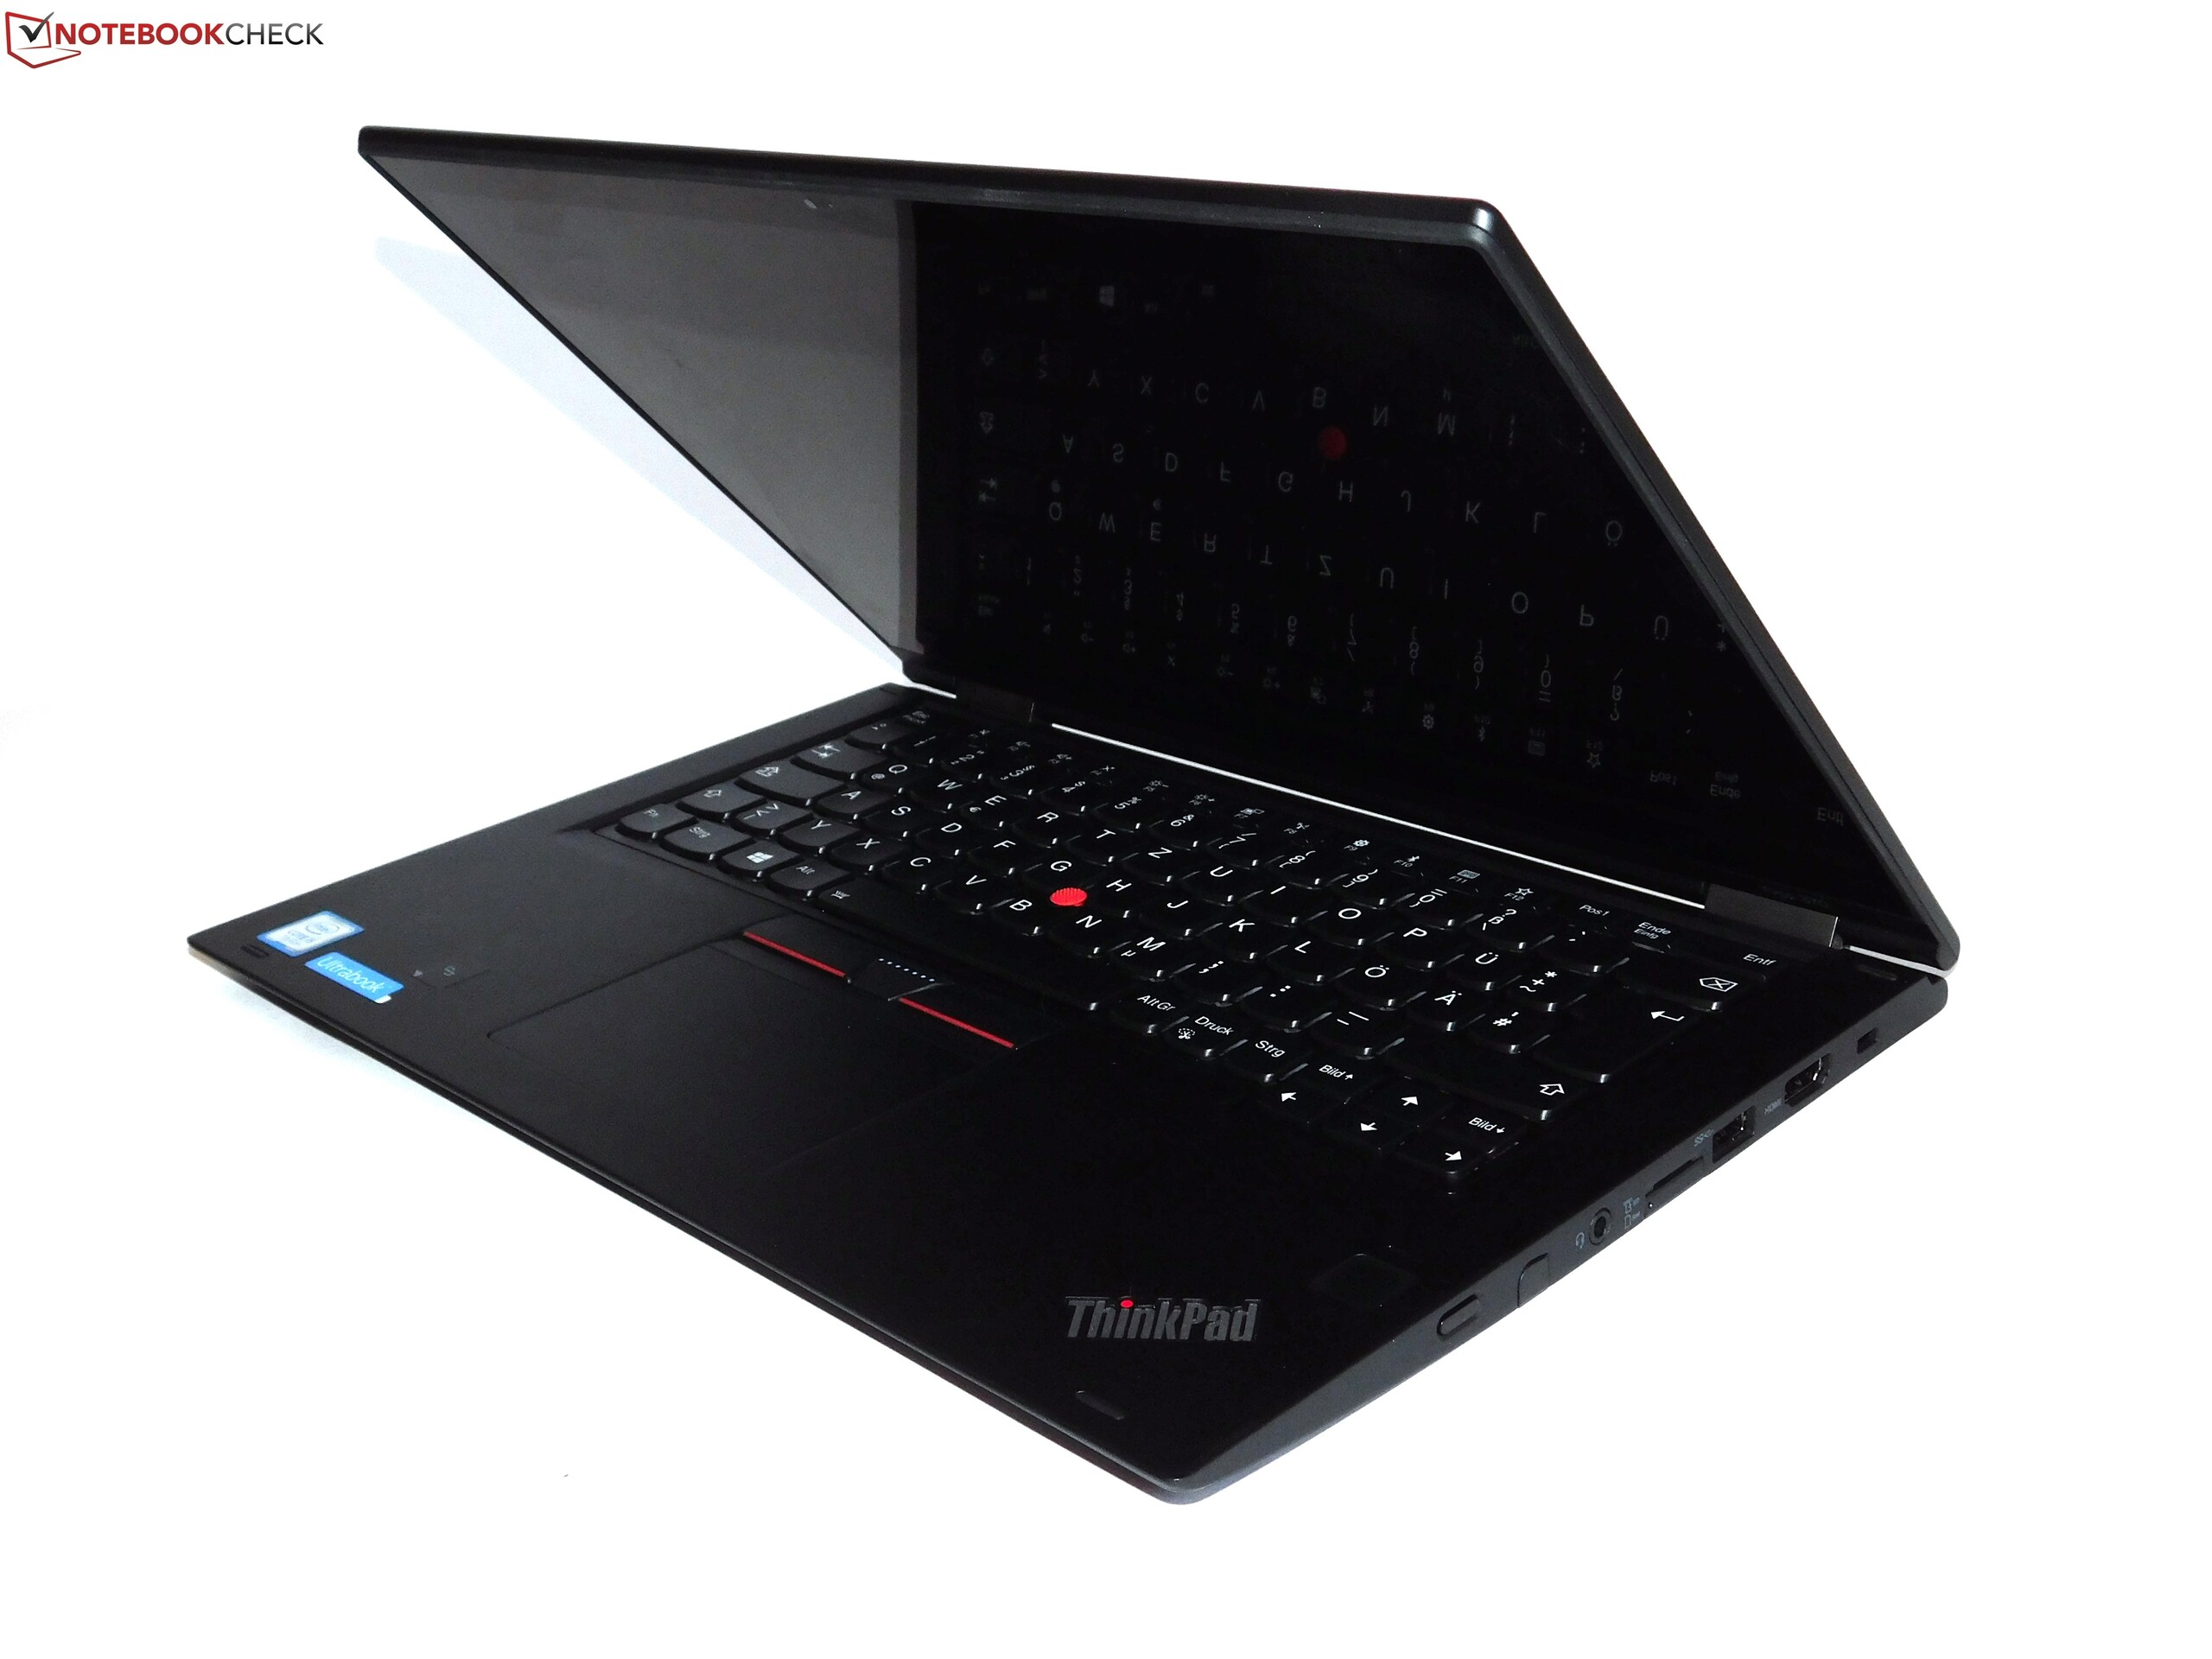
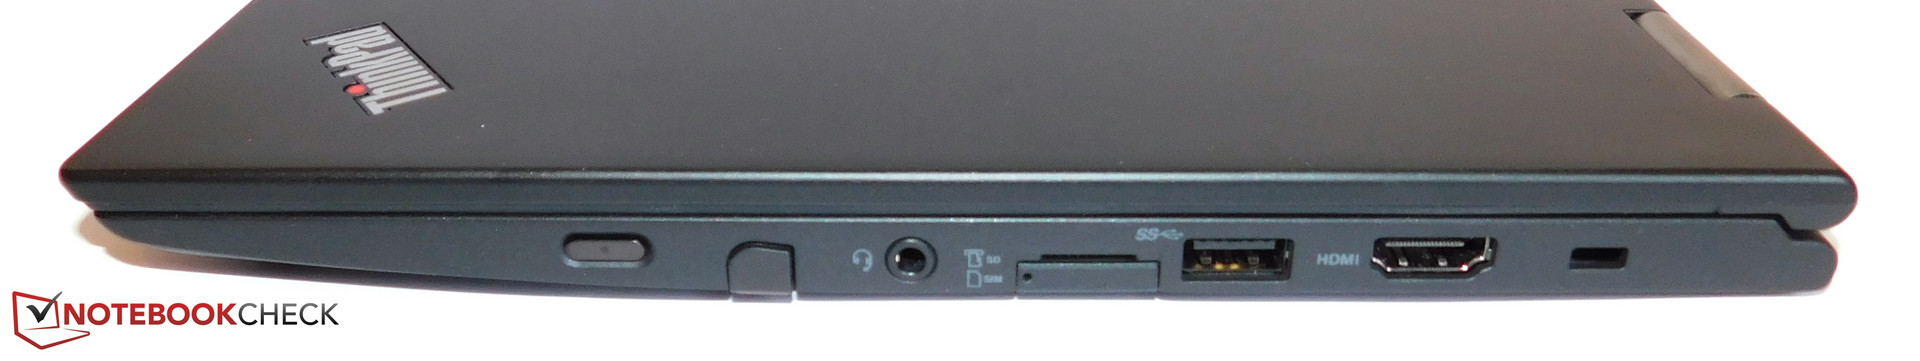
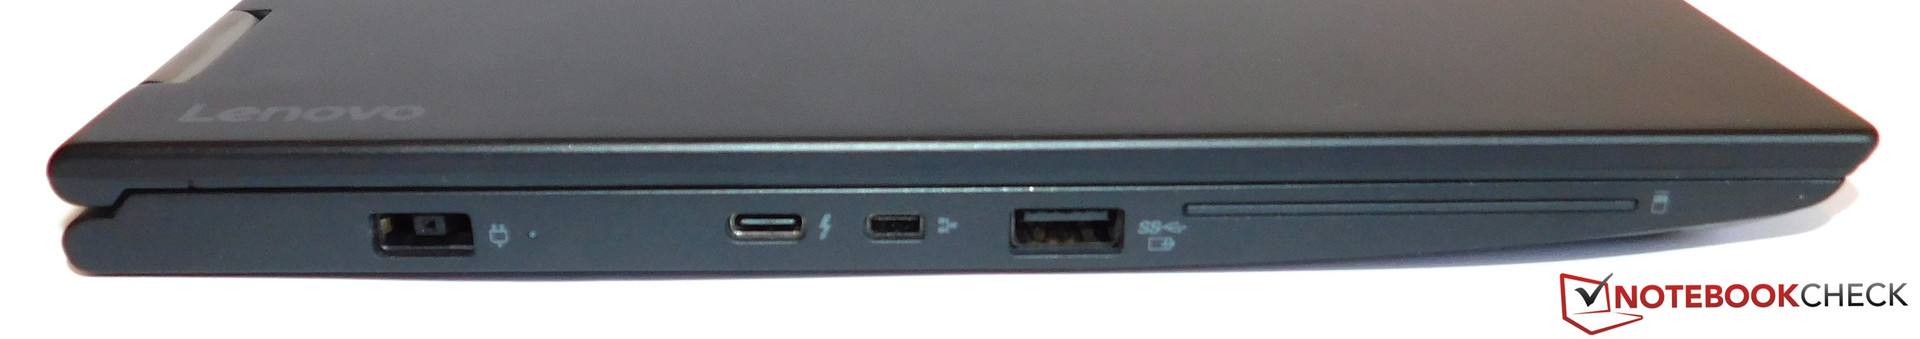
Yoga 370 gör mycket rätt. Tangentbordet och övriga inmatningsenheter, inklusive stylusen, är riktigt bra. Chassit är välgjort, robust och enkelt att plocka isär. Antalet portar är väl tilltaget, även om vi hade föredragit en SD-kortläsare i full storlek. Dessutom har batteritiden förbättrats avsevärt jämfört med Yoga 260. Skärmen är ett av de starkaste försäljningsargumenten för den här bärbara datorn, men tyvärr har den PWM-flimmer vid lägre ljusstyrka.
Kylsystemet lämnar störst utrymme för förbättringar, även om temperaturer och ljudvolym från fläkten inte är lika illa som med X270 från samma tillverkare. Vår testenhet kunde heller inte utnyttja sin maximala prestandapotential, och RAM-begränsningen (endast 8 GB med modem) är minst sagt märklig. Men trots det är prislappen och den korta garantin de mest negativa aspekterna.
På det hela taget är Yoga 370 en mycket bra 2-i-1-maskin med fokus på produktivitet. Datorns närmaste konkurrent, HP EliteBook x360, har också fördelar, nämligen en mycket bättre batteritid. Dock är den också dyr och har en märkbart mörkare skärm, bland annat. Dell XPS 13 2-i-1 är ett annat intressant alternativ där man blir av med fläkten i utbyte mot en del prestanda, som föredrar en fläktlös enhet eftersom den saknar några viktiga affärsfunktioner.
För
Emot

Lenovo has made it easier for us this year. Instead of having to choose between a 12.5 and a 14-inch model all we get is a single 13.3-inch ThinkPad Yoga. We support this change - rather than offering two somewhat disappointing models Lenovo found the perfect balance between display size and mobility. The Yoga 370 ticks a lot of important boxes. The keyboard and its other input devices, including the stylus, are very good. Aside from a minor manufacturing weakness in the display lid, which barely qualifies as quality inconsistency, the case is well-made, sturdy, and it is easy to disassemble. Port availability is generous, although we would have preferred a full-size SD-card reader, and battery life has been improved considerably compared to the Yoga 260. Last but not least, the display is one of the strongest selling points of this laptop and also a noticeable improvement from the Yoga 260 and Yoga 460.
Unfortunately, it suffered from PWM-flickering at lower brightness levels, which is going to be deal-breaker for some users. The cooling system offered the most room for improvement: both temperatures and volume lack refinement but are far from the X270's dramatic levels. Our review unit was also incapable of utilizing its full performance potential, and the RAM limitations (only 8 GB with WWAN) are peculiar, to say the least. Nevertheless, all these issues were overshadowed by the price and the short warranty - two aspects that have nothing to do with the hardware itself.
Well done. The ThinkPad Yoga 370 won us over in many regards and has rightly deserved the highest score of all ThinkPad Yoga devices short of the much more expensive Yoga X1.
On the whole, the Yoga 370 is a very good convertible with a focus on productivity, and it deserves a recommendation. Its closest competitor, the HP EliteBook x360, has its benefits, too, namely the much better battery life. However, it is also more expensive and has a notably darker display to boot. The Dell XPS 13 2-in-1 is interesting for consumers with lower performance expectations preferring a fanless device since it lacks some significant business features. In terms of in-house competition, the ThinkPad X1 Yoga, whose 2017 model we have yet to test, might be an alternative for those with a bigger budget. Its OLED display is phenomenal yet also immensely expensive. The X1 Carbon, which is slightly cheaper than the X1 Yoga, can be an alternative to the Yoga 370 for those users who don’t need a convertible and who prefer a matte display.
Please note: Due to its classification as “Convertible” the ThinkPad Yoga 370 scored just below the “Very Good” level. If it had been classified as an office notebook it would have scored a very good 89%.
Lenovo ThinkPad Yoga 370-20JJS00100
- 04/06/2017 v6 (old)
Benjamin Herzig
Price comparison
