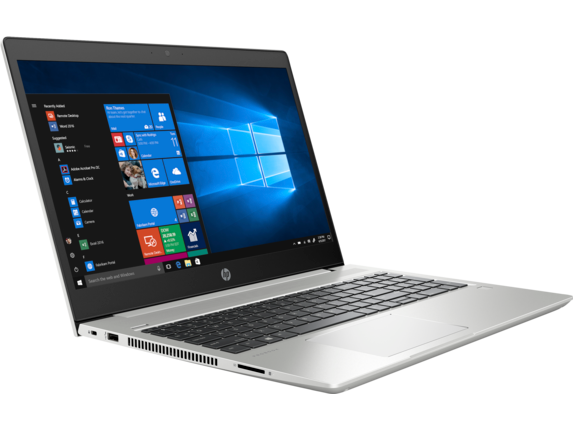
Test: HP ProBook 450 G6 (Core i7-8565U, GeForce MX130) Laptop (Sammanfattning)
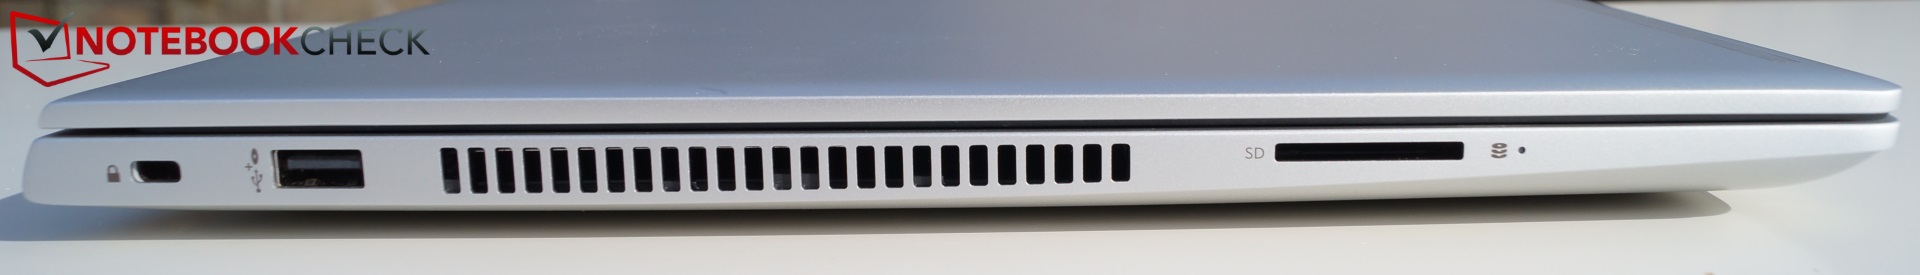
| SD Card Reader | |
| average JPG Copy Test (av. of 3 runs) | |
| Dell Latitude 5590 (Toshiba Exceria Pro SDXC 64 GB UHS-II) | |
| HP ProBook 450 G5-2UB53EA (Toshiba Exceria Pro SDXC 64 GB UHS-II) | |
| HP ProBook 450 G6-5TJ93EA (Toshiba Exceria Pro SDXC 64 GB UHS-II) | |
| Lenovo ThinkPad E580-20KS001RGE (Toshiba Exceria Pro SDXC 64 GB UHS-II) | |
| HP ProBook 650 G4 3UP57EA (Toshiba Exceria Pro M501 microSDXC 64GB) | |
| Genomsnitt av klass Office (22.4 - 198.5, n=22, senaste 2 åren) | |
| Acer TravelMate P2510-G2-MG-50WE (Toshiba Exceria Pro SDXC 64 GB UHS-II) | |
| maximum AS SSD Seq Read Test (1GB) | |
| Dell Latitude 5590 (Toshiba Exceria Pro SDXC 64 GB UHS-II) | |
| HP ProBook 450 G5-2UB53EA (Toshiba Exceria Pro SDXC 64 GB UHS-II) | |
| Lenovo ThinkPad E580-20KS001RGE (Toshiba Exceria Pro SDXC 64 GB UHS-II) | |
| HP ProBook 450 G6-5TJ93EA (Toshiba Exceria Pro SDXC 64 GB UHS-II) | |
| Genomsnitt av klass Office (27.4 - 249, n=20, senaste 2 åren) | |
| HP ProBook 650 G4 3UP57EA (Toshiba Exceria Pro M501 microSDXC 64GB) | |
| Acer TravelMate P2510-G2-MG-50WE (Toshiba Exceria Pro SDXC 64 GB UHS-II) | |
| Networking | |
| iperf3 transmit AX12 | |
| HP ProBook 450 G6-5TJ93EA | |
| Acer TravelMate P2510-G2-MG-50WE | |
| HP ProBook 650 G4 3UP57EA | |
| HP ProBook 450 G5-2UB53EA | |
| Lenovo ThinkPad E580-20KS001RGE | |
| Dell Latitude 5590 | |
| iperf3 receive AX12 | |
| HP ProBook 450 G6-5TJ93EA | |
| HP ProBook 450 G5-2UB53EA | |
| HP ProBook 650 G4 3UP57EA | |
| Acer TravelMate P2510-G2-MG-50WE | |
| Dell Latitude 5590 | |
| Lenovo ThinkPad E580-20KS001RGE | |
| |||||||||||||||||||||||||
Distribution av ljusstyrkan: 88 %
Mitt på batteriet: 244 cd/m²
Kontrast: 1152:1 (Svärta: 0.21 cd/m²)
ΔE ColorChecker Calman: 4.7 | ∀{0.5-29.43 Ø4.73}
calibrated: 4
ΔE Greyscale Calman: 2.7 | ∀{0.09-98 Ø4.97}
64% sRGB (Argyll 1.6.3 3D)
40.8% AdobeRGB 1998 (Argyll 1.6.3 3D)
44.29% AdobeRGB 1998 (Argyll 3D)
64.2% sRGB (Argyll 3D)
42.83% Display P3 (Argyll 3D)
Gamma: 2.26
CCT: 6442 K
| HP ProBook 450 G6-5TJ93EA Chi Mei CMN15FE, , 1920x1080, 15.6" | HP ProBook 450 G5-2UB53EA AUO41ED, , 1920x1080, 15.6" | HP ProBook 650 G4 3UP57EA CMN15D3, , 1920x1080, 15.6" | Acer TravelMate P2510-G2-MG-50WE Chi Mei CMN15D3, , 1920x1080, 15.6" | Lenovo ThinkPad E580-20KS001RGE BOE NV156FHM-N49, , 1920x1080, 15.6" | Dell Latitude 5590 NV15N42, , 1920x1080, 15.6" | Apple MacBook 12 (Early 2016) 1.1 GHz APPA027, , 2304x1440, 12" | |
|---|---|---|---|---|---|---|---|
| Display | -11% | -2% | -1% | -8% | -4% | 53% | |
| Display P3 Coverage (%) | 42.83 | 38.04 -11% | 41.89 -2% | 42.27 -1% | 40 -7% | 41.56 -3% | 66.8 56% |
| sRGB Coverage (%) | 64.2 | 57.3 -11% | 63 -2% | 63.5 -1% | 58.2 -9% | 61.3 -5% | 95.4 49% |
| AdobeRGB 1998 Coverage (%) | 44.29 | 39.31 -11% | 43.28 -2% | 43.69 -1% | 41.32 -7% | 42.93 -3% | 68 54% |
| Response Times | -50% | 6% | -24% | -36% | -59% | -23% | |
| Response Time Grey 50% / Grey 80% * (ms) | 34.4 ? | 52.4 ? -52% | 31 ? 10% | 40 ? -16% | 48 ? -40% | 53.2 ? -55% | 41.2 ? -20% |
| Response Time Black / White * (ms) | 24.4 ? | 36 ? -48% | 24 ? 2% | 32 ? -31% | 32 ? -31% | 39.6 ? -62% | 30.4 ? -25% |
| PWM Frequency (Hz) | 26040 ? | 1000 ? | 25000 ? | 25000 ? | 1000 ? | ||
| Screen | -22% | 4% | 17% | 9% | -15% | 25% | |
| Brightness middle (cd/m²) | 242 | 252 4% | 305 26% | 259 7% | 290 20% | 243 0% | 387 60% |
| Brightness (cd/m²) | 226 | 249 10% | 270 19% | 230 2% | 267 18% | 234 4% | 358 58% |
| Brightness Distribution (%) | 88 | 88 0% | 80 -9% | 82 -7% | 81 -8% | 83 -6% | 88 0% |
| Black Level * (cd/m²) | 0.21 | 0.22 -5% | 0.39 -86% | 0.19 10% | 0.19 10% | 0.19 10% | 0.47 -124% |
| Contrast (:1) | 1152 | 1145 -1% | 782 -32% | 1363 18% | 1526 32% | 1279 11% | 823 -29% |
| Colorchecker dE 2000 * | 4.7 | 6.9 -47% | 3.26 31% | 3.13 33% | 4.9 -4% | 6.6 -40% | 1.6 66% |
| Colorchecker dE 2000 max. * | 18.5 | 18.4 1% | 6.84 63% | 7.81 58% | 9.52 49% | 22.3 -21% | 4 78% |
| Colorchecker dE 2000 calibrated * | 4 | 3.09 23% | 5 -25% | ||||
| Greyscale dE 2000 * | 2.7 | 6.9 -156% | 1.98 27% | 1.42 47% | 2.92 -8% | 5.2 -93% | 1 63% |
| Gamma | 2.26 97% | 2.43 91% | 2.38 92% | 2.36 93% | 2.31 95% | 2.24 98% | 2.26 97% |
| CCT | 6442 101% | 7524 86% | 6540 99% | 6391 102% | 6091 107% | 6990 93% | 6680 97% |
| Color Space (Percent of AdobeRGB 1998) (%) | 40.8 | 36.3 -11% | 40 -2% | 40 -2% | 37 -9% | 39.2 -4% | 61.6 51% |
| Color Space (Percent of sRGB) (%) | 64 | 57.2 -11% | 63 -2% | 63 -2% | 58 -9% | 60.8 -5% | 82.2 28% |
| Totalt genomsnitt (program/inställningar) | -28% /
-23% | 3% /
3% | -3% /
9% | -12% /
-0% | -26% /
-19% | 18% /
24% |
* ... mindre är bättre
Visa svarstider
| ↔ Svarstid svart till vitt | ||
|---|---|---|
| 24.4 ms ... stiga ↗ och falla ↘ kombinerat | ↗ 14.4 ms stiga | 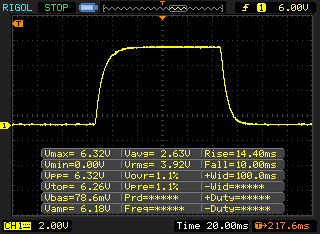 |
| ↘ 10 ms hösten | ||
| Skärmen visar bra svarsfrekvens i våra tester, men kan vara för långsam för konkurrenskraftiga spelare. I jämförelse sträcker sig alla testade enheter från 0.1 (minst) till 240 (maximalt) ms. » 57 % av alla enheter är bättre. Detta innebär att den uppmätta svarstiden är sämre än genomsnittet av alla testade enheter (19.9 ms). | ||
| ↔ Svarstid 50 % grått till 80 % grått | ||
| 34.4 ms ... stiga ↗ och falla ↘ kombinerat | ↗ 17.2 ms stiga | 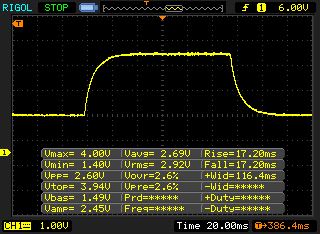 |
| ↘ 17.2 ms hösten | ||
| Skärmen visar långsamma svarsfrekvenser i våra tester och kommer att vara otillfredsställande för spelare. I jämförelse sträcker sig alla testade enheter från 0.165 (minst) till 636 (maximalt) ms. » 48 % av alla enheter är bättre. Detta innebär att den uppmätta svarstiden är sämre än genomsnittet av alla testade enheter (31.1 ms). | ||
Skärmflimmer / PWM (Puls-Width Modulation)
| Skärmflimmer / PWM upptäckt | 26040 Hz | ≤ 40 % ljusstyrka inställning | 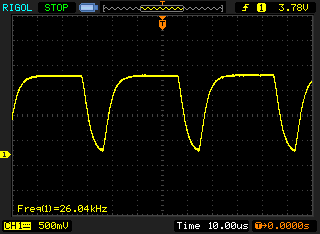 |
Displayens bakgrundsbelysning flimrar vid 26040 Hz (i värsta fall, t.ex. med PWM) Flimrande upptäckt vid en ljusstyrkeinställning på 40 % och lägre. Det ska inte finnas något flimmer eller PWM över denna ljusstyrkeinställning. Frekvensen för 26040 Hz är ganska hög, så de flesta användare som är känsliga för PWM bör inte märka något flimmer. Som jämförelse: 52 % av alla testade enheter använder inte PWM för att dämpa skärmen. Om PWM upptäcktes mättes ett medelvärde av 7801 (minst: 5 - maximum: 343500) Hz. | |||
| Cinebench R15 | |
| CPU Single 64Bit | |
| Genomsnitt av klass Office (99.5 - 312, n=74, senaste 2 åren) | |
| Genomsnitt Intel Core i7-8565U (138.3 - 193, n=51) | |
| Lenovo ThinkPad E580-20KS001RGE | |
| HP ProBook 450 G5-2UB53EA | |
| Dell Latitude 5590 | |
| HP ProBook 650 G4 3UP57EA | |
| Acer TravelMate P2510-G2-MG-50WE | |
| HP ProBook 450 G6-5TJ93EA | |
| CPU Multi 64Bit | |
| Genomsnitt av klass Office (250 - 3380, n=74, senaste 2 åren) | |
| Dell Latitude 5590 | |
| Genomsnitt Intel Core i7-8565U (452 - 815, n=52) | |
| HP ProBook 650 G4 3UP57EA | |
| HP ProBook 450 G5-2UB53EA | |
| HP ProBook 450 G6-5TJ93EA | |
| Acer TravelMate P2510-G2-MG-50WE | |
| Lenovo ThinkPad E580-20KS001RGE | |
| Cinebench R11.5 | |
| CPU Single 64Bit | |
| Genomsnitt av klass Office (2 - 3.6, n=13, senaste 2 åren) | |
| HP ProBook 450 G6-5TJ93EA | |
| Genomsnitt Intel Core i7-8565U (0.65 - 2.16, n=11) | |
| Dell Latitude 5590 | |
| CPU Multi 64Bit | |
| Genomsnitt av klass Office (9.76 - 31.5, n=13, senaste 2 åren) | |
| Dell Latitude 5590 | |
| Genomsnitt Intel Core i7-8565U (4.09 - 7.4, n=11) | |
| HP ProBook 450 G6-5TJ93EA | |
| Cinebench R10 | |
| Rendering Single CPUs 64Bit | |
| Genomsnitt av klass Office (11106 - 15443, n=6, senaste 2 åren) | |
| HP ProBook 450 G6-5TJ93EA | |
| Dell Latitude 5590 | |
| Genomsnitt Intel Core i7-8565U (5474 - 9435, n=6) | |
| Rendering Multiple CPUs 64Bit | |
| Genomsnitt av klass Office (48700 - 76704, n=6, senaste 2 åren) | |
| Dell Latitude 5590 | |
| Genomsnitt Intel Core i7-8565U (14542 - 26851, n=6) | |
| HP ProBook 450 G6-5TJ93EA | |
| PCMark 8 | |
| Home Score Accelerated v2 | |
| Genomsnitt av klass Office (n=1senaste 2 åren) | |
| Lenovo ThinkPad E580-20KS001RGE | |
| HP ProBook 450 G5-2UB53EA | |
| Dell Latitude 5590 | |
| HP ProBook 650 G4 3UP57EA | |
| Acer TravelMate P2510-G2-MG-50WE | |
| HP ProBook 450 G6-5TJ93EA | |
| Genomsnitt Intel Core i7-8565U, NVIDIA GeForce MX130 (n=1) | |
| Work Score Accelerated v2 | |
| Genomsnitt av klass Office (n=1senaste 2 åren) | |
| Lenovo ThinkPad E580-20KS001RGE | |
| HP ProBook 450 G6-5TJ93EA | |
| Genomsnitt Intel Core i7-8565U, NVIDIA GeForce MX130 (n=1) | |
| HP ProBook 650 G4 3UP57EA | |
| Acer TravelMate P2510-G2-MG-50WE | |
| Dell Latitude 5590 | |
| PCMark 8 Home Score Accelerated v2 | 3457 poäng | |
| PCMark 8 Work Score Accelerated v2 | 5033 poäng | |
| PCMark 10 Score | 3668 poäng | |
Hjälp | ||
| HP ProBook 450 G6-5TJ93EA Samsung SSD PM981 MZVLB512HAJQ | HP ProBook 450 G5-2UB53EA SanDisk SD8SN8U256G1006 | HP ProBook 650 G4 3UP57EA Toshiba XG5 KXG50ZNV256G | Acer TravelMate P2510-G2-MG-50WE SK Hynix HFS256G39TND-N210A | Lenovo ThinkPad E580-20KS001RGE Lenovo LENSE20256GMSP34MEAT2TA | Dell Latitude 5590 SK hynix SC311 M.2 | Genomsnitt Samsung SSD PM981 MZVLB512HAJQ | |
|---|---|---|---|---|---|---|---|
| CrystalDiskMark 5.2 / 6 | -58% | -37% | -62% | -41% | -54% | -0% | |
| Write 4K (MB/s) | 126.1 | 51.6 -59% | 89.7 -29% | 71.8 -43% | 86.1 -32% | 76.7 -39% | 126.7 ? 0% |
| Read 4K (MB/s) | 43.92 | 27.1 -38% | 30.73 -30% | 21.23 -52% | 36.81 -16% | 28.41 -35% | 44 ? 0% |
| Write Seq (MB/s) | 1669 | 471.6 -72% | 385.3 -77% | 257.1 -85% | 845 -49% | 436.7 -74% | 1617 ? -3% |
| Read Seq (MB/s) | 2224 | 499.3 -78% | 1986 -11% | 476.3 -79% | 1268 -43% | 508 -77% | 1716 ? -23% |
| Write 4K Q32T1 (MB/s) | 410.4 | 283.2 -31% | 339.9 -17% | 202.6 -51% | 161.1 -61% | 288.1 -30% | 413 ? 1% |
| Read 4K Q32T1 (MB/s) | 338.1 | 257.9 -24% | 241.7 -29% | 282 -17% | 249.6 -26% | 271.9 -20% | 420 ? 24% |
| Write Seq Q32T1 (MB/s) | 1979 | 476.6 -76% | 345.2 -83% | 265.6 -87% | 1034 -48% | 503 -75% | 2076 ? 5% |
| Read Seq Q32T1 (MB/s) | 3368 | 533 -84% | 2759 -18% | 559 -83% | 1732 -49% | 549 -84% | 3130 ? -7% |
| Write 4K Q8T8 (MB/s) | 4.686 | 1264 ? | |||||
| Read 4K Q8T8 (MB/s) | 452.5 | 1193 ? | |||||
| AS SSD | -75% | -48% | -66% | -71% | -63% | 17% | |
| Seq Read (MB/s) | 2063 | 433.2 -79% | 1542 -25% | 487.3 -76% | 1315 -36% | 503 -76% | 1976 ? -4% |
| Seq Write (MB/s) | 1163 | 363.6 -69% | 362.7 -69% | 250.6 -78% | 770 -34% | 393 -66% | 1637 ? 41% |
| 4K Read (MB/s) | 50.6 | 25.58 -49% | 29.81 -41% | 27.61 -45% | 31.54 -38% | 29.03 -43% | 50.5 ? 0% |
| 4K Write (MB/s) | 125.4 | 48.17 -62% | 94.9 -24% | 72.1 -43% | 68.5 -45% | 73.5 -41% | 112 ? -11% |
| 4K-64 Read (MB/s) | 1352 | 338.3 -75% | 408.5 -70% | 375.9 -72% | 419 -69% | 306 -77% | 1203 ? -11% |
| 4K-64 Write (MB/s) | 1023 | 144.1 -86% | 327.6 -68% | 202.1 -80% | 91.6 -91% | 212.7 -79% | 1504 ? 47% |
| Access Time Read * (ms) | 0.044 | 0.145 -230% | 0.079 -80% | 0.08 -82% | 0.176 -300% | 0.111 -152% | 0.05092 ? -16% |
| Access Time Write * (ms) | 0.182 | 0.092 49% | 0.054 70% | 0.233 -28% | 0.173 5% | 0.047 74% | 0.08337 ? 54% |
| Score Read (Points) | 1608 | 407 -75% | 592 -63% | 452 -72% | 582 -64% | 385 -76% | 1451 ? -10% |
| Score Write (Points) | 1265 | 229 -82% | 459 -64% | 299 -76% | 237 -81% | 326 -74% | 1780 ? 41% |
| Score Total (Points) | 3658 | 849 -77% | 1303 -64% | 980 -73% | 1099 -70% | 912 -75% | 3966 ? 8% |
| Copy ISO MB/s (MB/s) | 1382 | 284.6 -79% | 369.5 -73% | 908 -34% | 311.5 -77% | 1755 ? 27% | |
| Copy Program MB/s (MB/s) | 414.3 | 122.4 -70% | 246.7 -40% | 174 -58% | 208.6 -50% | 454 ? 10% | |
| Copy Game MB/s (MB/s) | 660 | 182.2 -72% | 286.1 -57% | 132.7 -80% | 210 -68% | 1057 ? 60% | |
| Totalt genomsnitt (program/inställningar) | -67% /
-69% | -43% /
-44% | -64% /
-64% | -56% /
-60% | -59% /
-60% | 9% /
11% |
* ... mindre är bättre

| 3DMark 11 - 1280x720 Performance GPU | |
| Genomsnitt av klass Office (2551 - 18313, n=68, senaste 2 åren) | |
| Lenovo ThinkPad E580-20KS001RGE | |
| HP ProBook 450 G6-5TJ93EA | |
| Genomsnitt NVIDIA GeForce MX130 (2476 - 3203, n=14) | |
| Acer TravelMate P2510-G2-MG-50WE | |
| HP ProBook 650 G4 3UP57EA | |
| Dell Latitude 5590 | |
| HP ProBook 450 G5-2UB53EA | |
| 3DMark | |
| 1280x720 Cloud Gate Standard Graphics | |
| Genomsnitt av klass Office (11640 - 118515, n=37, senaste 2 åren) | |
| Lenovo ThinkPad E580-20KS001RGE | |
| HP ProBook 450 G6-5TJ93EA | |
| Genomsnitt NVIDIA GeForce MX130 (12166 - 14880, n=13) | |
| Acer TravelMate P2510-G2-MG-50WE | |
| HP ProBook 650 G4 3UP57EA | |
| Dell Latitude 5590 | |
| HP ProBook 450 G5-2UB53EA | |
| 1920x1080 Fire Strike Graphics | |
| Genomsnitt av klass Office (736 - 21871, n=72, senaste 2 åren) | |
| Lenovo ThinkPad E580-20KS001RGE | |
| HP ProBook 450 G6-5TJ93EA | |
| Genomsnitt NVIDIA GeForce MX130 (2149 - 2495, n=13) | |
| Acer TravelMate P2510-G2-MG-50WE | |
| HP ProBook 650 G4 3UP57EA | |
| Dell Latitude 5590 | |
| HP ProBook 450 G5-2UB53EA | |
| 3DMark 11 Performance | 3122 poäng | |
| 3DMark Cloud Gate Standard Score | 10308 poäng | |
| 3DMark Fire Strike Score | 2226 poäng | |
Hjälp | ||
| Rise of the Tomb Raider | |
| 1024x768 Lowest Preset | |
| Acer TravelMate P2510-G2-MG-50WE | |
| Lenovo ThinkPad E580-20KS001RGE | |
| Genomsnitt NVIDIA GeForce MX130 (30.7 - 51.2, n=8) | |
| HP ProBook 450 G6-5TJ93EA | |
| 1366x768 Medium Preset AF:2x | |
| Lenovo ThinkPad E580-20KS001RGE | |
| Acer TravelMate P2510-G2-MG-50WE | |
| Genomsnitt NVIDIA GeForce MX130 (22.5 - 31.3, n=8) | |
| HP ProBook 450 G6-5TJ93EA | |
| 1920x1080 High Preset AA:FX AF:4x | |
| Lenovo ThinkPad E580-20KS001RGE | |
| Acer TravelMate P2510-G2-MG-50WE | |
| Genomsnitt NVIDIA GeForce MX130 (13.2 - 16.9, n=8) | |
| HP ProBook 450 G6-5TJ93EA | |
| 1920x1080 Very High Preset AA:FX AF:16x | |
| Acer TravelMate P2510-G2-MG-50WE | |
| Genomsnitt NVIDIA GeForce MX130 (12.1 - 14, n=7) | |
| HP ProBook 450 G6-5TJ93EA | |
| BioShock Infinite | |
| 1280x720 Very Low Preset | |
| Lenovo ThinkPad E580-20KS001RGE | |
| HP ProBook 450 G6-5TJ93EA | |
| Genomsnitt NVIDIA GeForce MX130 (83.6 - 152.6, n=10) | |
| HP ProBook 650 G4 3UP57EA | |
| HP ProBook 450 G5-2UB53EA | |
| Dell Latitude 5590 | |
| 1366x768 Medium Preset | |
| Lenovo ThinkPad E580-20KS001RGE | |
| HP ProBook 450 G6-5TJ93EA | |
| Genomsnitt NVIDIA GeForce MX130 (57.3 - 84.5, n=10) | |
| Dell Latitude 5590 | |
| HP ProBook 650 G4 3UP57EA | |
| HP ProBook 450 G5-2UB53EA | |
| 1366x768 High Preset | |
| Lenovo ThinkPad E580-20KS001RGE | |
| HP ProBook 450 G6-5TJ93EA | |
| Genomsnitt NVIDIA GeForce MX130 (48 - 69, n=10) | |
| Dell Latitude 5590 | |
| HP ProBook 650 G4 3UP57EA | |
| HP ProBook 450 G5-2UB53EA | |
| 1920x1080 Ultra Preset, DX11 (DDOF) | |
| Genomsnitt NVIDIA GeForce MX130 (22 - 48.7, n=10) | |
| HP ProBook 450 G6-5TJ93EA | |
| Lenovo ThinkPad E580-20KS001RGE | |
| HP ProBook 650 G4 3UP57EA | |
| Dell Latitude 5590 | |
| låg | med. | hög | ultra | |
|---|---|---|---|---|
| BioShock Infinite (2013) | 134.3 | 73.7 | 63.4 | 23.7 |
| The Witcher 3 (2015) | 26.1 | 21.3 | 10.6 | 7 |
| Dota 2 Reborn (2015) | 27.8 | 23.1 | 22.9 | 21 |
| Rise of the Tomb Raider (2016) | 30.7 | 23.6 | 14.4 | 12.4 |
Ljudnivå
| Låg belastning |
| 29 / 29 / 29 dB(A) |
| Hårddisk |
| 29.4 dB(A) |
| Hög belastning |
| 34.2 / 38.4 dB(A) |
 | ||
30 dB tyst 40 dB(A) hörbar 50 dB(A) högt ljud |
||
min: | ||
| HP ProBook 450 G6-5TJ93EA GeForce MX130, i7-8565U, Samsung SSD PM981 MZVLB512HAJQ | HP ProBook 450 G5-2UB53EA UHD Graphics 620, i5-8250U, SanDisk SD8SN8U256G1006 | HP ProBook 650 G4 3UP57EA UHD Graphics 620, i5-8250U, Toshiba XG5 KXG50ZNV256G | Acer TravelMate P2510-G2-MG-50WE GeForce MX130, i5-8250U, SK Hynix HFS256G39TND-N210A | Lenovo ThinkPad E580-20KS001RGE Radeon RX 550 (Laptop), i5-8550U, Lenovo LENSE20256GMSP34MEAT2TA | Dell Latitude 5590 UHD Graphics 620, i5-8250U, SK hynix SC311 M.2 | |
|---|---|---|---|---|---|---|
| Noise | 4% | -8% | -4% | -5% | -4% | |
| av / miljö * (dB) | 29 | 29.1 -0% | 30.3 -4% | 30.3 -4% | 30.1 -4% | 29 -0% |
| Idle Minimum * (dB) | 29 | 29.1 -0% | 32 -10% | 30.3 -4% | 30.1 -4% | 29 -0% |
| Idle Average * (dB) | 29 | 29.1 -0% | 33.8 -17% | 30.3 -4% | 30.1 -4% | 29 -0% |
| Idle Maximum * (dB) | 29 | 29.1 -0% | 34.2 -18% | 31 -7% | 31.6 -9% | 31.3 -8% |
| Load Average * (dB) | 34.2 | 31.4 8% | 36.2 -6% | 35.6 -4% | 37.7 -10% | 36.6 -7% |
| Witcher 3 ultra * (dB) | 34.2 | |||||
| Load Maximum * (dB) | 38.4 | 32 17% | 35.6 7% | 38.6 -1% | 38 1% | 40.9 -7% |
* ... mindre är bättre
| HP ProBook 450 G6-5TJ93EA GeForce MX130, i7-8565U, Samsung SSD PM981 MZVLB512HAJQ | HP ProBook 450 G5-2UB53EA UHD Graphics 620, i5-8250U, SanDisk SD8SN8U256G1006 | HP ProBook 650 G4 3UP57EA UHD Graphics 620, i5-8250U, Toshiba XG5 KXG50ZNV256G | Acer TravelMate P2510-G2-MG-50WE GeForce MX130, i5-8250U, SK Hynix HFS256G39TND-N210A | Lenovo ThinkPad E580-20KS001RGE Radeon RX 550 (Laptop), i5-8550U, Lenovo LENSE20256GMSP34MEAT2TA | Dell Latitude 5590 UHD Graphics 620, i5-8250U, SK hynix SC311 M.2 | |
|---|---|---|---|---|---|---|
| Heat | -1% | 1% | -11% | -30% | 3% | |
| Maximum Upper Side * (°C) | 39.4 | 42.2 -7% | 35.7 9% | 49 -24% | 60 -52% | 36.6 7% |
| Maximum Bottom * (°C) | 50.2 | 45.5 9% | 33.8 33% | 47.4 6% | 57 -14% | 47.5 5% |
| Idle Upper Side * (°C) | 22.9 | 23.9 -4% | 28.4 -24% | 26.6 -16% | 29.1 -27% | 23.2 -1% |
| Idle Bottom * (°C) | 24.1 | 24.2 -0% | 27.4 -14% | 26.7 -11% | 30.2 -25% | 24.2 -0% |
* ... mindre är bättre
(+) Den maximala temperaturen på ovansidan är 39.4 °C / 103 F, jämfört med genomsnittet av 34.3 °C / 94 F , allt från 21.2 till 62.5 °C för klassen Office.
(-) Botten värms upp till maximalt 50.2 °C / 122 F, jämfört med genomsnittet av 36.8 °C / 98 F
(+) Vid tomgångsbruk är medeltemperaturen för ovansidan 22.5 °C / 73 F, jämfört med enhetsgenomsnittet på 29.5 °C / ### class_avg_f### F.
(±) När du spelar The Witcher 3 är medeltemperaturen för ovansidan 34.9 °C / 95 F, jämfört med enhetsgenomsnittet på 29.5 °C / ## #class_avg_f### F.
(+) Handledsstöden och pekplattan är kallare än hudtemperaturen med maximalt 30.5 °C / 86.9 F och är därför svala att ta på.
(-) Medeltemperaturen för handledsstödsområdet på liknande enheter var 27.5 °C / 81.5 F (-3 °C / -5.4 F).
HP ProBook 450 G6-5TJ93EA ljudanalys
(±) | högtalarljudstyrkan är genomsnittlig men bra (74.4 dB)
Bas 100 - 315 Hz
(-) | nästan ingen bas - i genomsnitt 21.8% lägre än medianen
(±) | linjäriteten för basen är genomsnittlig (10.6% delta till föregående frekvens)
Mellan 400 - 2000 Hz
(±) | högre mellan - i genomsnitt 5.6% högre än median
(±) | linjäriteten för mids är genomsnittlig (7.7% delta till föregående frekvens)
Högsta 2 - 16 kHz
(±) | högre toppar - i genomsnitt 5.1% högre än medianen
(+) | toppar är linjära (4.6% delta till föregående frekvens)
Totalt 100 - 16 000 Hz
(±) | linjäriteten för det totala ljudet är genomsnittlig (27.1% skillnad mot median)
Jämfört med samma klass
» 84% av alla testade enheter i den här klassen var bättre, 5% liknande, 11% sämre
» Den bästa hade ett delta på 7%, genomsnittet var 21%, sämst var 53%
Jämfört med alla testade enheter
» 83% av alla testade enheter var bättre, 4% liknande, 14% sämre
» Den bästa hade ett delta på 4%, genomsnittet var 24%, sämst var 134%
Apple MacBook 12 (Early 2016) 1.1 GHz ljudanalys
(+) | högtalare kan spela relativt högt (83.6 dB)
Bas 100 - 315 Hz
(±) | reducerad bas - i genomsnitt 11.3% lägre än medianen
(±) | linjäriteten för basen är genomsnittlig (14.2% delta till föregående frekvens)
Mellan 400 - 2000 Hz
(+) | balanserad mellan - endast 2.4% från medianen
(+) | mids är linjära (5.5% delta till föregående frekvens)
Högsta 2 - 16 kHz
(+) | balanserade toppar - endast 2% från medianen
(+) | toppar är linjära (4.5% delta till föregående frekvens)
Totalt 100 - 16 000 Hz
(+) | det totala ljudet är linjärt (10.2% skillnad mot median)
Jämfört med samma klass
» 7% av alla testade enheter i den här klassen var bättre, 2% liknande, 91% sämre
» Den bästa hade ett delta på 5%, genomsnittet var 18%, sämst var 53%
Jämfört med alla testade enheter
» 5% av alla testade enheter var bättre, 1% liknande, 94% sämre
» Den bästa hade ett delta på 4%, genomsnittet var 24%, sämst var 134%
| Av/Standby | |
| Låg belastning | |
| Hög belastning |
|
Förklaring:
min: | |
| HP ProBook 450 G6-5TJ93EA i7-8565U, GeForce MX130, Samsung SSD PM981 MZVLB512HAJQ, IPS, 1920x1080, 15.6" | HP ProBook 450 G5-2UB53EA i5-8250U, UHD Graphics 620, SanDisk SD8SN8U256G1006, IPS LED, 1920x1080, 15.6" | HP ProBook 650 G4 3UP57EA i5-8250U, UHD Graphics 620, Toshiba XG5 KXG50ZNV256G, IPS LED, 1920x1080, 15.6" | Acer TravelMate P2510-G2-MG-50WE i5-8250U, GeForce MX130, SK Hynix HFS256G39TND-N210A, IPS, 1920x1080, 15.6" | Lenovo ThinkPad E580-20KS001RGE i5-8550U, Radeon RX 550 (Laptop), Lenovo LENSE20256GMSP34MEAT2TA, IPS LED, 1920x1080, 15.6" | Dell Latitude 5590 i5-8250U, UHD Graphics 620, SK hynix SC311 M.2, IPS, 1920x1080, 15.6" | Genomsnitt NVIDIA GeForce MX130 | Genomsnitt av klass Office | |
|---|---|---|---|---|---|---|---|---|
| Power Consumption | 17% | 25% | 7% | -38% | 5% | -9% | -3% | |
| Idle Minimum * (Watt) | 3.12 | 3.6 -15% | 3.2 -3% | 3.3 -6% | 7.4 -137% | 3.6 -15% | 4.54 ? -46% | 4.4 ? -41% |
| Idle Average * (Watt) | 6.3 | 6.2 2% | 6 5% | 5.6 11% | 10.4 -65% | 6.5 -3% | 6.98 ? -11% | 7.32 ? -16% |
| Idle Maximum * (Watt) | 9.78 | 7.2 26% | 6.4 35% | 7.8 20% | 10.3 -5% | 7.2 26% | 9.08 ? 7% | 8.56 ? 12% |
| Load Average * (Watt) | 57.6 | 35.2 39% | 34 41% | 54 6% | 57 1% | 46.2 20% | 54.1 ? 6% | 42.5 ? 26% |
| Witcher 3 ultra * (Watt) | 42 | |||||||
| Load Maximum * (Watt) | 67.3 | 46.4 31% | 34.4 49% | 63 6% | 57 15% | 68.8 -2% | 66.4 ? 1% | 64.1 ? 5% |
* ... mindre är bättre
| HP ProBook 450 G6-5TJ93EA i7-8565U, GeForce MX130, 45 Wh | HP ProBook 450 G5-2UB53EA i5-8250U, UHD Graphics 620, 48 Wh | HP ProBook 650 G4 3UP57EA i5-8250U, UHD Graphics 620, 48 Wh | Acer TravelMate P2510-G2-MG-50WE i5-8250U, GeForce MX130, 48 Wh | Lenovo ThinkPad E580-20KS001RGE i5-8550U, Radeon RX 550 (Laptop), 45 Wh | Dell Latitude 5590 i5-8250U, UHD Graphics 620, 51 Wh | Genomsnitt av klass Office | |
|---|---|---|---|---|---|---|---|
| Batteridrifttid | -21% | -15% | -3% | -13% | -14% | 43% | |
| Reader / Idle (h) | 14.6 | 14.4 -1% | 17.4 19% | 23.7 ? 62% | |||
| H.264 (h) | 7.7 | 8.6 12% | 9.1 18% | 6.7 -13% | 15 ? 95% | ||
| WiFi v1.3 (h) | 9.7 | 7.7 -21% | 8.2 -15% | 8.4 -13% | 6.7 -31% | 7.4 -24% | 12.9 ? 33% |
| Load (h) | 2.2 | 2 -9% | 1.4 -36% | 1.4 -36% | 1.807 ? -18% |
För
Emot
Läs den fullständiga versionen av den här recensionen på engelska här.
HP ProBook 450 G6 är inte särskilt anmärkningsvärd. Det finns knappt några områden där den står ut, men den gör heller inga större misstag. HP har dock gjort en del märkbara kompromisser med ProBook 400-serien jämfört med ProBook 600-serien.
Men allt är inte katastrof. SSD-enheten är exceptionellt snabb, vilket också gäller WiFi-modulen. Många av komponenterna går dessutom att uppgradera eller byta ut även om det är en lite mer komplicerad process än på ProBook 450 G5.
HP ProBook 450 G6 är en kompakt och lätt laptop på 15.6 tum som gör bra ifrån sig på de flesta punkter. Men vår recensionsenhet känns inte särskilt prisvärd och lyckas inte stå ut gentemot sina konkurrenter.
ProBook 450 G6 kan inte få ut mesta möjliga ur sin Core i7-8565U vilket i vårt tycke gör versionen med Core i5-8250U till ett mer prisvärt alternativ. Vidare kommer den pulserande fläkten att irritera en del personer, för den irriterade oss. Dessutom kunde skärmen haft bättre ljusstyrka och portarna kunde varit mer framtidssäkrade. För att sammanfatta så är ProBook 450 G6 en gedigen kontorslaptop som tyvärr inte riktigt når hela vägen fram på ett flertal områden.
HP ProBook 450 G6-5TJ93EA
- 03/14/2019 v6 (old)
Christian Hintze
Price comparison
