Test: Lenovo IdeaPad 320S-13IKBR (i5-8250U, MX150) Laptop (Sammanfattning)
| SD Card Reader | |
| average JPG Copy Test (av. of 3 runs) | |
| Dell XPS 13 i5-8250U (Toshiba Exceria Pro SDXC 64 GB UHS-II) | |
| Lenovo IdeaPad 320S-13IKB (Toshiba Exceria Pro M501) | |
| HP Envy 13-ad006ng (Toshiba Exceria Pro SDXC 64 GB UHS-II) | |
| Dell Inspiron 13 7370 (Toshiba Exceria Pro SDXC 64 GB UHS-II) | |
| maximum AS SSD Seq Read Test (1GB) | |
| Dell XPS 13 i5-8250U (Toshiba Exceria Pro SDXC 64 GB UHS-II) | |
| Lenovo IdeaPad 320S-13IKB (Toshiba Exceria Pro M501) | |
| HP Envy 13-ad006ng (Toshiba Exceria Pro SDXC 64 GB UHS-II) | |
| Dell Inspiron 13 7370 (Toshiba Exceria Pro SDXC 64 GB UHS-II) | |
| Networking | |
| iperf3 transmit AX12 | |
| Dell Inspiron 13 7370 | |
| HP Envy 13-ad006ng | |
| Dell XPS 13 i5-8250U | |
| Lenovo IdeaPad 320S-13IKB | |
| iperf3 receive AX12 | |
| Dell XPS 13 i5-8250U | |
| HP Envy 13-ad006ng | |
| Dell Inspiron 13 7370 | |
| Lenovo IdeaPad 320S-13IKB | |
| |||||||||||||||||||||||||
Distribution av ljusstyrkan: 88 %
Mitt på batteriet: 328 cd/m²
Kontrast: 1320:1 (Svärta: 0.25 cd/m²)
ΔE ColorChecker Calman: 1.8 | ∀{0.5-29.43 Ø4.71}
ΔE Greyscale Calman: 2.5 | ∀{0.09-98 Ø4.96}
97.3% sRGB (Argyll 1.6.3 3D)
61.8% AdobeRGB 1998 (Argyll 1.6.3 3D)
68.1% AdobeRGB 1998 (Argyll 3D)
97.4% sRGB (Argyll 3D)
66.3% Display P3 (Argyll 3D)
Gamma: 2.11
CCT: 6588 K
| Lenovo IdeaPad 320S-13IKB InfoVision M133NWF4R0, , 1920x1080, 13.3" | Dell XPS 13 i5-8250U ID: Sharp SHP144A, Name: LQ133Z1, , 3200x1800, 13.3" | Dell Inspiron 13 7370 BOE071A / NV13FHM / Dell G64PY, , 1920x1080, 13.3" | HP Envy 13-ad006ng BOE070E, , 1920x1080, 13.3" | Asus Zenbook UX310UA-FC347T iGP AU Optronics AUO272D, , 1920x1080, 13.3" | |
|---|---|---|---|---|---|
| Display | -5% | -6% | -6% | -13% | |
| Display P3 Coverage (%) | 66.3 | 63.9 -4% | 66.7 1% | 66.8 1% | 64.2 -3% |
| sRGB Coverage (%) | 97.4 | 91.7 -6% | 86.2 -11% | 86.3 -11% | 65.3 -33% |
| AdobeRGB 1998 Coverage (%) | 68.1 | 65.7 -4% | 63 -7% | 63.1 -7% | 65.3 -4% |
| Response Times | 27% | 8% | 7% | 30% | |
| Response Time Grey 50% / Grey 80% * (ms) | 56.8 ? | 29 ? 49% | 46 ? 19% | 48 ? 15% | 40 ? 30% |
| Response Time Black / White * (ms) | 31.6 ? | 30 ? 5% | 33 ? -4% | 32 ? -1% | 22 ? 30% |
| PWM Frequency (Hz) | 198.4 ? | 19500 ? | 201 ? | 1000 ? | 200 ? |
| Screen | -47% | -53% | -49% | -46% | |
| Brightness middle (cd/m²) | 330 | 361 9% | 301 -9% | 281 -15% | 358 8% |
| Brightness (cd/m²) | 304 | 303 0% | 291 -4% | 264 -13% | 347 14% |
| Brightness Distribution (%) | 88 | 72 -18% | 87 -1% | 83 -6% | 87 -1% |
| Black Level * (cd/m²) | 0.25 | 0.33 -32% | 0.33 -32% | 0.23 8% | 0.26 -4% |
| Contrast (:1) | 1320 | 1094 -17% | 912 -31% | 1222 -7% | 1377 4% |
| Colorchecker dE 2000 * | 1.8 | 5.26 -192% | 5.39 -199% | 4.83 -168% | 5.22 -190% |
| Colorchecker dE 2000 max. * | 4.3 | 7.79 -81% | 8.56 -99% | 8.89 -107% | 9.19 -114% |
| Greyscale dE 2000 * | 2.5 | 5.69 -128% | 5.93 -137% | 6.63 -165% | 6.69 -168% |
| Gamma | 2.11 104% | 1.63 135% | 2.6 85% | 1.85 119% | 2.35 94% |
| CCT | 6588 99% | 6499 100% | 6358 102% | 6794 96% | 6745 96% |
| Color Space (Percent of AdobeRGB 1998) (%) | 61.8 | 59 -5% | 56 -9% | 56 -9% | 59 -5% |
| Color Space (Percent of sRGB) (%) | 97.3 | 92 -5% | 86 -12% | 86 -12% | 91 -6% |
| Totalt genomsnitt (program/inställningar) | -8% /
-29% | -17% /
-36% | -16% /
-33% | -10% /
-29% |
* ... mindre är bättre
Skärmflimmer / PWM (Puls-Width Modulation)
| Skärmflimmer / PWM upptäckt | 198.4 Hz | ≤ 99 % ljusstyrka inställning | 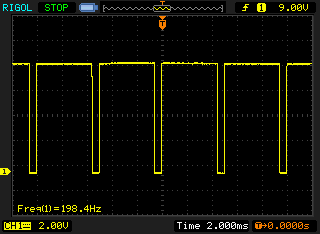 |
Displayens bakgrundsbelysning flimrar vid 198.4 Hz (i värsta fall, t.ex. med PWM) Flimrande upptäckt vid en ljusstyrkeinställning på 99 % och lägre. Det ska inte finnas något flimmer eller PWM över denna ljusstyrkeinställning. Frekvensen för 198.4 Hz är relativt låg, så känsliga användare kommer sannolikt att märka flimmer och uppleva ansträngda ögon vid den angivna ljusstyrkeinställningen och nedan. Som jämförelse: 52 % av alla testade enheter använder inte PWM för att dämpa skärmen. Om PWM upptäcktes mättes ett medelvärde av 7754 (minst: 5 - maximum: 343500) Hz. | |||
Visa svarstider
| ↔ Svarstid svart till vitt | ||
|---|---|---|
| 31.6 ms ... stiga ↗ och falla ↘ kombinerat | ↗ 17.6 ms stiga | 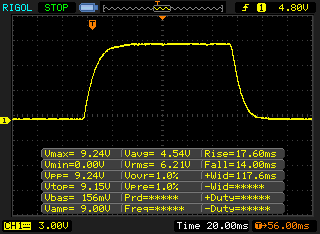 |
| ↘ 14 ms hösten | ||
| Skärmen visar långsamma svarsfrekvenser i våra tester och kommer att vara otillfredsställande för spelare. I jämförelse sträcker sig alla testade enheter från 0.1 (minst) till 240 (maximalt) ms. » 85 % av alla enheter är bättre. Detta innebär att den uppmätta svarstiden är sämre än genomsnittet av alla testade enheter (19.8 ms). | ||
| ↔ Svarstid 50 % grått till 80 % grått | ||
| 56.8 ms ... stiga ↗ och falla ↘ kombinerat | ↗ 27.6 ms stiga | 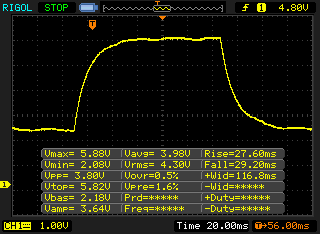 |
| ↘ 29.2 ms hösten | ||
| Skärmen visar långsamma svarsfrekvenser i våra tester och kommer att vara otillfredsställande för spelare. I jämförelse sträcker sig alla testade enheter från 0.165 (minst) till 636 (maximalt) ms. » 94 % av alla enheter är bättre. Detta innebär att den uppmätta svarstiden är sämre än genomsnittet av alla testade enheter (31 ms). | ||
| Cinebench R15 | |
| CPU Single 64Bit | |
| Asus Zenbook UX310UA-FC347T iGP | |
| HP Envy 13-ad006ng | |
| Dell Inspiron 13 7370 | |
| Dell XPS 13 i5-8250U | |
| Lenovo IdeaPad 320S-13IKB | |
| HP Envy 13-ad065nr | |
| CPU Multi 64Bit | |
| Dell Inspiron 13 7370 | |
| Dell XPS 13 i5-8250U | |
| Lenovo IdeaPad 320S-13IKB | |
| HP Envy 13-ad006ng | |
| Asus Zenbook UX310UA-FC347T iGP | |
| HP Envy 13-ad065nr | |
| PCMark 8 | |
| Home Score Accelerated v2 | |
| Asus Zenbook UX310UA-FC347T iGP | |
| Dell Inspiron 13 7370 | |
| Lenovo IdeaPad 320S-13IKB | |
| HP Envy 13-ad006ng | |
| Dell XPS 13 i5-8250U | |
| Work Score Accelerated v2 | |
| Asus Zenbook UX310UA-FC347T iGP | |
| HP Envy 13-ad006ng | |
| Lenovo IdeaPad 320S-13IKB | |
| Dell Inspiron 13 7370 | |
| Dell XPS 13 i5-8250U | |
| PCMark 10 | |
| Productivity | |
| Lenovo IdeaPad 320S-13IKB | |
| HP Envy 13-ad006ng | |
| Score | |
| HP Envy 13-ad006ng | |
| Lenovo IdeaPad 320S-13IKB | |
| PCMark 8 Home Score Accelerated v2 | 3796 poäng | |
| PCMark 8 Work Score Accelerated v2 | 4826 poäng | |
| PCMark 10 Score | 3191 poäng | |
Hjälp | ||
| Lenovo IdeaPad 320S-13IKB Samsung PM961 NVMe MZVLW512HMJP | Dell XPS 13 i5-8250U Toshiba XG5 KXG50ZNV256G | Dell Inspiron 13 7370 Micron 1100 MTFDDAV256TBN | HP Envy 13-ad006ng Toshiba NVMe THNSN5256GPUK | Asus Zenbook UX310UA-FC347T iGP Micron SSD 1100 (MTFDDAV256TBN) | |
|---|---|---|---|---|---|
| CrystalDiskMark 3.0 | -41% | -60% | -41% | -51% | |
| Write 4k QD32 (MB/s) | 475 | 345.8 -27% | 160.3 -66% | 161.3 -66% | 251.5 -47% |
| Read 4k QD32 (MB/s) | 537 | 365.5 -32% | 172.8 -68% | 494.6 -8% | 246.3 -54% |
| Write 4k (MB/s) | 142.6 | 115.6 -19% | 65.8 -54% | 109.4 -23% | 88.7 -38% |
| Read 4k (MB/s) | 56.8 | 26.67 -53% | 20.79 -63% | 34.5 -39% | 26.68 -53% |
| Write 512 (MB/s) | 636 | 265.7 -58% | 298.2 -53% | 172.3 -73% | 389.1 -39% |
| Read 512 (MB/s) | 821 | 443.9 -46% | 351 -57% | 735 -10% | 356.7 -57% |
| Write Seq (MB/s) | 1010 | 337.4 -67% | 458.3 -55% | 195.4 -81% | 431.6 -57% |
| Read Seq (MB/s) | 1372 | 1046 -24% | 476.8 -65% | 1019 -26% | 489.4 -64% |

| 3DMark 11 - 1280x720 Performance GPU | |
| HP Envy 13-ad006ng | |
| Lenovo ThinkPad 25 | |
| Lenovo IdeaPad 320S-13IKB | |
| Dell Inspiron 13 7370 | |
| Dell XPS 13 i5-8250U | |
| Asus Zenbook UX310UA-FC347T iGP | |
| 3DMark | |
| 1280x720 Cloud Gate Standard Graphics | |
| HP Envy 13-ad006ng | |
| Lenovo IdeaPad 320S-13IKB | |
| Lenovo ThinkPad 25 | |
| Dell Inspiron 13 7370 | |
| Asus Zenbook UX310UA-FC347T iGP | |
| Dell XPS 13 i5-8250U | |
| 1920x1080 Fire Strike Graphics | |
| HP Envy 13-ad006ng | |
| Lenovo ThinkPad 25 | |
| Lenovo IdeaPad 320S-13IKB | |
| Dell Inspiron 13 7370 | |
| Asus Zenbook UX310UA-FC347T iGP | |
| 3DMark 11 Performance | 3028 poäng | |
| 3DMark Cloud Gate Standard Score | 8464 poäng | |
| 3DMark Fire Strike Score | 2100 poäng | |
Hjälp | ||
| The Witcher 3 - 1366x768 Medium Graphics & Postprocessing | |
| Microsoft Surface Book 2 | |
| Acer Aspire F5-771G-50RD | |
| Xiaomi Mi Notebook Pro i5 | |
| HP Envy 13-ad006ng | |
| Lenovo ThinkPad 25 | |
| Lenovo IdeaPad 320S-13IKB | |
| Asus Zenbook UX310UA-FC347T iGP | |
| Rise of the Tomb Raider - 1366x768 Medium Preset AF:2x | |
| Microsoft Surface Book 2 | |
| Acer Aspire F5-771G-50RD | |
| Xiaomi Mi Notebook Pro i5 | |
| HP Envy 13-ad006ng | |
| Lenovo ThinkPad 25 | |
| Lenovo IdeaPad 320S-13IKB | |
| Dell XPS 13 i5-8250U | |
| låg | med. | hög | ultra | |
|---|---|---|---|---|
| Company of Heroes 2 (2013) | 45.92 | 35.16 | 20.32 | 7.87 |
| The Witcher 3 (2015) | 44.73 | 24.44 | 13.31 | 6.5 |
| Rise of the Tomb Raider (2016) | 47.33 | 28.15 | 14.83 |
Ljudnivå
| Låg belastning |
| 30 / 30 / 30 dB(A) |
| Hög belastning |
| 32.2 / 38.8 dB(A) |
 | ||
30 dB tyst 40 dB(A) hörbar 50 dB(A) högt ljud |
||
min: | ||
(±) Den maximala temperaturen på ovansidan är 45 °C / 113 F, jämfört med genomsnittet av 35.9 °C / 97 F , allt från 21.4 till 59 °C för klassen Subnotebook.
(-) Botten värms upp till maximalt 47 °C / 117 F, jämfört med genomsnittet av 39.2 °C / 103 F
(+) Vid tomgångsbruk är medeltemperaturen för ovansidan 23.5 °C / 74 F, jämfört med enhetsgenomsnittet på 30.8 °C / ### class_avg_f### F.
(±) När du spelar The Witcher 3 är medeltemperaturen för ovansidan 32.9 °C / 91 F, jämfört med enhetsgenomsnittet på 30.8 °C / ## #class_avg_f### F.
(+) Handledsstöden och pekplattan är kallare än hudtemperaturen med maximalt 27.6 °C / 81.7 F och är därför svala att ta på.
(±) Medeltemperaturen för handledsstödsområdet på liknande enheter var 28.2 °C / 82.8 F (+0.6 °C / 1.1 F).
Lenovo IdeaPad 320S-13IKB ljudanalys
(±) | högtalarljudstyrkan är genomsnittlig men bra (74.5 dB)
Bas 100 - 315 Hz
(±) | reducerad bas - i genomsnitt 14.9% lägre än medianen
(±) | linjäriteten för basen är genomsnittlig (9.2% delta till föregående frekvens)
Mellan 400 - 2000 Hz
(±) | högre mellan - i genomsnitt 8.3% högre än median
(±) | linjäriteten för mids är genomsnittlig (11.4% delta till föregående frekvens)
Högsta 2 - 16 kHz
(±) | högre toppar - i genomsnitt 6.7% högre än medianen
(±) | linjäriteten för toppar är genomsnittlig (7.9% delta till föregående frekvens)
Totalt 100 - 16 000 Hz
(±) | linjäriteten för det totala ljudet är genomsnittlig (29.9% skillnad mot median)
Jämfört med samma klass
» 92% av alla testade enheter i den här klassen var bättre, 1% liknande, 7% sämre
» Den bästa hade ett delta på 5%, genomsnittet var 18%, sämst var 53%
Jämfört med alla testade enheter
» 88% av alla testade enheter var bättre, 3% liknande, 9% sämre
» Den bästa hade ett delta på 4%, genomsnittet var 23%, sämst var 134%
HP Envy 13-ad006ng ljudanalys
(-) | inte särskilt höga högtalare (70.1 dB)
Bas 100 - 315 Hz
(-) | nästan ingen bas - i genomsnitt 27.6% lägre än medianen
(±) | linjäriteten för basen är genomsnittlig (9.8% delta till föregående frekvens)
Mellan 400 - 2000 Hz
(+) | balanserad mellan - endast 2.2% från medianen
(+) | mids är linjära (6.1% delta till föregående frekvens)
Högsta 2 - 16 kHz
(+) | balanserade toppar - endast 2% från medianen
(+) | toppar är linjära (3.7% delta till föregående frekvens)
Totalt 100 - 16 000 Hz
(±) | linjäriteten för det totala ljudet är genomsnittlig (20.2% skillnad mot median)
Jämfört med samma klass
» 64% av alla testade enheter i den här klassen var bättre, 9% liknande, 27% sämre
» Den bästa hade ett delta på 5%, genomsnittet var 18%, sämst var 53%
Jämfört med alla testade enheter
» 53% av alla testade enheter var bättre, 8% liknande, 39% sämre
» Den bästa hade ett delta på 4%, genomsnittet var 23%, sämst var 134%
| Av/Standby | |
| Låg belastning | |
| Hög belastning |
|
Förklaring:
min: | |
| Lenovo IdeaPad 320S-13IKB i5-8250U, GeForce MX150, Samsung PM961 NVMe MZVLW512HMJP, IPS LED, 1920x1080, 13.3" | Dell XPS 13 i5-8250U i5-8250U, UHD Graphics 620, Toshiba XG5 KXG50ZNV256G, IGZO IPS, 3200x1800, 13.3" | Dell Inspiron 13 7370 i5-8250U, UHD Graphics 620, Micron 1100 MTFDDAV256TBN, IPS, 1920x1080, 13.3" | HP Envy 13-ad006ng i7-7500U, GeForce MX150, Toshiba NVMe THNSN5256GPUK, IPS LED, 1920x1080, 13.3" | Asus Zenbook UX310UA-FC347T iGP i7-7500U, HD Graphics 620, Micron SSD 1100 (MTFDDAV256TBN), IPS, LED, 1920x1080, 13.3" | |
|---|---|---|---|---|---|
| Power Consumption | -3% | 5% | 7% | 9% | |
| Idle Minimum * (Watt) | 3.4 | 3.6 -6% | 3.6 -6% | 2.8 18% | 3.5 -3% |
| Idle Average * (Watt) | 6.1 | 7.9 -30% | 6.8 -11% | 5.8 5% | 6.6 -8% |
| Idle Maximum * (Watt) | 7.7 | 8.5 -10% | 8.9 -16% | 7.7 -0% | 7.5 3% |
| Load Average * (Watt) | 44.2 | 43 3% | 36 19% | 48 -9% | 34.7 21% |
| Witcher 3 ultra * (Watt) | 37.6 | 35 7% | |||
| Load Maximum * (Watt) | 60.3 | 43 29% | 36.5 39% | 48 20% | 39.6 34% |
* ... mindre är bättre
| Lenovo IdeaPad 320S-13IKB i5-8250U, GeForce MX150, 36 Wh | Dell XPS 13 i5-8250U i5-8250U, UHD Graphics 620, 60 Wh | Dell Inspiron 13 7370 i5-8250U, UHD Graphics 620, 38 Wh | HP Envy 13-ad006ng i7-7500U, GeForce MX150, 51 Wh | Asus Zenbook UX310UA-FC347T iGP i7-7500U, HD Graphics 620, 48 Wh | |
|---|---|---|---|---|---|
| Batteridrifttid | 83% | 5% | 48% | 44% | |
| Reader / Idle (h) | 12.3 | 18.2 48% | 12.9 5% | 20 63% | 16.1 31% |
| H.264 (h) | 5.8 | 7.9 36% | 6.9 19% | ||
| WiFi v1.3 (h) | 5.7 | 11.5 102% | 5.8 2% | 7.1 25% | 9.6 68% |
| Load (h) | 1.2 | 2.4 100% | 1.3 8% | 2 67% | 1.9 58% |
För
Emot

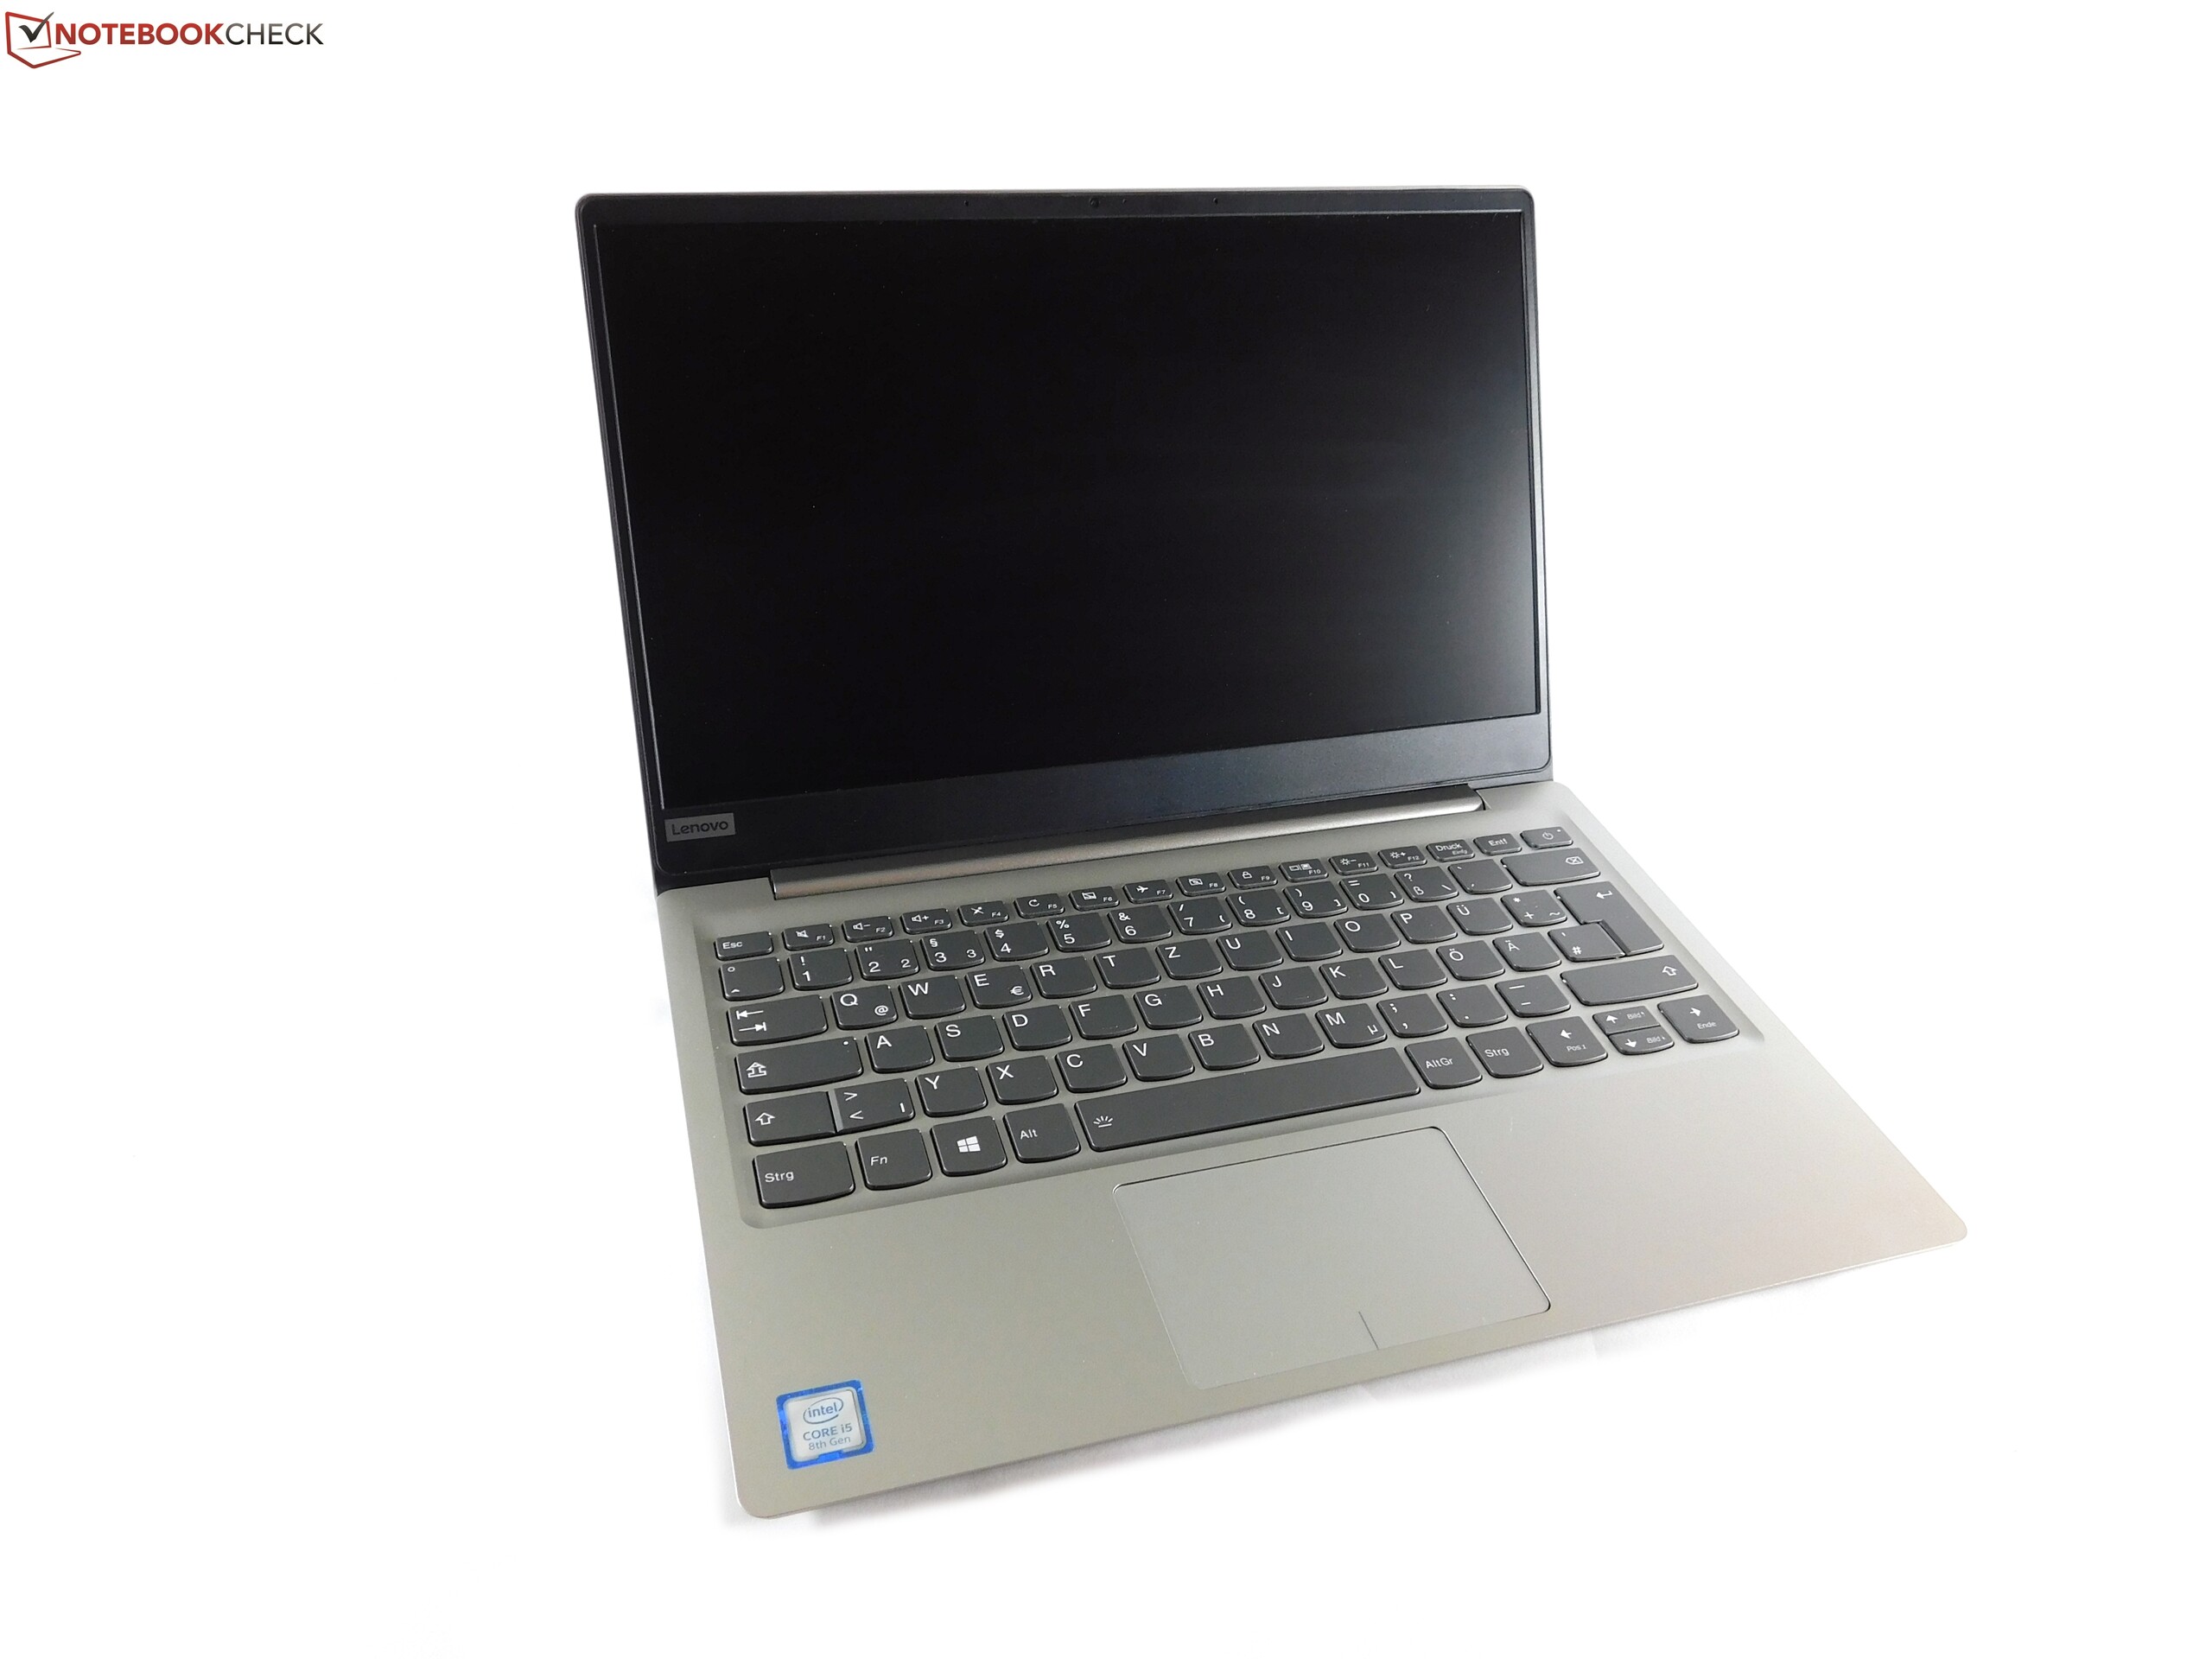
IdeaPad 320s-13IKBR är ett lockade erbjudande, men Lenovo har gjort betydande nedskärningar.
Med en Intel Core i5-8250U och ett Nvidia GeForce MX150 i en såpass kompakt enhet är den lätt att marknadsföra, särskilt då den för tillfället är den billigaste laptopen med den här kombinationen av komponenter. Problemet: både processorn och grafikchippet lever inte upp till förväntningarna. Dess Core i5-8250U är långt ifrån sin maximala nivå och kan till och med falla ned till nivån av förra generationens dualkärnade processorer vid belastning. Det är ännu värre med dess GeForce-GPU, som helt och hållet körs på nivån av den utdaterade Maxwell-föregångaren 940MX. Utöver dessa prestandabegränsningar så är det alltför lilla batteriet ett problem, för hur bra är en ultra-mobil laptop om du inte kan använda den länge på resande fot. Tillverkaren gör också reklam för den snabba processorn och den relativt bra GPU:n, men dom levererar inte den prestanda som förväntas.
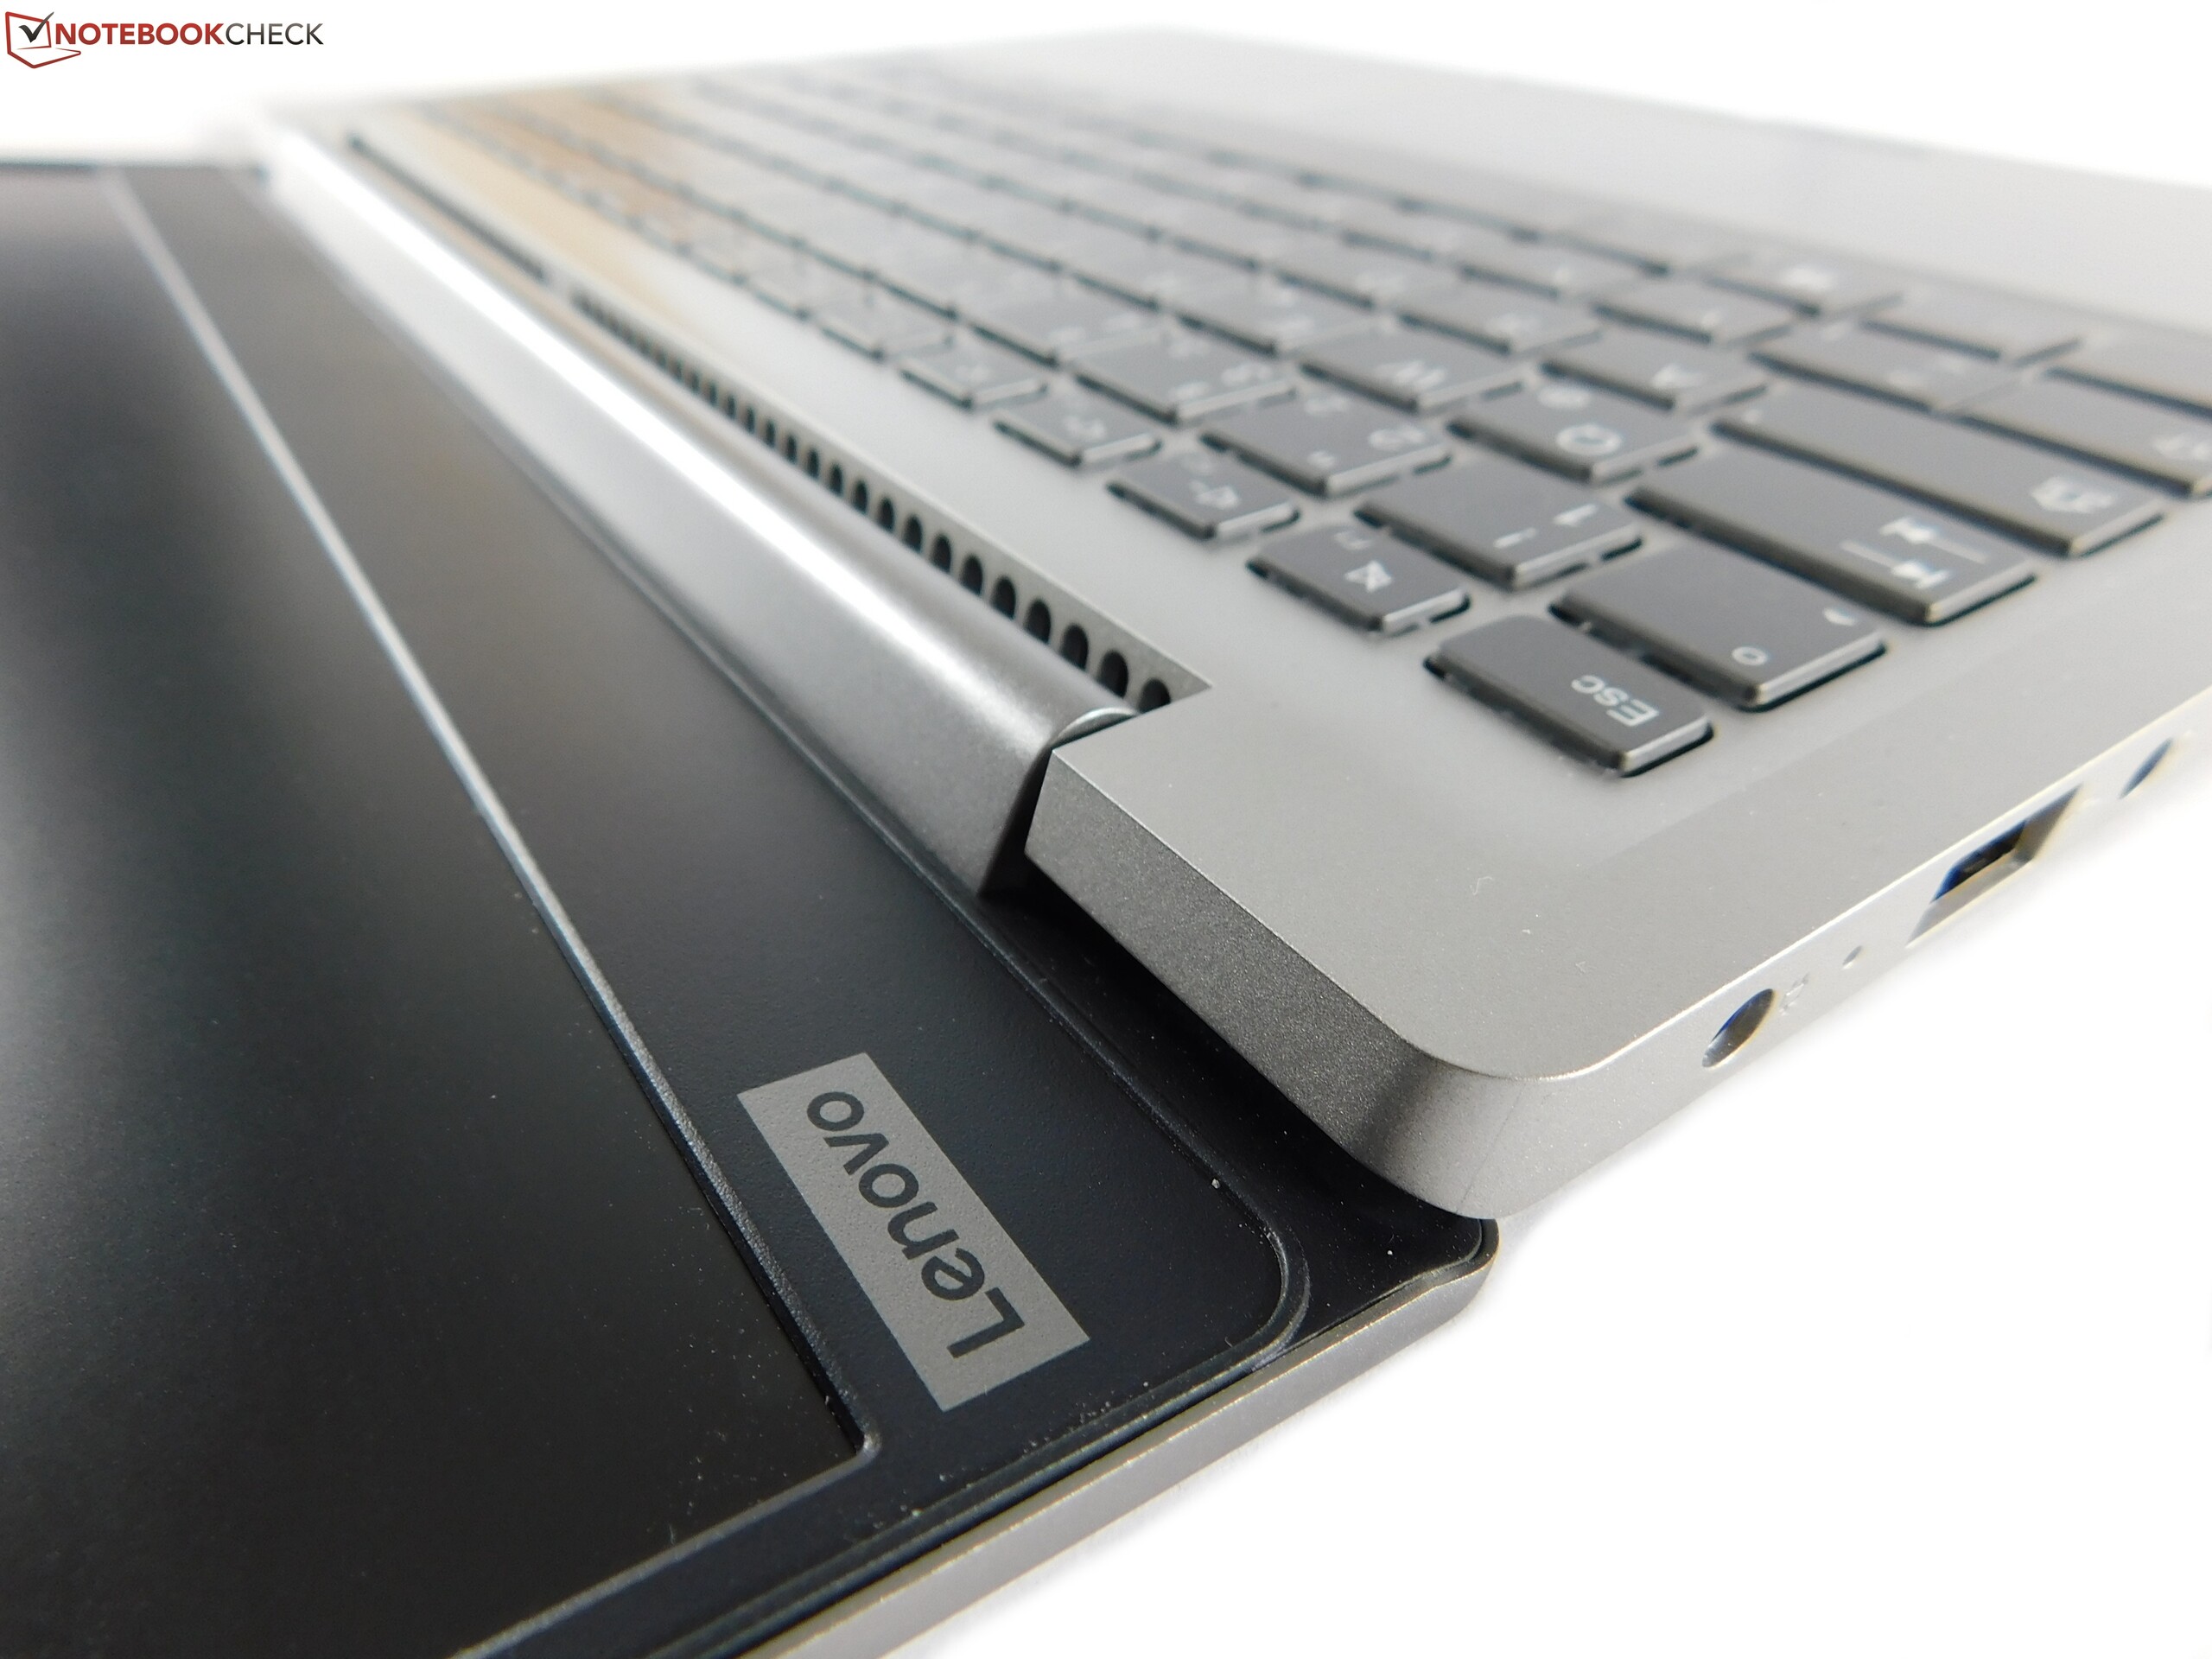
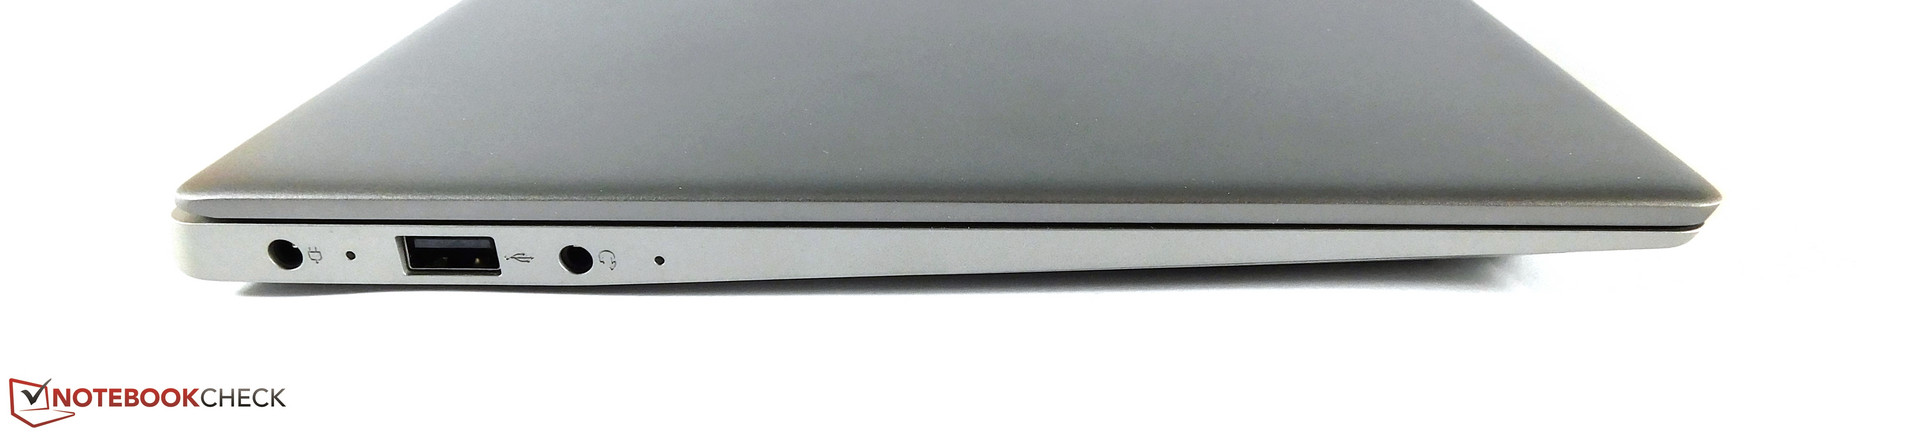
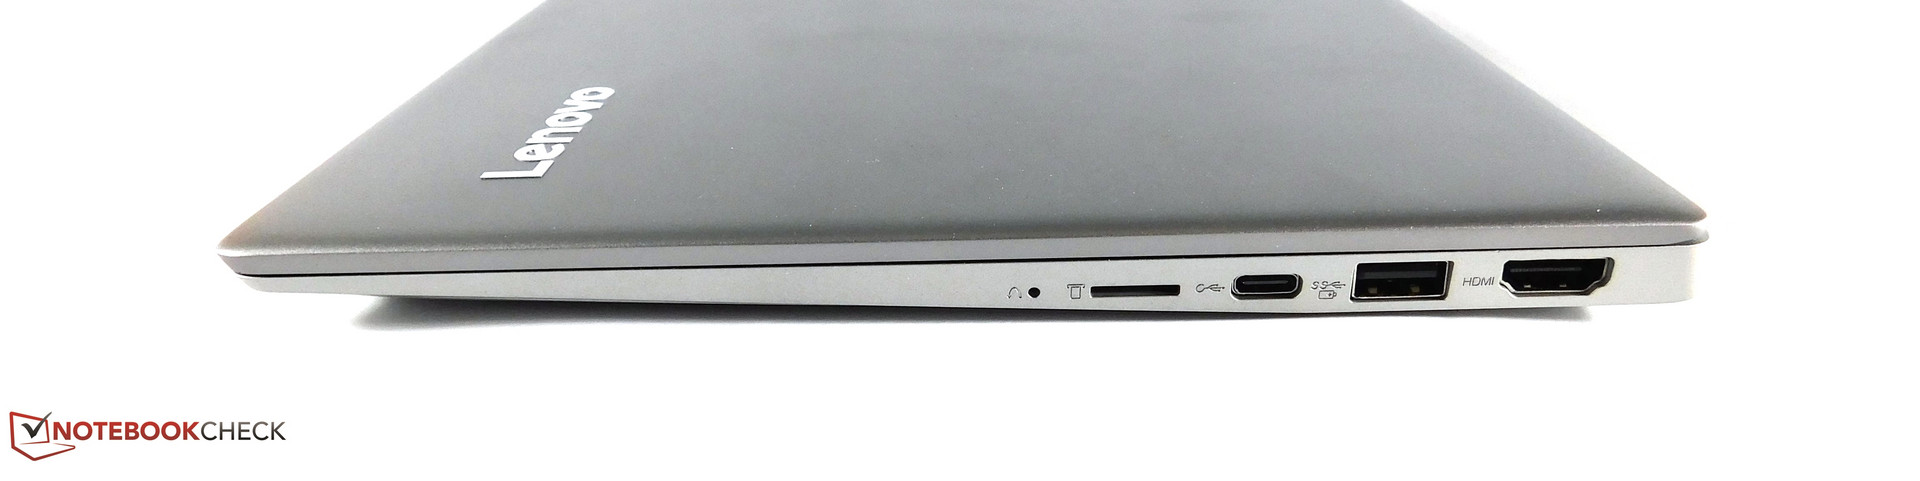
Det är synd, för IdeaPad 320s-13IKBR har också positiva aspekter. Dessa inkluderar, framför allt, den väldigt bra skärmen, som plågas av PWM men är i övrigt sammanfattningsvis bra: ljusstyrka på mer än 300 cd/m2, bra konstrastvärden och färgomfång på 97% a sRGB-färgrymden. Tack vare dess matta yta så är skärmen lätt att läsa på utomhus så väl som inomhus. Utöver skärmen borde man också nämna dess snabba SSD och dess bra styrplatta, som inte visade några svagheter i våra tester. Dom kompakta dimensionerna är också vackra tack vare de minimala kanterna runt skärmen och den tysta fläkten. Mindre bra är dock att Lenovo bara har en rejält förvanskad USB-C port, och precis lika obegriplig är USB 2.0-porten. Även om 1x1 WLAN-kortet inte är långsamt i det vardagliga livet så begränsar det överföringshastigheterna avsevärt.
Kort batteritid och dålig prestanda: IdeaPad 320s-13IKBR har för många svagheter på avgörande områden.
I korthet, IdeaPad 320s-13IKBR kan inte rekommenderas. Den presterar inte tillräckligt bra i dom viktiga kategorierna batteritid, CPU- och GPU-prestanda, vilket är för lågt för ~9 500 SEK. Vi skulle istället rekommendera en titt på HP Envy 13 i den nuvarande versionen med Kaby-Lake-Refresh CPU:er och MX150 - eller, om du kan klara dig utan GPU:n, Dell XPS 13.
Lenovo IdeaPad 320S-13IKB
- 12/04/2017 v6 (old)
Benjamin Herzig