Test: Huawei MediaPad M5 8.4 Surfplatta (Sammanfattning)

| |||||||||||||||||||||||||
Distribution av ljusstyrkan: 92 %
Mitt på batteriet: 403 cd/m²
Kontrast: 604:1 (Svärta: 0.67 cd/m²)
ΔE ColorChecker Calman: 5.78 | ∀{0.5-29.43 Ø4.71}
ΔE Greyscale Calman: 7.2 | ∀{0.09-98 Ø4.96}
99.8% sRGB (Calman 2D)
Gamma: 2.278
CCT: 8405 K
| Huawei MediaPad M5 8.4 IPS, 2560x1600, 8.4" | Amazon Fire HD 8 2017 IPS, 1280x800, 8" | Lenovo Tab 4 8 IPS, 1280x800, 8" | Samsung Galaxy Tab Active 2 TFT LCD, 1280x800, 8" | Huawei MediaPad M3 8.4 inch IPS, 2560x1600, 8.4" | |
|---|---|---|---|---|---|
| Screen | -1% | 9% | 34% | 16% | |
| Brightness middle (cd/m²) | 405 | 419 3% | 455 12% | 509 26% | 460 14% |
| Brightness (cd/m²) | 392 | 412 5% | 446 14% | 477 22% | 445 14% |
| Brightness Distribution (%) | 92 | 91 -1% | 91 -1% | 91 -1% | 90 -2% |
| Black Level * (cd/m²) | 0.67 | 0.39 42% | 0.51 24% | 0.48 28% | 0.45 33% |
| Contrast (:1) | 604 | 1074 78% | 892 48% | 1060 75% | 1022 69% |
| Colorchecker dE 2000 * | 5.78 | 8.5 -47% | 5.5 5% | 3.45 40% | 6.2 -7% |
| Colorchecker dE 2000 max. * | 9.82 | 13.8 -41% | 14.8 -51% | 5.17 47% | 10.5 -7% |
| Greyscale dE 2000 * | 7.2 | 10.3 -43% | 5.5 24% | 4.5 37% | 6.5 10% |
| Gamma | 2.278 97% | 2.6 85% | 2.23 99% | 2.11 104% | 2.33 94% |
| CCT | 8405 77% | 6216 105% | 7852 83% | 7171 91% | 8056 81% |
* ... mindre är bättre
Skärmflimmer / PWM (Puls-Width Modulation)
| Skärmflimmer / PWM upptäckt | 2451 Hz | ≤ 25 % ljusstyrka inställning | 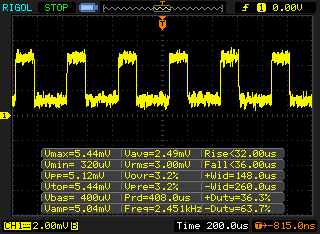 |
Displayens bakgrundsbelysning flimrar vid 2451 Hz (i värsta fall, t.ex. med PWM) Flimrande upptäckt vid en ljusstyrkeinställning på 25 % och lägre. Det ska inte finnas något flimmer eller PWM över denna ljusstyrkeinställning. Frekvensen för 2451 Hz är ganska hög, så de flesta användare som är känsliga för PWM bör inte märka något flimmer. Som jämförelse: 52 % av alla testade enheter använder inte PWM för att dämpa skärmen. Om PWM upptäcktes mättes ett medelvärde av 7744 (minst: 5 - maximum: 343500) Hz. | |||
Visa svarstider
| ↔ Svarstid svart till vitt | ||
|---|---|---|
| 20.5 ms ... stiga ↗ och falla ↘ kombinerat | ↗ 19 ms stiga | 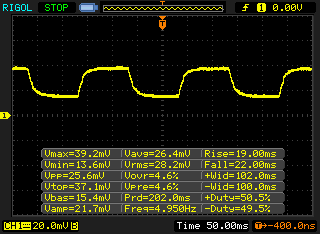 |
| ↘ 22 ms hösten | ||
| Skärmen visar bra svarsfrekvens i våra tester, men kan vara för långsam för konkurrenskraftiga spelare. I jämförelse sträcker sig alla testade enheter från 0.1 (minst) till 240 (maximalt) ms. » 46 % av alla enheter är bättre. Det betyder att den uppmätta svarstiden liknar genomsnittet av alla testade enheter (19.8 ms). | ||
| ↔ Svarstid 50 % grått till 80 % grått | ||
| 13 ms ... stiga ↗ och falla ↘ kombinerat | ↗ 15 ms stiga | 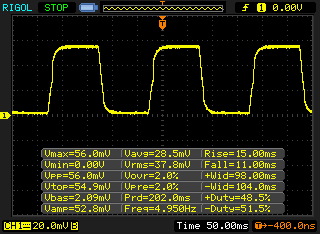 |
| ↘ 11 ms hösten | ||
| Skärmen visar bra svarsfrekvens i våra tester, men kan vara för långsam för konkurrenskraftiga spelare. I jämförelse sträcker sig alla testade enheter från 0.165 (minst) till 636 (maximalt) ms. » 27 % av alla enheter är bättre. Det betyder att den uppmätta svarstiden är bättre än genomsnittet av alla testade enheter (30.9 ms). | ||
| AnTuTu v6 - Total Score | |
| Huawei MediaPad M5 8.4 | |
| Genomsnitt HiSilicon Kirin 960 (124087 - 157445, n=7) | |
| Huawei MediaPad M3 8.4 inch | |
| Samsung Galaxy Tab Active 2 | |
| Lenovo Tab 4 8 | |
| Amazon Fire HD 8 2017 | |
| AnTuTu v7 - Total Score | |
| Huawei MediaPad M5 8.4 | |
| Genomsnitt HiSilicon Kirin 960 (170015 - 181614, n=4) | |
| PCMark for Android | |
| Work performance score | |
| Genomsnitt HiSilicon Kirin 960 (6830 - 7403, n=7) | |
| Huawei MediaPad M5 8.4 | |
| Huawei MediaPad M3 8.4 inch | |
| Samsung Galaxy Tab Active 2 | |
| Lenovo Tab 4 8 | |
| Amazon Fire HD 8 2017 | |
| Work 2.0 performance score | |
| Genomsnitt HiSilicon Kirin 960 (6006 - 6299, n=7) | |
| Huawei MediaPad M5 8.4 | |
| Samsung Galaxy Tab Active 2 | |
| Lenovo Tab 4 8 | |
| Amazon Fire HD 8 2017 | |
| Octane V2 - Total Score | |
| Genomsnitt av klass Tablet (1633 - 138481, n=71, senaste 2 åren) | |
| Huawei MediaPad M3 8.4 inch (Chrome 54) | |
| Huawei MediaPad M5 8.4 (Chrome 66) | |
| Genomsnitt HiSilicon Kirin 960 (10016 - 11897, n=7) | |
| Samsung Galaxy Tab Active 2 | |
| Lenovo Tab 4 8 (Chrome 61) | |
| Amazon Fire HD 8 2017 (Amazon Silk 58.2.3029.83.10) | |
| WebXPRT 2015 - Overall | |
| Huawei MediaPad M5 8.4 (Chrome 66) | |
| Genomsnitt HiSilicon Kirin 960 (107 - 184, n=7) | |
| Huawei MediaPad M3 8.4 inch (Chrome 54) | |
| Lenovo Tab 4 8 (Chrome 61) | |
| Samsung Galaxy Tab Active 2 | |
| Amazon Fire HD 8 2017 (Amazon Silk 58.2.3029.83.10) | |
| JetStream 1.1 - 1.1 Total | |
| Genomsnitt HiSilicon Kirin 960 (56.8 - 68.6, n=7) | |
| Huawei MediaPad M5 8.4 (Chrome 66) | |
| Huawei MediaPad M3 8.4 inch (Chrome 54) | |
| Samsung Galaxy Tab Active 2 | |
| Amazon Fire HD 8 2017 (Amazon Silk 58.2.3029.83.10) | |
| Lenovo Tab 4 8 (Chrome 61) | |
| Mozilla Kraken 1.1 - Total | |
| Lenovo Tab 4 8 (Chrome 61) | |
| Amazon Fire HD 8 2017 (Amazon Silk 58.2.3029.83.10) | |
| Samsung Galaxy Tab Active 2 | |
| Huawei MediaPad M5 8.4 (Chrome 66) | |
| Genomsnitt HiSilicon Kirin 960 (2734 - 3734, n=7) | |
| Huawei MediaPad M3 8.4 inch (Chrome 54) | |
| Genomsnitt av klass Tablet (243 - 16233, n=65, senaste 2 åren) | |
* ... mindre är bättre
| Huawei MediaPad M5 8.4 | Amazon Fire HD 8 2017 | Lenovo Tab 4 8 | Samsung Galaxy Tab Active 2 | Huawei MediaPad M3 8.4 inch | Genomsnitt 32 GB eMMC Flash | Genomsnitt av klass Tablet | |
|---|---|---|---|---|---|---|---|
| AndroBench 3-5 | -58% | -30% | -39% | -36% | -29% | 642% | |
| Sequential Read 256KB (MB/s) | 268.6 | 159.1 -41% | 265.1 -1% | 218.1 -19% | 249.7 -7% | 242 ? -10% | 2073 ? 672% |
| Sequential Write 256KB (MB/s) | 132.2 | 47.23 -64% | 72.3 -45% | 54 -59% | 117.2 -11% | 100.5 ? -24% | 1667 ? 1161% |
| Random Read 4KB (MB/s) | 62.8 | 21.55 -66% | 44 -30% | 25.96 -59% | 32.04 -49% | 43.1 ? -31% | 275 ? 338% |
| Random Write 4KB (MB/s) | 65.1 | 11.51 -82% | 7.1 -89% | 10.98 -83% | 31.35 -52% | 22.3 ? -66% | 324 ? 398% |
| Sequential Read 256KB SDCard (MB/s) | 84.9 ? | 51.1 -40% | 84.8 0% | 78.6 -7% | 61.7 ? -27% | 71.8 ? -15% | |
| Sequential Write 256KB SDCard (MB/s) | 70.7 ? | 34.15 -52% | 61.1 -14% | 64.3 -9% | 23.52 ? -67% | 52.9 ? -25% |
| Shadow Fight 3 | |||
| Inställningar | Värde | ||
| high | 58 fps | ||
| minimal | 58 fps | ||
| Arena of Valor | |||
| Inställningar | Värde | ||
| min | 58 fps | ||
| high HD | 58 fps | ||
| Battle Bay | |||
| Inställningar | Värde | ||
| half resolution | 58 fps | ||
| full resolution | 58 fps | ||
(+) Den maximala temperaturen på ovansidan är 38.2 °C / 101 F, jämfört med genomsnittet av 33.7 °C / 93 F , allt från 20.7 till 53.2 °C för klassen Tablet.
(+) Botten värms upp till maximalt 36.4 °C / 98 F, jämfört med genomsnittet av 33.2 °C / 92 F
(+) Vid tomgångsbruk är medeltemperaturen för ovansidan 30.8 °C / 87 F, jämfört med enhetsgenomsnittet på 30 °C / ### class_avg_f### F.
Huawei MediaPad M5 8.4 ljudanalys
(+) | högtalare kan spela relativt högt (85 dB)
Bas 100 - 315 Hz
(-) | nästan ingen bas - i genomsnitt 19.2% lägre än medianen
(±) | linjäriteten för basen är genomsnittlig (12.5% delta till föregående frekvens)
Mellan 400 - 2000 Hz
(+) | balanserad mellan - endast 3.6% från medianen
(+) | mids är linjära (2.7% delta till föregående frekvens)
Högsta 2 - 16 kHz
(+) | balanserade toppar - endast 4.2% från medianen
(+) | toppar är linjära (3.5% delta till föregående frekvens)
Totalt 100 - 16 000 Hz
(±) | linjäriteten för det totala ljudet är genomsnittlig (15.9% skillnad mot median)
Jämfört med samma klass
» 36% av alla testade enheter i den här klassen var bättre, 6% liknande, 58% sämre
» Den bästa hade ett delta på 7%, genomsnittet var 20%, sämst var 129%
Jämfört med alla testade enheter
» 25% av alla testade enheter var bättre, 5% liknande, 70% sämre
» Den bästa hade ett delta på 4%, genomsnittet var 23%, sämst var 134%
Huawei MediaPad M3 8.4 inch ljudanalys
(+) | högtalare kan spela relativt högt (88 dB)
Bas 100 - 315 Hz
(-) | nästan ingen bas - i genomsnitt 26.8% lägre än medianen
(±) | linjäriteten för basen är genomsnittlig (14.3% delta till föregående frekvens)
Mellan 400 - 2000 Hz
(+) | balanserad mellan - endast 4.1% från medianen
(+) | mids är linjära (3.9% delta till föregående frekvens)
Högsta 2 - 16 kHz
(±) | högre toppar - i genomsnitt 6.3% högre än medianen
(±) | linjäriteten för toppar är genomsnittlig (8.1% delta till föregående frekvens)
Totalt 100 - 16 000 Hz
(±) | linjäriteten för det totala ljudet är genomsnittlig (23% skillnad mot median)
Jämfört med samma klass
» 72% av alla testade enheter i den här klassen var bättre, 4% liknande, 24% sämre
» Den bästa hade ett delta på 7%, genomsnittet var 20%, sämst var 129%
Jämfört med alla testade enheter
» 69% av alla testade enheter var bättre, 5% liknande, 26% sämre
» Den bästa hade ett delta på 4%, genomsnittet var 23%, sämst var 134%
| Av/Standby | |
| Låg belastning | |
| Hög belastning |
|
Förklaring:
min: | |
| Huawei MediaPad M5 8.4 5100 mAh | Amazon Fire HD 8 2017 mAh | Lenovo Tab 4 8 4850 mAh | Samsung Galaxy Tab Active 2 4450 mAh | Huawei MediaPad M3 8.4 inch 5100 mAh | |
|---|---|---|---|---|---|
| Power Consumption | 36% | 23% | 35% | 7% | |
| Idle Minimum * (Watt) | 2.1 | 0.99 53% | 1.1 48% | 0.89 58% | 1.51 28% |
| Idle Average * (Watt) | 3.74 | 2.74 27% | 3.51 6% | 3.13 16% | 3.64 3% |
| Idle Maximum * (Watt) | 4.33 | 2.83 35% | 4.14 4% | 3.36 22% | 3.68 15% |
| Load Average * (Watt) | 6.32 | 4.51 29% | 4.86 23% | 3.93 38% | 6.95 -10% |
| Load Maximum * (Watt) | 9.13 | 5.69 38% | 6.13 33% | 5.45 40% | 9.11 -0% |
* ... mindre är bättre
| Huawei MediaPad M5 8.4 5100 mAh | Amazon Fire HD 8 2017 mAh | Lenovo Tab 4 8 4850 mAh | Samsung Galaxy Tab Active 2 4450 mAh | Huawei MediaPad M3 8.4 inch 5100 mAh | |
|---|---|---|---|---|---|
| Batteridrifttid | 34% | -12% | 16% | -11% | |
| Reader / Idle (h) | 19.2 | 33.9 77% | 20.1 5% | 22.6 18% | 18.5 -4% |
| H.264 (h) | 11.7 | 12.4 6% | 10.1 -14% | 8.2 -30% | 9.7 -17% |
| WiFi v1.3 (h) | 10.5 | 12.8 22% | 7.5 -29% | 14.9 42% | 9.1 -13% |
| Load (h) | 5 | 6.6 32% | 4.6 -8% | 6.6 32% | 4.5 -10% |
För
Emot
Läs den fullständiga versionen av den här recensionen på engelska här.
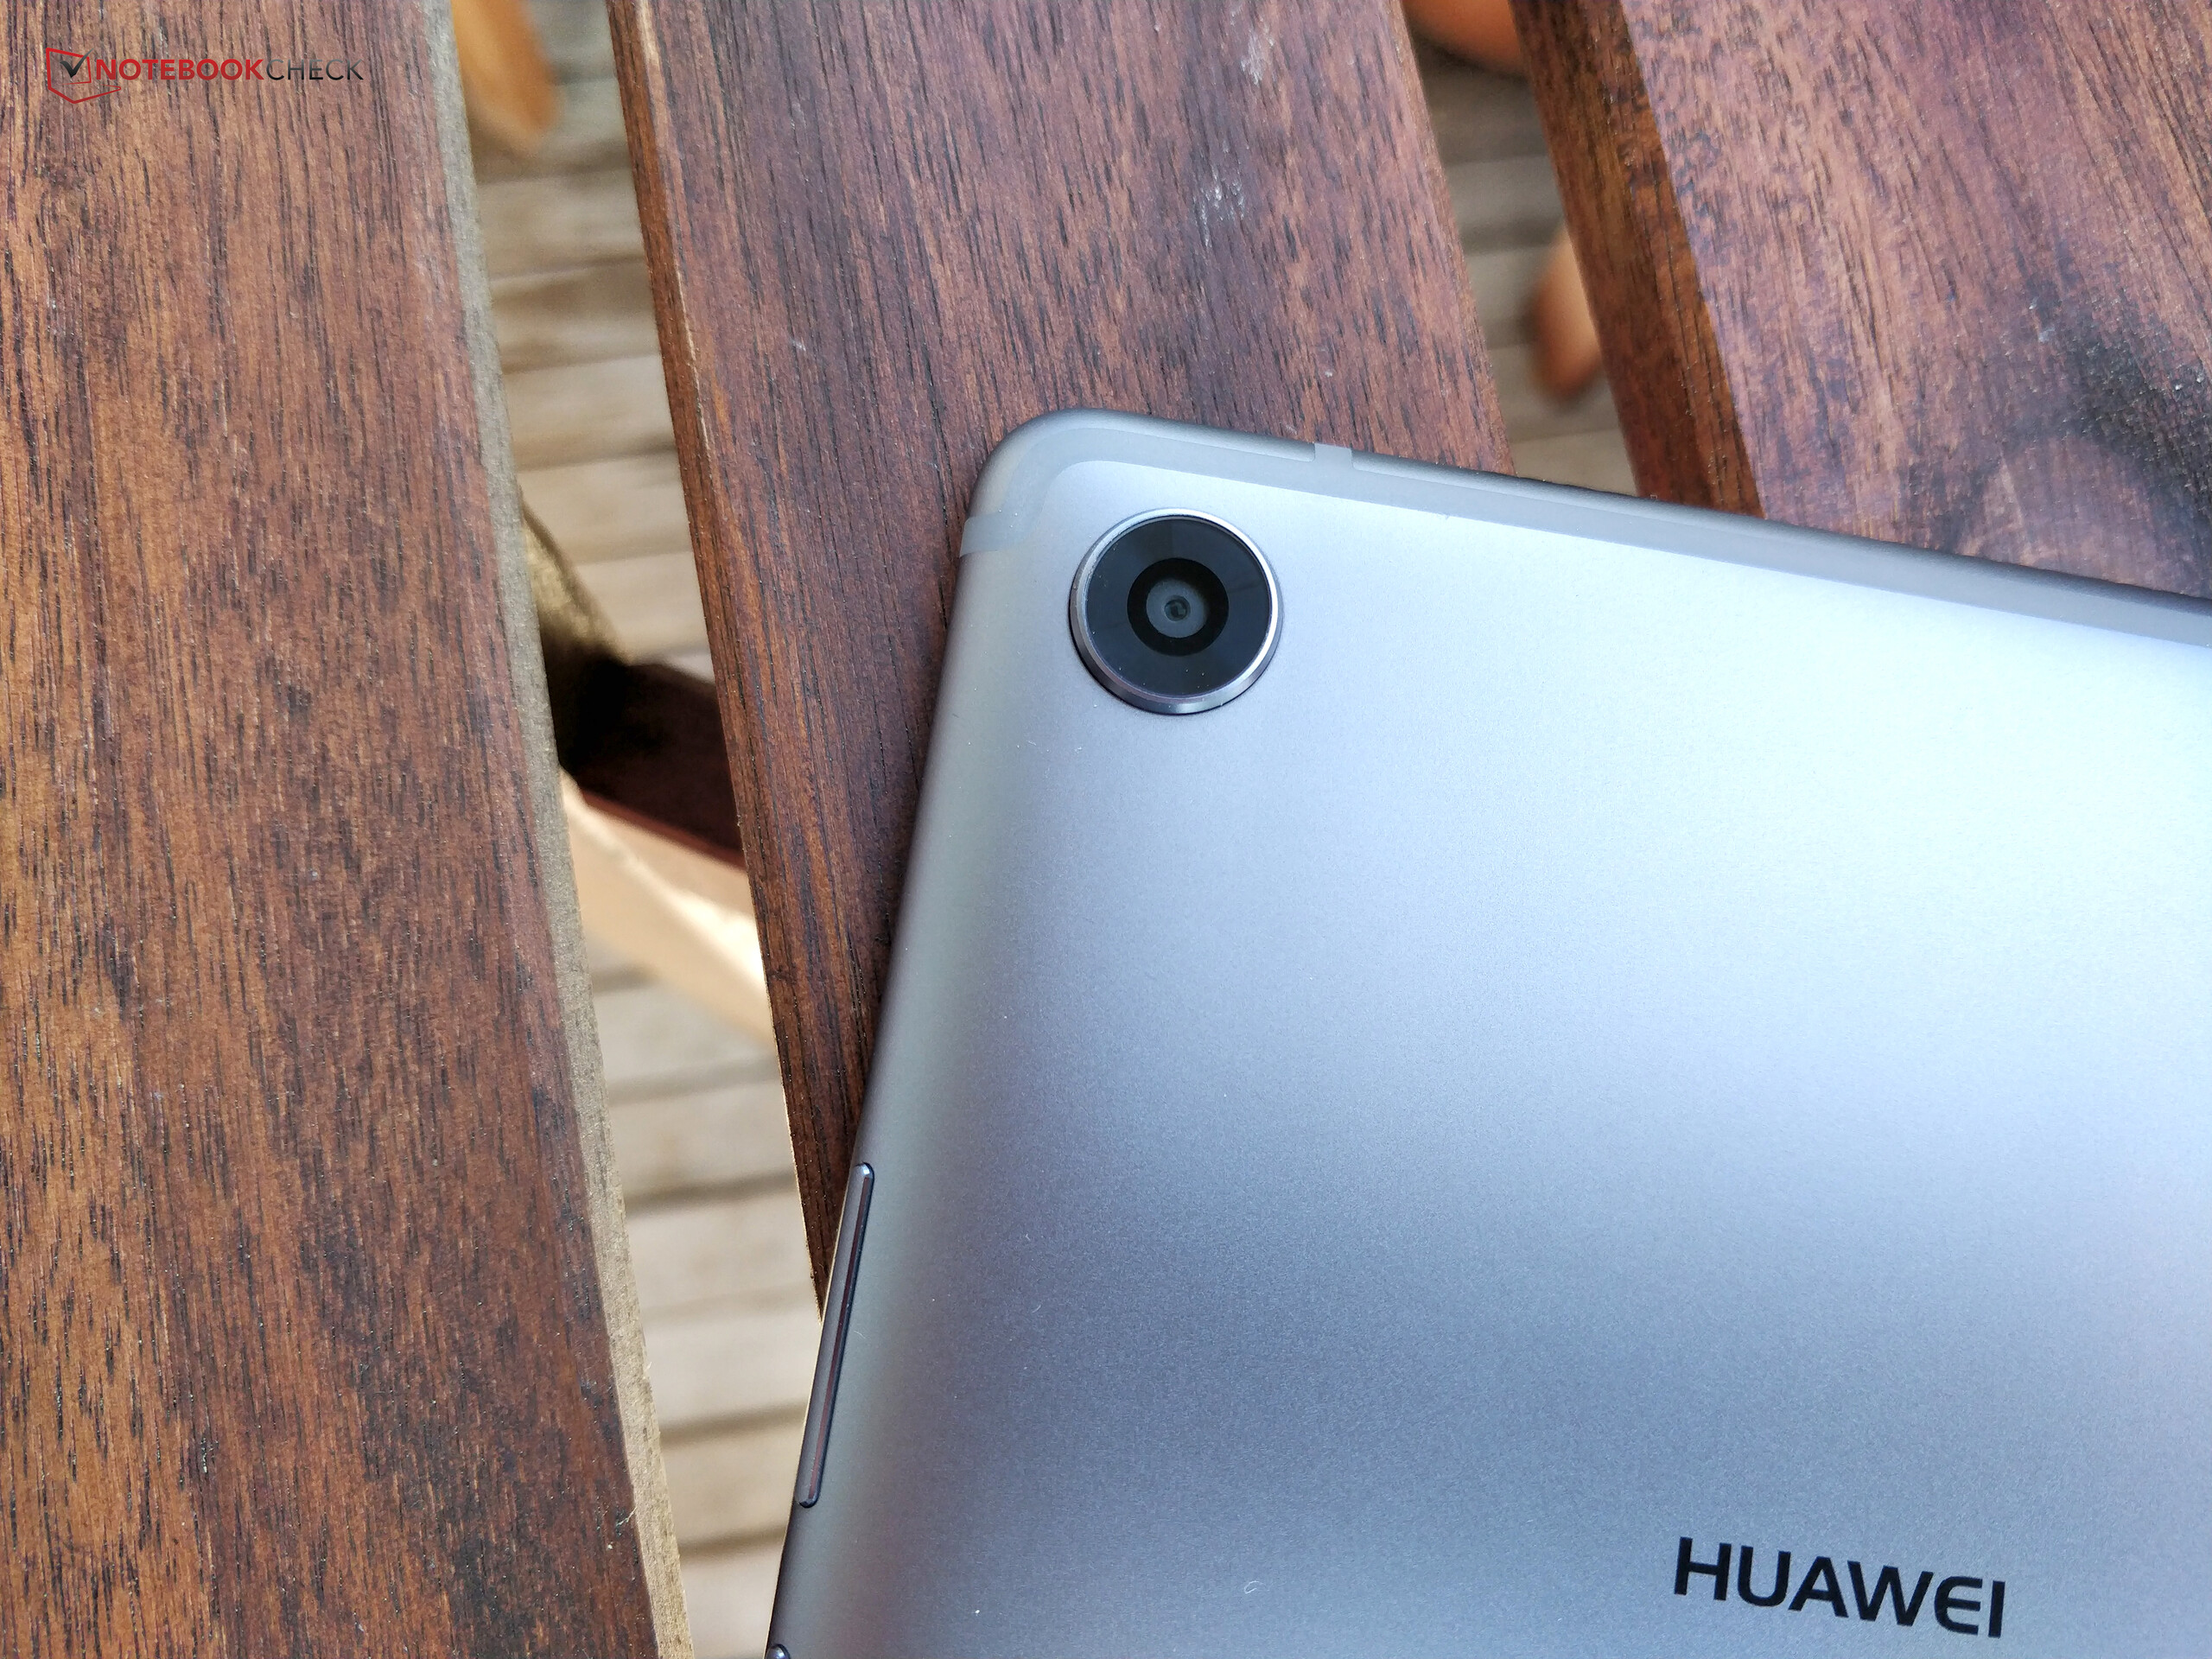
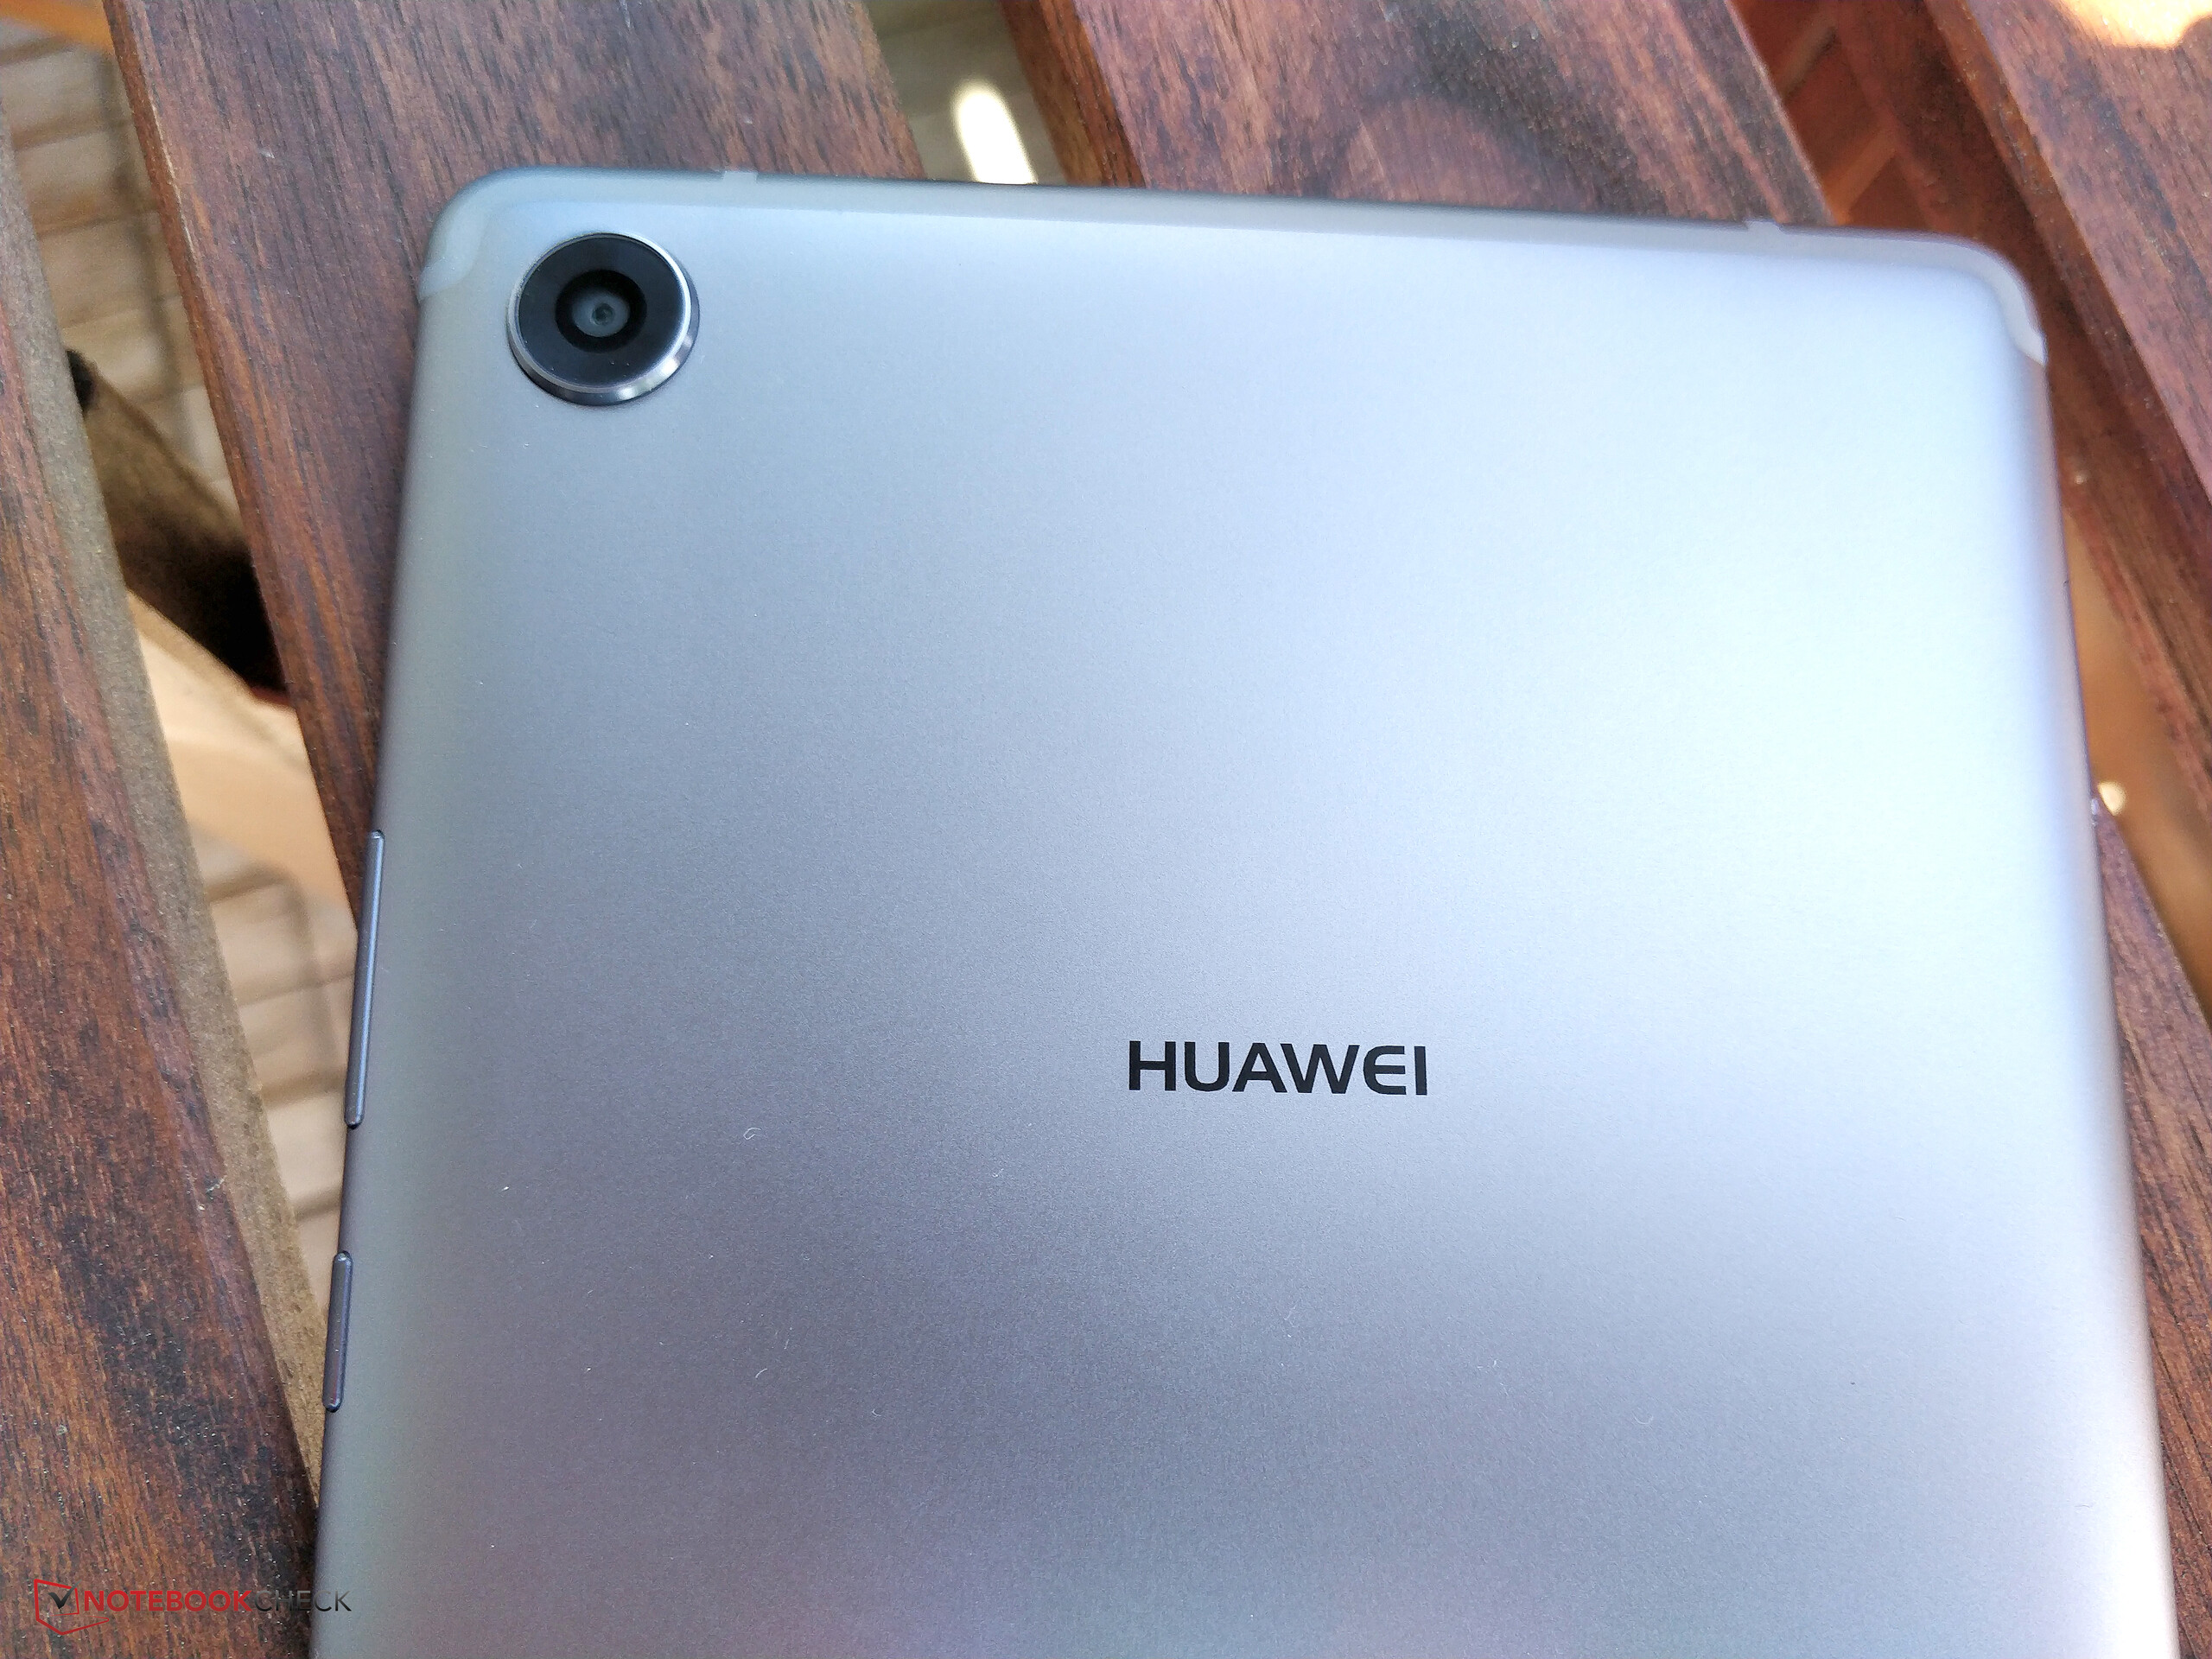
Med MediaPad M5 8.4 så släpper Huawei en ganska elegant surfplatta som är värd sitt aningen höga pris. Detta garanteras av bra kameror, en högupplöst skärm, kraftfulla högtalare och en del gimmicks såsom möjligheten att ringa telefonsamtal. Den har bra prestanda och det ergonomiska, högkvalitativa höljet känns bra i handen.
Men du får klara dig utan en klassisk ljudanslutning på MediaPad M5 8.4 och ibland är den tryckkänsliga skärmen aningen oexakt mot kanterna. Dessutom har skärmen en kraftig blå ton, men den går att reducera med dom inbyggda verktygen. Även om ett extra microSD-kort kan hjälpa till att utöka den smått dimensionerade interna lagringen så går det i princip inte att göra något alls åt den höga energiförbrukningen. Som tur är har den ändå en respektabel batteritid, så den höga energiförbrukningen gör inte så mycket. Det värsta är nog den markanta strypning som uppstår vid längre belastning.
Ett bra förhållande mellan pris och prestanda samt många fördelar såsom kamerabilder med rik detalj och ett utmärkt hölje gör att MediaPad M5 8.4 förtjänar en köprekommendation.
Totalt sett så får MediaPad M5 8.4 en köprekommendation från oss, då det är en enhet med bra förhållande mellan pris och prestanda som ser ut att vara av hög kvalitet och som inte har några allt för stora svagheter.
Huawei MediaPad M5 8.4
- 09/17/2019 v7 (old)
Florian Wimmer