Test: HP ProBook 440 G6 (i7, 512 GB, FHD) Laptop (Sammanfattning)

| SD Card Reader | |
| average JPG Copy Test (av. of 3 runs) | |
| HP ProBook 440 G5-3KX87ES (Toshiba Exceria Pro SDXC 64 GB UHS-II) | |
| HP ProBook 440 G6-5TK01EA (Toshiba Exceria Pro SDXC 64 GB UHS-II) | |
| Lenovo ThinkPad E480-20KNCTO1WW (Toshiba Exceria Pro M501) | |
| Lenovo ThinkPad A485-20MU000CGE (Toshiba Exceria Pro SDXC 64 GB UHS-II) | |
| Fujitsu Lifebook E548 (Toshiba Exceria Pro SDXC 64 GB UHS-II) | |
| Genomsnitt av klass Office (19.8 - 198.5, n=22, senaste 2 åren) | |
| Acer TravelMate X3410-M-866T (Toshiba Exceria Pro SDXC 64 GB UHS-II) | |
| maximum AS SSD Seq Read Test (1GB) | |
| HP ProBook 440 G5-3KX87ES (Toshiba Exceria Pro SDXC 64 GB UHS-II) | |
| Lenovo ThinkPad E480-20KNCTO1WW (Toshiba Exceria Pro M501) | |
| Lenovo ThinkPad A485-20MU000CGE (Toshiba Exceria Pro SDXC 64 GB UHS-II) | |
| HP ProBook 440 G6-5TK01EA (Toshiba Exceria Pro SDXC 64 GB UHS-II) | |
| Genomsnitt av klass Office (27.4 - 249, n=21, senaste 2 åren) | |
| Fujitsu Lifebook E548 (Toshiba Exceria Pro SDXC 64 GB UHS-II) | |
| Acer TravelMate X3410-M-866T (Toshiba Exceria Pro SDXC 64 GB UHS-II) | |
| Networking | |
| iperf3 transmit AX12 | |
| HP ProBook 440 G6-5TK01EA | |
| Fujitsu Lifebook E548 | |
| HP ProBook 440 G5-3KX87ES | |
| Huawei MateBook D 14 W50F | |
| Lenovo ThinkPad A485-20MU000CGE | |
| Acer TravelMate X3410-M-866T | |
| Lenovo ThinkPad E480-20KNCTO1WW | |
| iperf3 receive AX12 | |
| HP ProBook 440 G5-3KX87ES | |
| HP ProBook 440 G6-5TK01EA | |
| Acer TravelMate X3410-M-866T | |
| Lenovo ThinkPad A485-20MU000CGE | |
| Fujitsu Lifebook E548 | |
| Huawei MateBook D 14 W50F | |
| Lenovo ThinkPad E480-20KNCTO1WW | |
| |||||||||||||||||||||||||
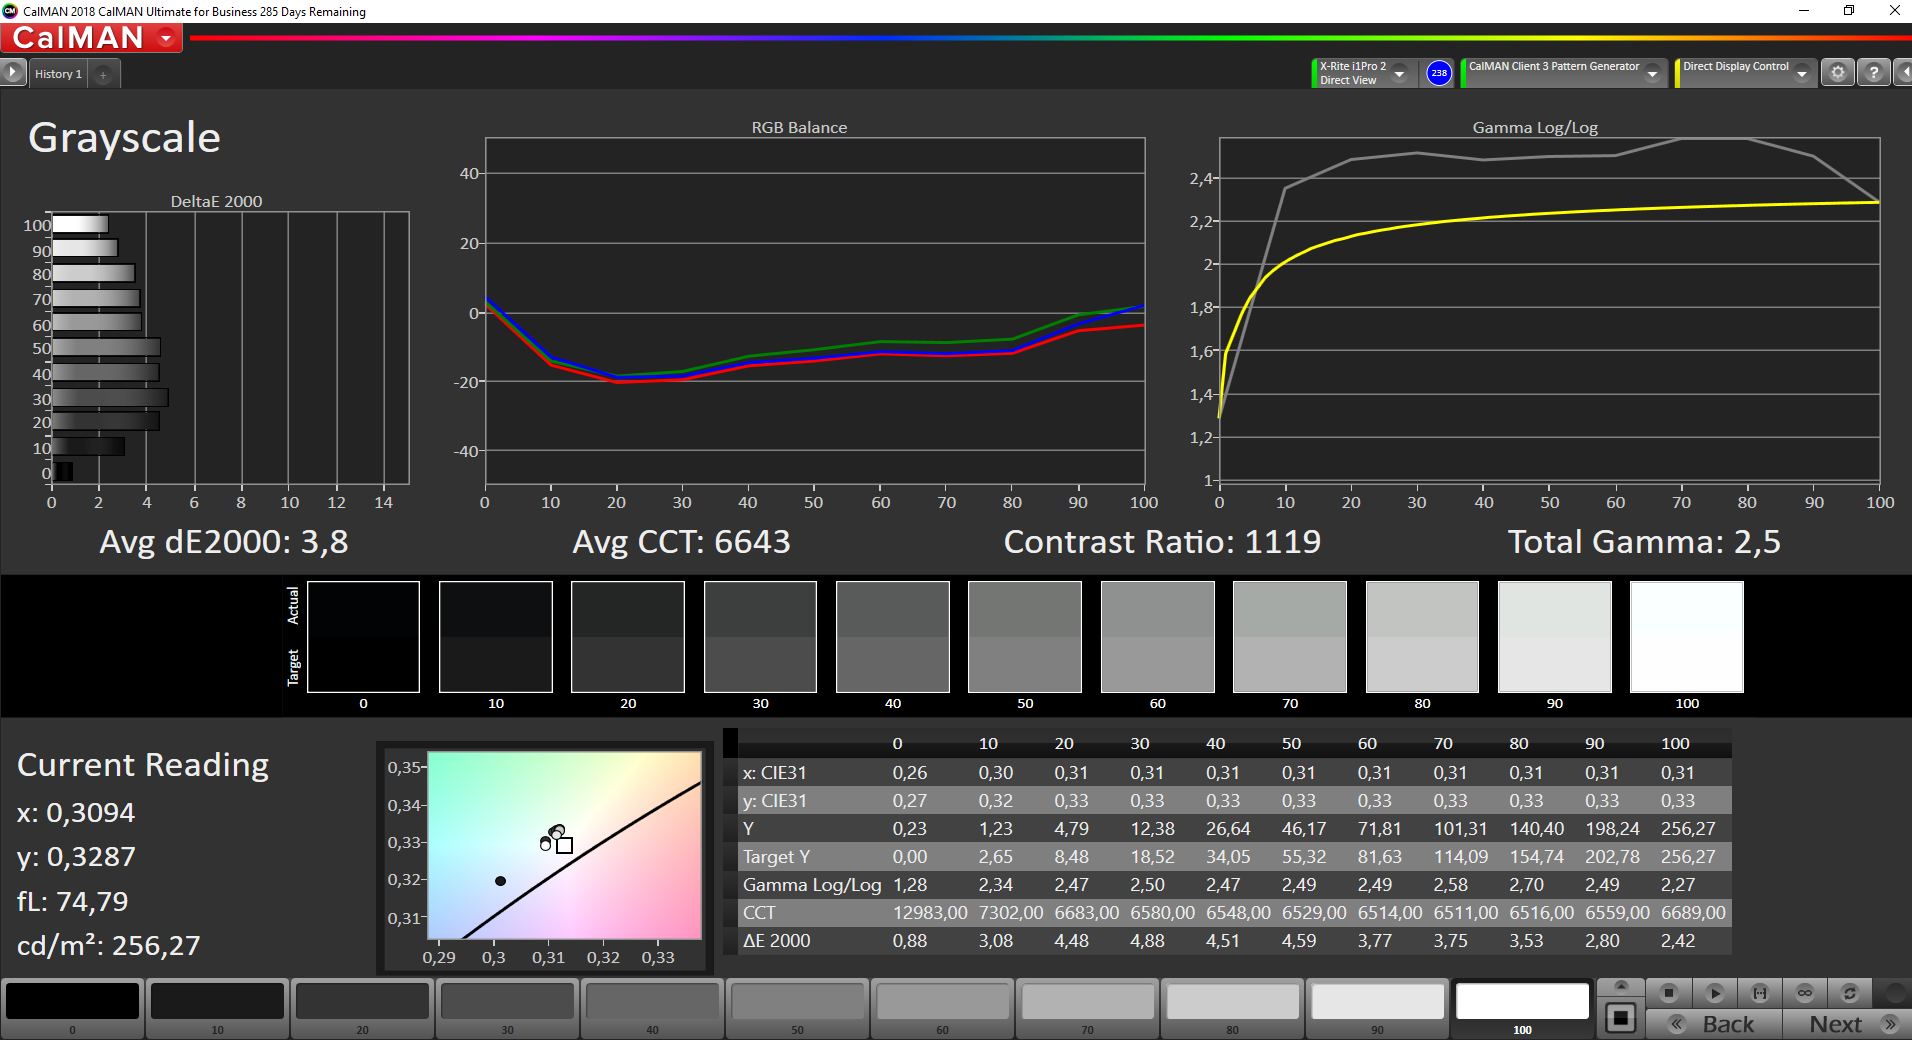
Distribution av ljusstyrkan: 85 %
Mitt på batteriet: 257 cd/m²
Kontrast: 1113:1 (Svärta: 0.23 cd/m²)
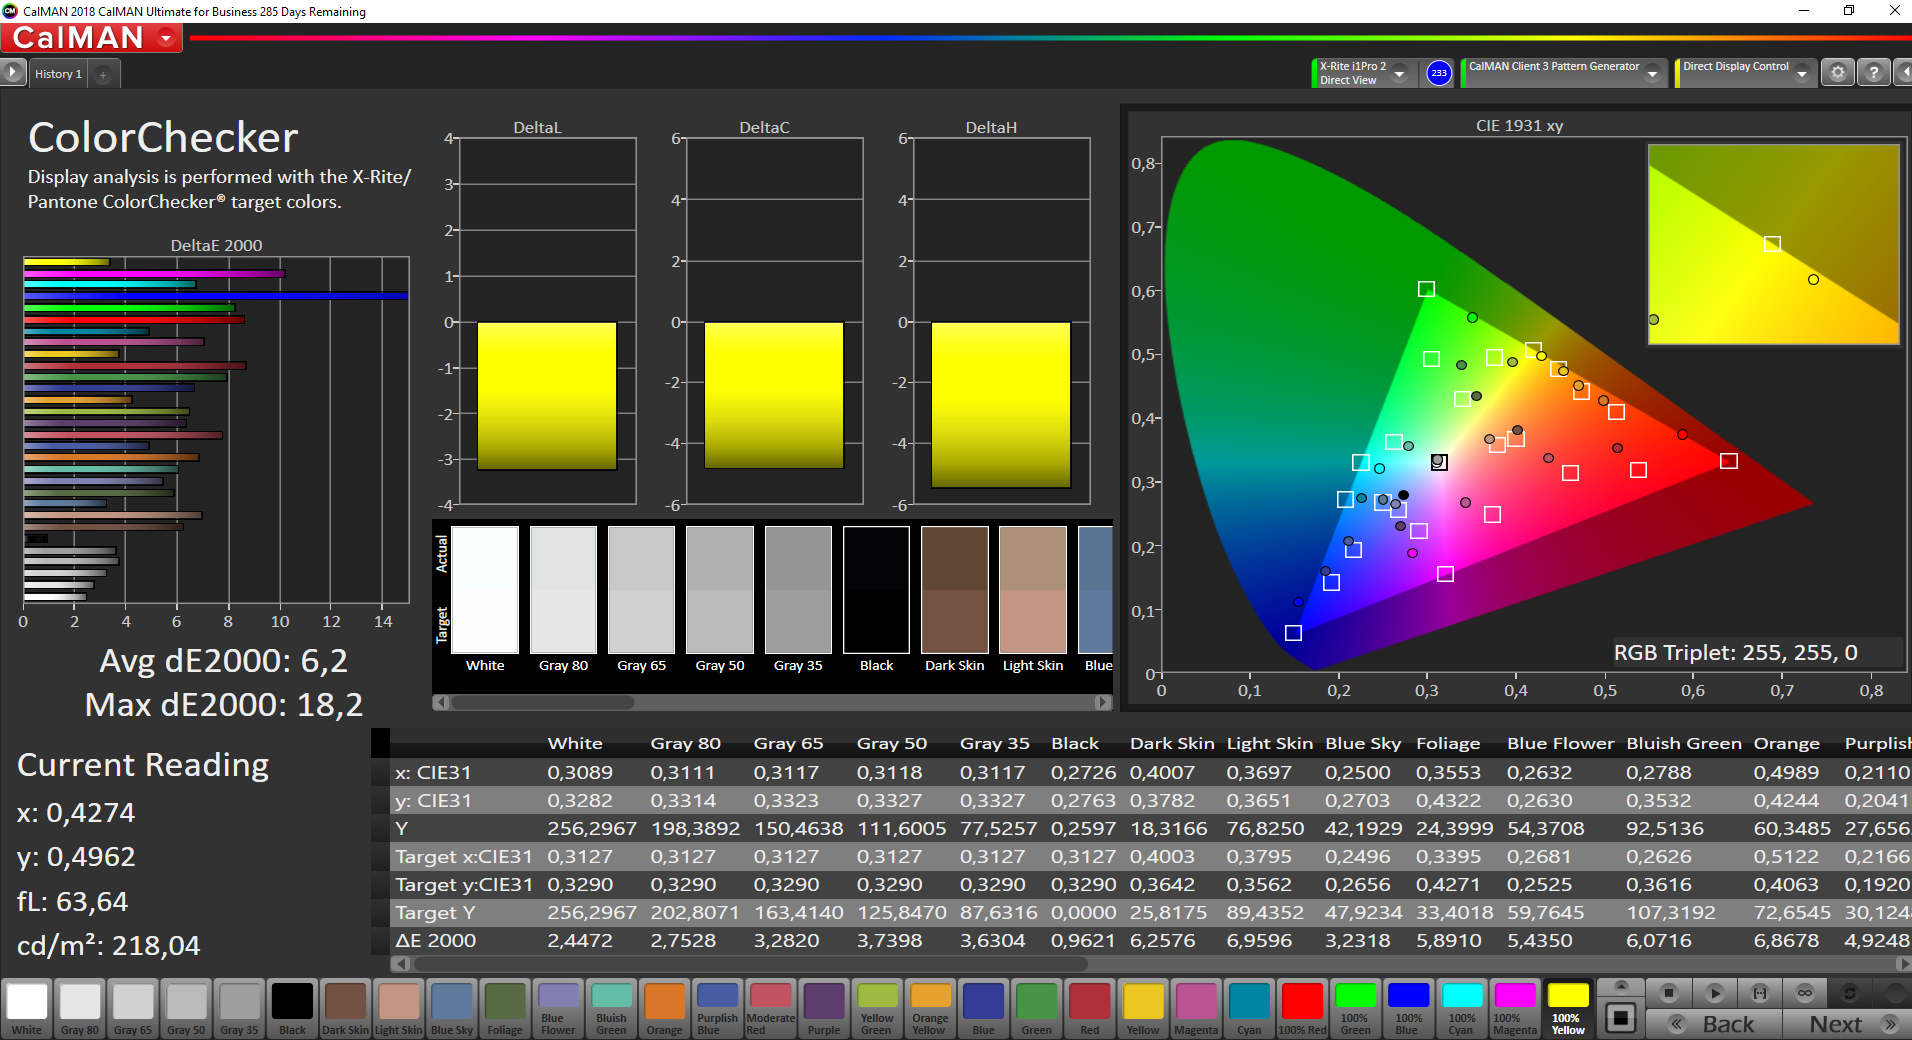
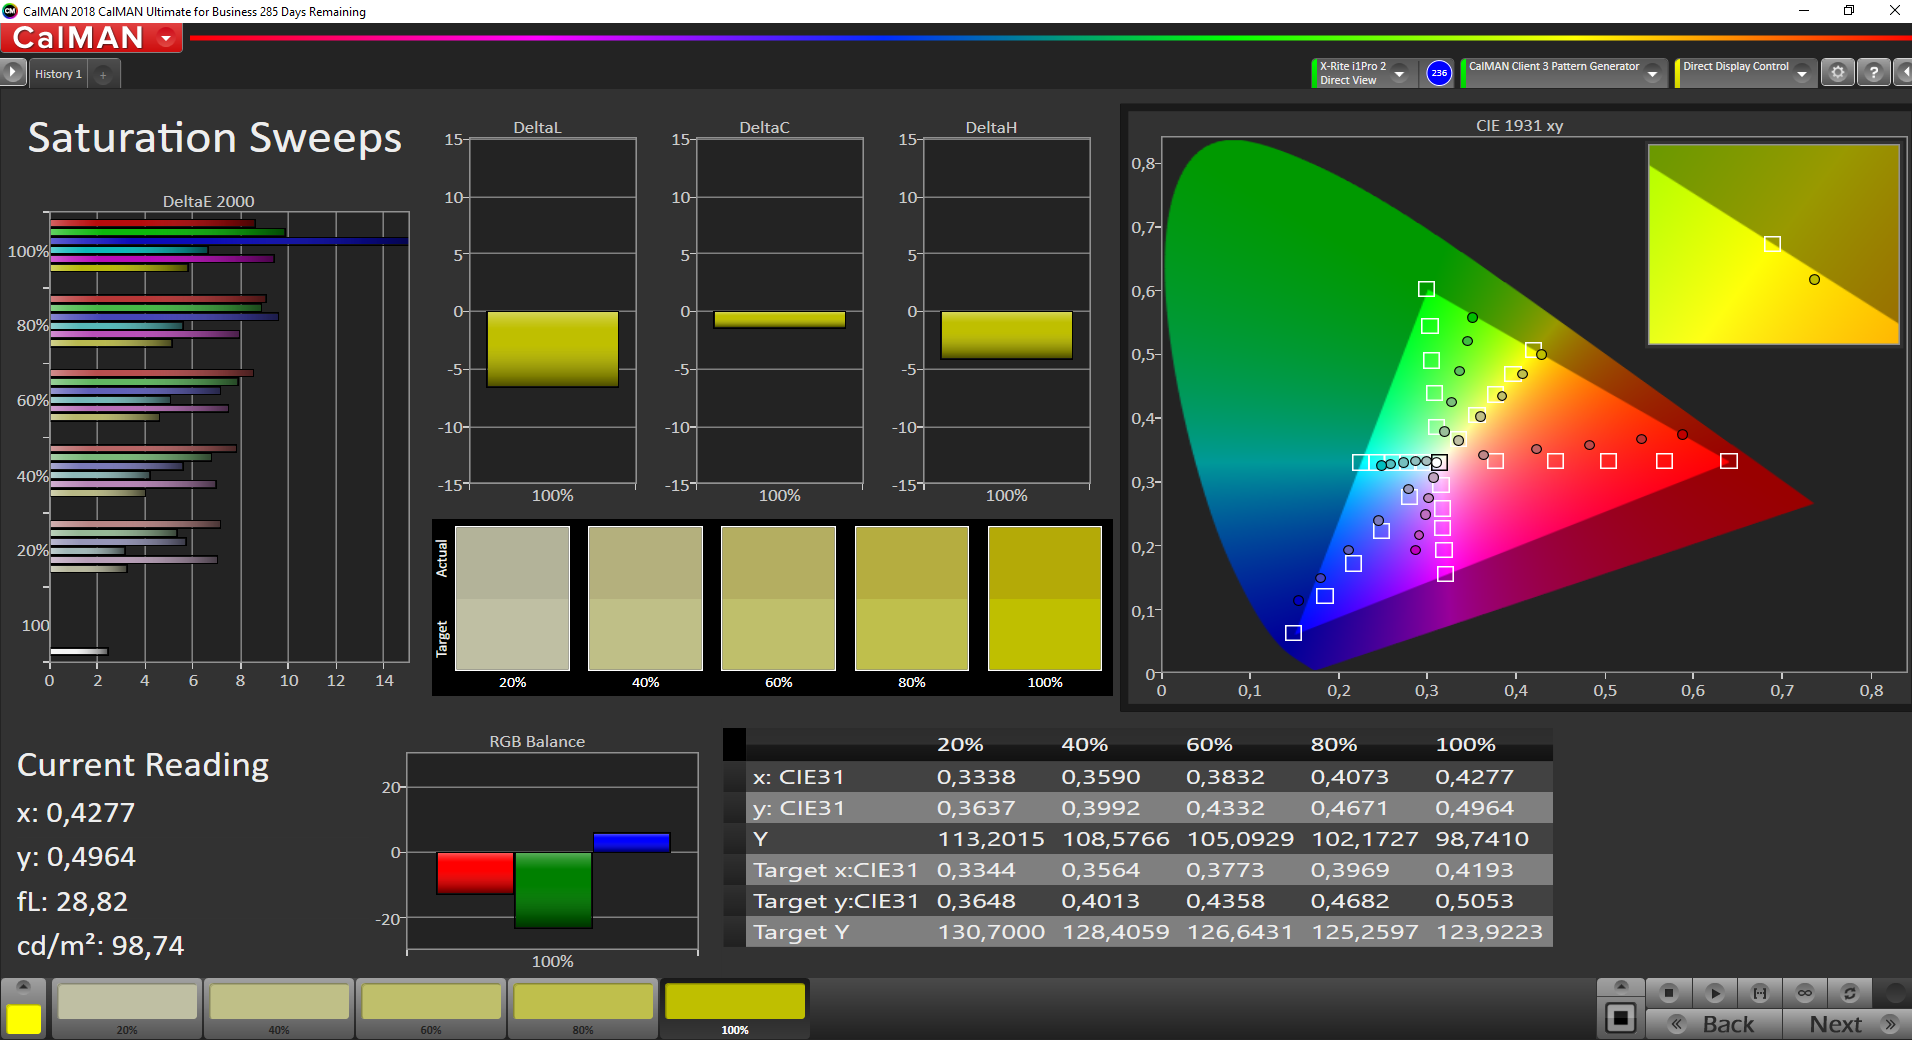
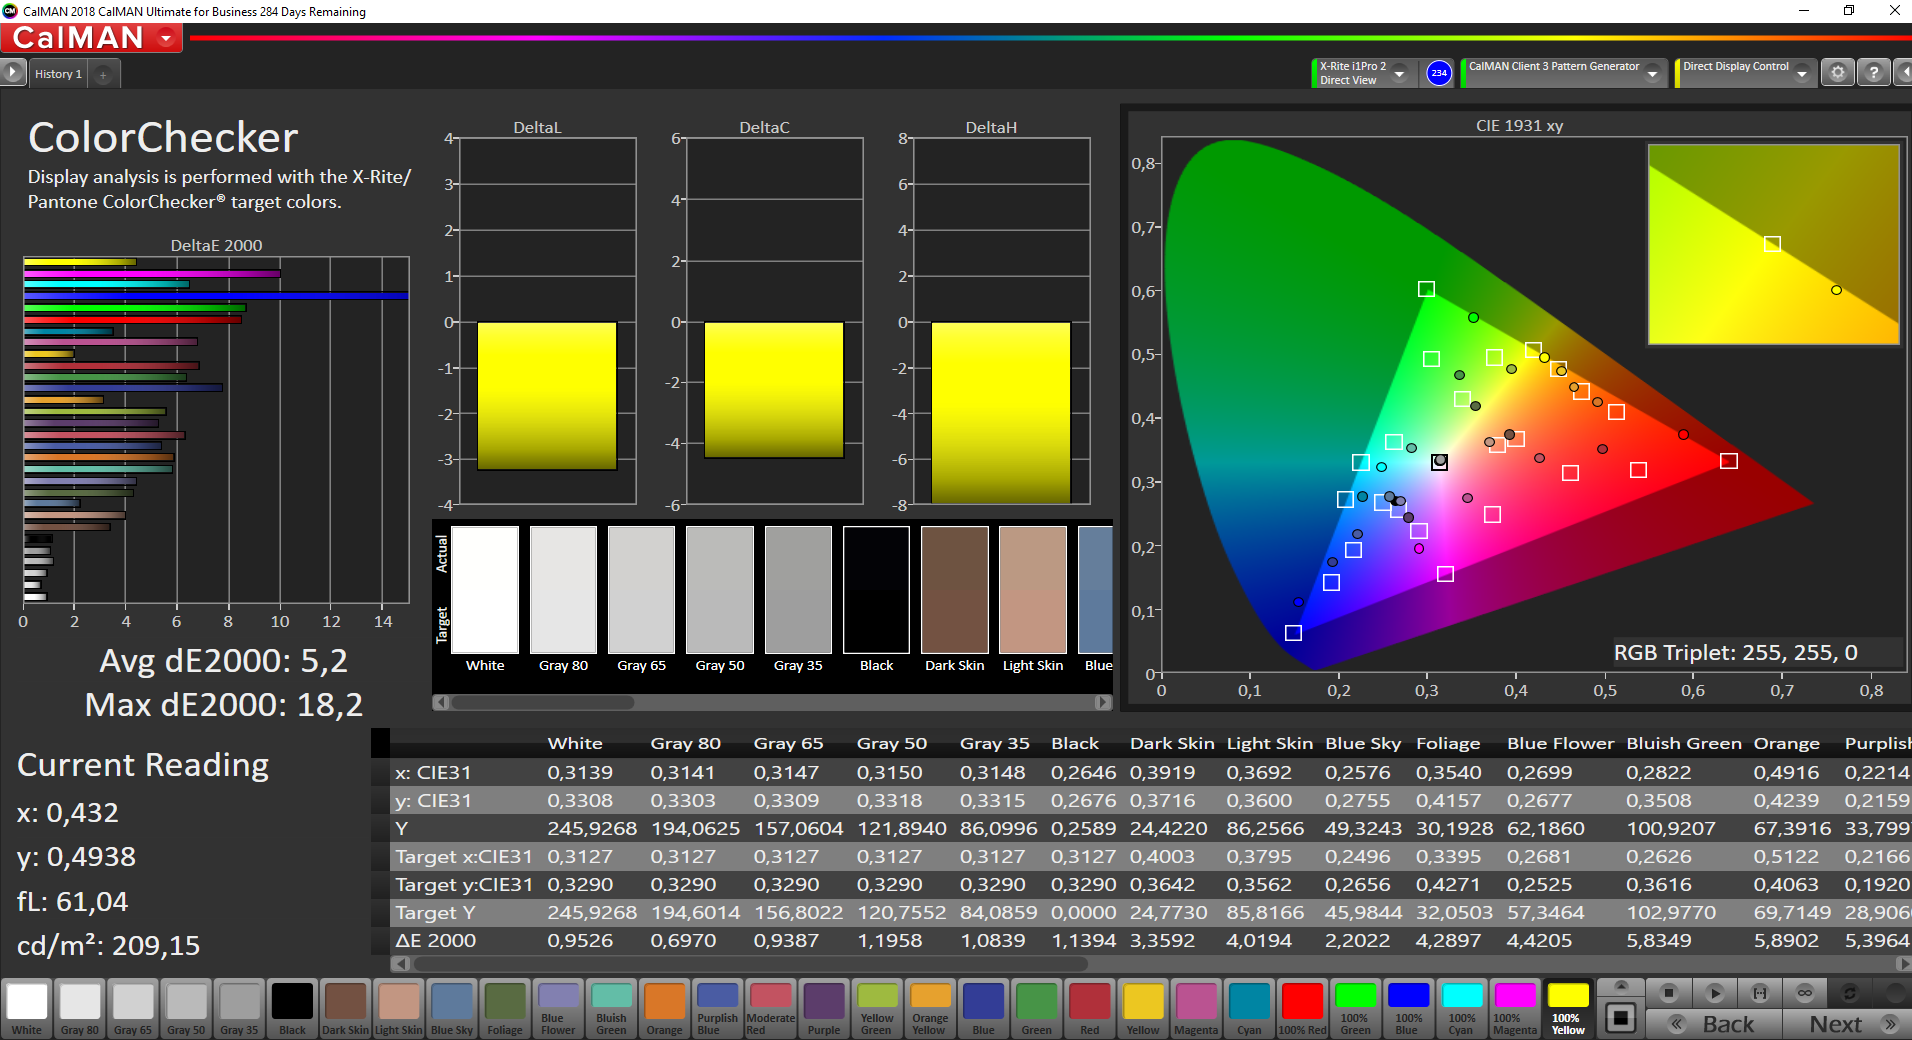
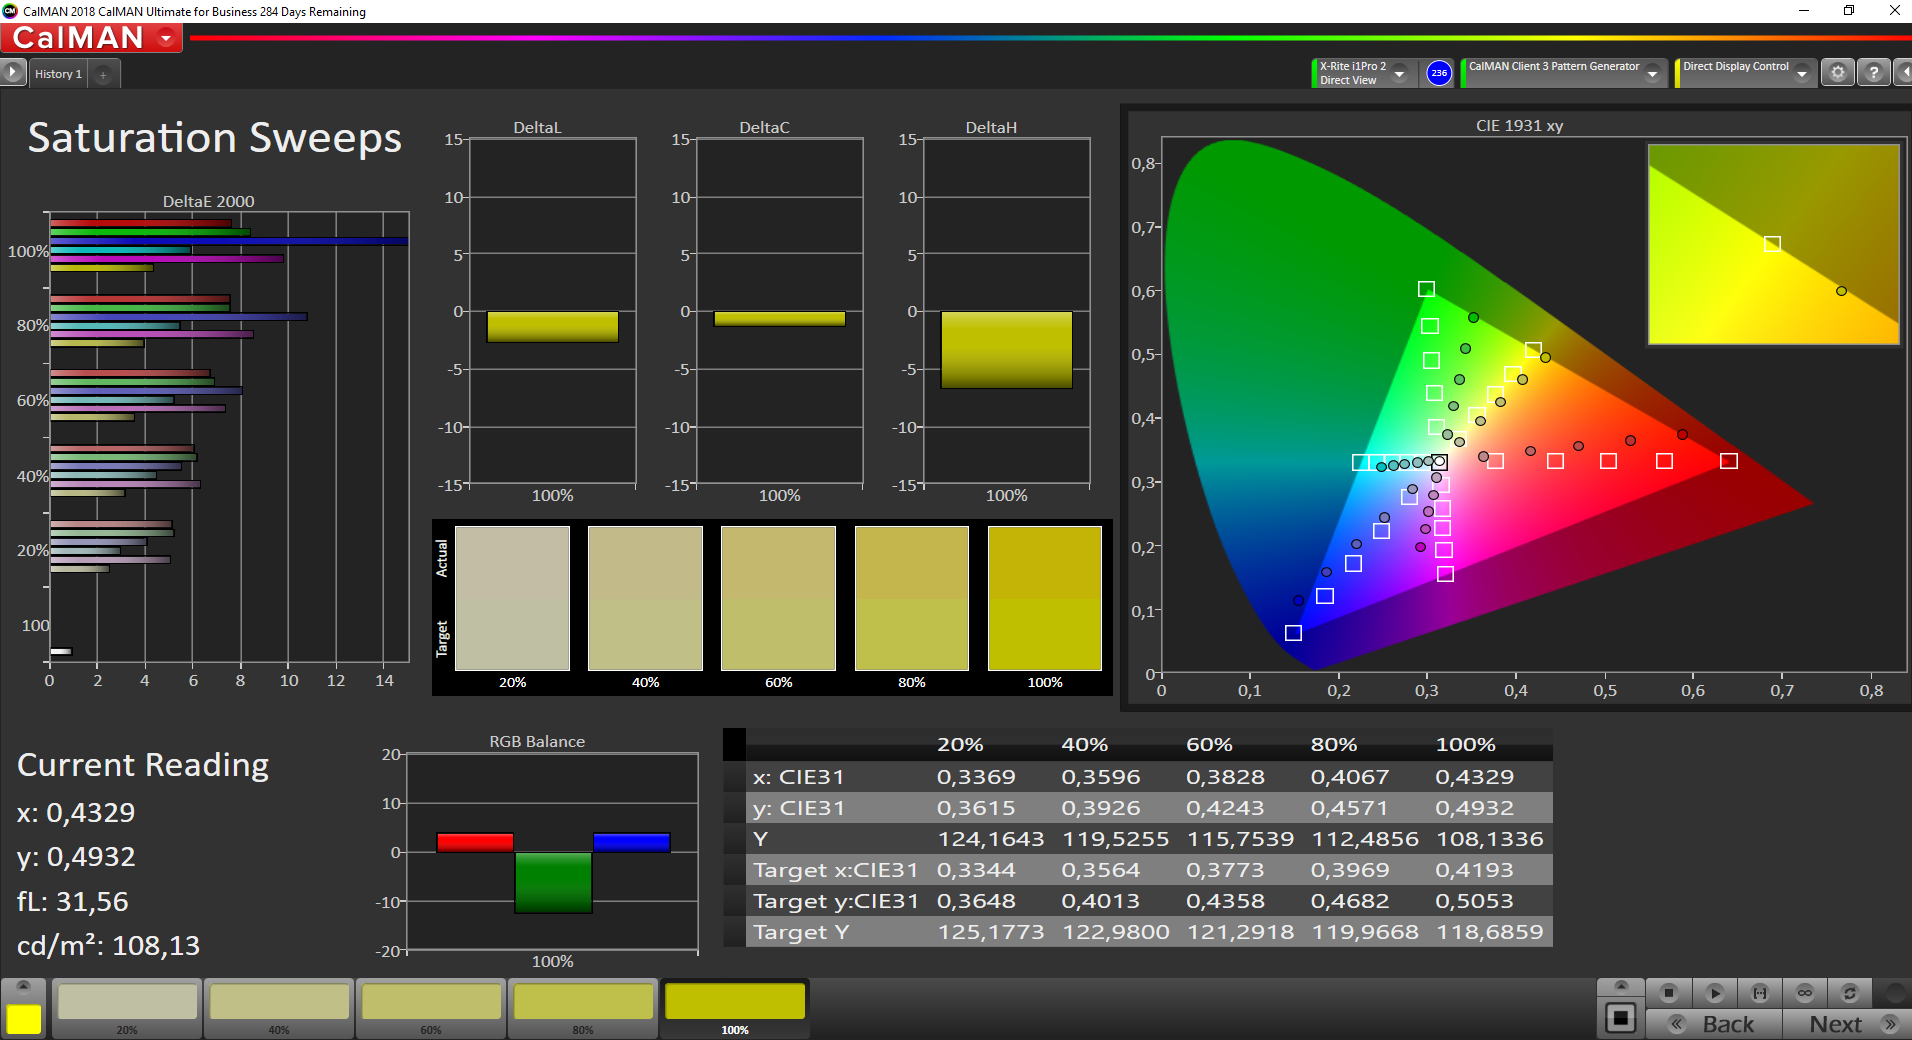
ΔE ColorChecker Calman: 6.2 | ∀{0.5-29.43 Ø4.72}
calibrated: 5.2
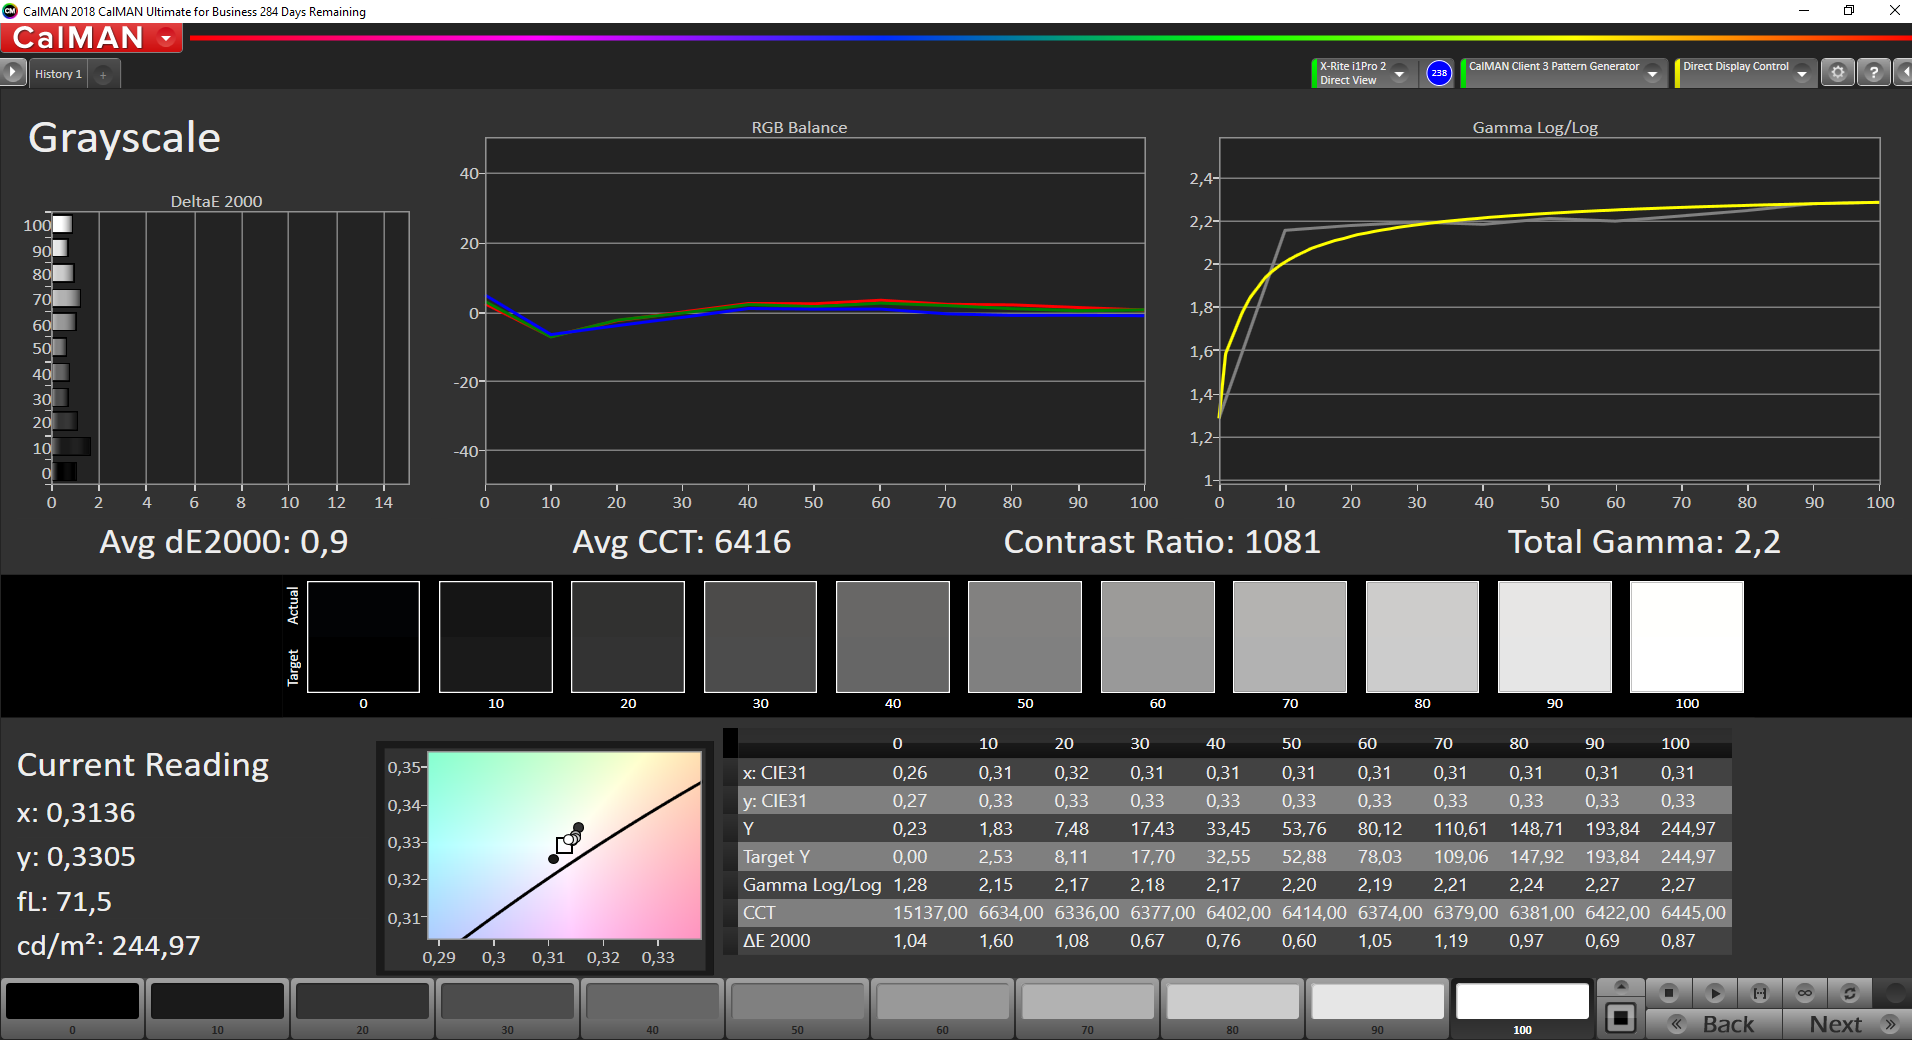
ΔE Greyscale Calman: 3.8 | ∀{0.09-98 Ø4.97}
56.9% sRGB (Argyll 1.6.3 3D)
36.1% AdobeRGB 1998 (Argyll 1.6.3 3D)
39.37% AdobeRGB 1998 (Argyll 3D)
57.2% sRGB (Argyll 3D)
38.08% Display P3 (Argyll 3D)
Gamma: 2.5
CCT: 6643 K
| HP ProBook 440 G6-5TK01EA LG Philips, LGD05F1, IPS, 1920x1080, 14" | HP ProBook 440 G5-3KX87ES LGD04B2, IPS LED, 1920x1080, 14" | Lenovo ThinkPad E480-20KNCTO1WW Innolux N140HCA-EAC, IPS LED, 1920x1080, 14" | Lenovo ThinkPad A485-20MU000CGE NV140FHM-N46, IPS LED, 1920x1080, 14" | Acer TravelMate X3410-M-866T Chi Mei CMN14D4, IPS, 1920x1080, 14" | Fujitsu Lifebook E548 LG Philips LGD05B6, IPS, 1920x1080, 14" | Huawei MateBook D 14 W50F BOE0764 / TV140FHM-NH0, IPS, 1920x1080, 14" | |
|---|---|---|---|---|---|---|---|
| Display | 4% | 9% | 6% | 9% | 3% | 13% | |
| Display P3 Coverage (%) | 38.08 | 39.56 4% | 41.56 9% | 40.24 6% | 41.59 9% | 39.21 3% | 43.19 13% |
| sRGB Coverage (%) | 57.2 | 59.3 4% | 62.2 9% | 60 5% | 62.4 9% | 58.5 2% | 64 12% |
| AdobeRGB 1998 Coverage (%) | 39.37 | 40.88 4% | 42.96 9% | 41.57 6% | 42.99 9% | 40.56 3% | 44.62 13% |
| Response Times | -1% | -12% | -19% | -13% | 21% | -18% | |
| Response Time Grey 50% / Grey 80% * (ms) | 41.6 ? | 40 ? 4% | 44.8 ? -8% | 44.8 ? -8% | 40.4 ? 3% | 34 ? 18% | 41 ? 1% |
| Response Time Black / White * (ms) | 27.2 ? | 28.8 ? -6% | 31.2 ? -15% | 35.2 ? -29% | 35.2 ? -29% | 21 ? 23% | 37 ? -36% |
| PWM Frequency (Hz) | 25000 ? | 1000 ? | 25000 ? | 200 ? | |||
| Screen | -5% | -5% | 2% | 1% | -1% | 2% | |
| Brightness middle (cd/m²) | 256 | 236 -8% | 262 2% | 275 7% | 253.1 -1% | 278 9% | 291 14% |
| Brightness (cd/m²) | 238 | 221 -7% | 245 3% | 272 14% | 230 -3% | 240 1% | 276 16% |
| Brightness Distribution (%) | 85 | 88 4% | 83 -2% | 85 0% | 77 -9% | 78 -8% | 85 0% |
| Black Level * (cd/m²) | 0.23 | 0.26 -13% | 0.19 17% | 0.26 -13% | 0.3 -30% | 0.27 -17% | 0.46 -100% |
| Contrast (:1) | 1113 | 908 -18% | 1379 24% | 1058 -5% | 844 -24% | 1030 -7% | 633 -43% |
| Colorchecker dE 2000 * | 6.2 | 5.7 8% | 7 -13% | 5.9 5% | 4.71 24% | 5.57 10% | 4.3 31% |
| Colorchecker dE 2000 max. * | 18.2 | 22 -21% | 23.6 -30% | 20 -10% | 20.72 -14% | 11.01 40% | 10.01 45% |
| Colorchecker dE 2000 calibrated * | 5.2 | 4.9 6% | 3.44 34% | 5.63 -8% | 3.18 39% | ||
| Greyscale dE 2000 * | 3.8 | 3.8 -0% | 6.4 -68% | 3.6 5% | 3.4 11% | 4.94 -30% | 4.21 -11% |
| Gamma | 2.5 88% | 2.1 105% | 2.14 103% | 2.36 93% | 1.997 110% | 2.6 85% | 2.46 89% |
| CCT | 6643 98% | 7318 89% | 6065 107% | 6798 96% | 6266 104% | 7322 89% | 6867 95% |
| Color Space (Percent of AdobeRGB 1998) (%) | 36.1 | 37.7 4% | 39.5 9% | 38.1 6% | 40 11% | 37 2% | 41 14% |
| Color Space (Percent of sRGB) (%) | 56.9 | 59.2 4% | 61.9 9% | 59.6 5% | 62 9% | 58 2% | 64 12% |
| Totalt genomsnitt (program/inställningar) | -1% /
-2% | -3% /
-3% | -4% /
0% | -1% /
1% | 8% /
3% | -1% /
1% |
* ... mindre är bättre
Visa svarstider
| ↔ Svarstid svart till vitt | ||
|---|---|---|
| 27.2 ms ... stiga ↗ och falla ↘ kombinerat | ↗ 15.6 ms stiga | 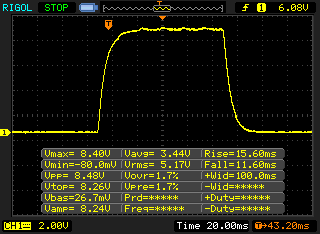 |
| ↘ 11.6 ms hösten | ||
| Skärmen visar relativt långsamma svarsfrekvenser i våra tester och kan vara för långsam för spelare. I jämförelse sträcker sig alla testade enheter från 0.1 (minst) till 240 (maximalt) ms. » 69 % av alla enheter är bättre. Detta innebär att den uppmätta svarstiden är sämre än genomsnittet av alla testade enheter (19.9 ms). | ||
| ↔ Svarstid 50 % grått till 80 % grått | ||
| 41.6 ms ... stiga ↗ och falla ↘ kombinerat | ↗ 22.8 ms stiga | 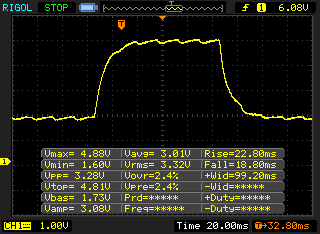 |
| ↘ 18.8 ms hösten | ||
| Skärmen visar långsamma svarsfrekvenser i våra tester och kommer att vara otillfredsställande för spelare. I jämförelse sträcker sig alla testade enheter från 0.165 (minst) till 636 (maximalt) ms. » 67 % av alla enheter är bättre. Detta innebär att den uppmätta svarstiden är sämre än genomsnittet av alla testade enheter (31.1 ms). | ||
Skärmflimmer / PWM (Puls-Width Modulation)
| Skärmflimmer / PWM upptäcktes inte | 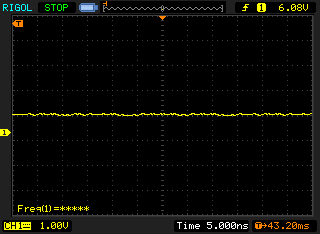 | ||
Som jämförelse: 52 % av alla testade enheter använder inte PWM för att dämpa skärmen. Om PWM upptäcktes mättes ett medelvärde av 7784 (minst: 5 - maximum: 343500) Hz. | |||
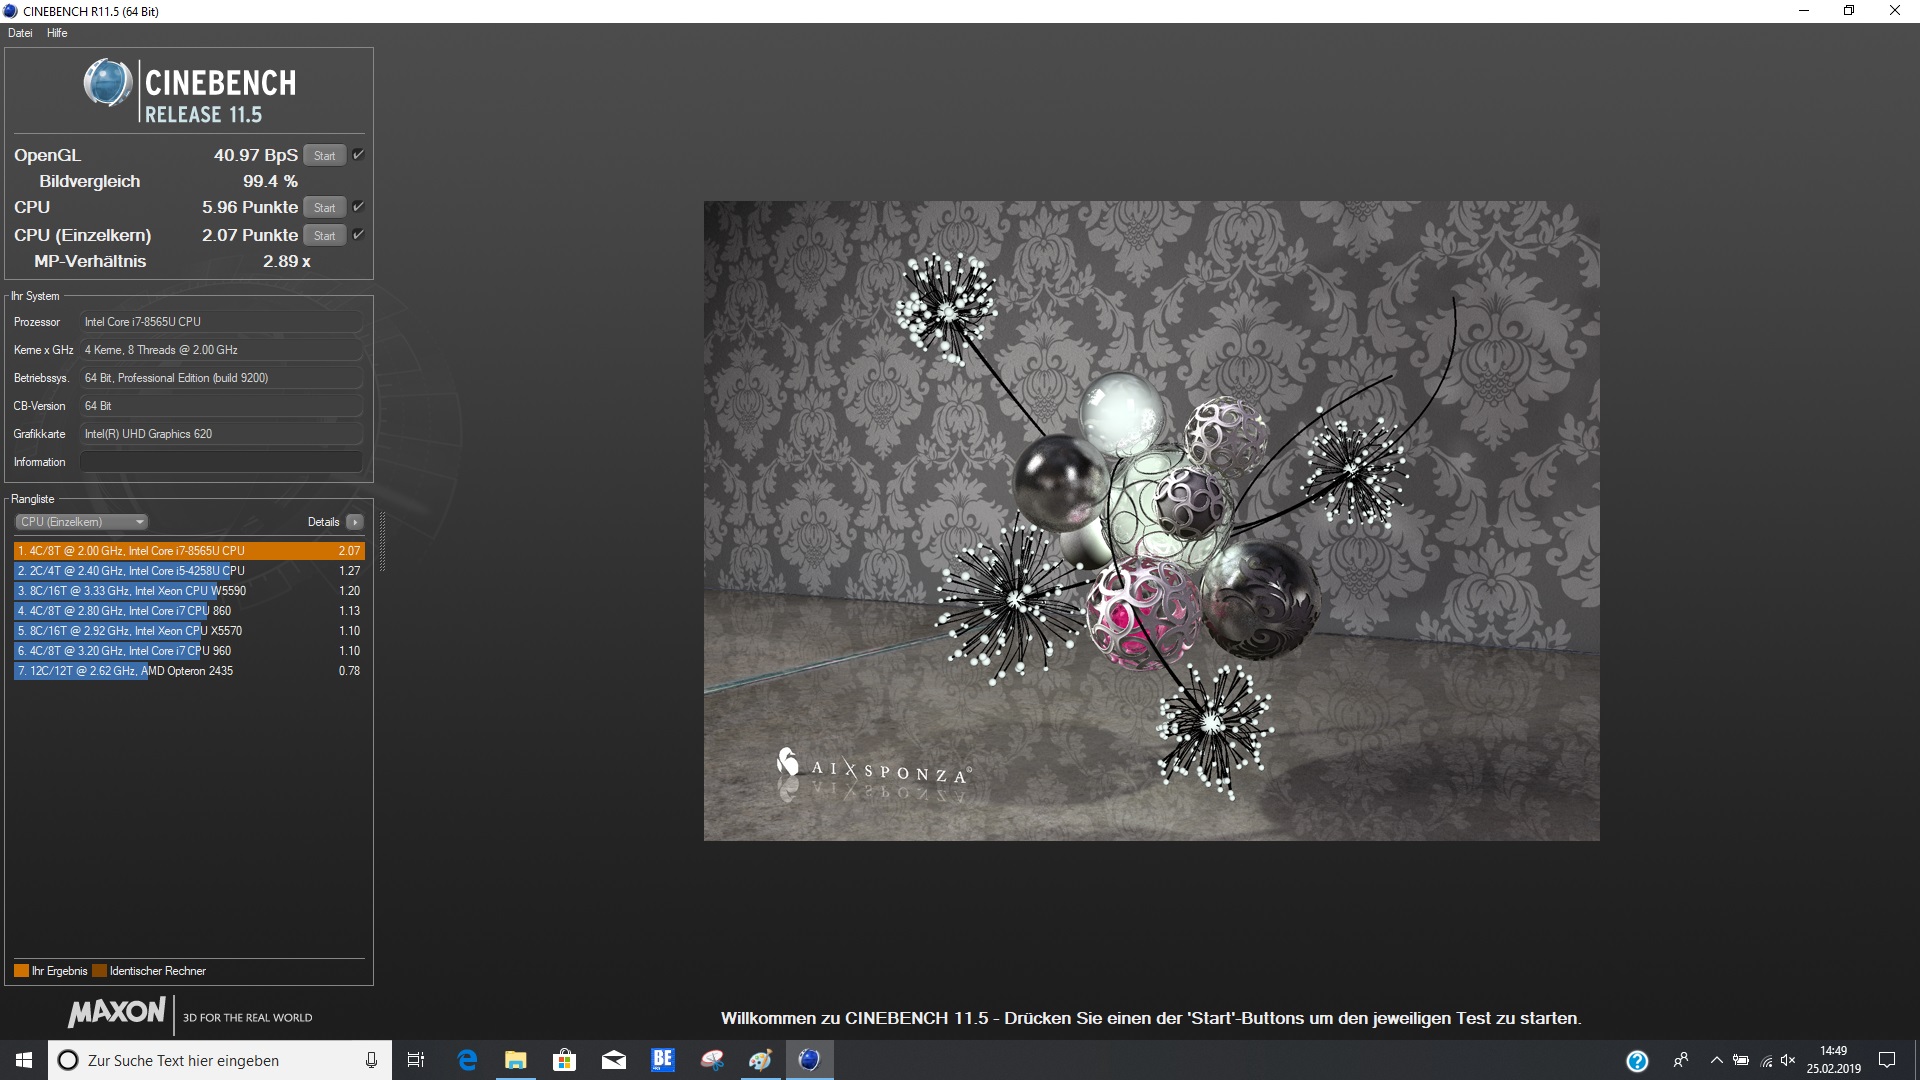
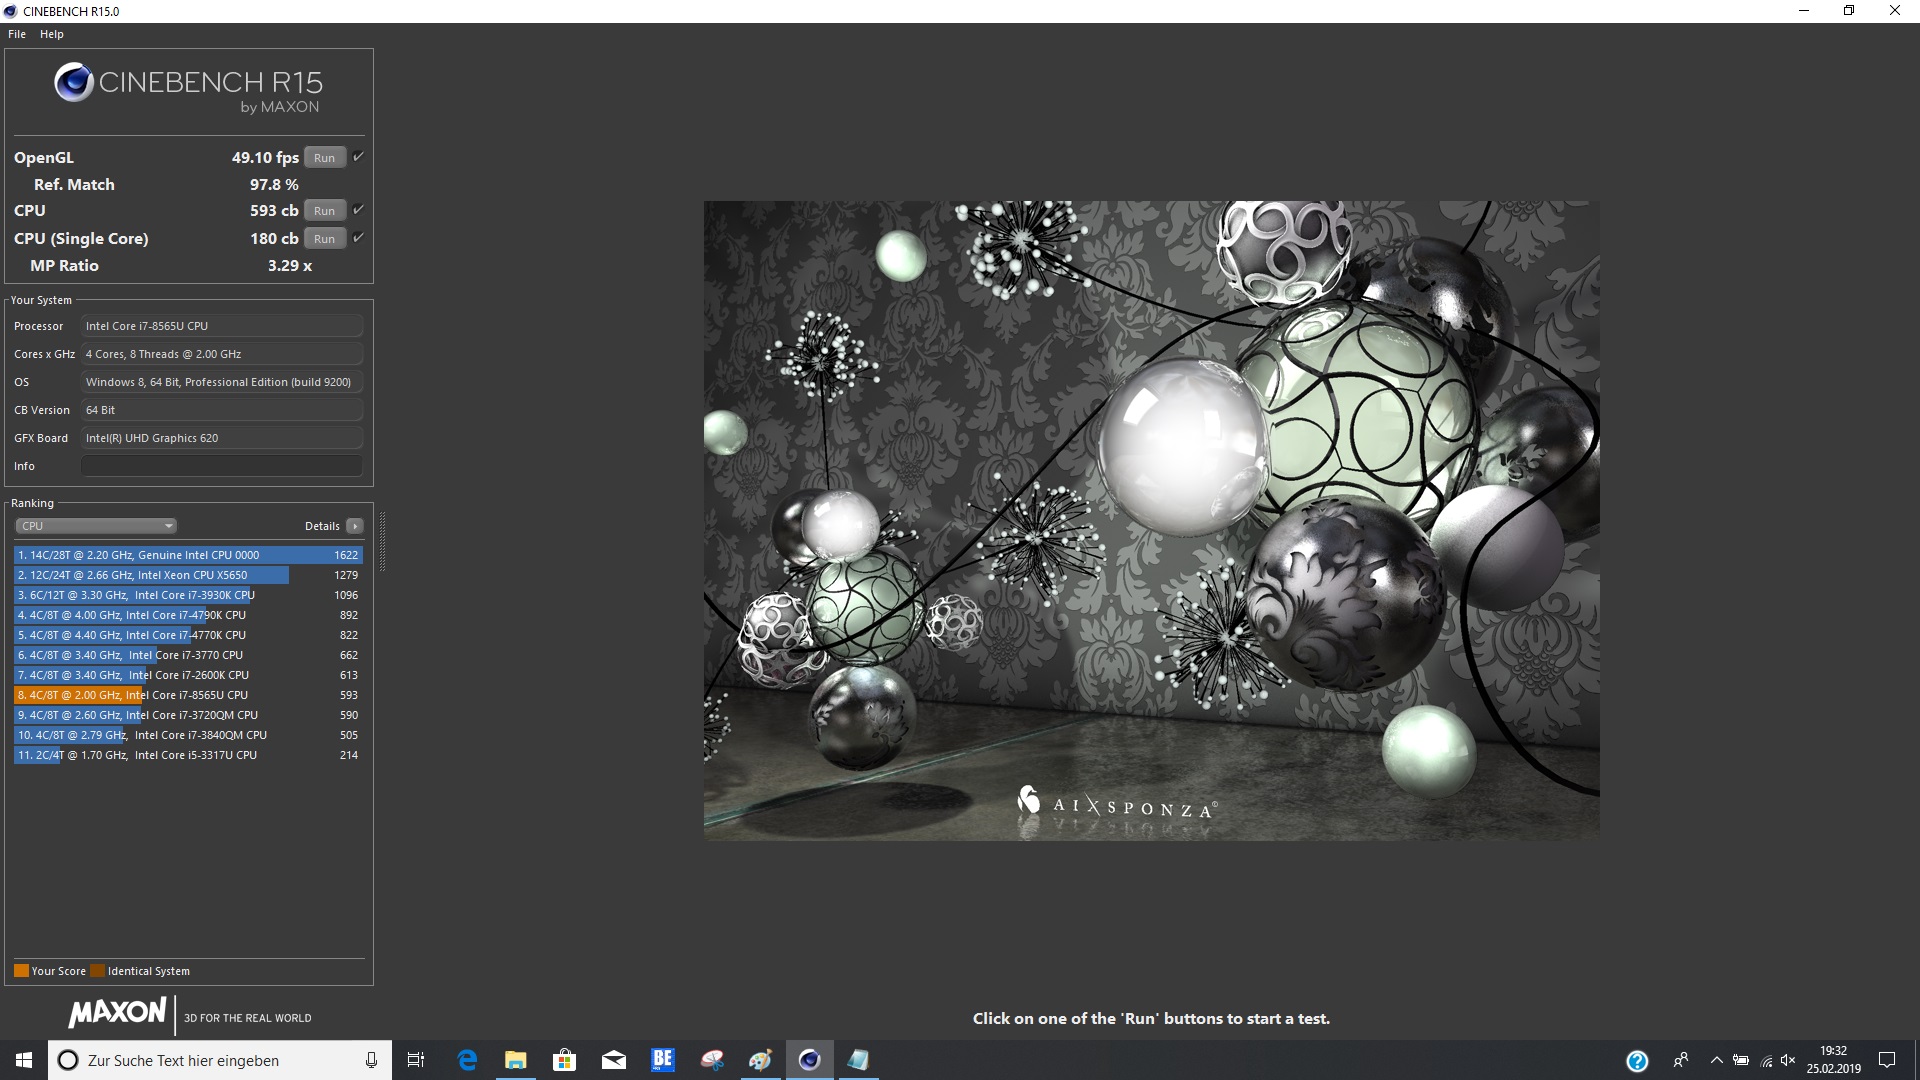
| Cinebench R15 | |
| CPU Single 64Bit | |
| Genomsnitt av klass Office (99.5 - 312, n=75, senaste 2 åren) | |
| HP ProBook 440 G6-5TK01EA | |
| Genomsnitt Intel Core i7-8565U (138.3 - 193, n=51) | |
| Acer TravelMate X3410-M-866T | |
| HP ProBook 440 G5-3KX87ES | |
| Lenovo ThinkPad E480-20KNCTO1WW | |
| Fujitsu Lifebook E548 | |
| Huawei MateBook D 14 W50F | |
| Lenovo ThinkPad A485-20MU000CGE | |
| CPU Multi 64Bit | |
| Genomsnitt av klass Office (250 - 3380, n=75, senaste 2 åren) | |
| HP ProBook 440 G5-3KX87ES | |
| Genomsnitt Intel Core i7-8565U (452 - 815, n=52) | |
| HP ProBook 440 G6-5TK01EA | |
| Huawei MateBook D 14 W50F | |
| Lenovo ThinkPad A485-20MU000CGE | |
| Lenovo ThinkPad E480-20KNCTO1WW | |
| Fujitsu Lifebook E548 | |
| Acer TravelMate X3410-M-866T | |
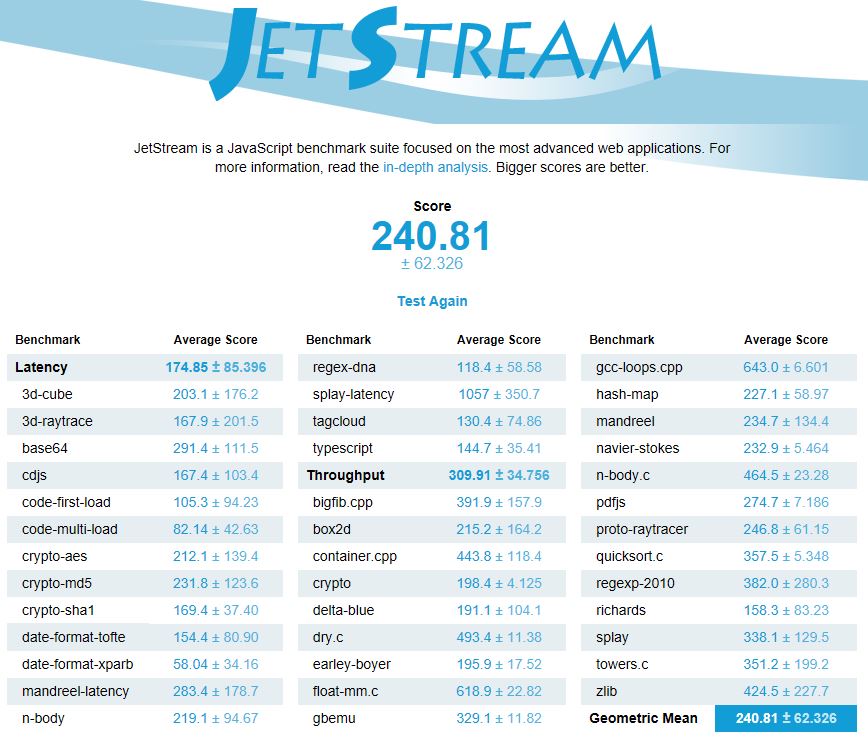
| JetStream 1.1 - 1.1 Total | |
| HP ProBook 440 G6-5TK01EA | |
| Genomsnitt Intel Core i7-8565U (107.6 - 277, n=37) | |
| Acer TravelMate X3410-M-866T | |
| HP ProBook 440 G5-3KX87ES | |
| Lenovo ThinkPad E480-20KNCTO1WW | |
| Fujitsu Lifebook E548 | |
| Lenovo ThinkPad A485-20MU000CGE | |
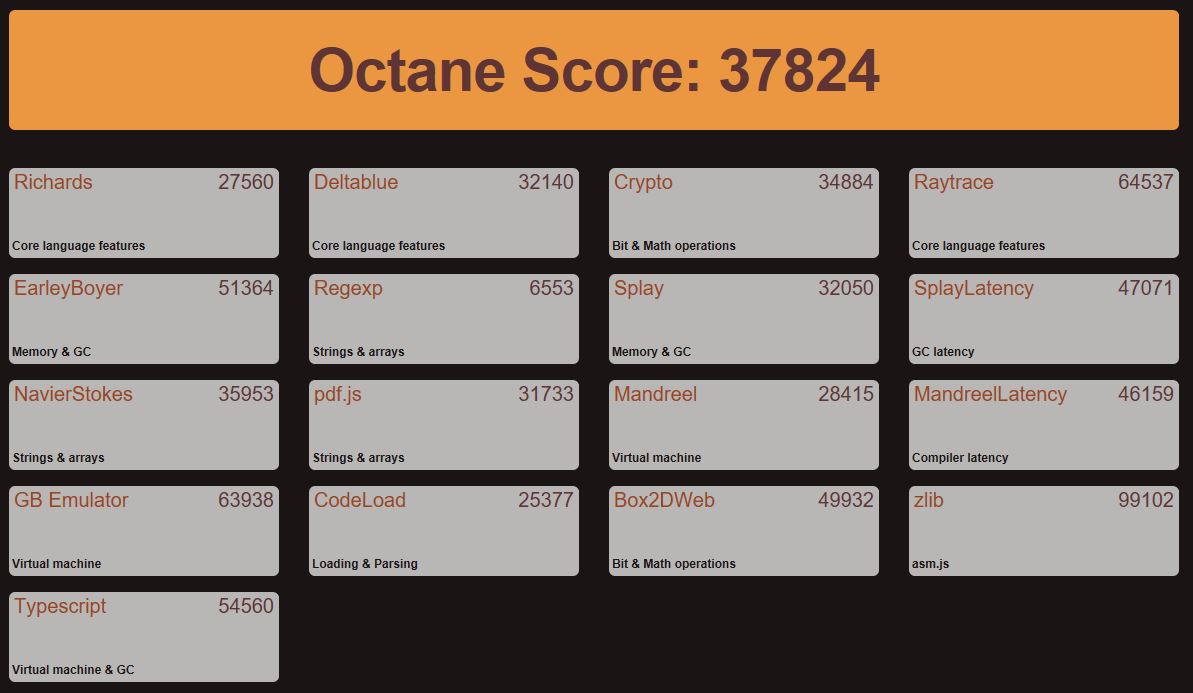
| Octane V2 - Total Score | |
| Genomsnitt av klass Office (49011 - 122119, n=19, senaste 2 åren) | |
| HP ProBook 440 G6-5TK01EA | |
| Genomsnitt Intel Core i7-8565U (13935 - 49795, n=42) | |
| HP ProBook 440 G5-3KX87ES | |
| Lenovo ThinkPad E480-20KNCTO1WW | |
| Acer TravelMate X3410-M-866T | |
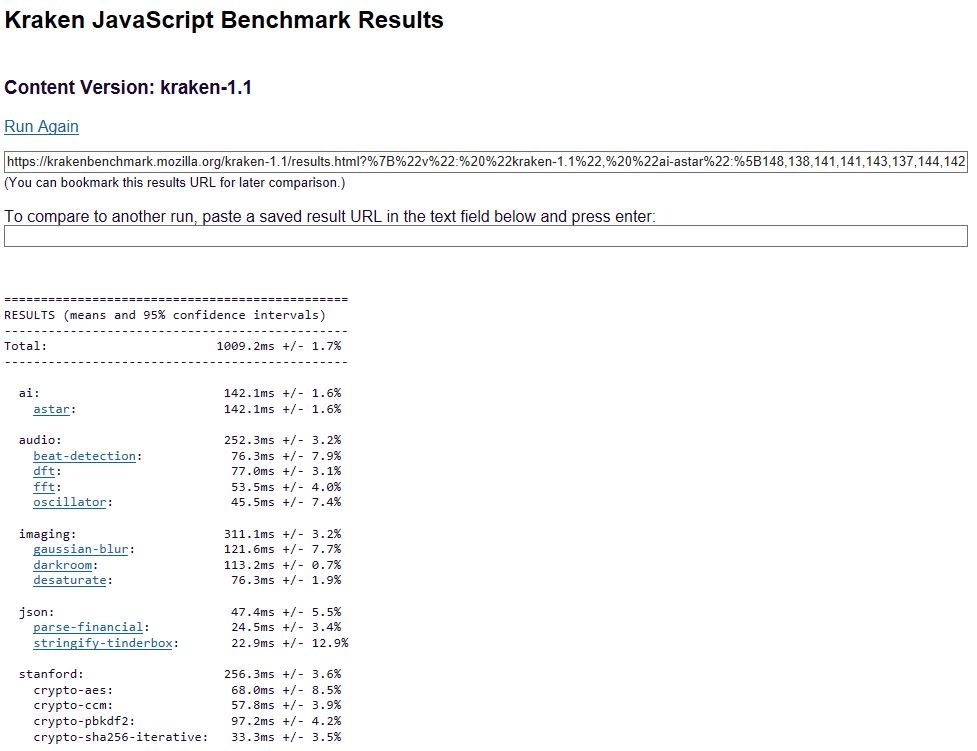
| Mozilla Kraken 1.1 - Total | |
| Lenovo ThinkPad A485-20MU000CGE | |
| Lenovo ThinkPad E480-20KNCTO1WW | |
| Acer TravelMate X3410-M-866T | |
| Genomsnitt Intel Core i7-8565U (730 - 2622, n=43) | |
| HP ProBook 440 G5-3KX87ES | |
| HP ProBook 440 G6-5TK01EA | |
| Genomsnitt av klass Office (391 - 1297, n=76, senaste 2 åren) | |
| Blender - v2.79 BMW27 CPU | |
| Lenovo ThinkPad A485-20MU000CGE | |
| HP ProBook 440 G6-5TK01EA | |
| Genomsnitt Intel Core i7-8565U (687 - 1175, n=22) | |
| Genomsnitt av klass Office (158 - 1940, n=74, senaste 2 åren) | |
* ... mindre är bättre
| PCMark 8 | |
| Home Score Accelerated v2 | |
| Genomsnitt av klass Office (n=1senaste 2 åren) | |
| HP ProBook 440 G6-5TK01EA | |
| HP ProBook 440 G5-3KX87ES | |
| Lenovo ThinkPad E480-20KNCTO1WW | |
| Genomsnitt Intel Core i7-8565U, Intel UHD Graphics 620 (2577 - 4179, n=20) | |
| Acer TravelMate X3410-M-866T | |
| Fujitsu Lifebook E548 | |
| Lenovo ThinkPad A485-20MU000CGE | |
| Work Score Accelerated v2 | |
| Genomsnitt av klass Office (n=1senaste 2 åren) | |
| HP ProBook 440 G6-5TK01EA | |
| HP ProBook 440 G5-3KX87ES | |
| Acer TravelMate X3410-M-866T | |
| Lenovo ThinkPad E480-20KNCTO1WW | |
| Genomsnitt Intel Core i7-8565U, Intel UHD Graphics 620 (3596 - 5189, n=19) | |
| Lenovo ThinkPad A485-20MU000CGE | |
| PCMark 8 Home Score Accelerated v2 | 4071 poäng | |
| PCMark 8 Creative Score Accelerated v2 | 5124 poäng | |
| PCMark 8 Work Score Accelerated v2 | 5160 poäng | |
| PCMark 10 Score | 4015 poäng | |
Hjälp | ||
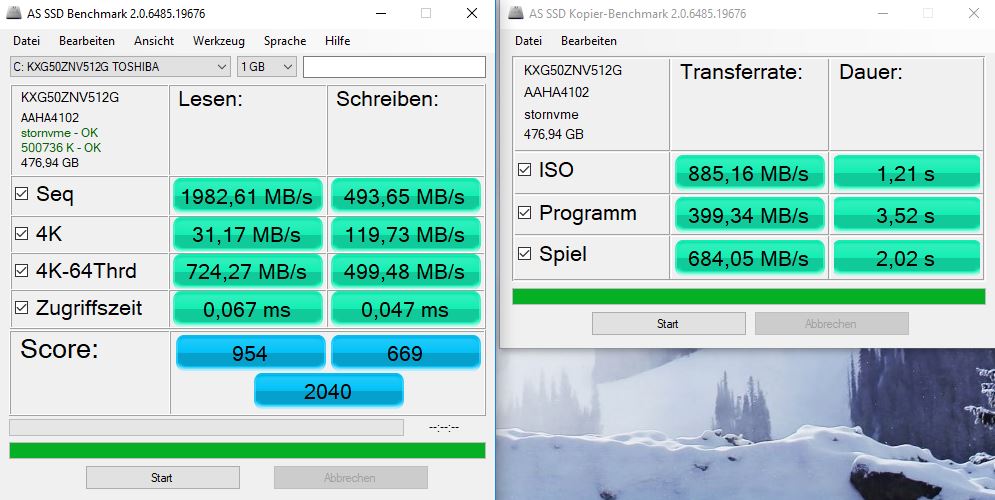
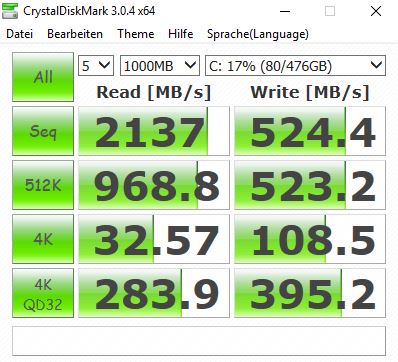
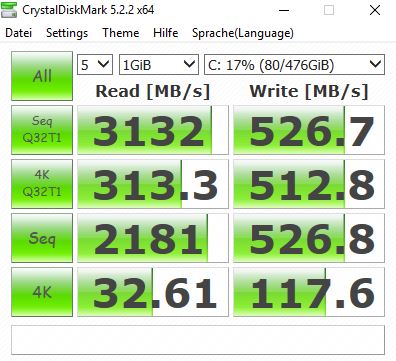
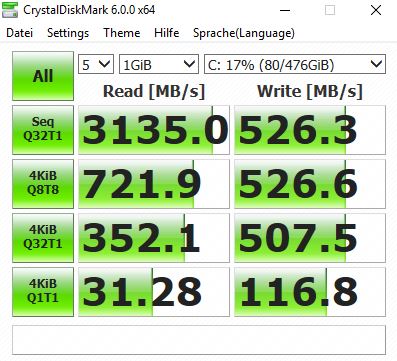
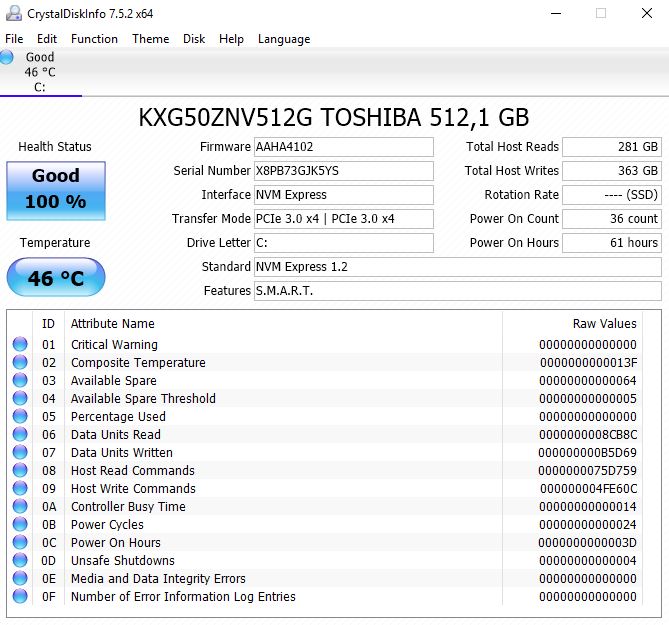
| HP ProBook 440 G6-5TK01EA Toshiba XG5 KXG50ZNV512G | HP ProBook 440 G5-3KX87ES Intel SSD 600p SSDPEKKW256G7 | Lenovo ThinkPad E480-20KNCTO1WW Toshiba KBG30ZMT128G | Lenovo ThinkPad A485-20MU000CGE Samsung SSD PM981 MZVLB256HAHQ | Acer TravelMate X3410-M-866T Micron SSD 1100 SED 512GB, M.2 (MTFDDAV512TBN) | Fujitsu Lifebook E548 Samsung SSD PM871b MZNLN256HAJQ | Huawei MateBook D 14 W50F SanDisk SD9SN8W256G1027 | Genomsnitt Toshiba XG5 KXG50ZNV512G | |
|---|---|---|---|---|---|---|---|---|
| CrystalDiskMark 5.2 / 6 | -12% | -54% | 34% | -32% | -42% | -41% | 18% | |
| Write 4K (MB/s) | 117.6 | 135.3 15% | 81.4 -31% | 114.8 -2% | 113.3 -4% | 83.2 -29% | 60.5 -49% | 114 ? -3% |
| Read 4K (MB/s) | 32.61 | 34.35 5% | 33.74 3% | 41.33 27% | 28.65 -12% | 16.66 -49% | 21.63 -34% | 35.6 ? 9% |
| Write Seq (MB/s) | 527 | 601 14% | 129 -76% | 1271 141% | 428.7 -19% | 384.3 -27% | 450.9 -14% | 684 ? 30% |
| Read Seq (MB/s) | 2181 | 1175 -46% | 905 -59% | 1171 -46% | 435.2 -80% | 466.8 -79% | 482.3 -78% | 1612 ? -26% |
| Write 4K Q32T1 (MB/s) | 508 | 377.6 -26% | 107.2 -79% | 218.4 -57% | 274.6 -46% | 269.7 -47% | 248.9 -51% | 401 ? -21% |
| Read 4K Q32T1 (MB/s) | 352.1 | 288.3 -18% | 197.1 -44% | 308.5 -12% | 326.5 -7% | 260 -26% | 267.6 -24% | 427 ? 21% |
| Write Seq Q32T1 (MB/s) | 526 | 591 12% | 128.9 -75% | 1460 178% | 505 -4% | 532 1% | 534 2% | 830 ? 58% |
| Read Seq Q32T1 (MB/s) | 3135 | 1574 -50% | 906 -71% | 1529 -51% | 530 -83% | 545 -83% | 563 -82% | 2950 ? -6% |
| Write 4K Q8T8 (MB/s) | 527 | 1208 129% | 887 ? 68% | |||||
| Read 4K Q8T8 (MB/s) | 722 | 983 36% | 1060 ? 47% | |||||
| AS SSD | -28% | -88% | -10% | -36% | -48% | -65% | -14% | |
| Seq Read (MB/s) | 1983 | 1282 -35% | 1015 -49% | 1224 -38% | 464.9 -77% | 448.4 -77% | 458.3 -77% | 2137 ? 8% |
| Seq Write (MB/s) | 493.6 | 430 -13% | 115.4 -77% | 1118 126% | 465.2 -6% | 246.1 -50% | 268.6 -46% | 744 ? 51% |
| 4K Read (MB/s) | 31.17 | 31.9 2% | 31.13 0% | 42.46 36% | 22.96 -26% | 14.13 -55% | 26.87 -14% | 30.1 ? -3% |
| 4K Write (MB/s) | 119.7 | 106.5 -11% | 78.9 -34% | 77.4 -35% | 89.1 -26% | 72.1 -40% | 51.7 -57% | 93.6 ? -22% |
| 4K-64 Read (MB/s) | 724 | 277.5 -62% | 190.9 -74% | 559 -23% | 350.5 -52% | 375.2 -48% | 364.2 -50% | 784 ? 8% |
| 4K-64 Write (MB/s) | 499.5 | 485 -3% | 92.1 -82% | 378.1 -24% | 313.3 -37% | 288.8 -42% | 137.3 -73% | 515 ? 3% |
| Access Time Read * (ms) | 0.067 | 0.119 -78% | 0.106 -58% | 0.081 -21% | 0.123 -84% | 0.092 -37% | 0.09253 ? -38% | |
| Access Time Write * (ms) | 0.047 | 0.032 32% | 0.235 -400% | 0.049 -4% | 0.047 -0% | 0.041 13% | 0.13 -177% | 0.1653 ? -252% |
| Score Read (Points) | 954 | 438 -54% | 324 -66% | 724 -24% | 420 -56% | 434 -55% | 437 -54% | 1028 ? 8% |
| Score Write (Points) | 669 | 634 -5% | 182 -73% | 567 -15% | 449 -33% | 385 -42% | 216 -68% | 683 ? 2% |
| Score Total (Points) | 2040 | 1264 -38% | 638 -69% | 1669 -18% | 1090 -47% | 1034 -49% | 875 -57% | 2170 ? 6% |
| Copy ISO MB/s (MB/s) | 885 | 522 -41% | 108.2 -88% | 812 -8% | 1109 ? 25% | |||
| Copy Program MB/s (MB/s) | 399.3 | 229.6 -42% | 78 -80% | 209.4 -48% | 380 ? -5% | |||
| Copy Game MB/s (MB/s) | 684 | 395.8 -42% | 105.5 -85% | 356.1 -48% | 738 ? 8% | |||
| Totalt genomsnitt (program/inställningar) | -20% /
-22% | -71% /
-76% | 12% /
8% | -34% /
-34% | -45% /
-46% | -53% /
-55% | 2% /
-1% |
* ... mindre är bättre

| 3DMark 11 - 1280x720 Performance GPU | |
| Genomsnitt av klass Office (2551 - 18313, n=68, senaste 2 åren) | |
| Lenovo ThinkPad A485-20MU000CGE | |
| HP ProBook 440 G6-5TK01EA | |
| Huawei MateBook D 14 W50F | |
| Genomsnitt Intel UHD Graphics 620 (1144 - 3432, n=244) | |
| HP ProBook 440 G5-3KX87ES | |
| Acer TravelMate X3410-M-866T | |
| Fujitsu Lifebook E548 | |
| Lenovo ThinkPad E480-20KNCTO1WW | |
| 3DMark | |
| 1280x720 Cloud Gate Standard Graphics | |
| Genomsnitt av klass Office (11640 - 118515, n=37, senaste 2 åren) | |
| Lenovo ThinkPad A485-20MU000CGE | |
| Huawei MateBook D 14 W50F | |
| HP ProBook 440 G6-5TK01EA | |
| Genomsnitt Intel UHD Graphics 620 (6205 - 16400, n=225) | |
| Acer TravelMate X3410-M-866T | |
| HP ProBook 440 G5-3KX87ES | |
| Lenovo ThinkPad E480-20KNCTO1WW | |
| 1920x1080 Fire Strike Graphics | |
| Genomsnitt av klass Office (736 - 21871, n=73, senaste 2 åren) | |
| Lenovo ThinkPad A485-20MU000CGE | |
| Huawei MateBook D 14 W50F | |
| HP ProBook 440 G6-5TK01EA | |
| Genomsnitt Intel UHD Graphics 620 (557 - 2608, n=213) | |
| Acer TravelMate X3410-M-866T | |
| HP ProBook 440 G5-3KX87ES | |
| Lenovo ThinkPad E480-20KNCTO1WW | |
| 2560x1440 Time Spy Graphics | |
| Genomsnitt av klass Office (493 - 6679, n=68, senaste 2 åren) | |
| Genomsnitt Intel UHD Graphics 620 (299 - 797, n=88) | |
| Lenovo ThinkPad E480-20KNCTO1WW | |
| 3DMark 11 Performance | 1997 poäng | |
| 3DMark Ice Storm Standard Score | 45682 poäng | |
| 3DMark Cloud Gate Standard Score | 8458 poäng | |
| 3DMark Fire Strike Score | 1090 poäng | |
| 3DMark Fire Strike Extreme Score | 506 poäng | |
Hjälp | ||
| låg | med. | hög | ultra | |
|---|---|---|---|---|
| BioShock Infinite (2013) | 59.8 | 34.3 | 27.4 | 8.2 |
| Dota 2 Reborn (2015) | 70 | 42.5 | 19.7 | 17.5 |
| Rise of the Tomb Raider (2016) | 20.6 | 13.4 | 6.9 | |
| Rocket League (2017) | 25.5 | 16.9 | ||
| X-Plane 11.11 (2018) | 30.3 | 22.7 | 19.1 |
Ljudnivå
| Låg belastning |
| 29.4 / 29.4 / 30.2 dB(A) |
| Hög belastning |
| 31.8 / 33.1 dB(A) |
 | ||
30 dB tyst 40 dB(A) hörbar 50 dB(A) högt ljud |
||
min: | ||
| HP ProBook 440 G6-5TK01EA UHD Graphics 620, i7-8565U, Toshiba XG5 KXG50ZNV512G | HP ProBook 440 G5-3KX87ES UHD Graphics 620, i5-8250U, Intel SSD 600p SSDPEKKW256G7 | Lenovo ThinkPad E480-20KNCTO1WW UHD Graphics 620, i5-8250U, Toshiba KBG30ZMT128G | Lenovo ThinkPad A485-20MU000CGE Vega 8, R5 PRO 2500U, Samsung SSD PM981 MZVLB256HAHQ | Acer TravelMate X3410-M-866T UHD Graphics 620, i5-8550U, Micron SSD 1100 SED 512GB, M.2 (MTFDDAV512TBN) | Fujitsu Lifebook E548 UHD Graphics 620, i5-8250U, Samsung SSD PM871b MZNLN256HAJQ | Huawei MateBook D 14 W50F UHD Graphics 620, i5-8250U, SanDisk SD9SN8W256G1027 | |
|---|---|---|---|---|---|---|---|
| Noise | -3% | 0% | 1% | 1% | -3% | -3% | |
| av / miljö * (dB) | 29.4 | 29.1 1% | 29.1 1% | 29.3 -0% | 28.2 4% | 30 -2% | 30.5 -4% |
| Idle Minimum * (dB) | 29.4 | 29.1 1% | 29.1 1% | 29.3 -0% | 28.2 4% | 30 -2% | 30.5 -4% |
| Idle Average * (dB) | 29.4 | 29.1 1% | 29.1 1% | 29.3 -0% | 28.2 4% | 30 -2% | 30.5 -4% |
| Idle Maximum * (dB) | 30.2 | 30.7 -2% | 30.3 -0% | 29.6 2% | 28.2 7% | 30 1% | 30.5 -1% |
| Load Average * (dB) | 31.8 | 34.5 -8% | 31.8 -0% | 31.6 1% | 33.2 -4% | 35.3 -11% | 33.6 -6% |
| Load Maximum * (dB) | 33.1 | 36 -9% | 33.8 -2% | 31.6 5% | 35.6 -8% | 33.9 -2% | 32.6 2% |
* ... mindre är bättre
(+) Den maximala temperaturen på ovansidan är 38.3 °C / 101 F, jämfört med genomsnittet av 34.3 °C / 94 F , allt från 21.2 till 62.5 °C för klassen Office.
(-) Botten värms upp till maximalt 50.5 °C / 123 F, jämfört med genomsnittet av 36.8 °C / 98 F
(+) Vid tomgångsbruk är medeltemperaturen för ovansidan 24.1 °C / 75 F, jämfört med enhetsgenomsnittet på 29.5 °C / ### class_avg_f### F.
(+) Handledsstöden och pekplattan är kallare än hudtemperaturen med maximalt 30.3 °C / 86.5 F och är därför svala att ta på.
(-) Medeltemperaturen för handledsstödsområdet på liknande enheter var 27.5 °C / 81.5 F (-2.8 °C / -5 F).
| HP ProBook 440 G6-5TK01EA UHD Graphics 620, i7-8565U, Toshiba XG5 KXG50ZNV512G | HP ProBook 440 G5-3KX87ES UHD Graphics 620, i5-8250U, Intel SSD 600p SSDPEKKW256G7 | Lenovo ThinkPad E480-20KNCTO1WW UHD Graphics 620, i5-8250U, Toshiba KBG30ZMT128G | Lenovo ThinkPad A485-20MU000CGE Vega 8, R5 PRO 2500U, Samsung SSD PM981 MZVLB256HAHQ | Acer TravelMate X3410-M-866T UHD Graphics 620, i5-8550U, Micron SSD 1100 SED 512GB, M.2 (MTFDDAV512TBN) | Fujitsu Lifebook E548 UHD Graphics 620, i5-8250U, Samsung SSD PM871b MZNLN256HAJQ | Huawei MateBook D 14 W50F UHD Graphics 620, i5-8250U, SanDisk SD9SN8W256G1027 | |
|---|---|---|---|---|---|---|---|
| Heat | 2% | 9% | -9% | 2% | -6% | -4% | |
| Maximum Upper Side * (°C) | 38.3 | 39 -2% | 36.7 4% | 39.1 -2% | 35.2 8% | 40.3 -5% | 41.6 -9% |
| Maximum Bottom * (°C) | 50.5 | 45.5 10% | 42.8 15% | 49.9 1% | 39.4 22% | 42.6 16% | 44.2 12% |
| Idle Upper Side * (°C) | 24.6 | 24.8 -1% | 23.4 5% | 28 -14% | 27.6 -12% | 28 -14% | 27.4 -11% |
| Idle Bottom * (°C) | 25.4 | 25 2% | 22.8 10% | 30.5 -20% | 27.8 -9% | 31 -22% | 27.6 -9% |
* ... mindre är bättre
HP ProBook 440 G6-5TK01EA ljudanalys
(±) | högtalarljudstyrkan är genomsnittlig men bra (78.1 dB)
Bas 100 - 315 Hz
(-) | nästan ingen bas - i genomsnitt 17.2% lägre än medianen
(±) | linjäriteten för basen är genomsnittlig (12.1% delta till föregående frekvens)
Mellan 400 - 2000 Hz
(+) | balanserad mellan - endast 3.3% från medianen
(+) | mids är linjära (6.7% delta till föregående frekvens)
Högsta 2 - 16 kHz
(±) | högre toppar - i genomsnitt 5.7% högre än medianen
(±) | linjäriteten för toppar är genomsnittlig (7.1% delta till föregående frekvens)
Totalt 100 - 16 000 Hz
(±) | linjäriteten för det totala ljudet är genomsnittlig (20.8% skillnad mot median)
Jämfört med samma klass
» 48% av alla testade enheter i den här klassen var bättre, 9% liknande, 42% sämre
» Den bästa hade ett delta på 7%, genomsnittet var 21%, sämst var 53%
Jämfört med alla testade enheter
» 56% av alla testade enheter var bättre, 8% liknande, 36% sämre
» Den bästa hade ett delta på 4%, genomsnittet var 24%, sämst var 134%
Lenovo ThinkPad A485-20MU000CGE ljudanalys
(±) | högtalarljudstyrkan är genomsnittlig men bra (74.1 dB)
Bas 100 - 315 Hz
(-) | nästan ingen bas - i genomsnitt 24.7% lägre än medianen
(±) | linjäriteten för basen är genomsnittlig (11.9% delta till föregående frekvens)
Mellan 400 - 2000 Hz
(+) | balanserad mellan - endast 2.9% från medianen
(±) | linjäriteten för mids är genomsnittlig (7.5% delta till föregående frekvens)
Högsta 2 - 16 kHz
(+) | balanserade toppar - endast 2.2% från medianen
(+) | toppar är linjära (6.8% delta till föregående frekvens)
Totalt 100 - 16 000 Hz
(±) | linjäriteten för det totala ljudet är genomsnittlig (23.8% skillnad mot median)
Jämfört med samma klass
» 68% av alla testade enheter i den här klassen var bättre, 8% liknande, 24% sämre
» Den bästa hade ett delta på 7%, genomsnittet var 21%, sämst var 53%
Jämfört med alla testade enheter
» 71% av alla testade enheter var bättre, 6% liknande, 22% sämre
» Den bästa hade ett delta på 4%, genomsnittet var 24%, sämst var 134%
| Av/Standby | |
| Låg belastning | |
| Hög belastning |
|
Förklaring:
min: | |
| HP ProBook 440 G6-5TK01EA i7-8565U, UHD Graphics 620, Toshiba XG5 KXG50ZNV512G, IPS, 1920x1080, 14" | HP ProBook 440 G5-3KX87ES i5-8250U, UHD Graphics 620, Intel SSD 600p SSDPEKKW256G7, IPS LED, 1920x1080, 14" | Lenovo ThinkPad E480-20KNCTO1WW i5-8250U, UHD Graphics 620, Toshiba KBG30ZMT128G, IPS LED, 1920x1080, 14" | Lenovo ThinkPad A485-20MU000CGE R5 PRO 2500U, Vega 8, Samsung SSD PM981 MZVLB256HAHQ, IPS LED, 1920x1080, 14" | Acer TravelMate X3410-M-866T i5-8550U, UHD Graphics 620, Micron SSD 1100 SED 512GB, M.2 (MTFDDAV512TBN), IPS, 1920x1080, 14" | Fujitsu Lifebook E548 i5-8250U, UHD Graphics 620, Samsung SSD PM871b MZNLN256HAJQ, IPS, 1920x1080, 14" | Huawei MateBook D 14 W50F i5-8250U, UHD Graphics 620, SanDisk SD9SN8W256G1027, IPS, 1920x1080, 14" | Genomsnitt Intel UHD Graphics 620 | Genomsnitt av klass Office | |
|---|---|---|---|---|---|---|---|---|---|
| Power Consumption | -25% | 5% | -42% | -19% | 16% | -5% | -16% | -33% | |
| Idle Minimum * (Watt) | 2.98 | 4.4 -48% | 3.5 -17% | 5.3 -78% | 4.5 -51% | 3.1 -4% | 3.7 -24% | 3.81 ? -28% | 4.41 ? -48% |
| Idle Average * (Watt) | 5.4 | 7.1 -31% | 5.3 2% | 8.3 -54% | 6.3 -17% | 5 7% | 6.9 -28% | 6.94 ? -29% | 7.37 ? -36% |
| Idle Maximum * (Watt) | 7.9 | 10.2 -29% | 6.1 23% | 11.4 -44% | 7 11% | 6.1 23% | 8.4 -6% | 8.75 ? -11% | 8.58 ? -9% |
| Load Average * (Watt) | 34.5 | 36.5 -6% | 30 13% | 42 -22% | 28.7 17% | 27 22% | 32 7% | 35 ? -1% | 43 ? -25% |
| Load Maximum * (Watt) | 43.3 | 48.7 -12% | 42.3 2% | 48.8 -13% | 67.7 -56% | 29.7 31% | 32.6 25% | 47.5 ? -10% | 64.6 ? -49% |
* ... mindre är bättre

| HP ProBook 440 G6-5TK01EA i7-8565U, UHD Graphics 620, 45 Wh | HP ProBook 440 G5-3KX87ES i5-8250U, UHD Graphics 620, 48 Wh | Lenovo ThinkPad E480-20KNCTO1WW i5-8250U, UHD Graphics 620, 45 Wh | Lenovo ThinkPad A485-20MU000CGE R5 PRO 2500U, Vega 8, 48 Wh | Acer TravelMate X3410-M-866T i5-8550U, UHD Graphics 620, 57 Wh | Fujitsu Lifebook E548 i5-8250U, UHD Graphics 620, 50 Wh | Huawei MateBook D 14 W50F i5-8250U, UHD Graphics 620, 57 Wh | Genomsnitt av klass Office | |
|---|---|---|---|---|---|---|---|---|
| Batteridrifttid | -16% | -7% | -37% | 11% | 1% | 26% | 41% | |
| Reader / Idle (h) | 17.1 | 13.7 -20% | 18.4 8% | 11.2 -35% | 20.8 22% | 23.6 38% | 23.7 ? 39% | |
| H.264 (h) | 7.6 | 3.7 -51% | 7.2 -5% | 6.1 -20% | 12.1 59% | 15 ? 97% | ||
| WiFi v1.3 (h) | 8.4 | 6.9 -18% | 8.3 -1% | 5.5 -35% | 10.3 23% | 8.5 1% | 10 19% | 12.9 ? 54% |
| Load (h) | 2.5 | 3.1 24% | 1.8 -28% | 1.1 -56% | 2.2 -12% | 2.2 -12% | 1.794 ? -28% |
För
Emot
Verdict - a modern HP ProBook
Läs den fullständiga versionen av den här recensionen på engelska här.
HP ProBook 440 G6 är en enhet som i huvudsak riktar sig åt företagskunder med små eller medelstora företag. Men den passar också bra åt privatanvändare då den är ideal för genomsnittligt kontorsbruk och webbsurfande.
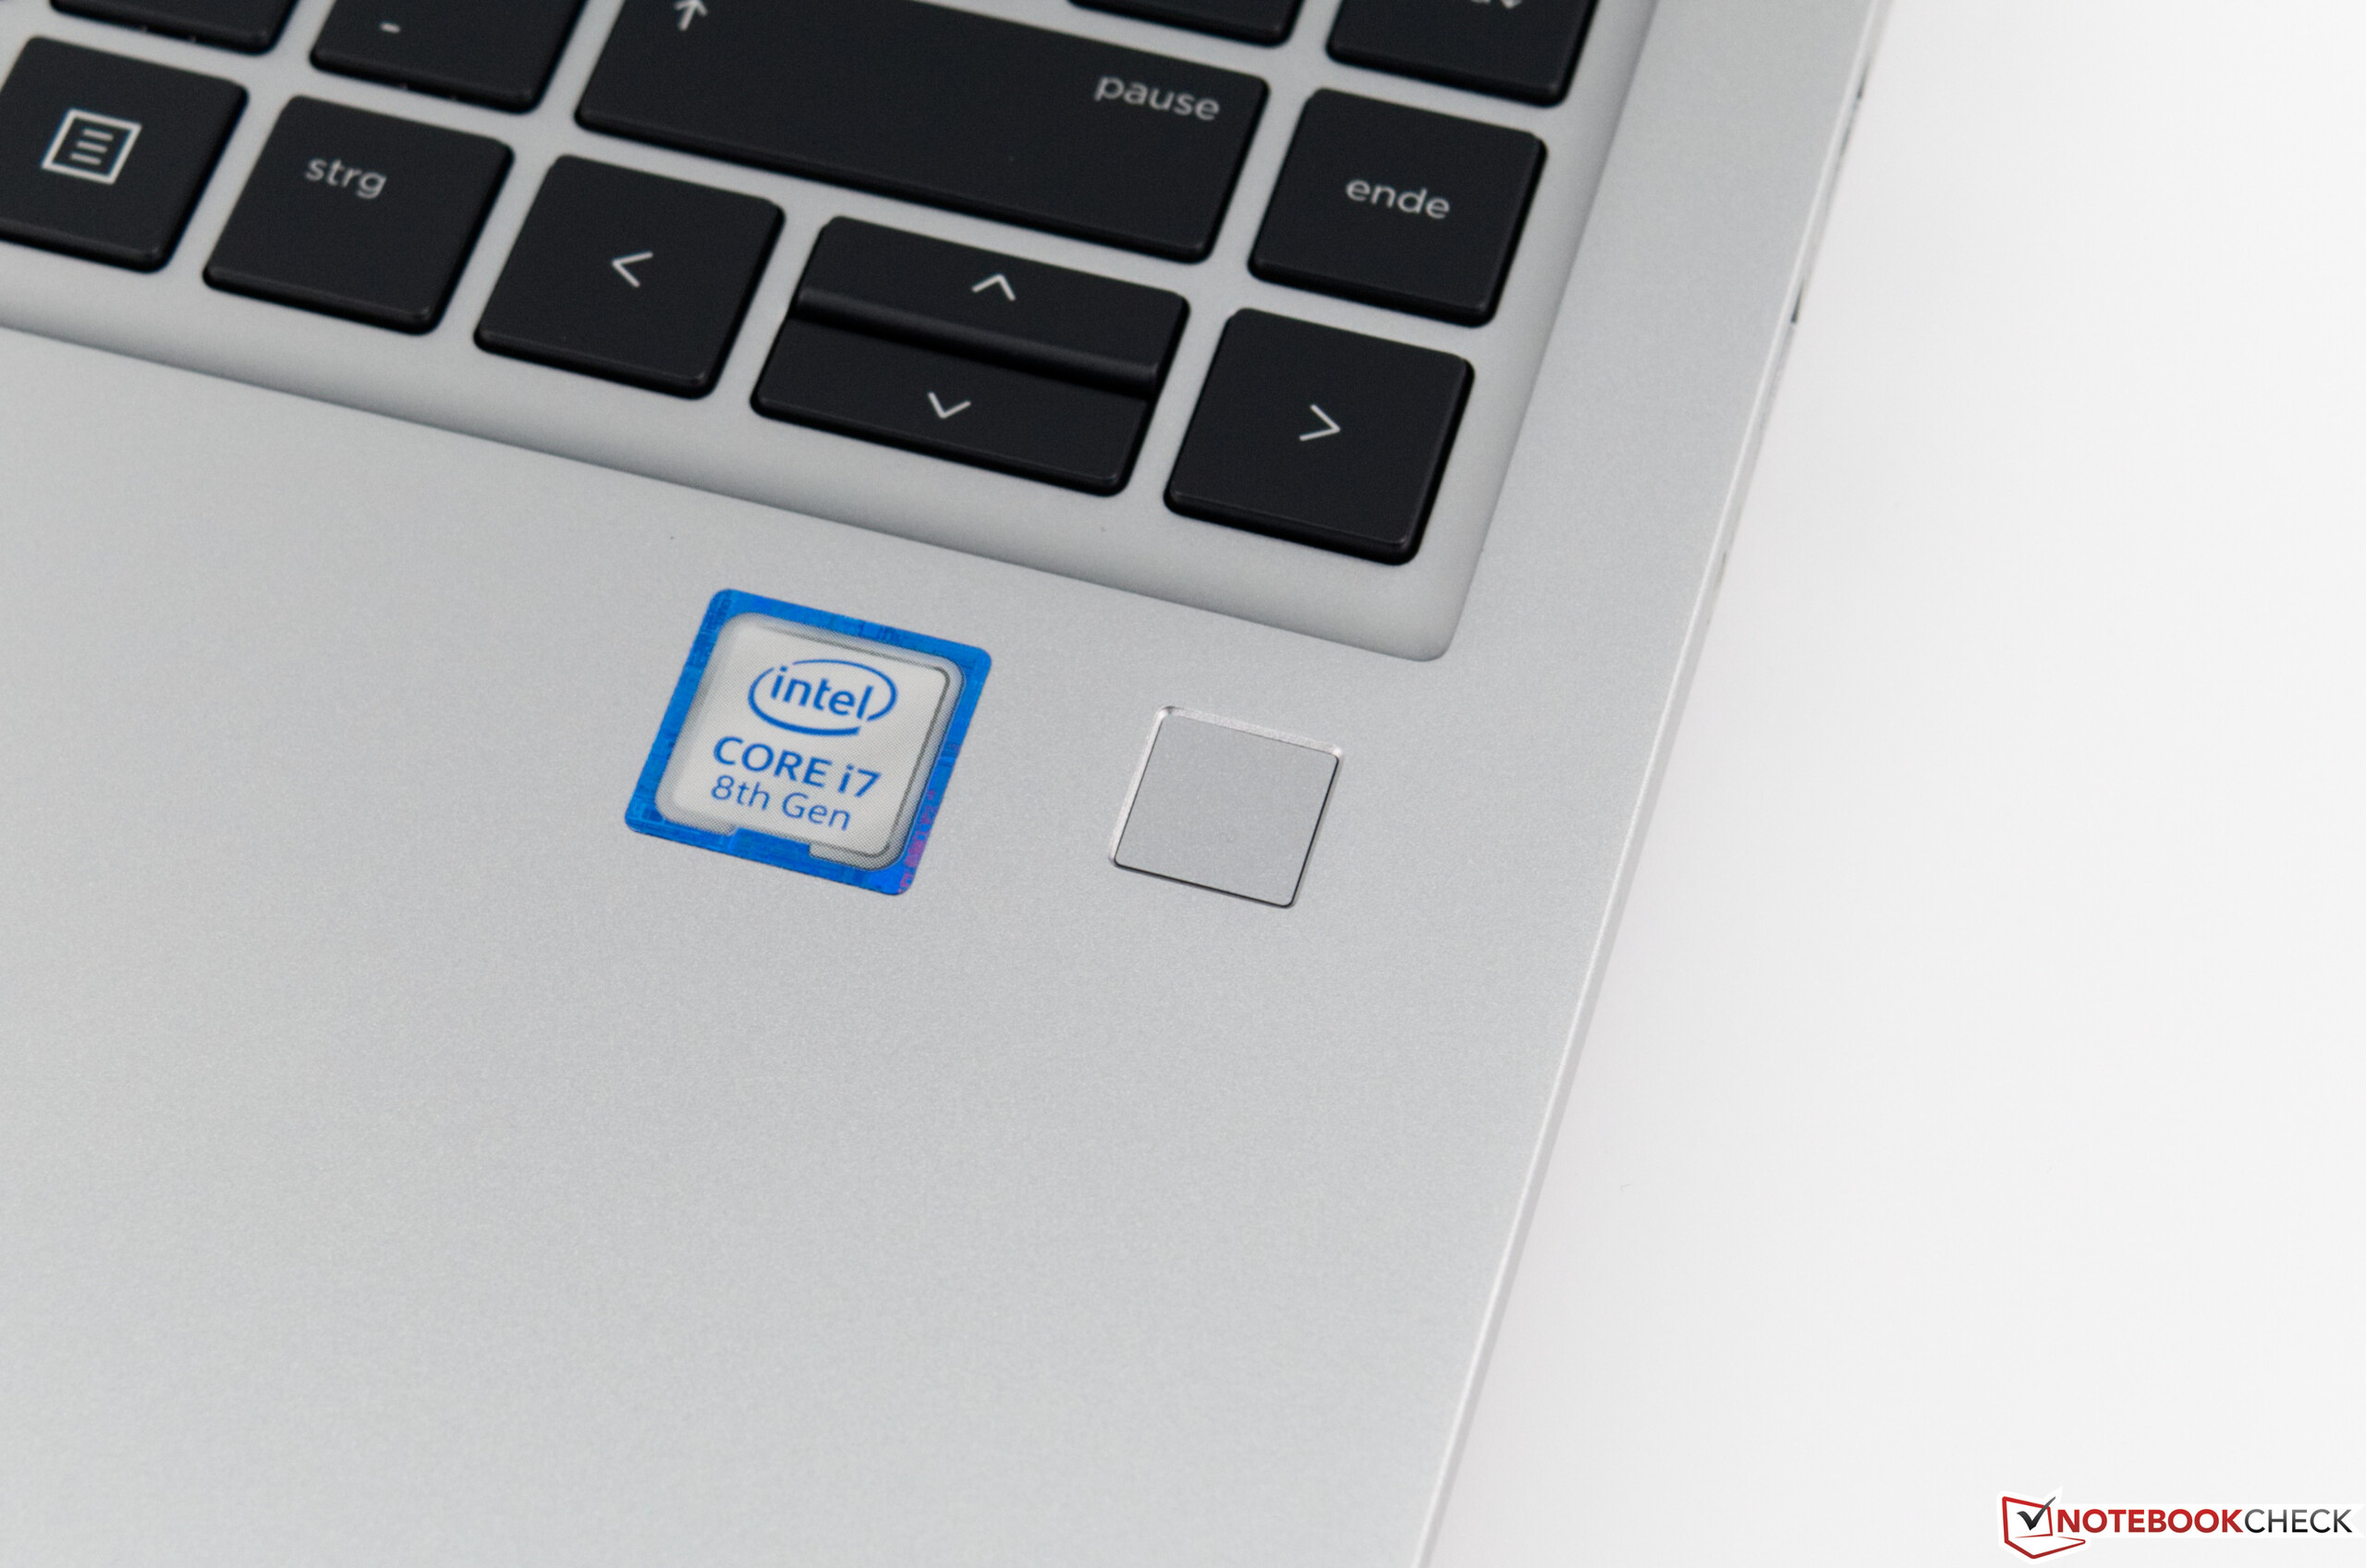
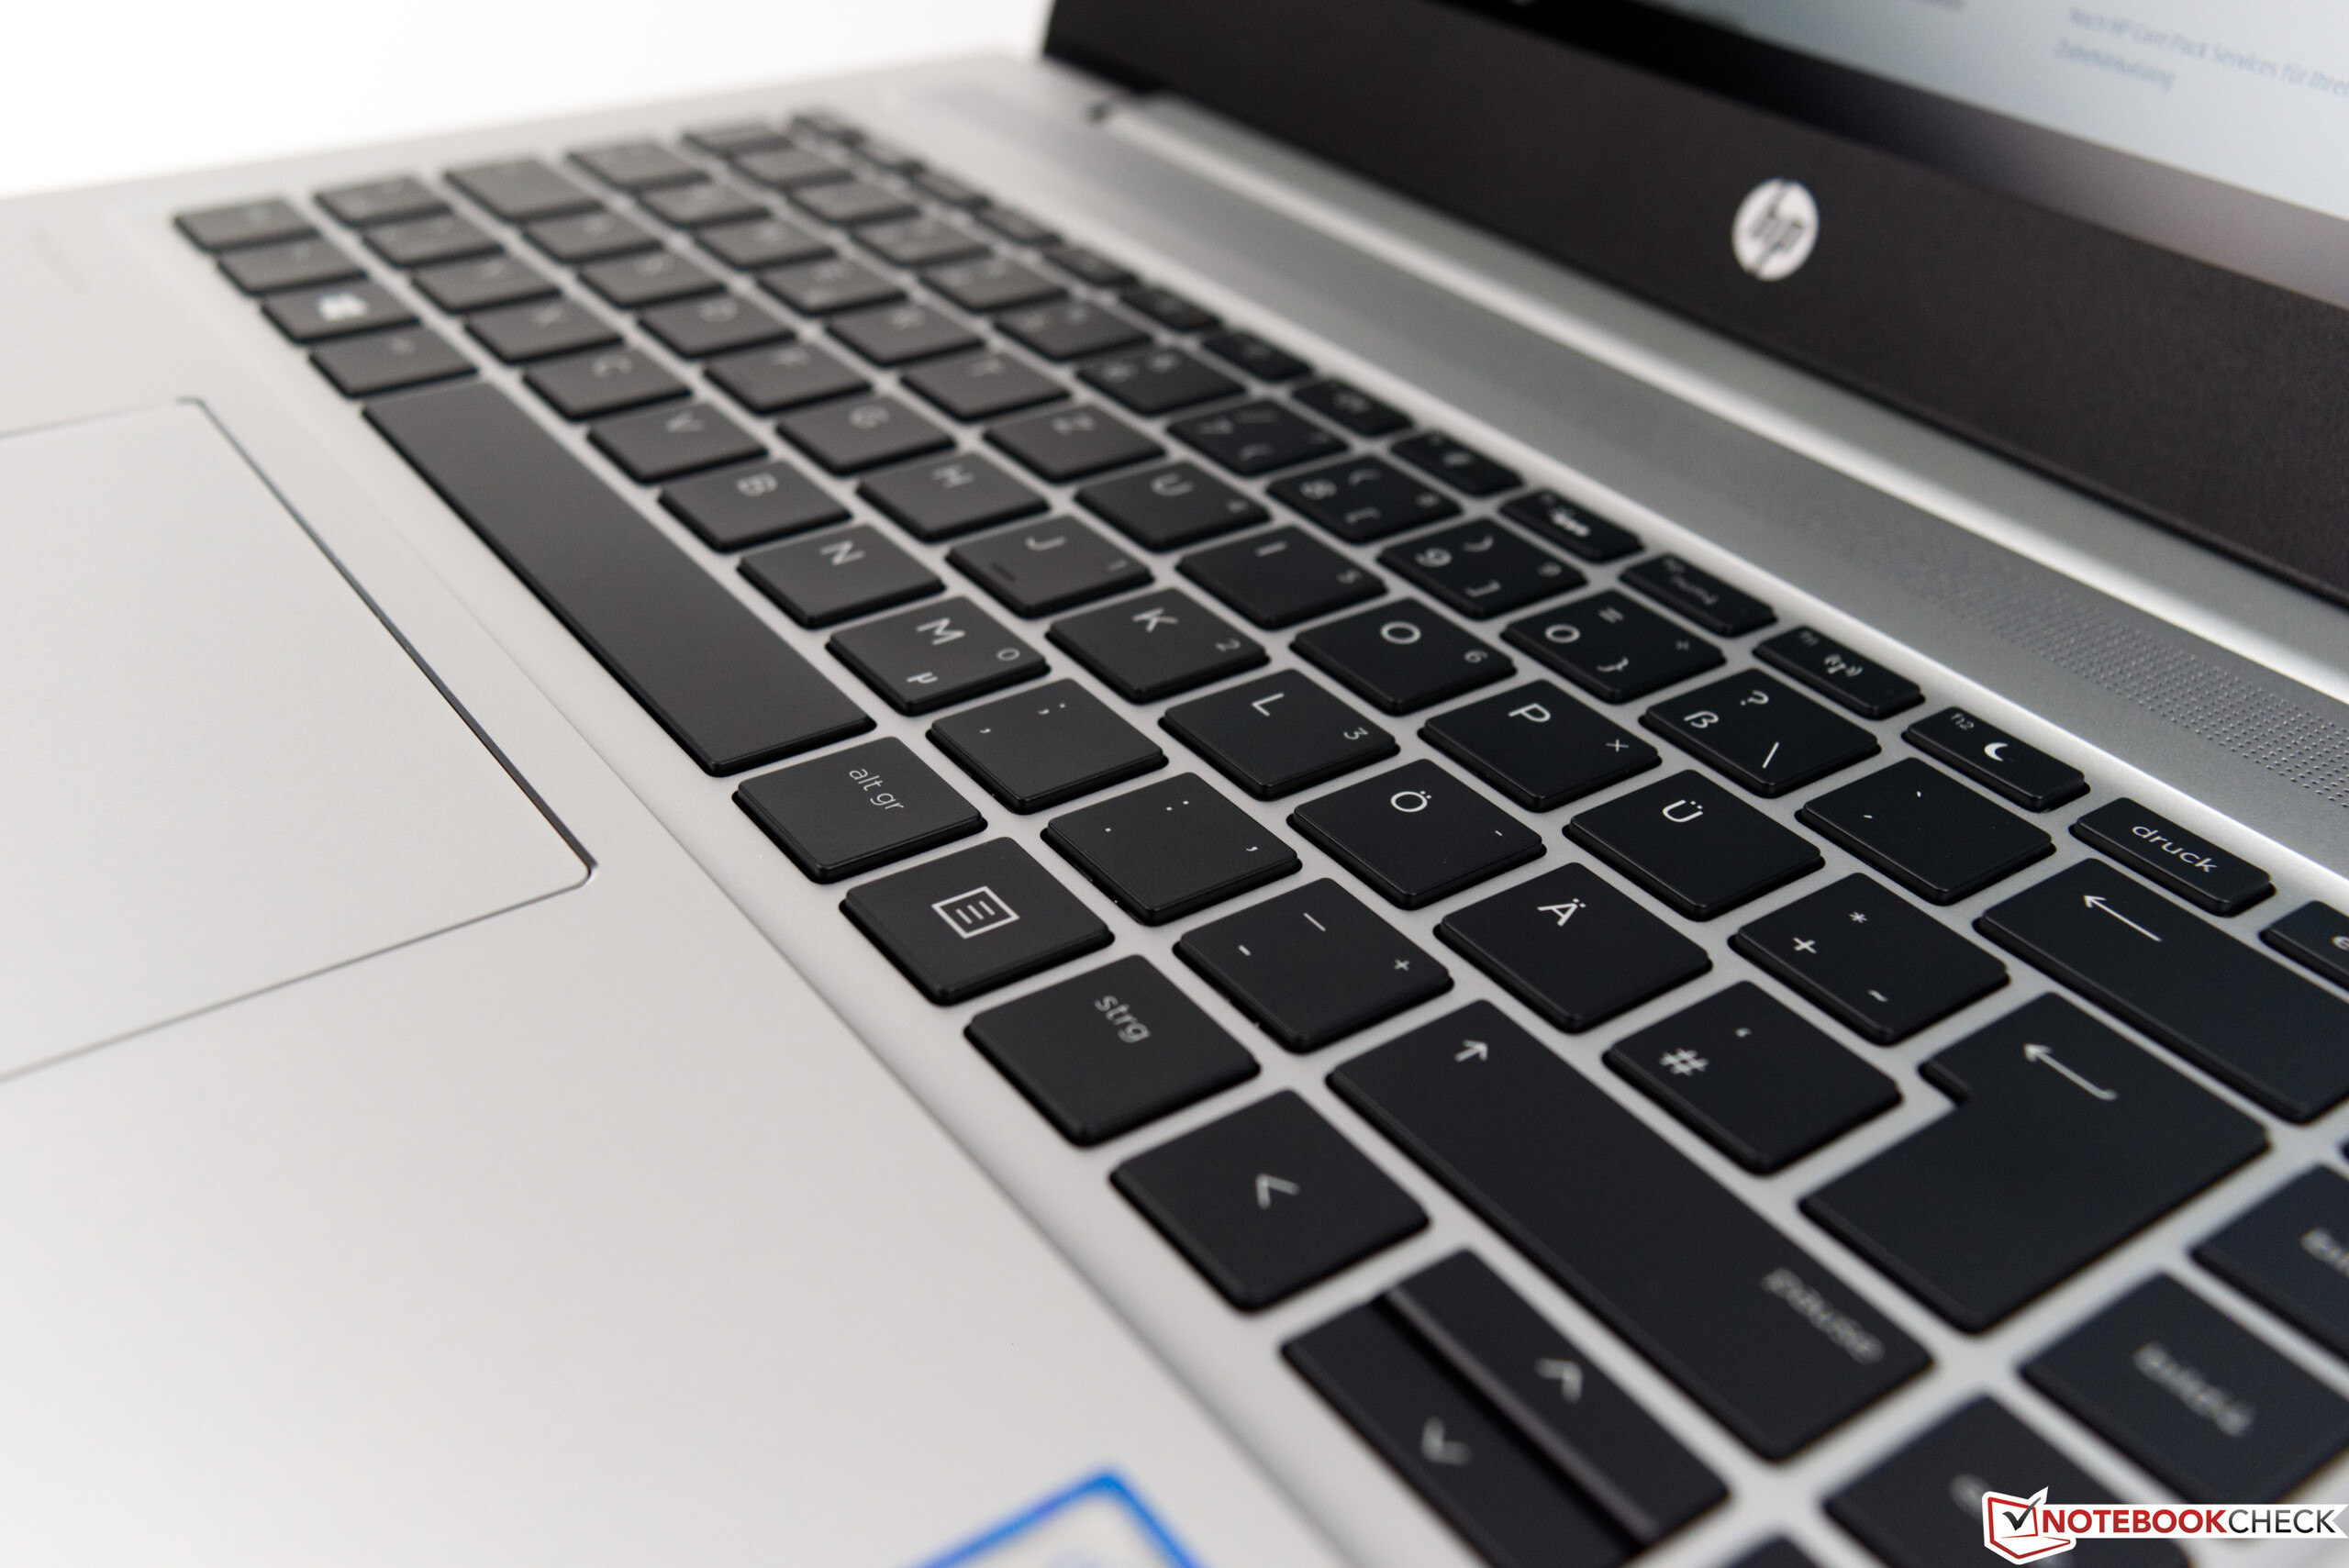
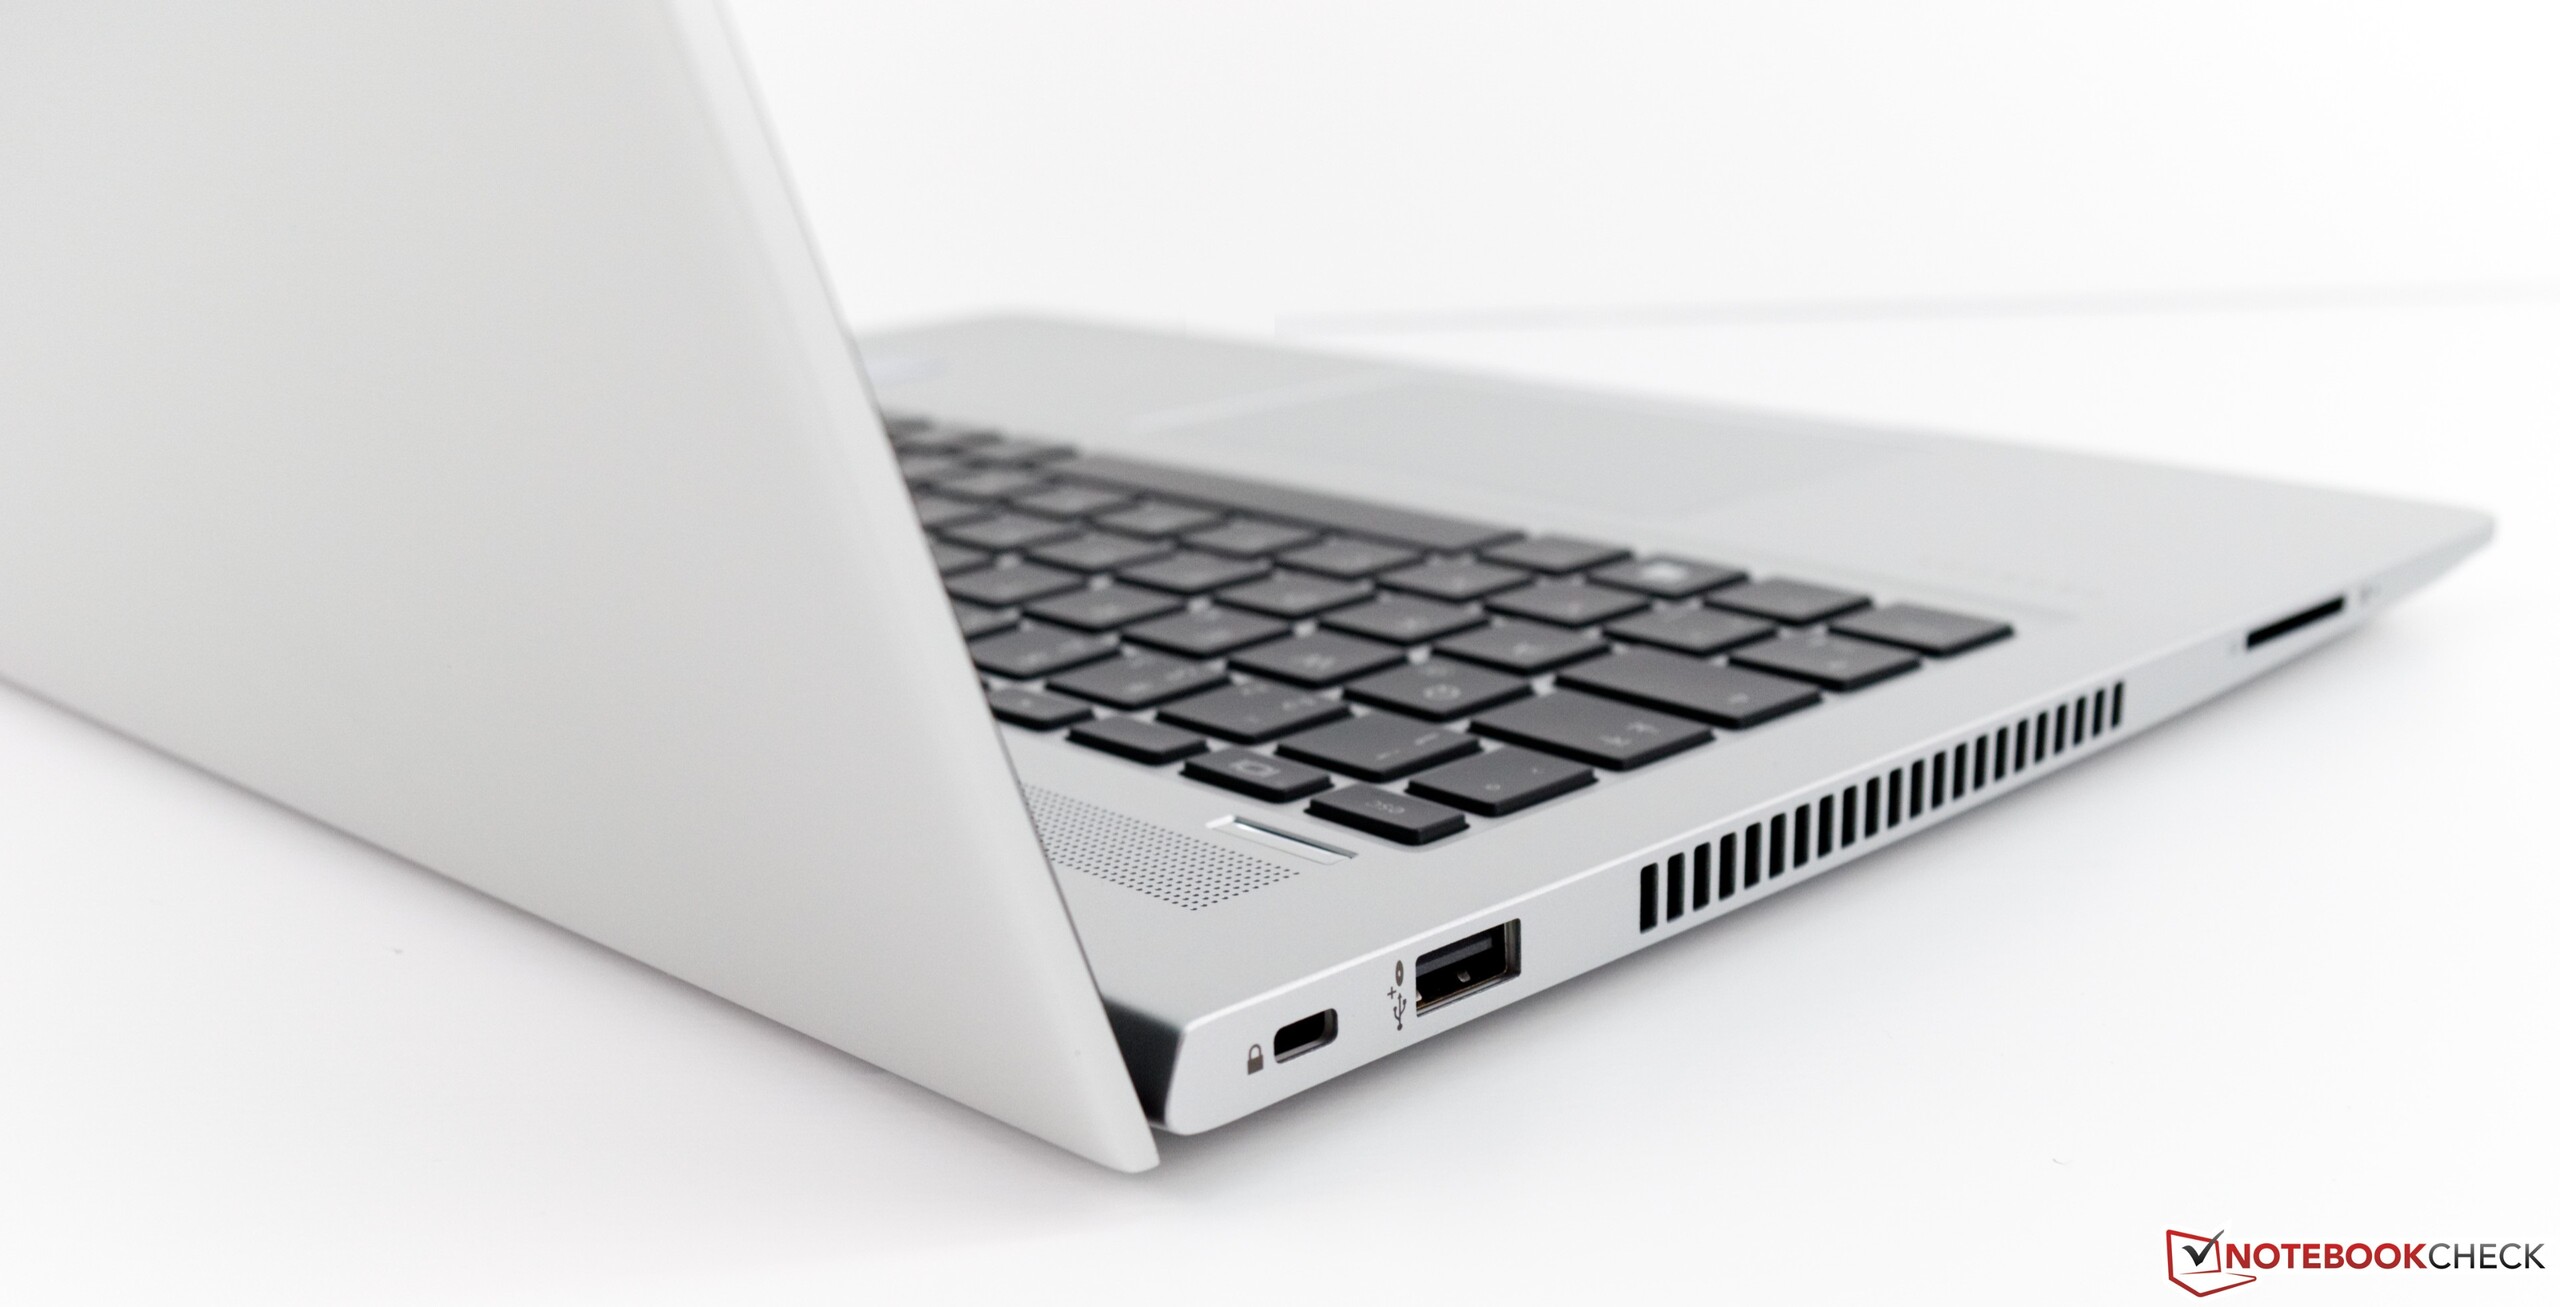
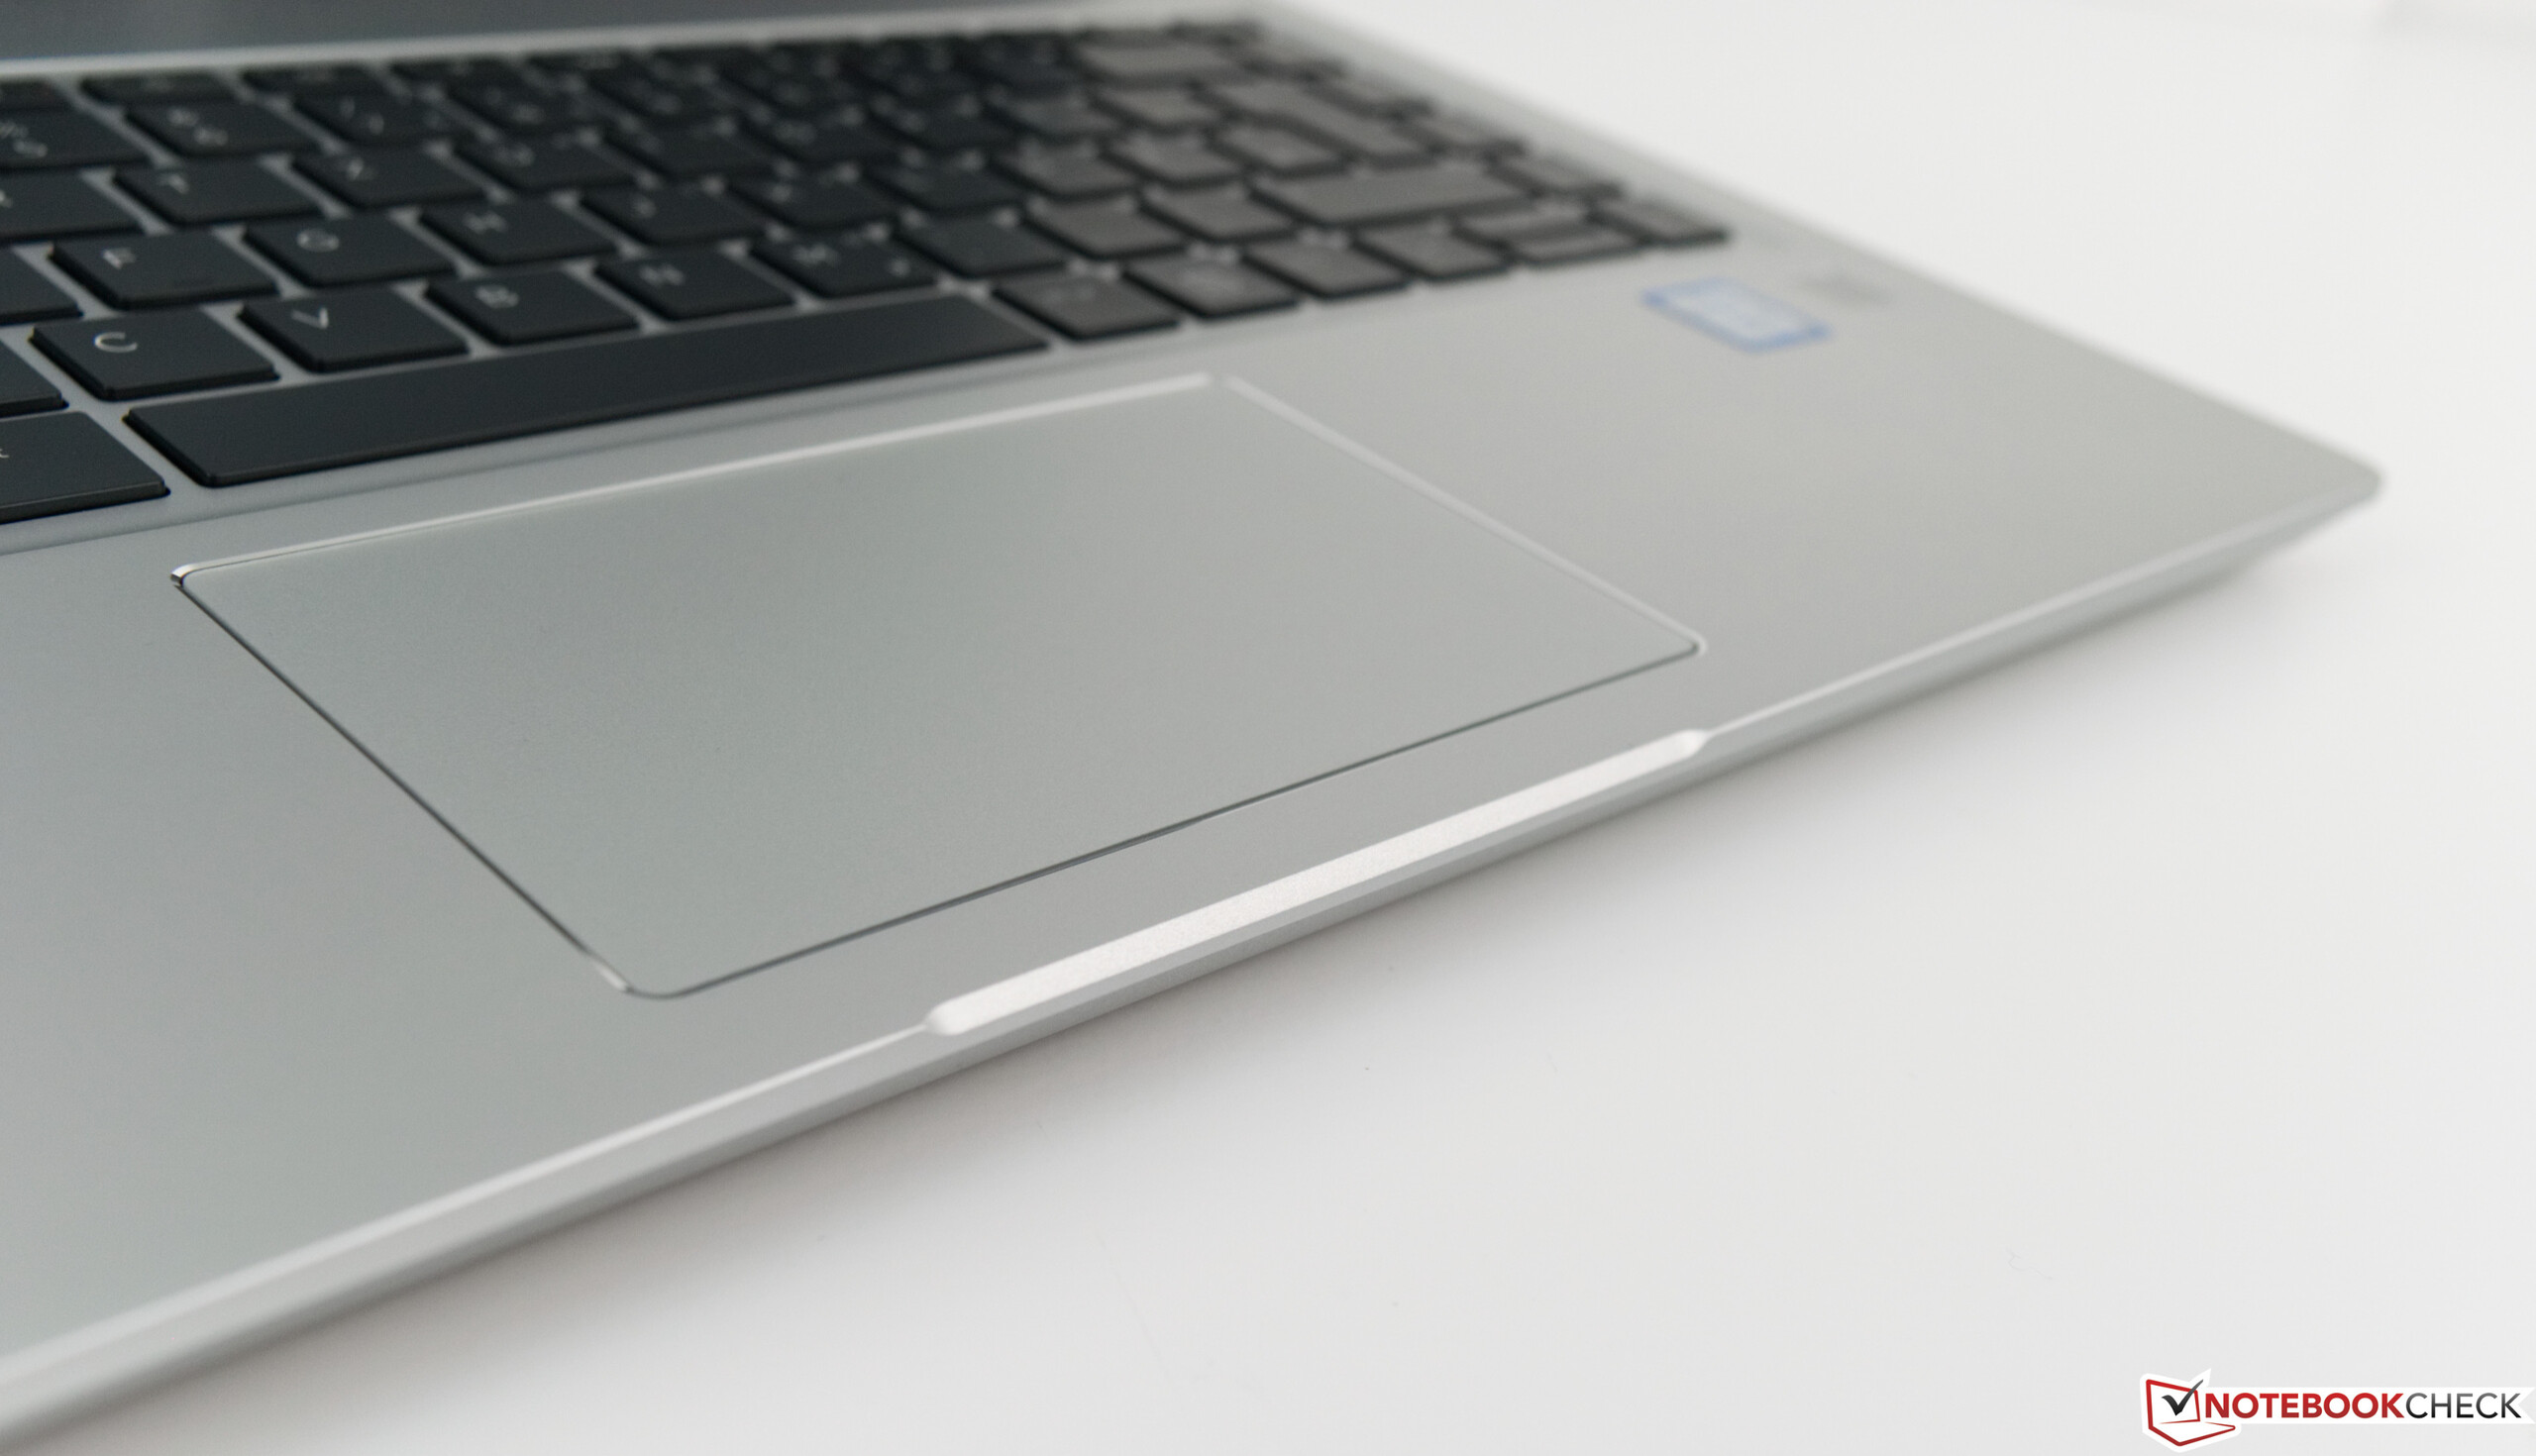
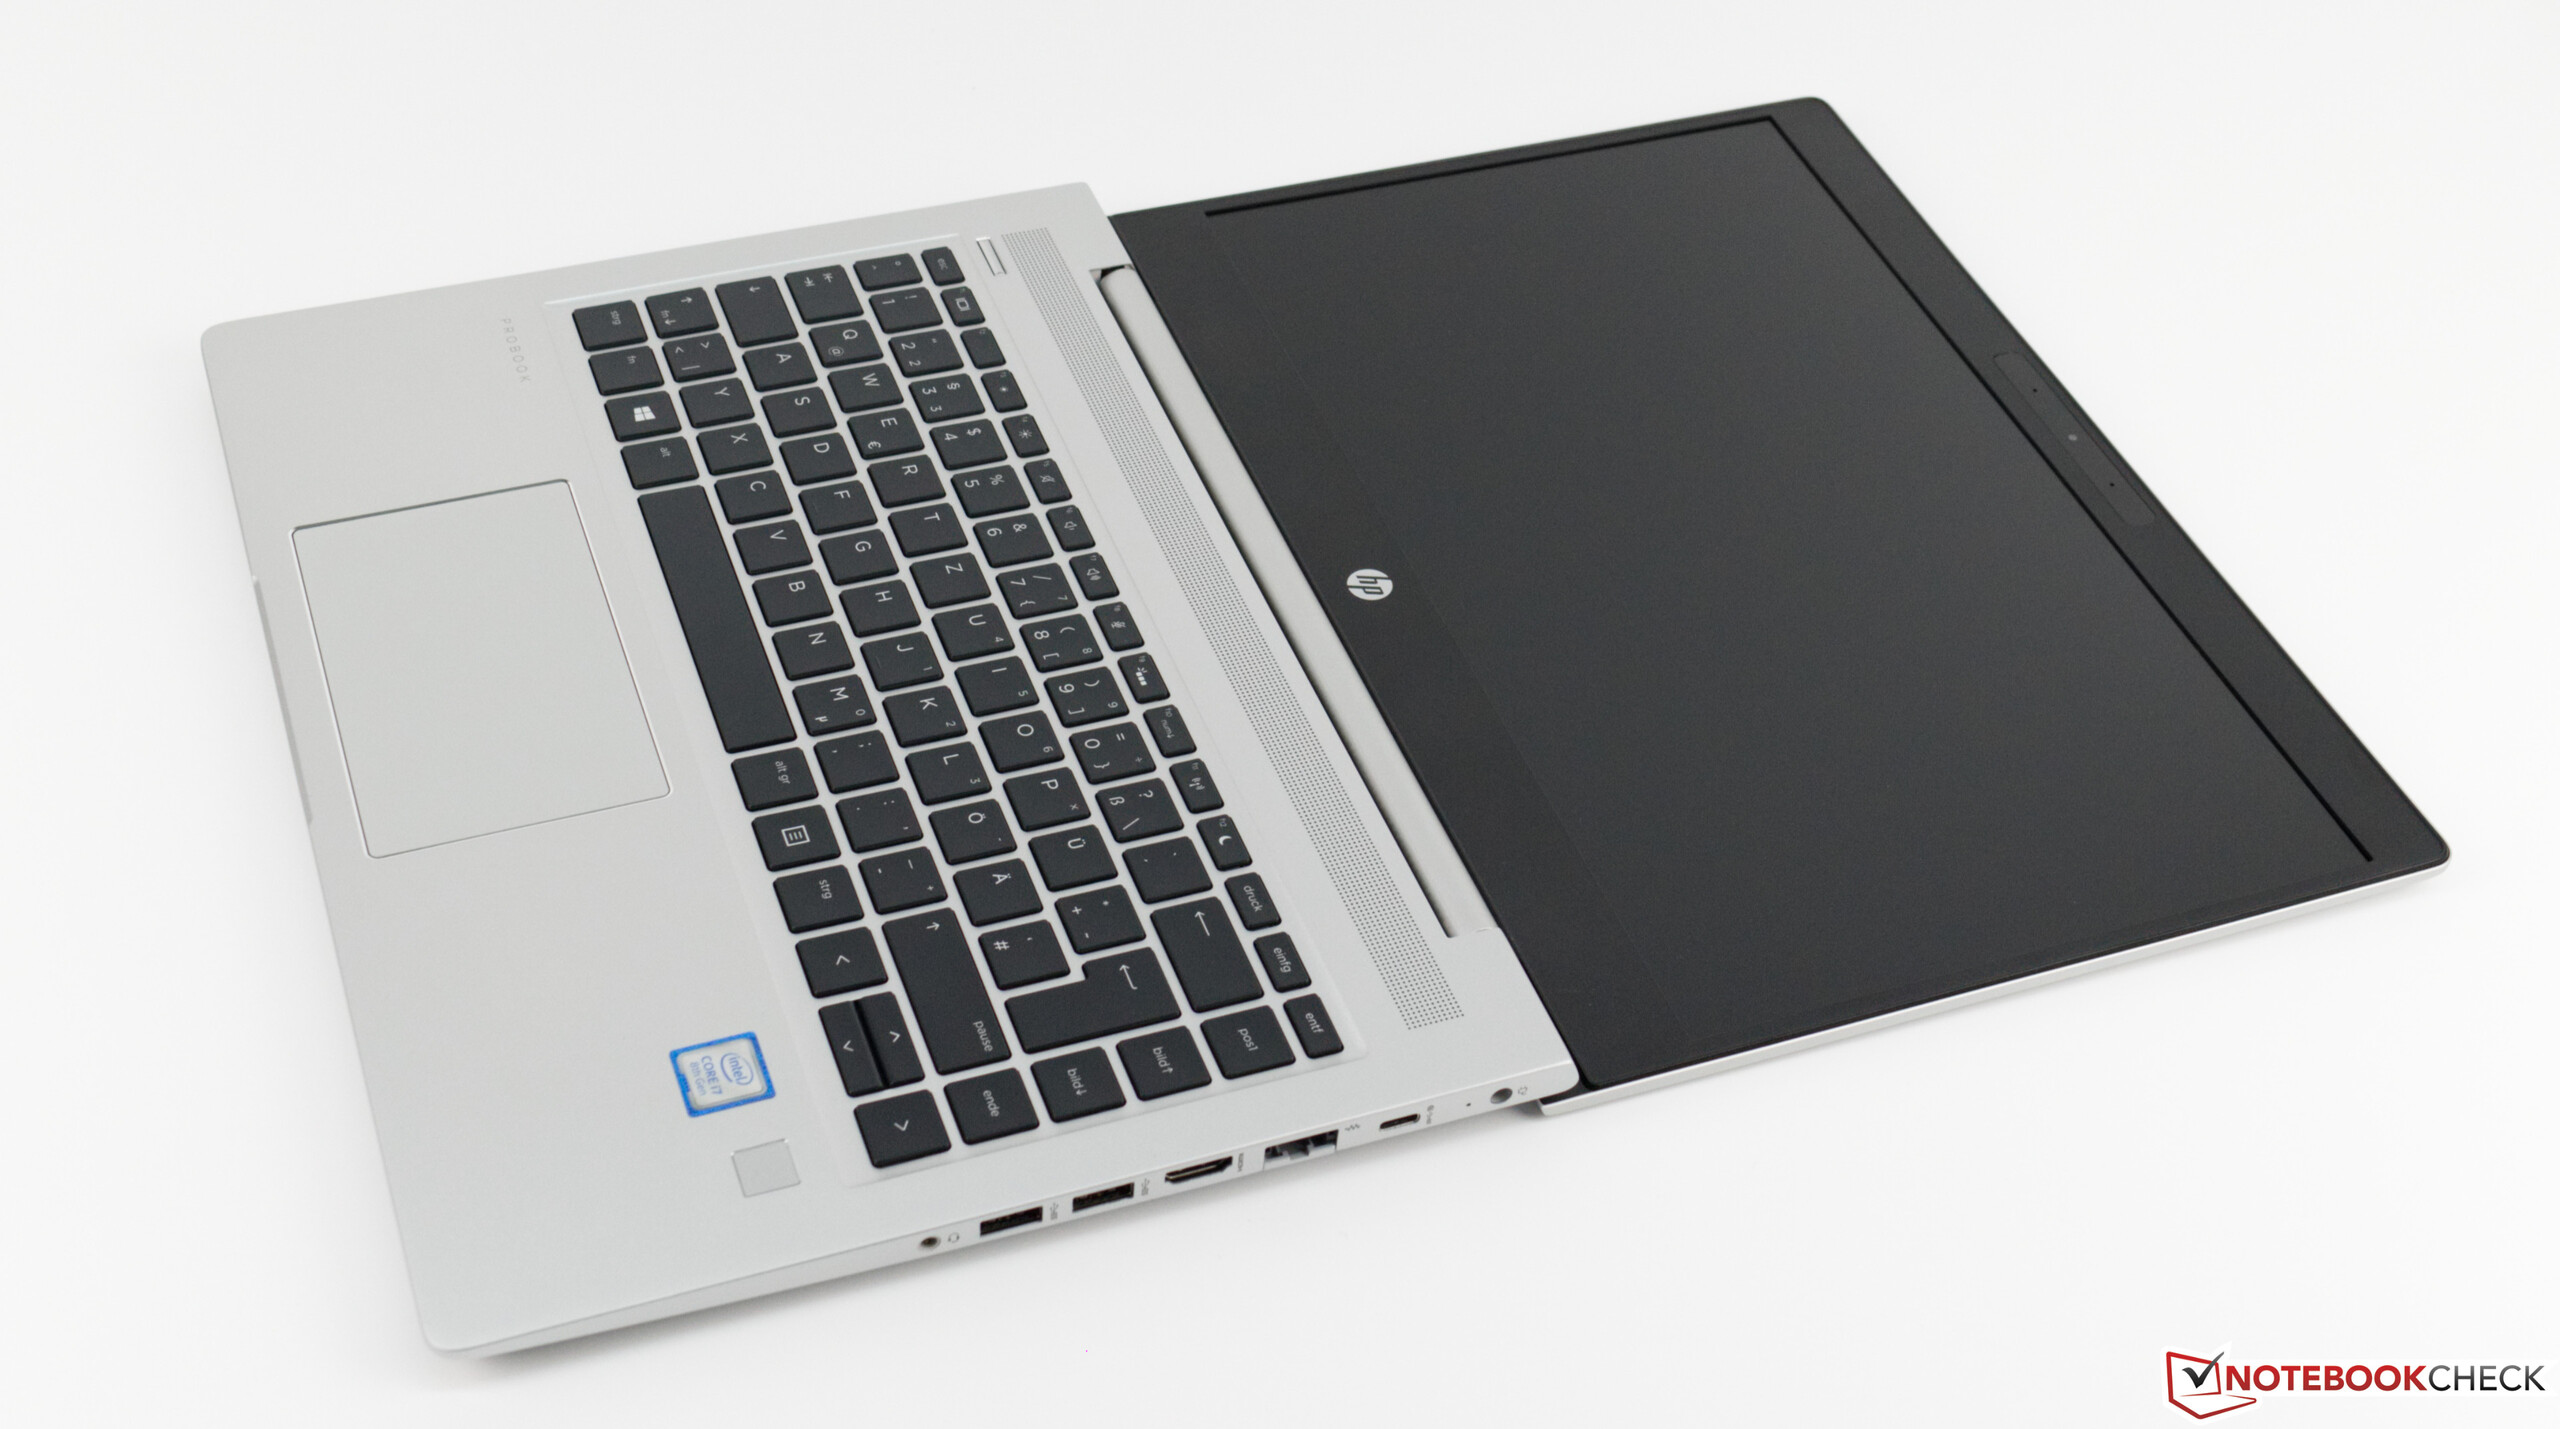
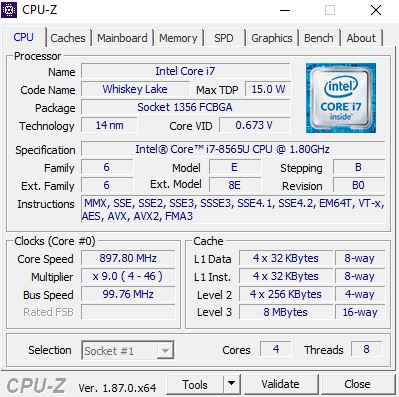
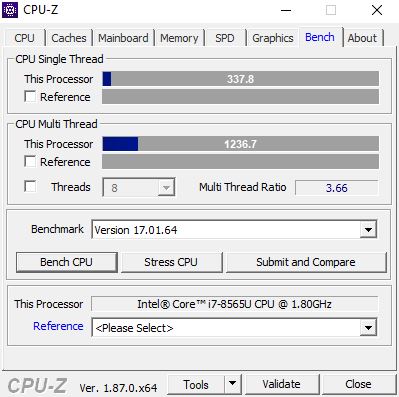
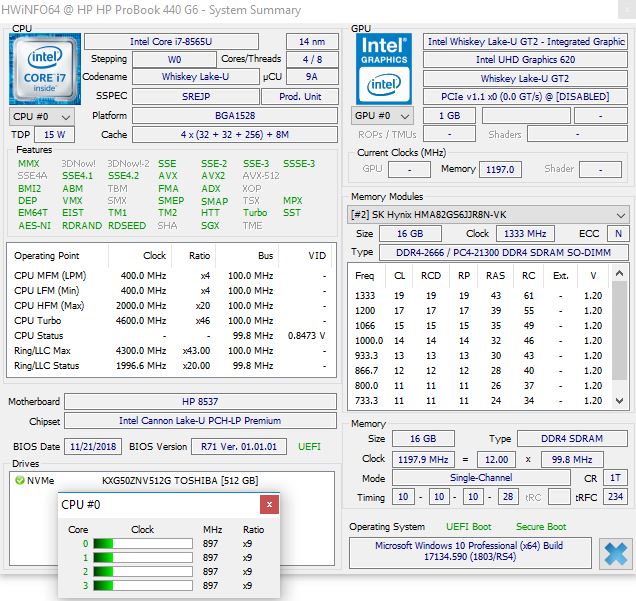
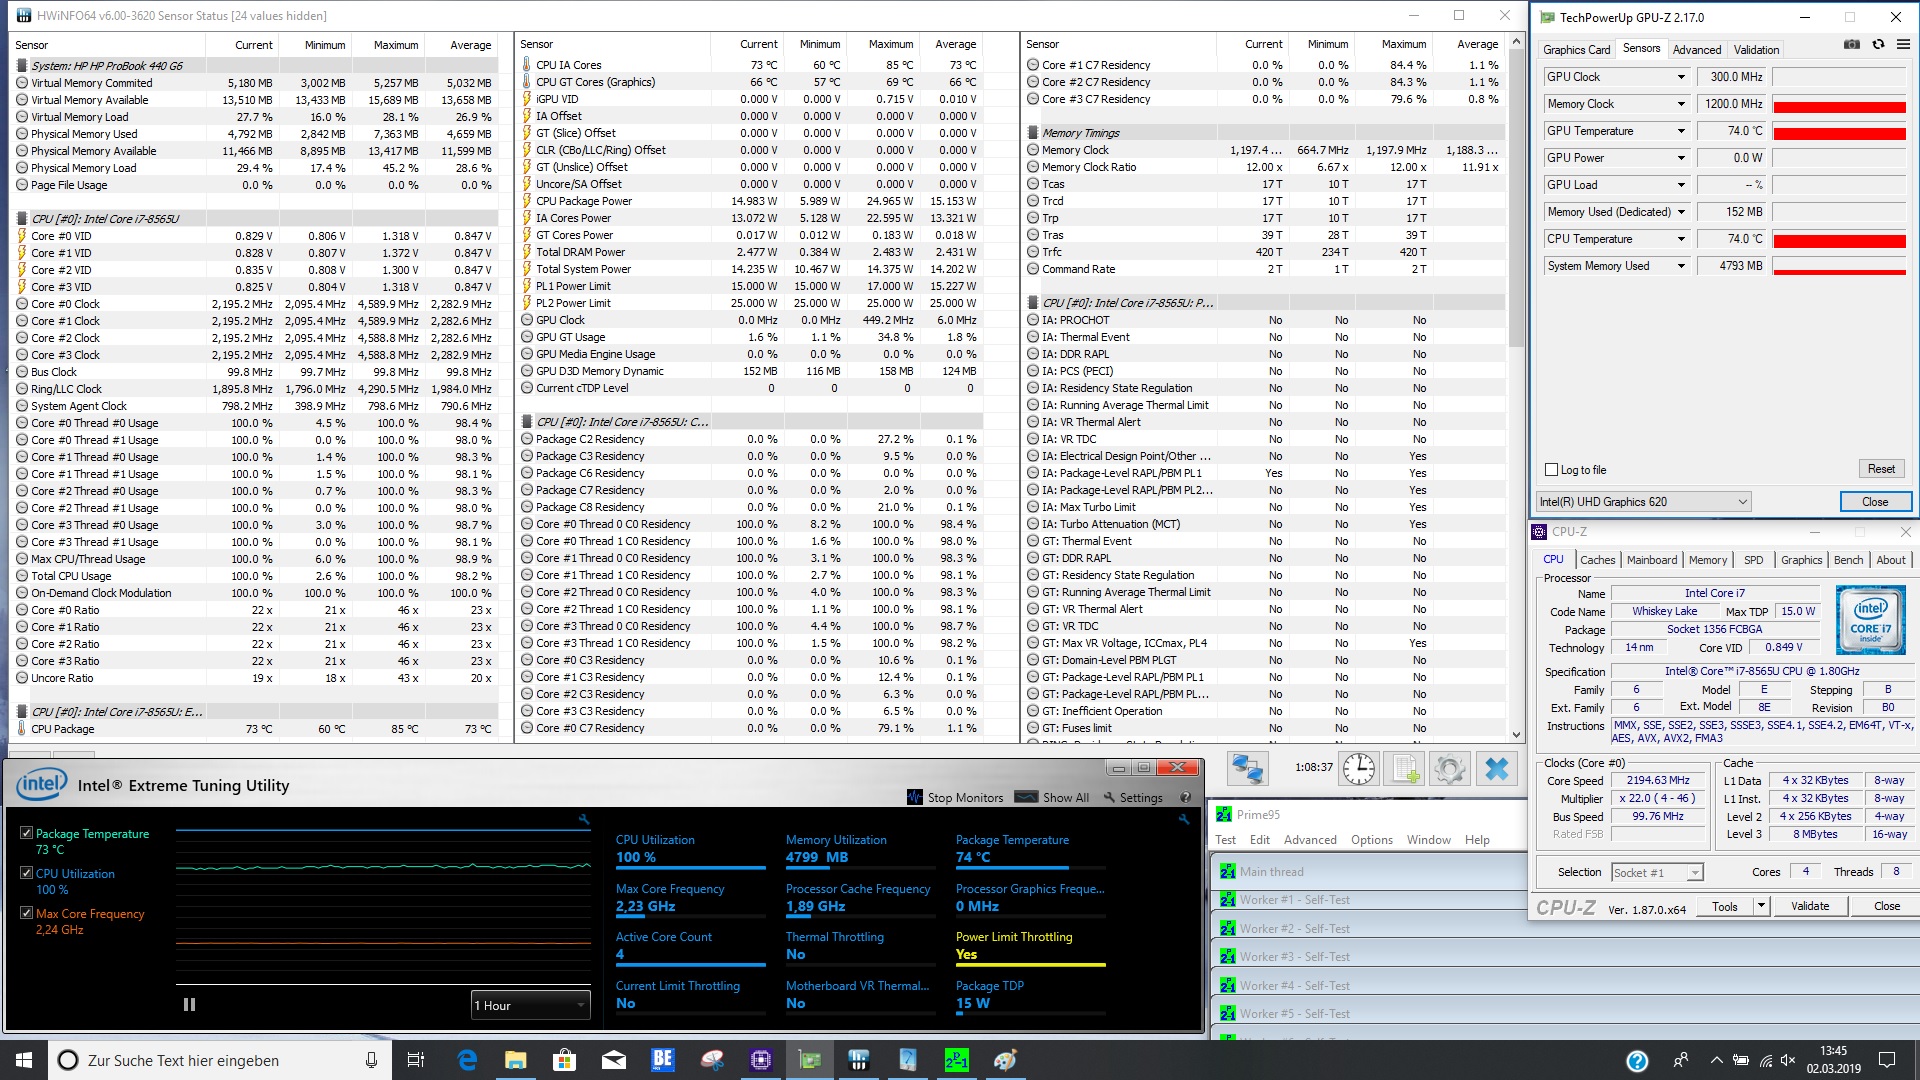
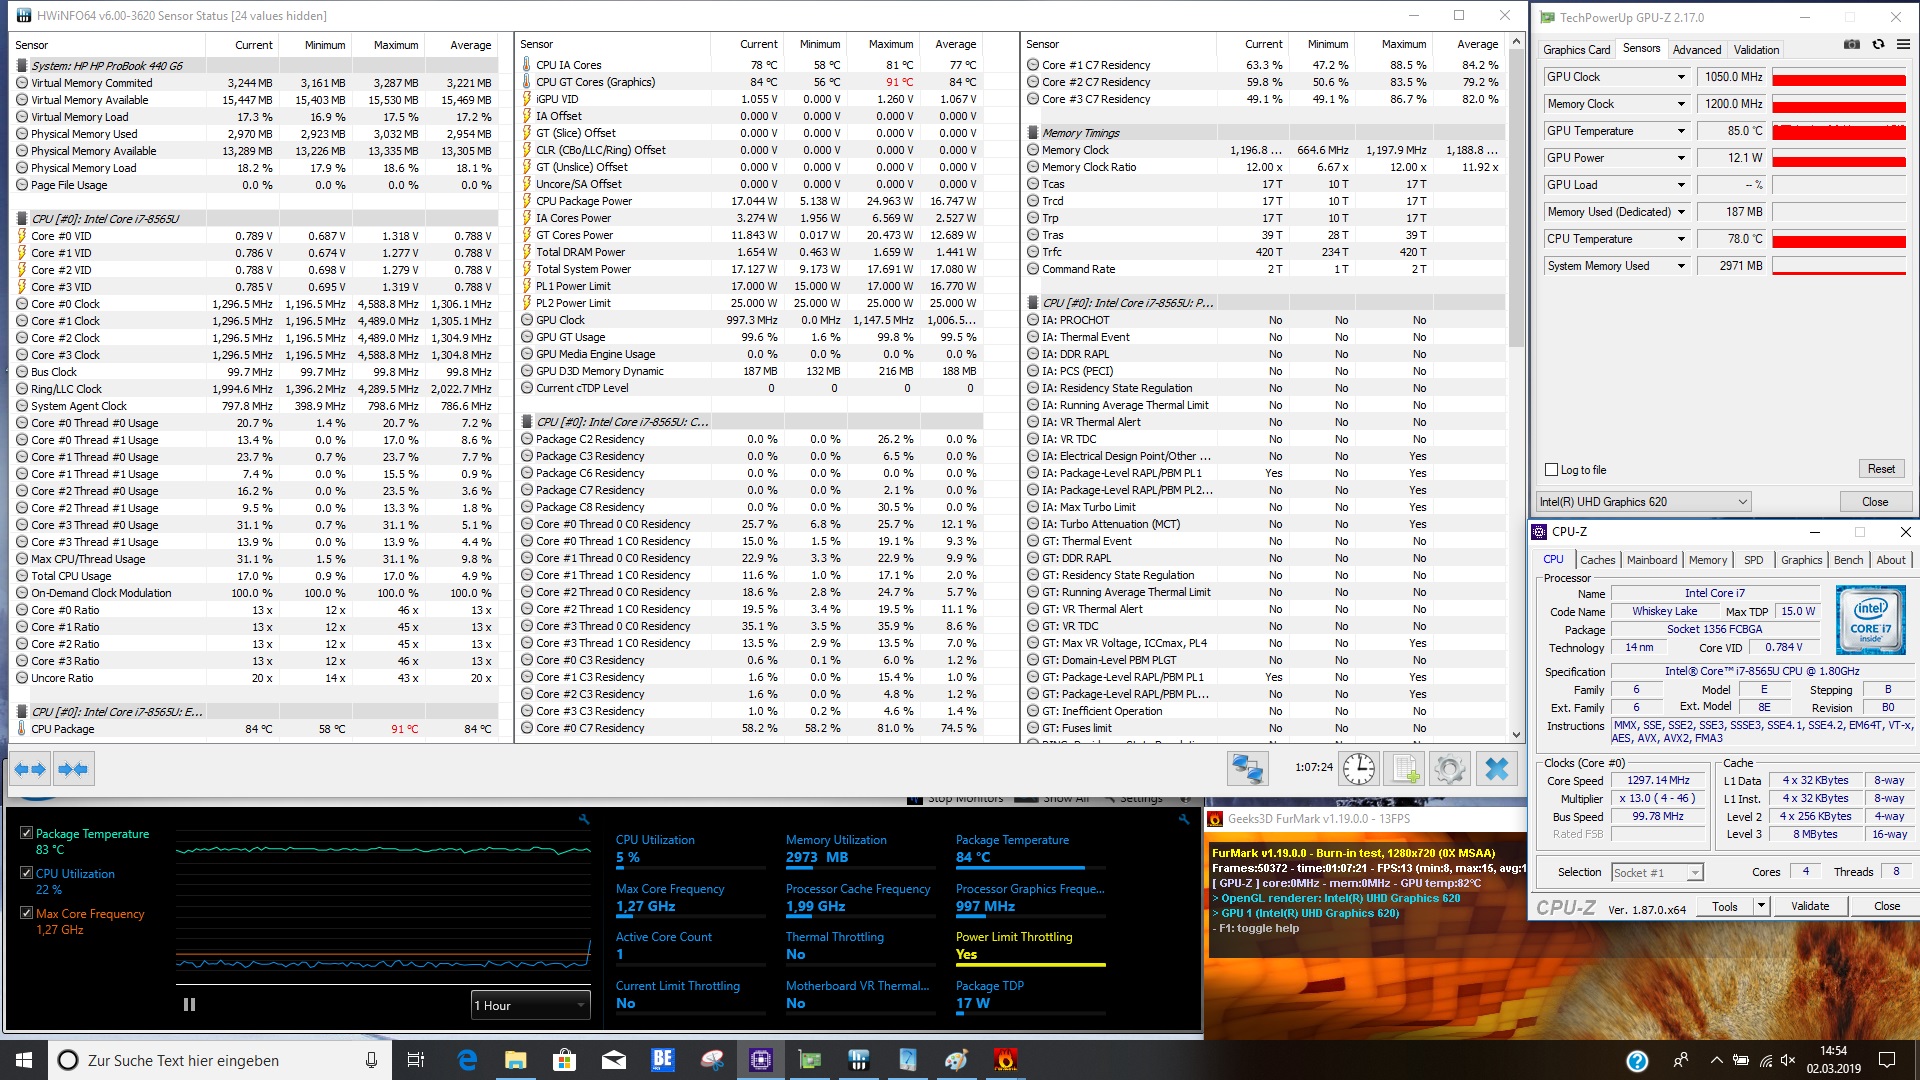
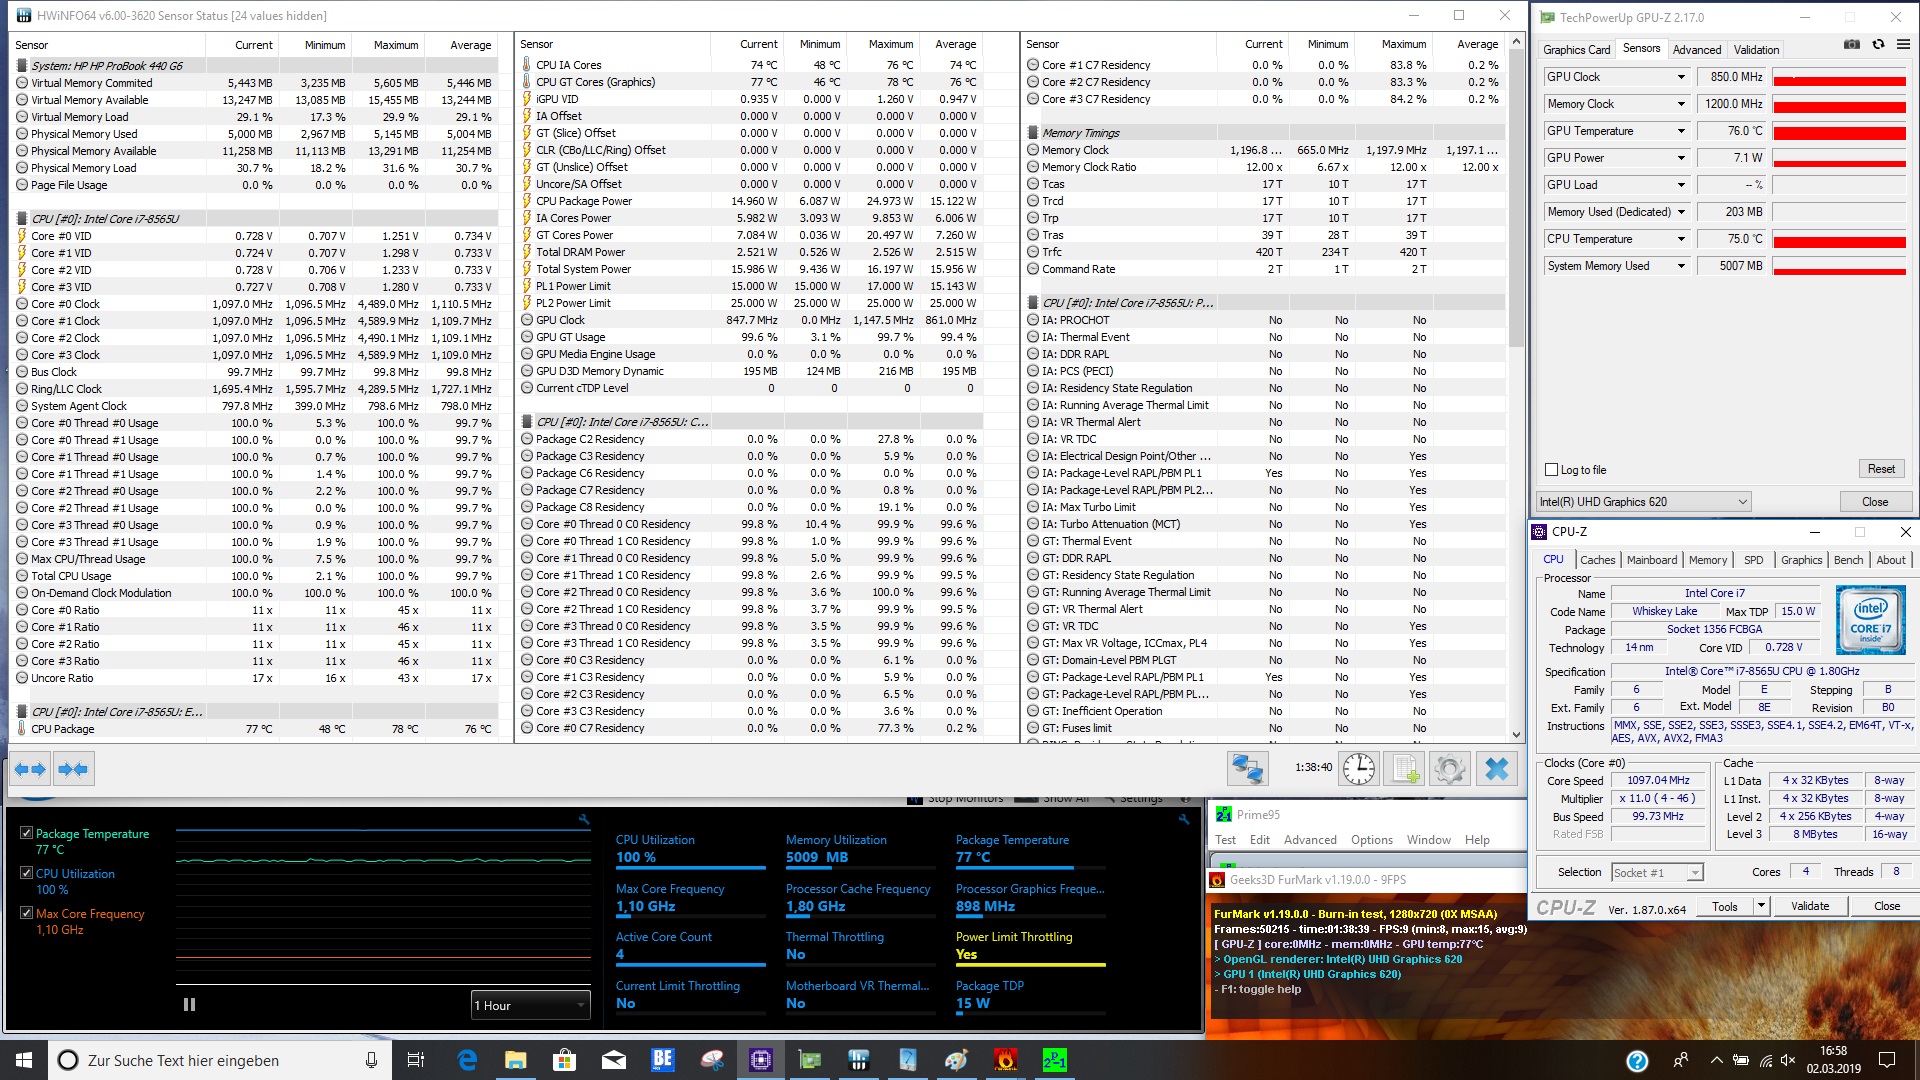
HP har arbetat om ProBook 440 G6:s hölje och har gjort det tunnare och gett det en modernare look. De har valt bra material, aluminiumytan ger enheten en känsla av hög kvalitet. Men det är inte bara utseendet som har uppdaterats; HP:s komponenter är också moderna och Intels senaste processorer används - även om vi inte övertygades av hur Intel Core i7-8565U processorn som satt i vår testenhet presterade i Cinebench R15 Multi-loopen. Men den enkeltrådade prestandan var riktigt bra precis som den generella systemprestandan, vilket placerade HP överst i jämförelsetabellen.
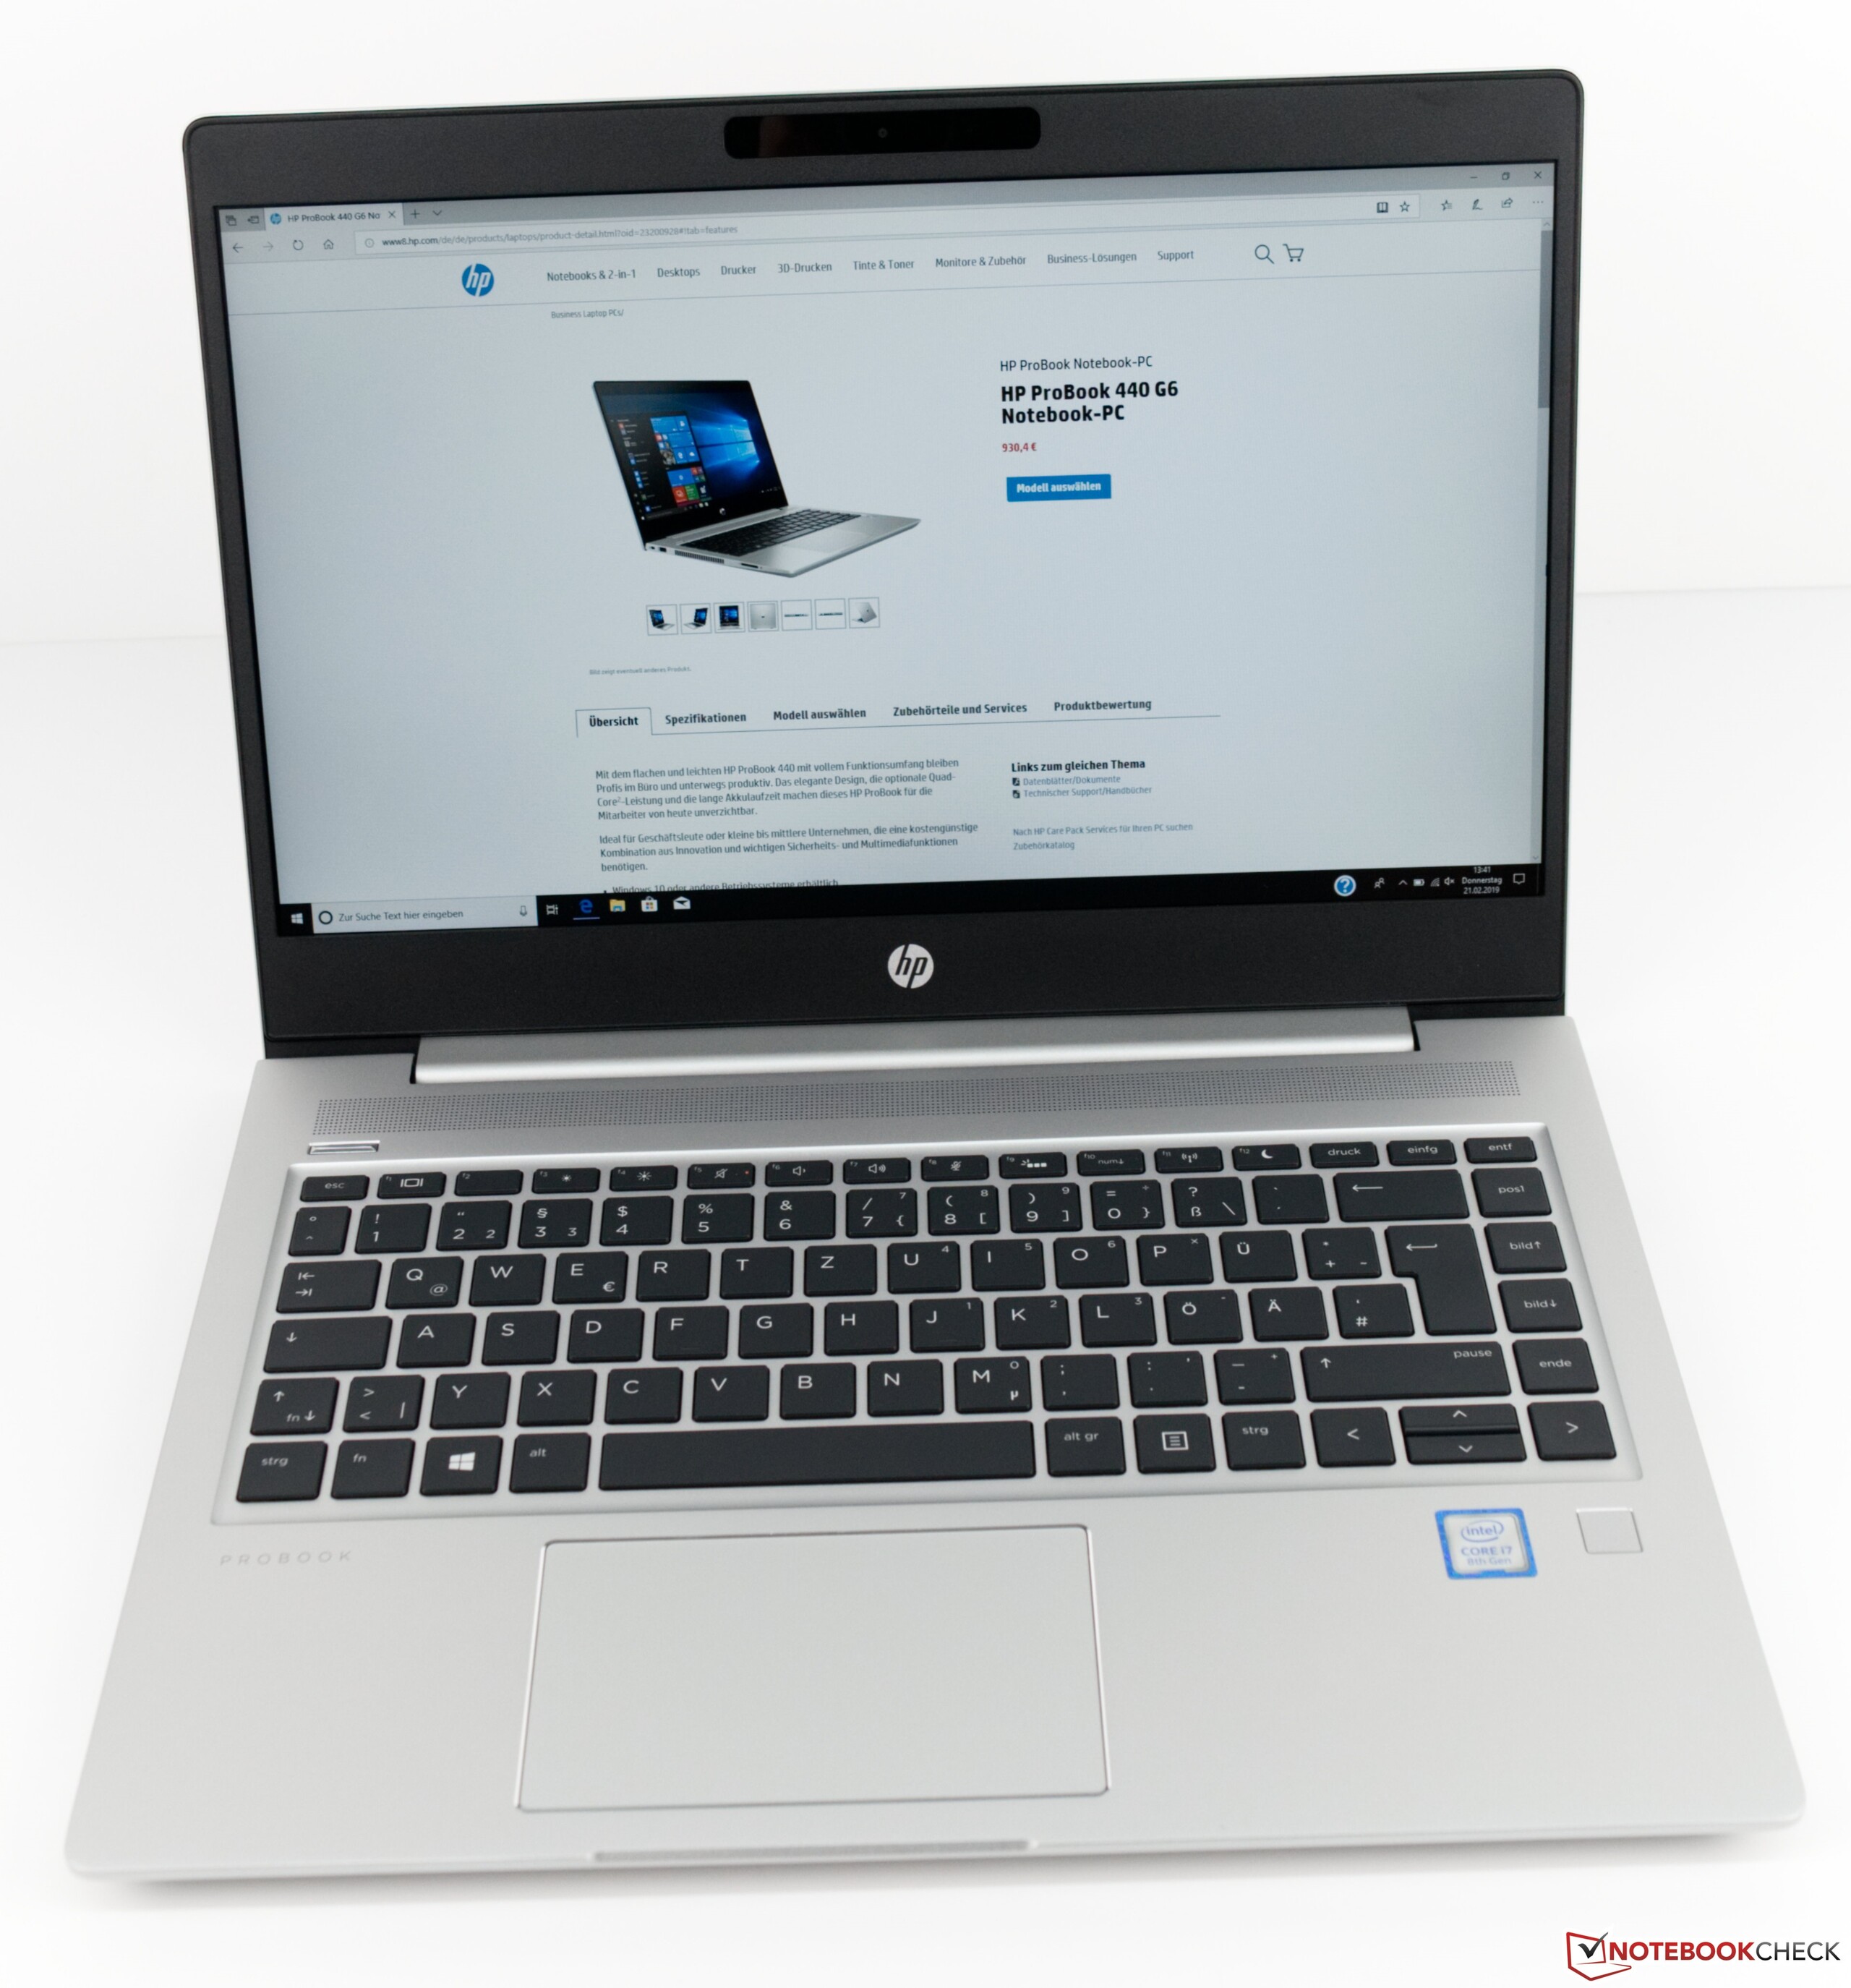
Vår testkonfiguration av HP ProBook 440 G6 går att få tag på för 13.000 kronor. Detta inkluderar en Core i7-processor, 16 GB RAM och en SSD-enhet på 512 GB. Vi uppskattar tanken bakom skärmvalet, men den räcker inte till för en enhet i det här prisskiktet. En matt IPS-skärm hjälper inte om den åtföljs av en medelmåttig färgrymd och en betydande molneffekt.
HP är på rätt spår med sin ProBook 440 G6. Men trots det har enheten svårt att hänga med den starka konkurrensen från andra tillverkare.
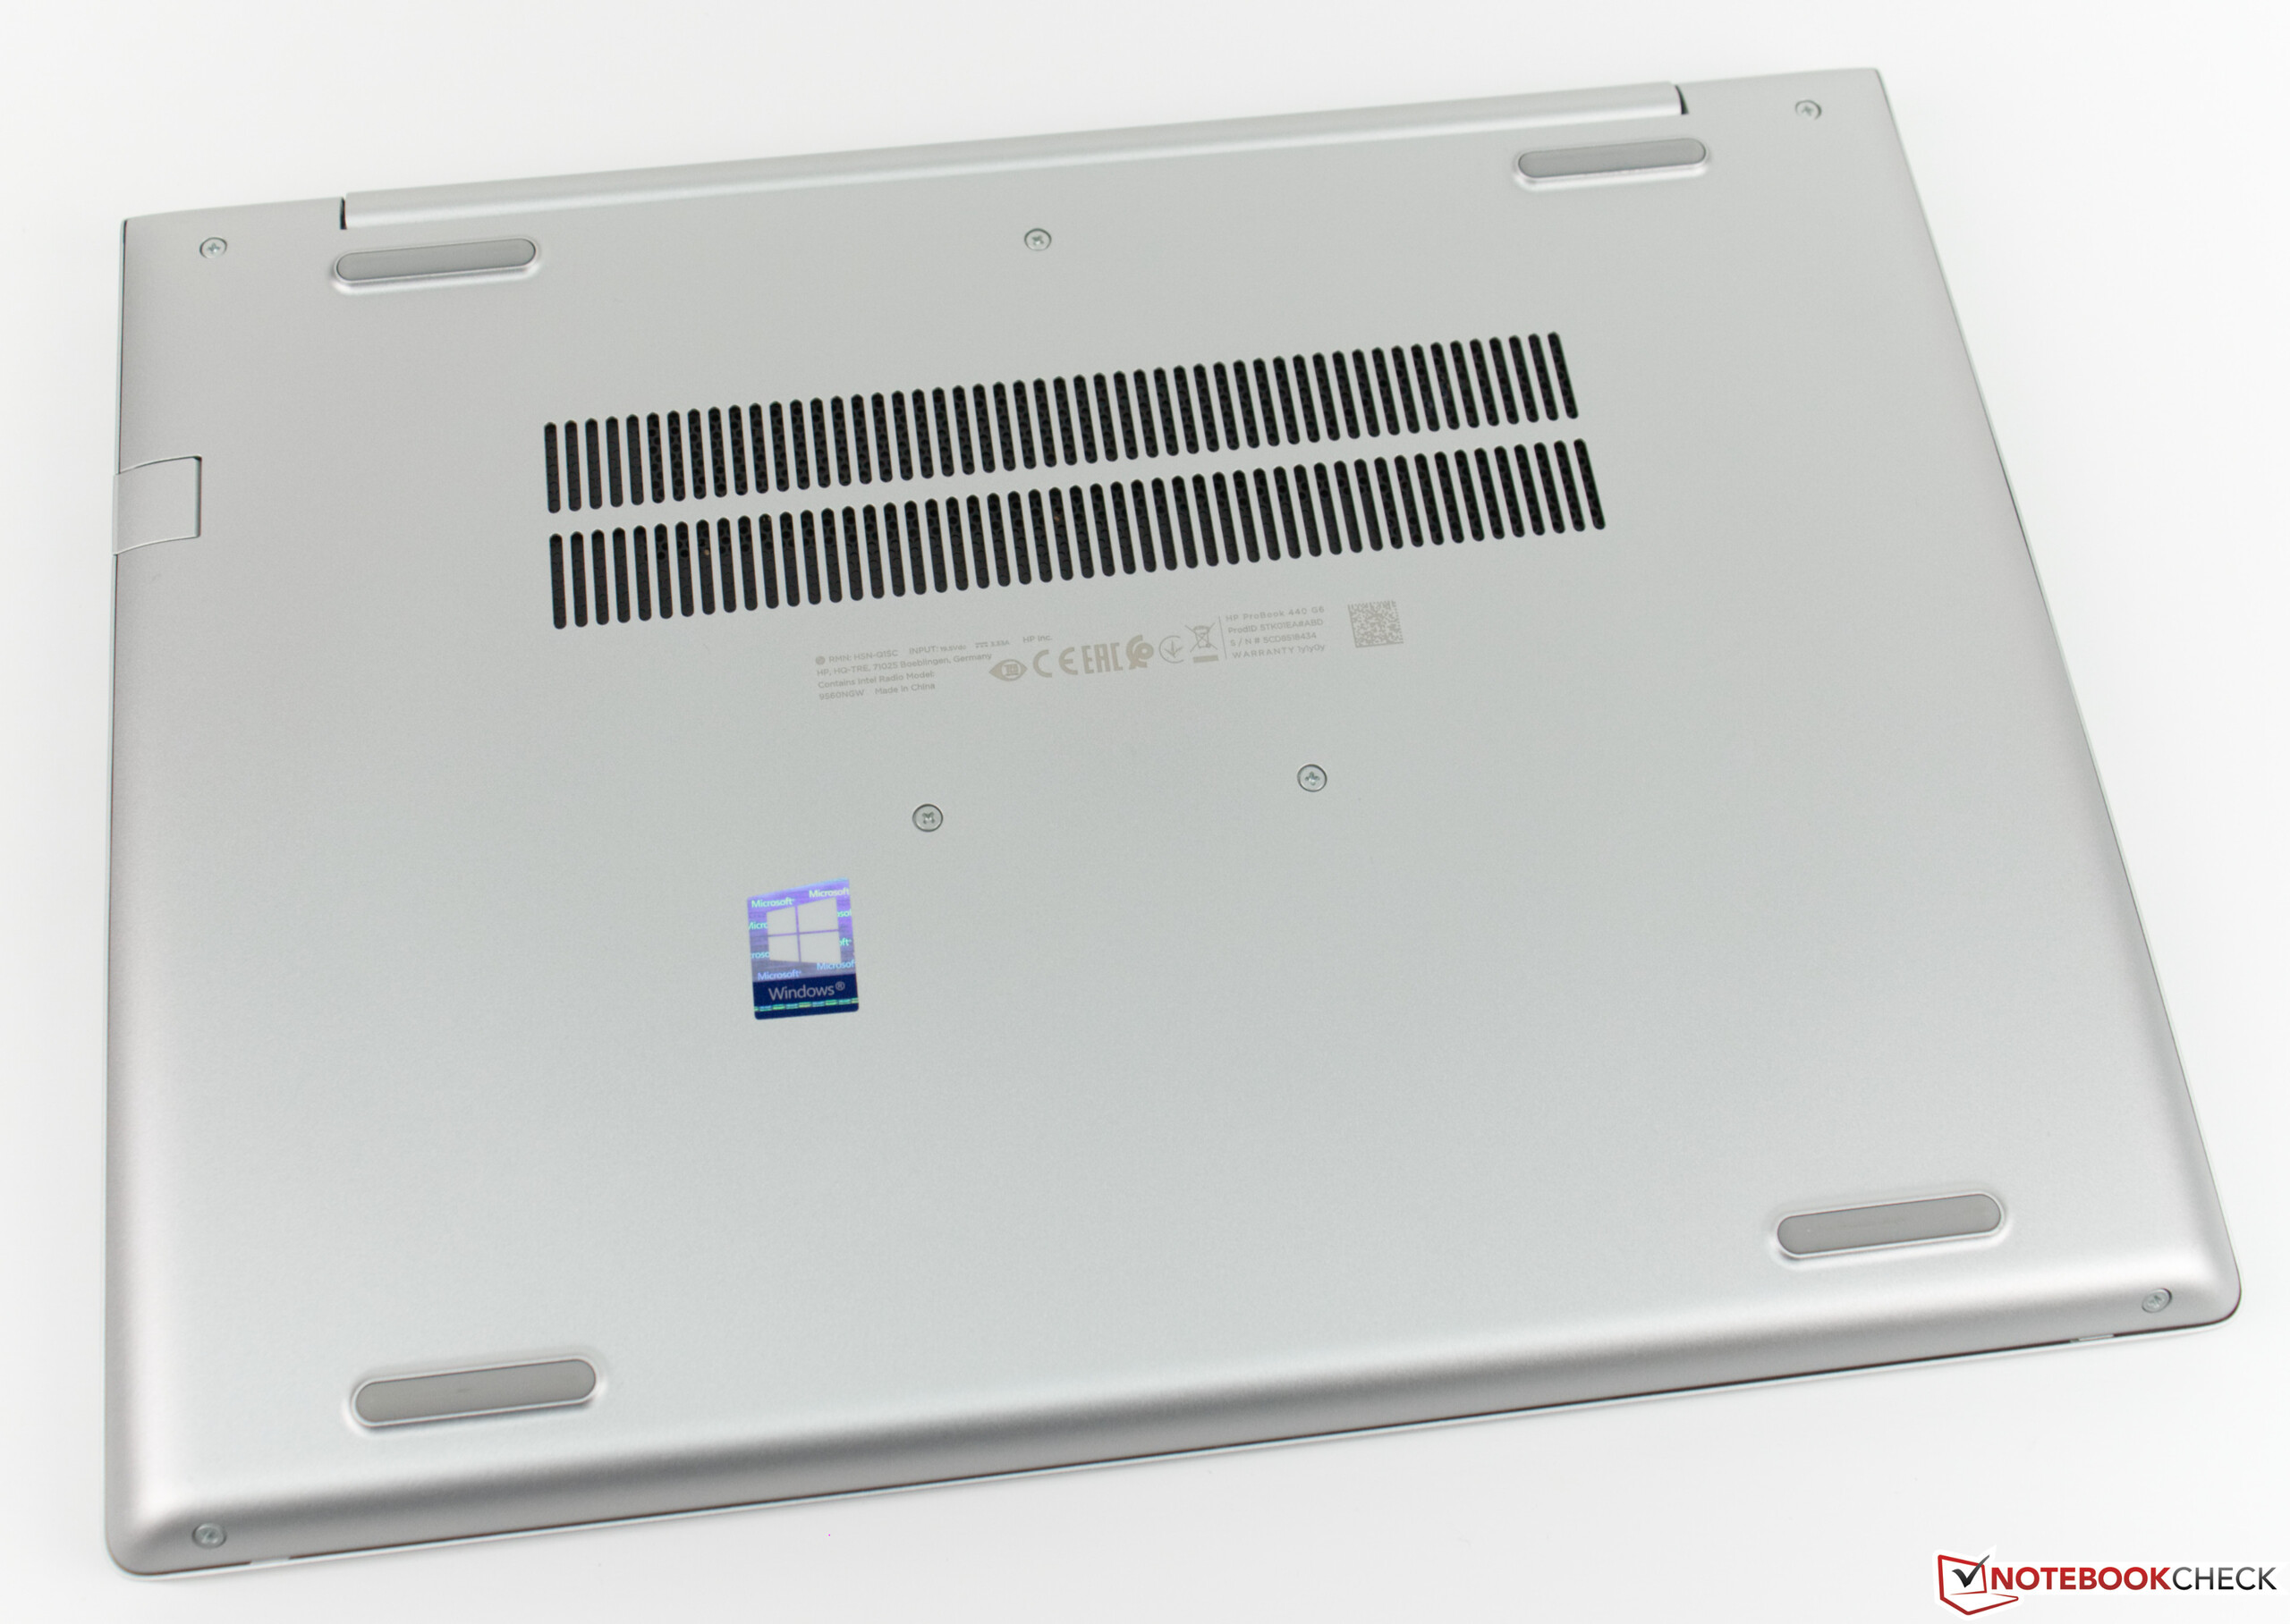
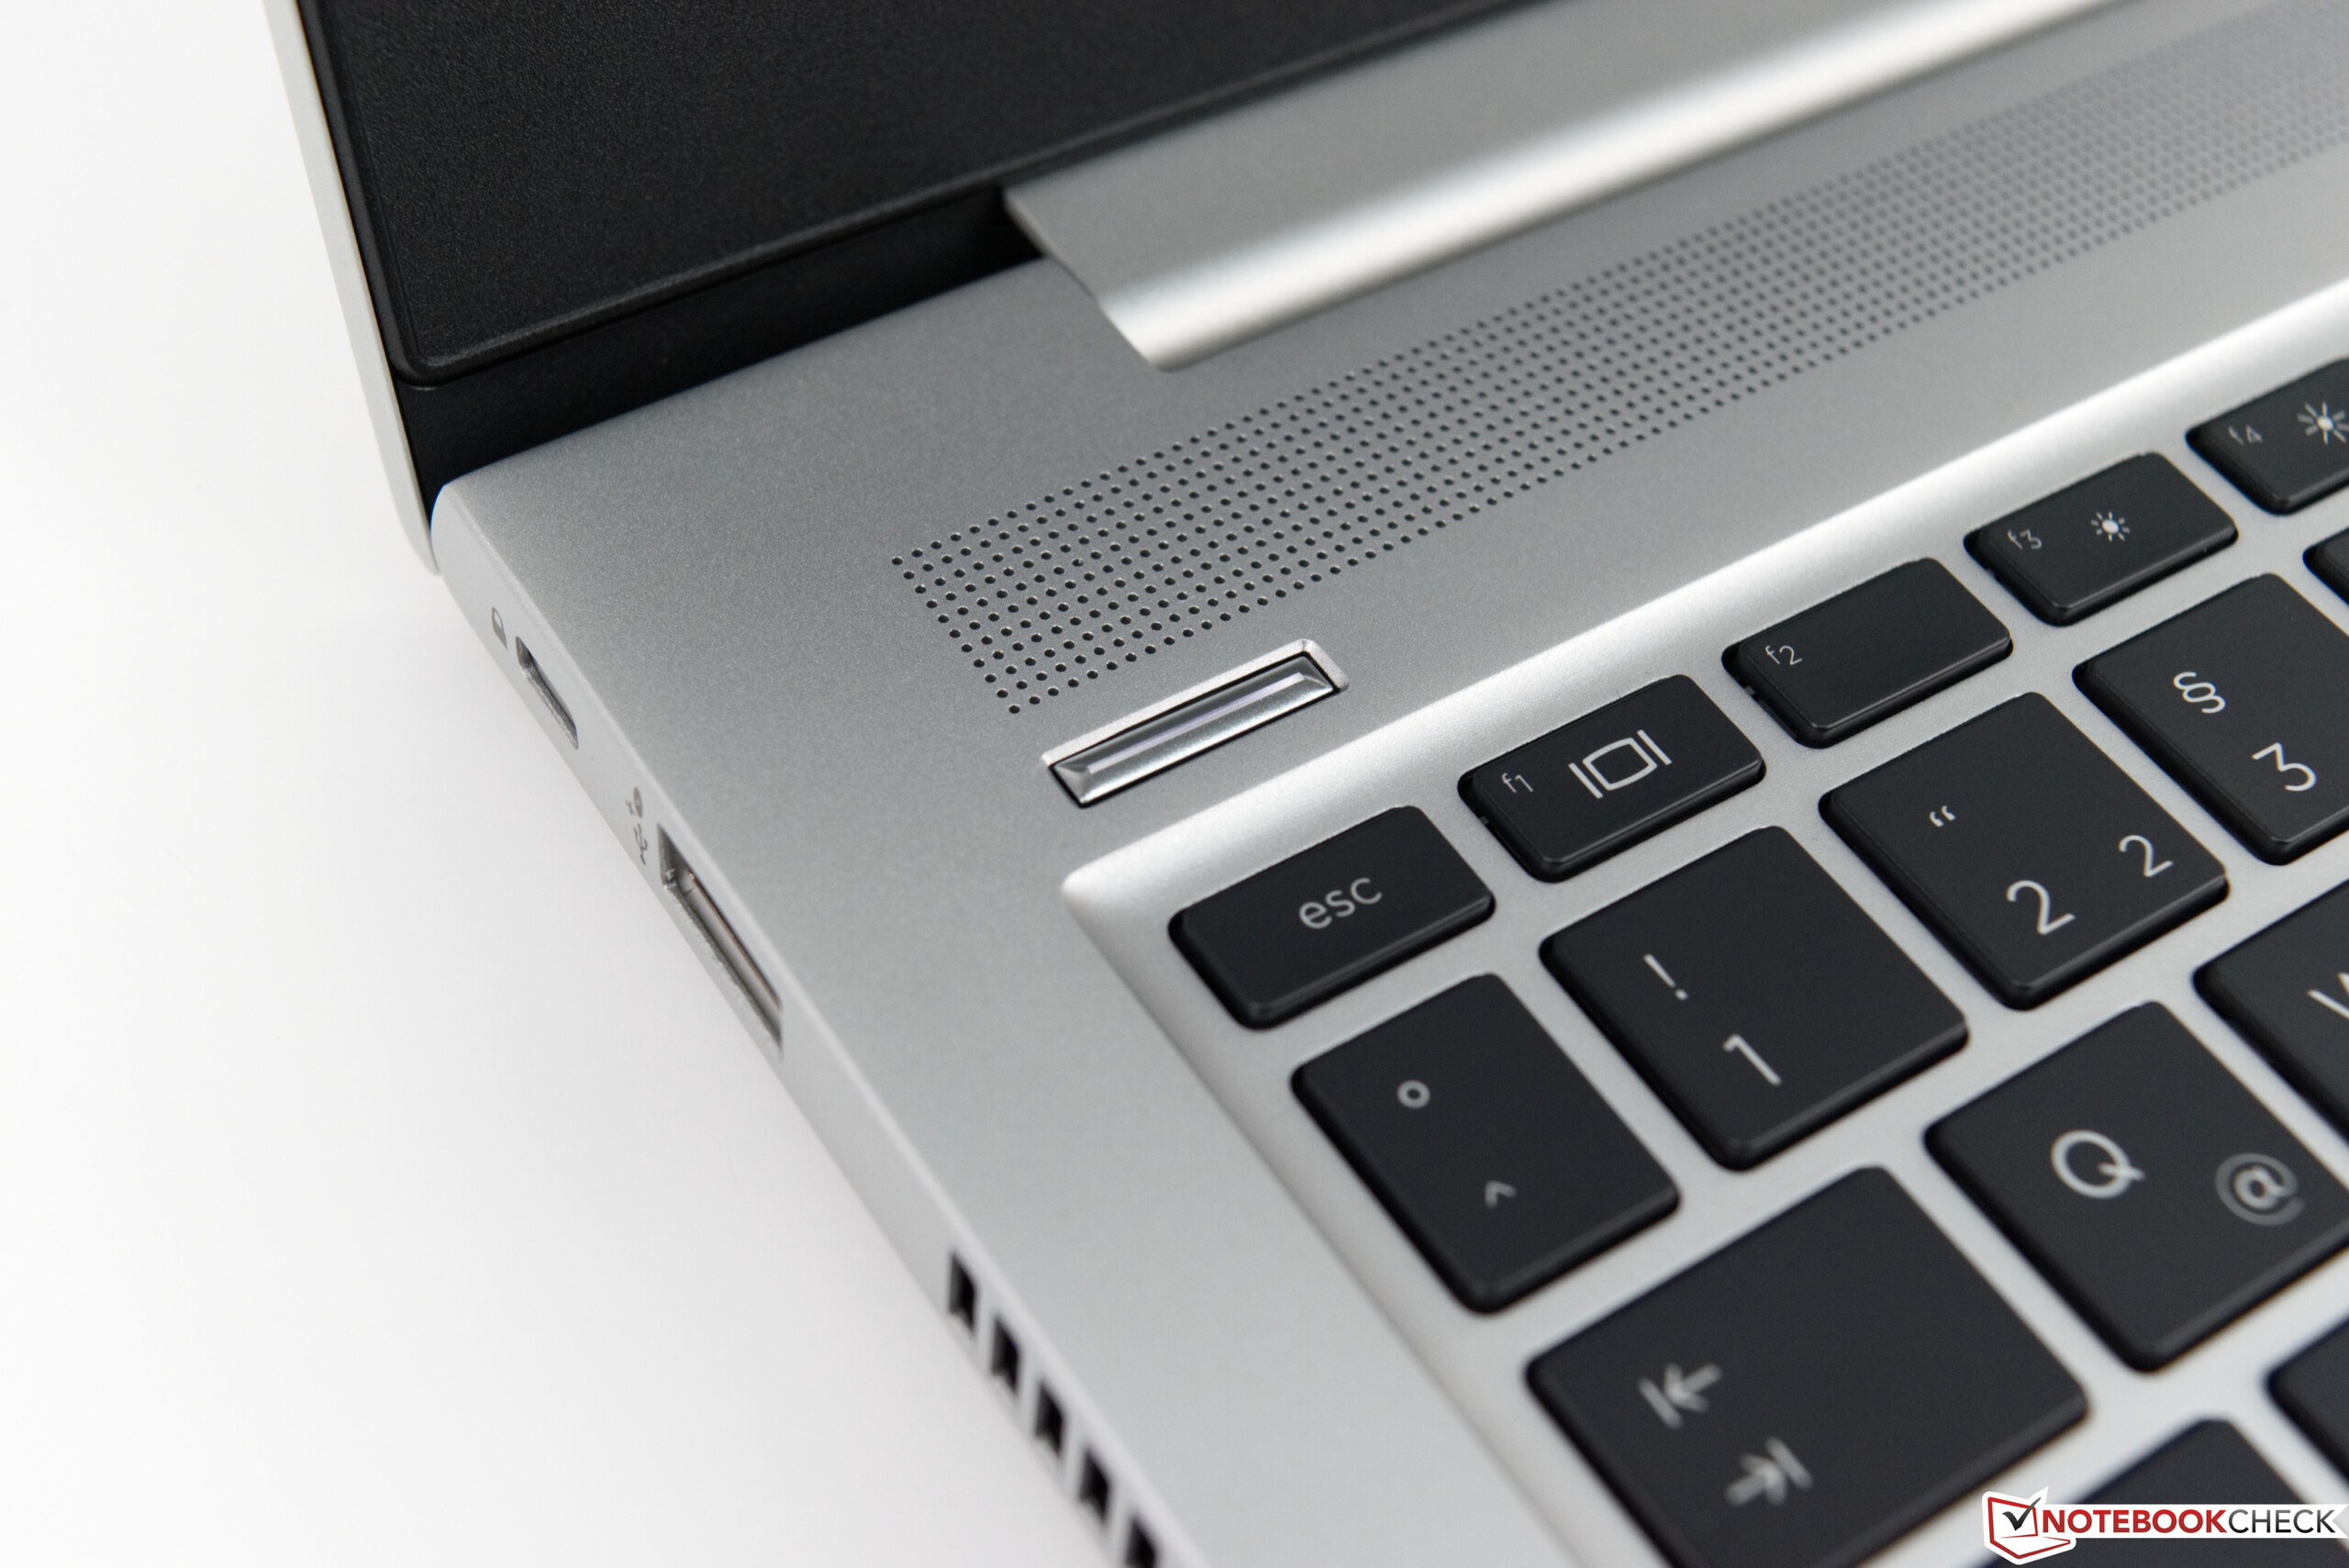
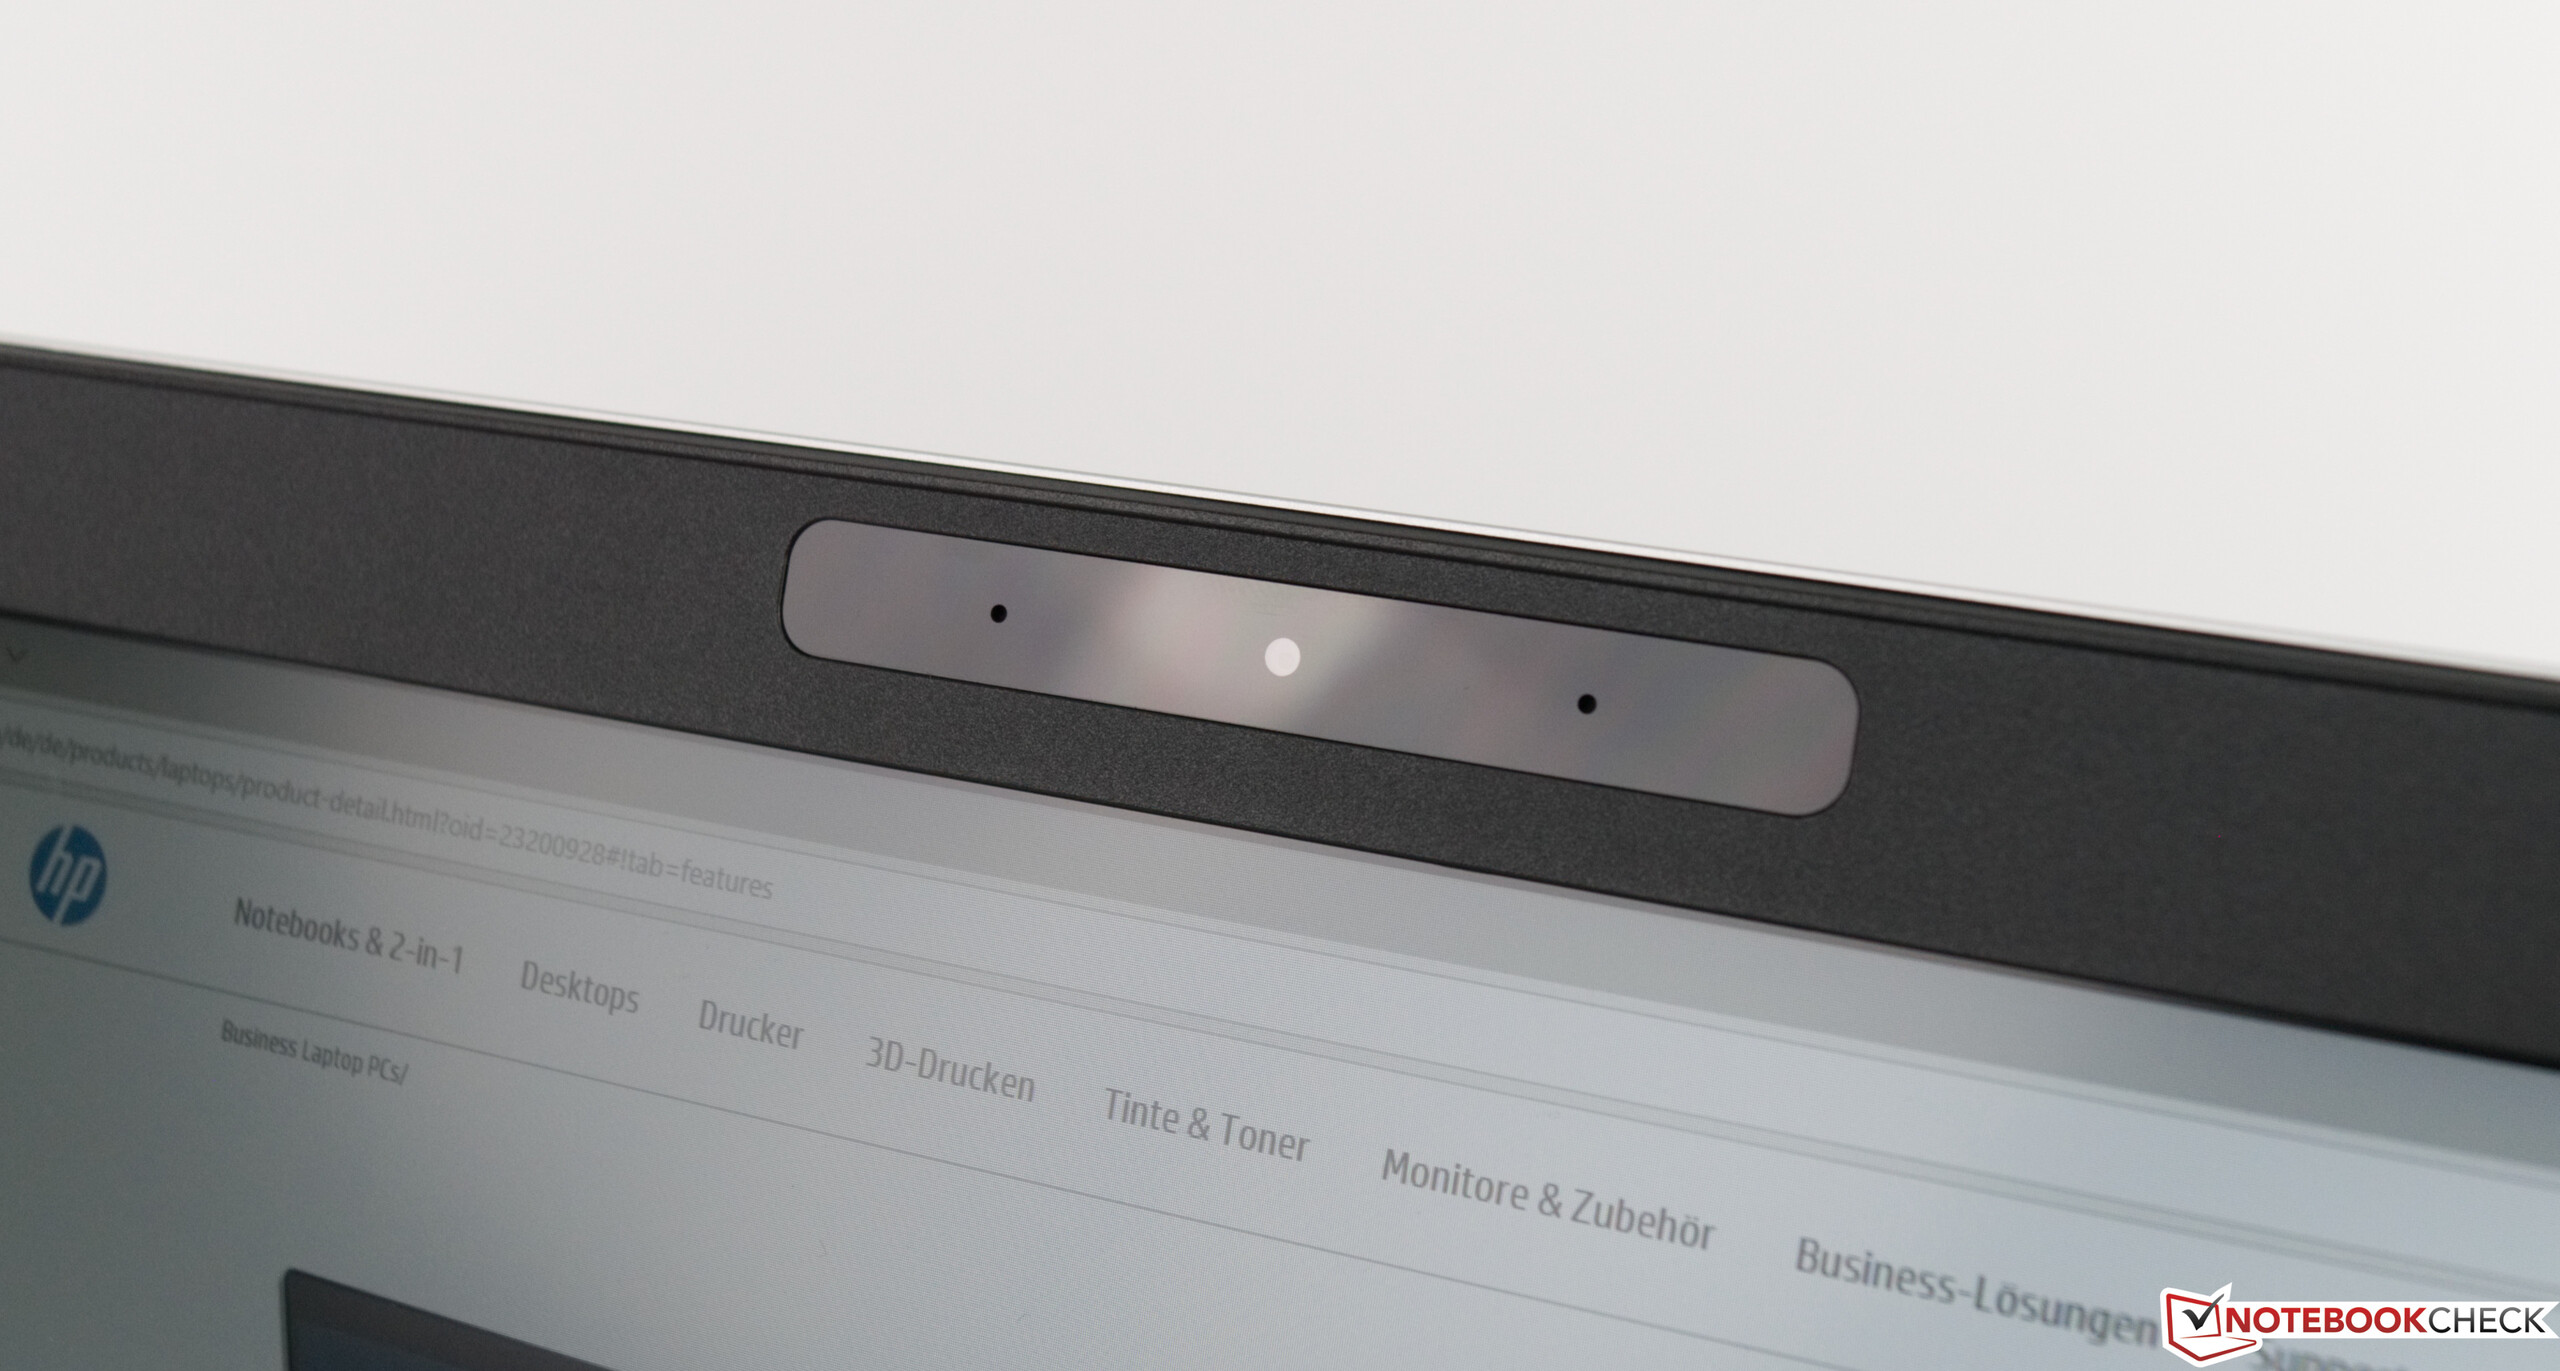
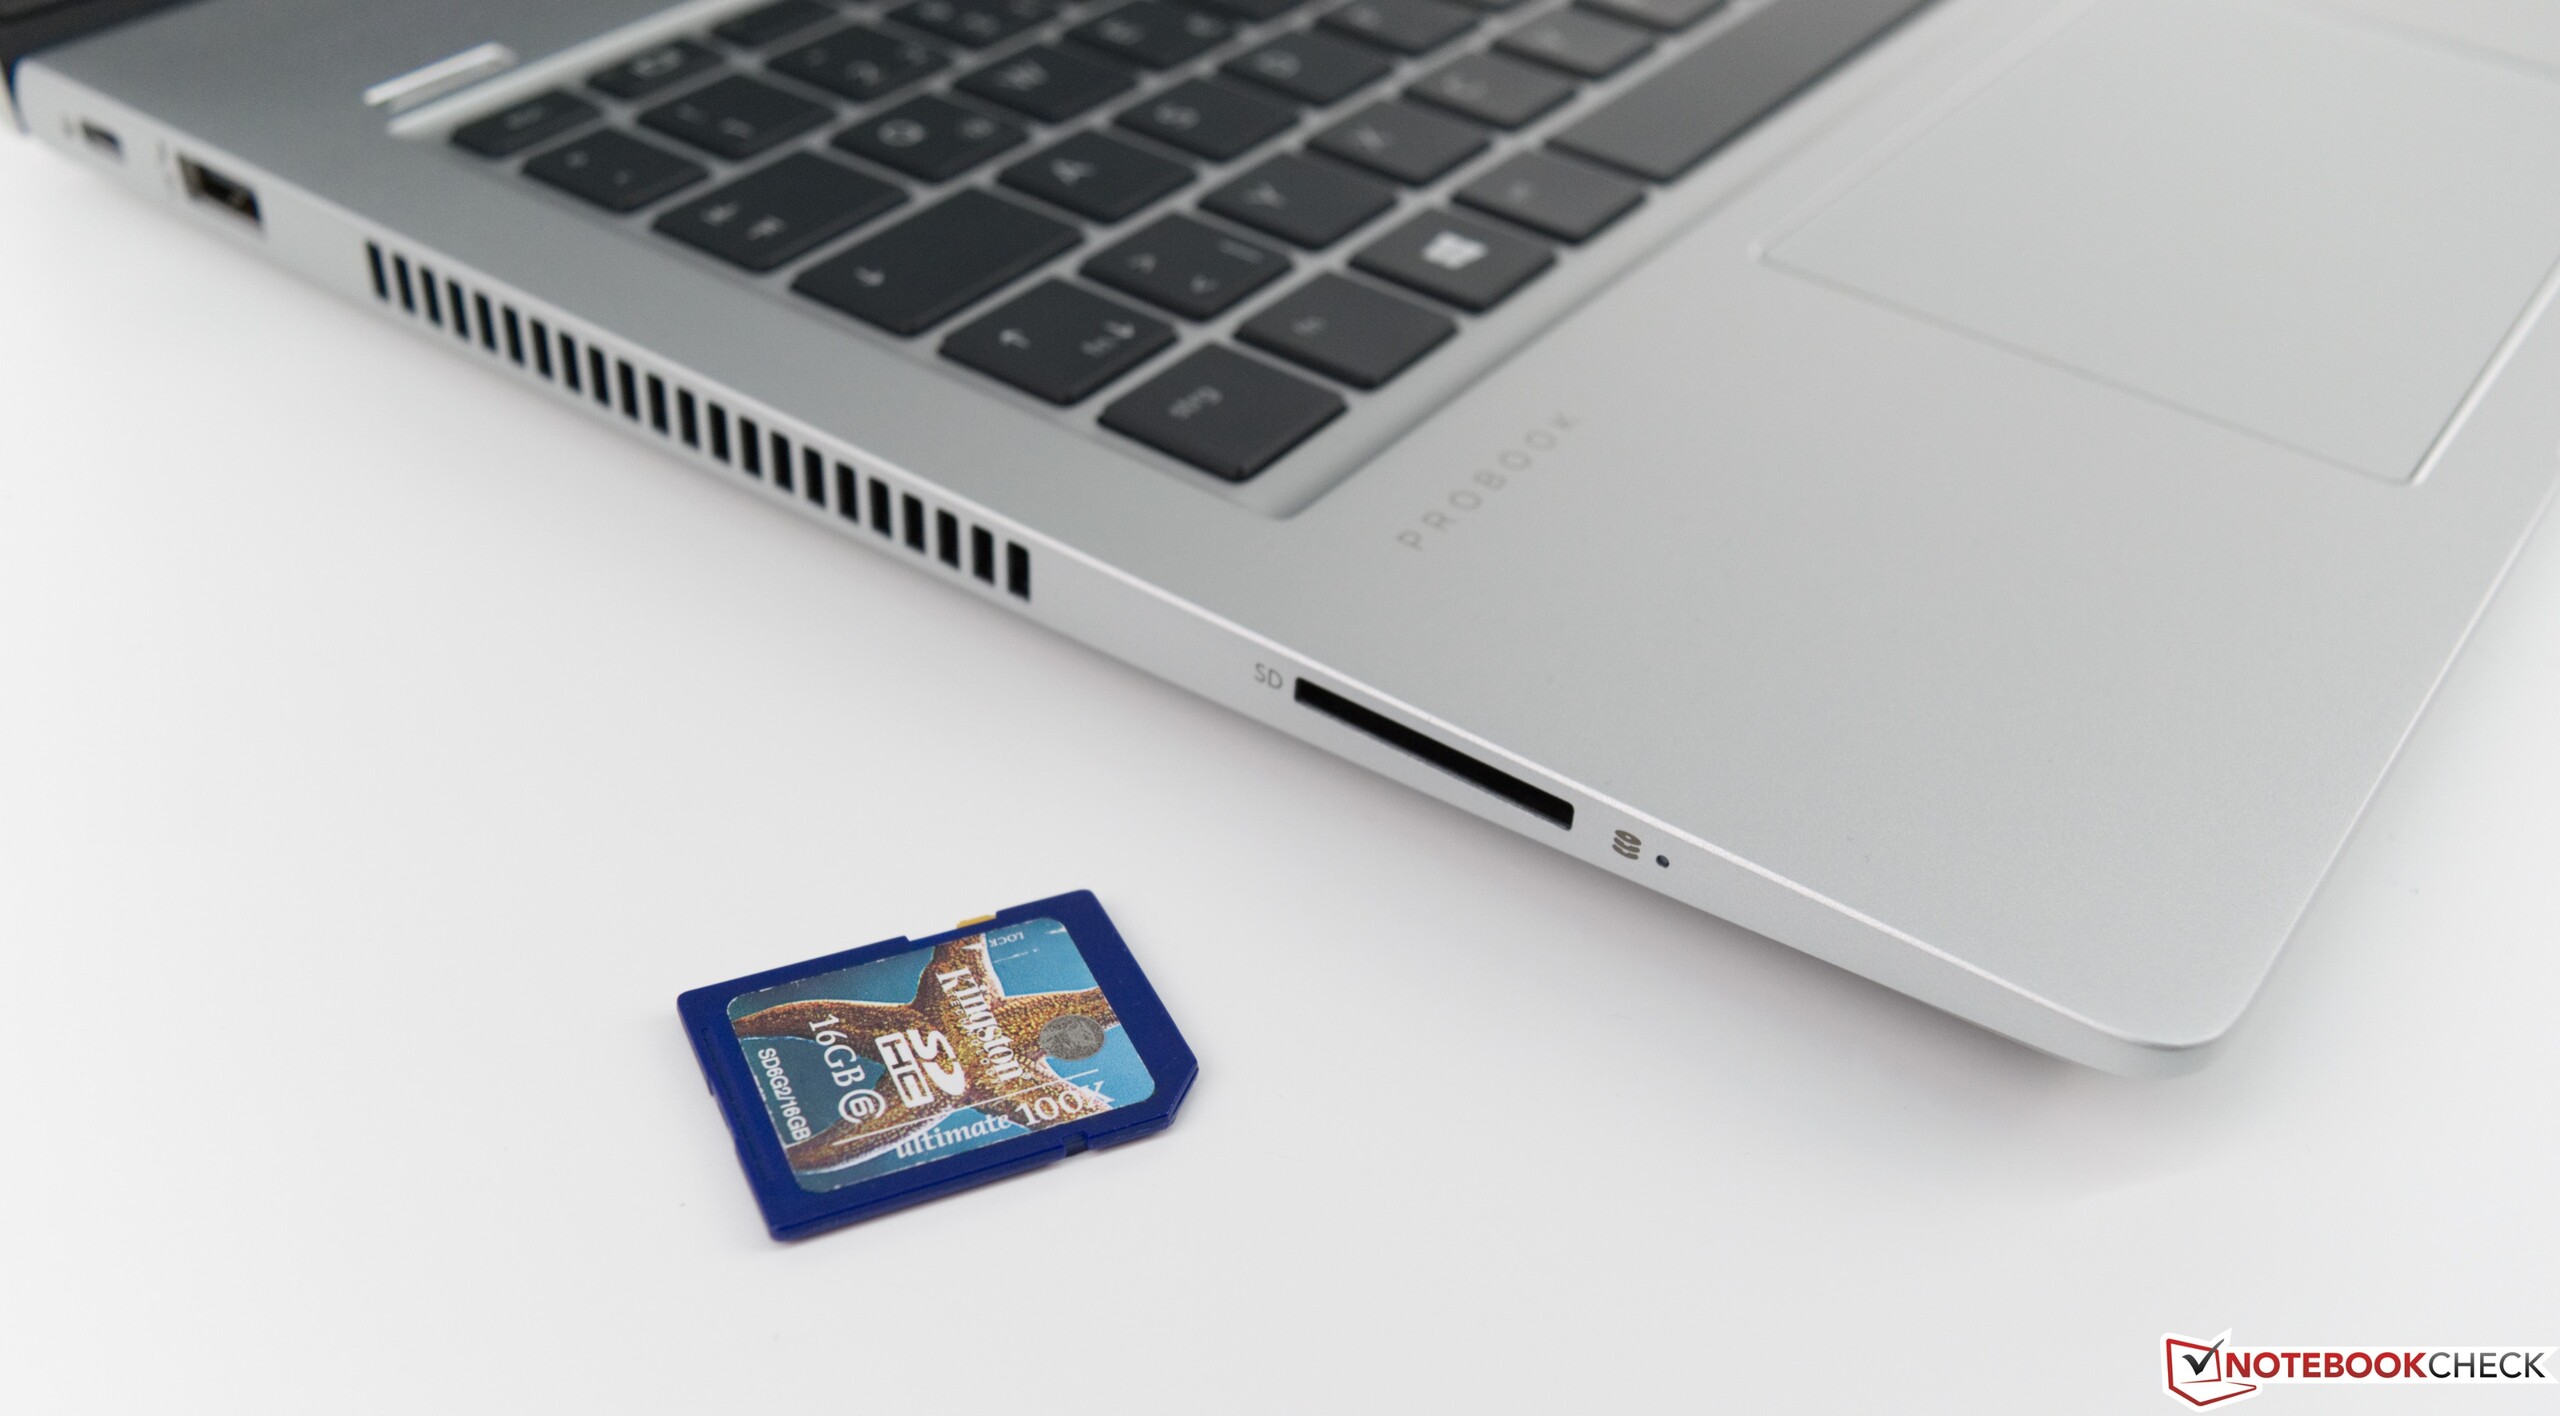
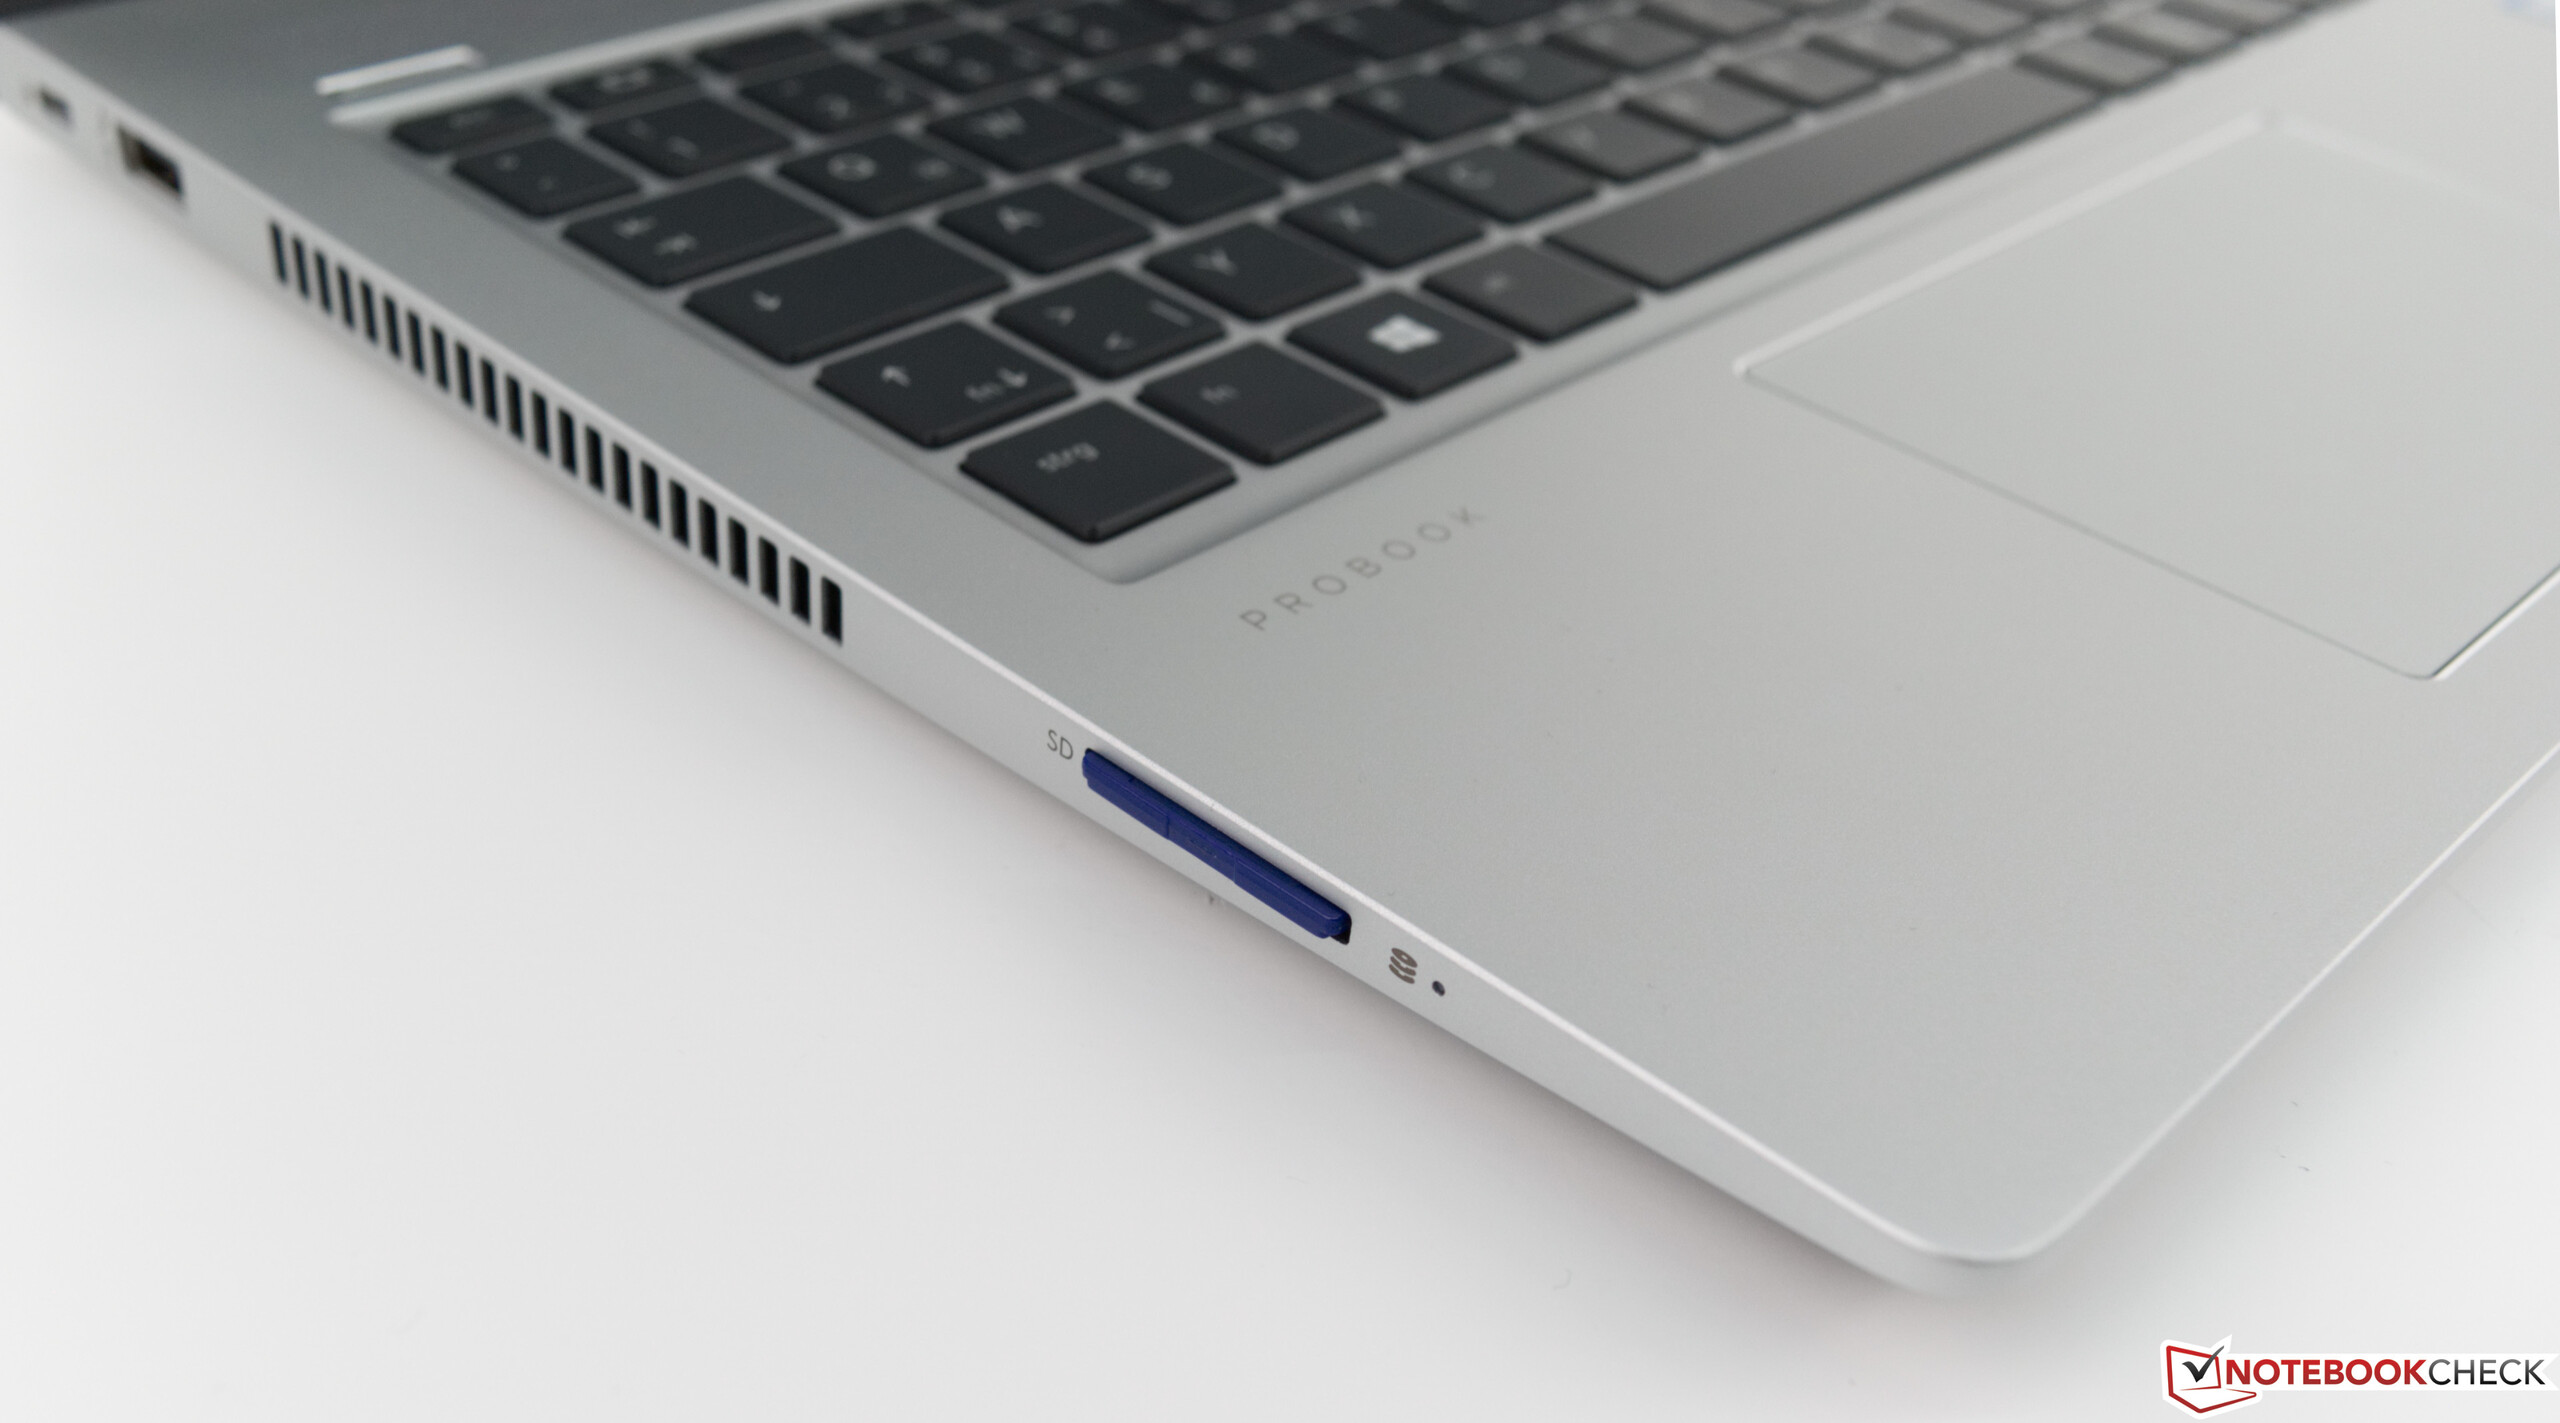
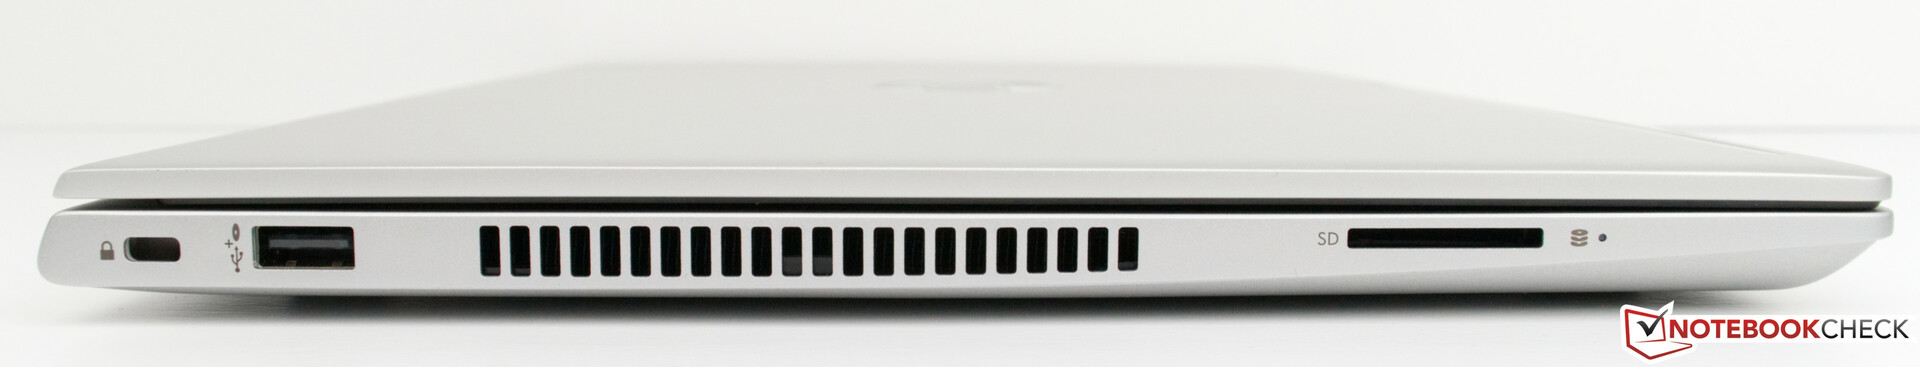
Vi vill särskilt nämna de goda resultaten på punkterna värmeutveckling och ljudnivå. Låg energiförbrukning säkrar lång batteritid och de försiktiga kylfläktarna innebär låg ljudnivå. Vi imponerades också av säkerhetsfunktionerna (fingeravtrycksläsare och IR-kamera) som fungerade perfekt. Närvaron av en SD-kortläsare bör också nämnas eftersom många tillverkare idag utesluter en sådan alternativt bara erbjuder en microSD-kortläsare.
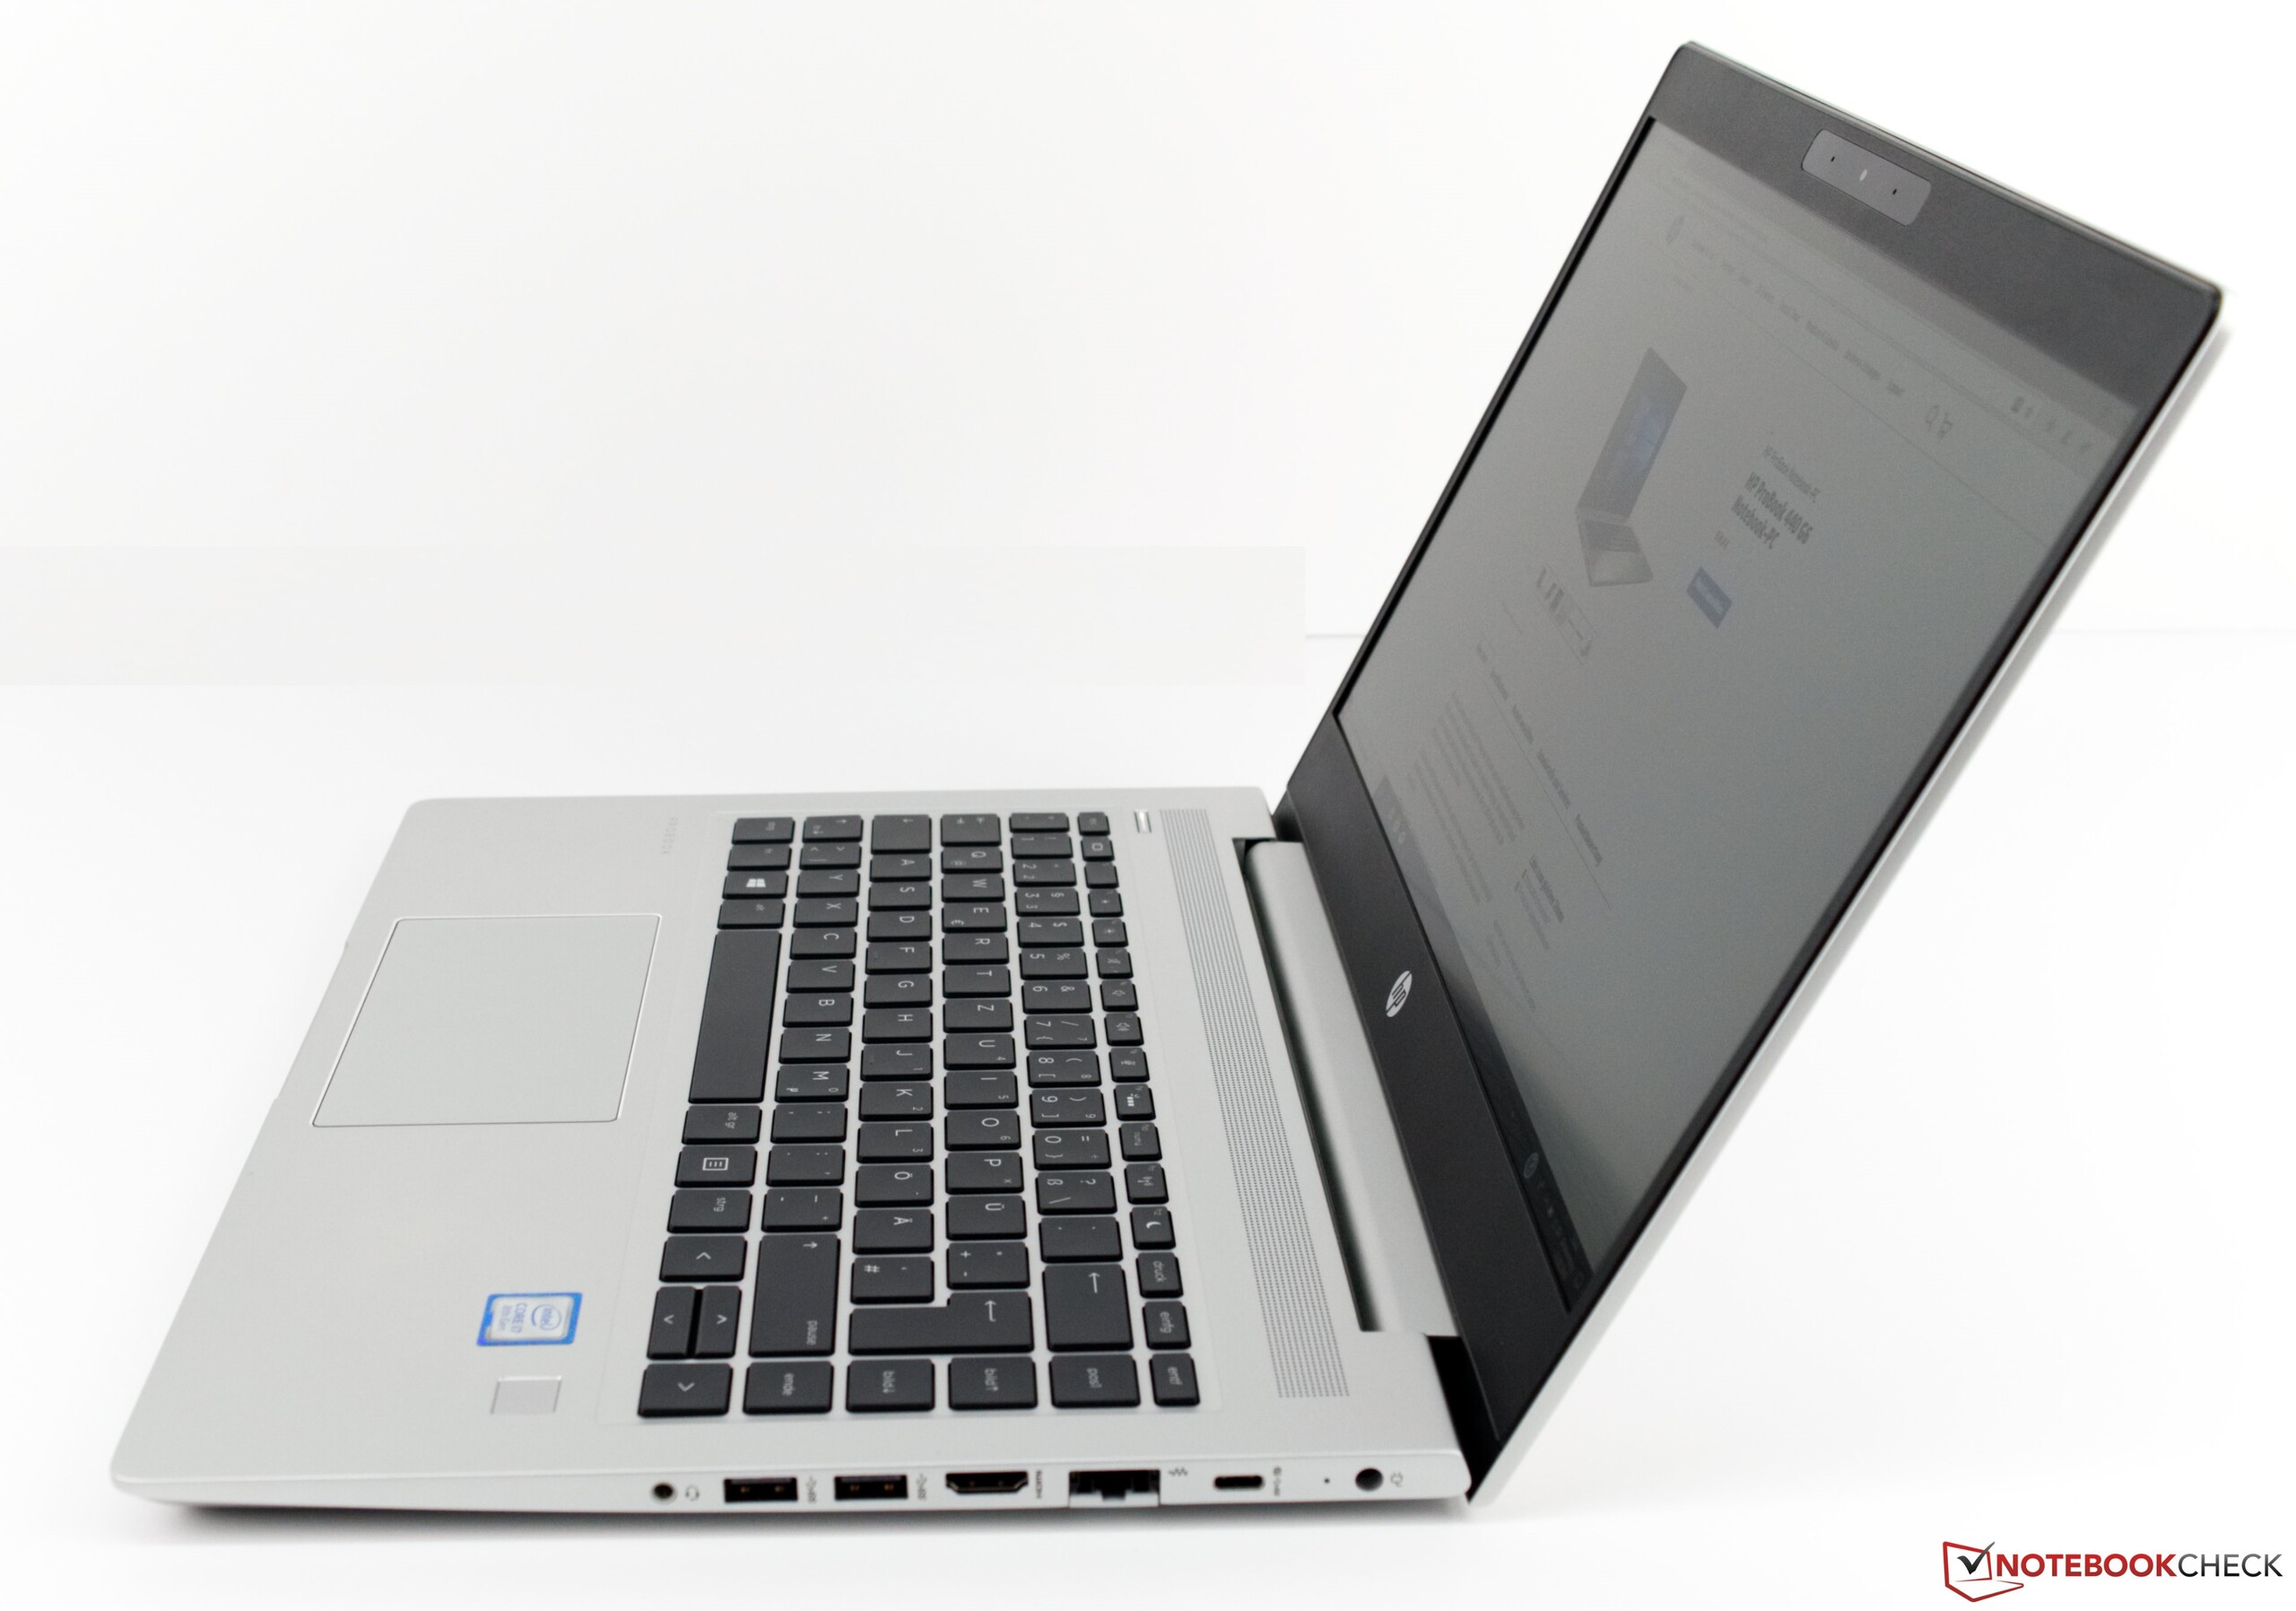
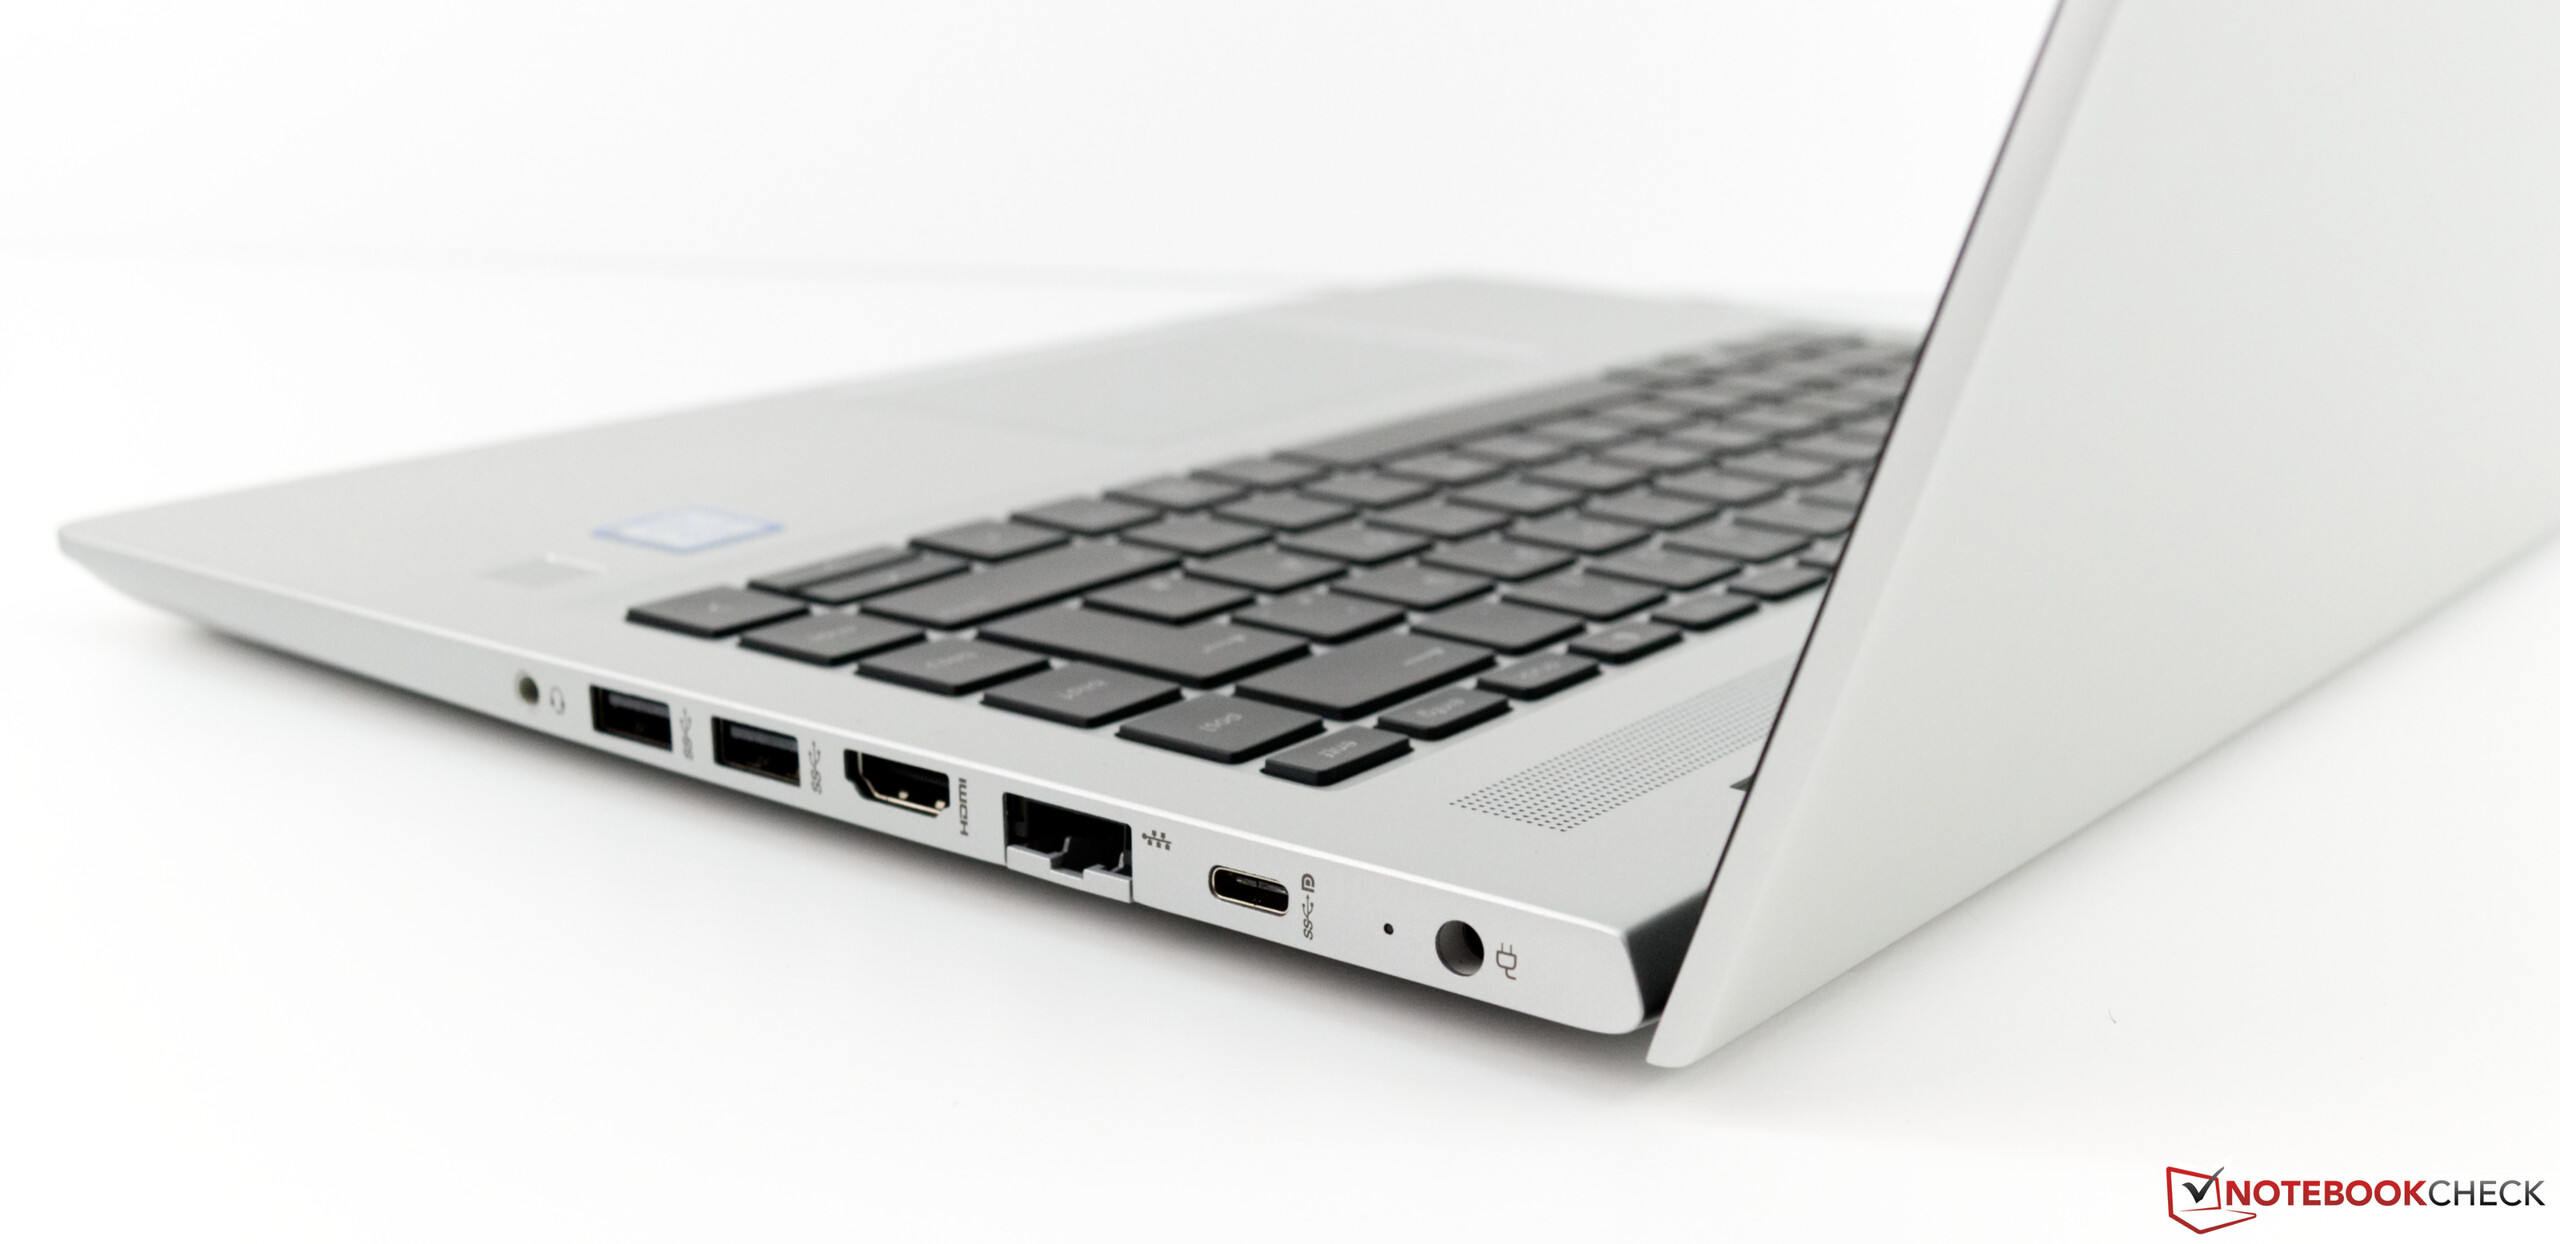
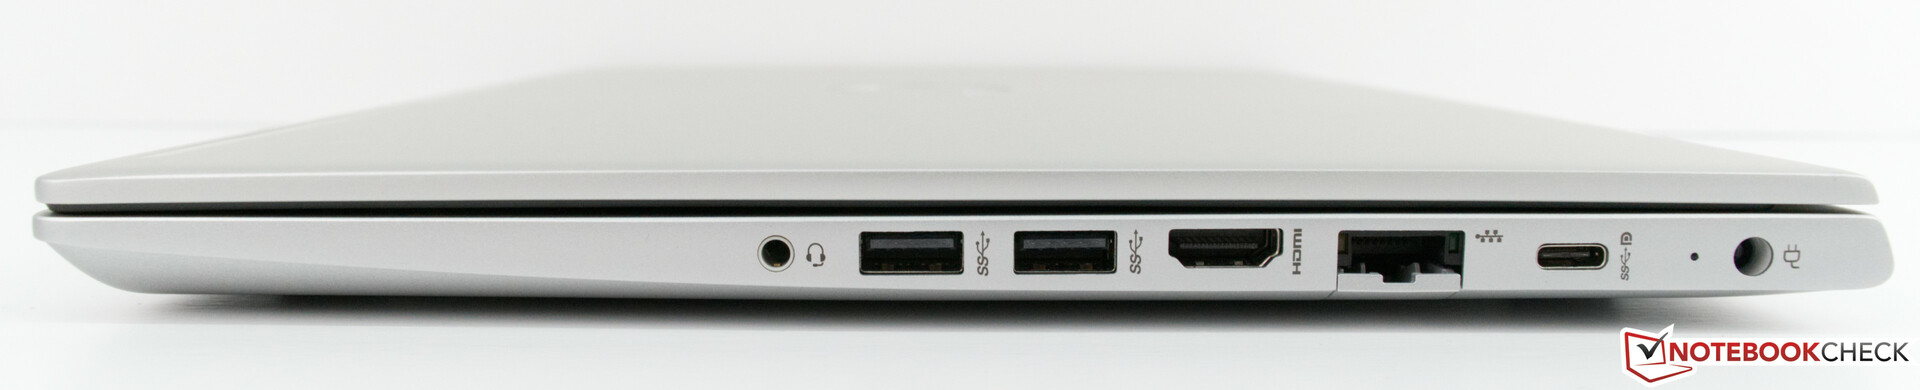
Men en fullfjädrad företagslaptop bör också inkludera en smart card-läsare - vilket HP ProBook 440 G6 inte har. Det hade också varit bra om den hade en Typ C-port med stöd för Thunderbolt 3. Det hade fått enheten att stå ut mer från mängden.
HP ProBook 440 G6-5TK01EA
- 03/08/2019 v6 (old)
Sebastian Bade
Price comparison
