Test: Acer Swift 3 SF314 (i7-8565U, MX250) Laptop (Sammanfattning)

| SD Card Reader | |
| average JPG Copy Test (av. of 3 runs) | |
| Genomsnitt av klass Subnotebook (23.7 - 188, n=9, senaste 2 åren) | |
| Lenovo ThinkPad A485-20MU000CGE (Toshiba Exceria Pro SDXC 64 GB UHS-II) | |
| Asus Zenbook 14 UX433FA-A6018T (Toshiba Exceria Pro M501 microSDXC 64GB) | |
| Acer Swift 3 SF314-55G-768V (Toshiba Exceria Pro SDXC 64 GB UHS-II) | |
| Acer Swift 3 SF314-55-31N8 (Toshiba Exceria Pro SDXC 64 GB UHS-II) | |
| Acer TravelMate X3410-M-50DD (Toshiba Exceria Pro SDXC 64 GB UHS-II) | |
| maximum AS SSD Seq Read Test (1GB) | |
| Genomsnitt av klass Subnotebook (24.9 - 195, n=8, senaste 2 åren) | |
| Lenovo ThinkPad A485-20MU000CGE (Toshiba Exceria Pro SDXC 64 GB UHS-II) | |
| Acer Swift 3 SF314-55G-768V (Toshiba Exceria Pro SDXC 64 GB UHS-II) | |
| Acer Swift 3 SF314-55-31N8 (Toshiba Exceria Pro SDXC 64 GB UHS-II) | |
| Asus Zenbook 14 UX433FA-A6018T (Toshiba Exceria Pro M501 microSDXC 64GB) | |
| Acer TravelMate X3410-M-50DD (Toshiba Exceria Pro SDXC 64 GB UHS-II) | |
| |||||||||||||||||||||||||
Distribution av ljusstyrkan: 87 %
Mitt på batteriet: 317 cd/m²
Kontrast: 923:1 (Svärta: 0.35 cd/m²)
ΔE ColorChecker Calman: 3.13 | ∀{0.5-29.43 Ø4.73}
calibrated: 0.9
ΔE Greyscale Calman: 4.32 | ∀{0.09-98 Ø4.97}
99% sRGB (Argyll 1.6.3 3D)
64% AdobeRGB 1998 (Argyll 1.6.3 3D)
69.5% AdobeRGB 1998 (Argyll 3D)
98.9% sRGB (Argyll 3D)
67.3% Display P3 (Argyll 3D)
Gamma: 2.29
CCT: 7436 K
| Acer Swift 3 SF314-55G-768V Chi Mei CMN14D5, , 1920x1080, 14" | Lenovo ThinkPad A485-20MU000CGE NV140FHM-N46, , 1920x1080, 14" | Huawei MateBook 14 KLV-W29 Chi Mei CMN8C02, , 2160x1440, 14" | Acer TravelMate X3410-M-50DD N140HCA-EAC, , 1920x1080, 14" | Asus Zenbook 14 UX433FA-A6018T AU Optronics B140HAN03.2, , 1920x1080, 14" | Acer Swift 3 SF314-55-31N8 Chi Mei N140HCE-EN2, , 1920x1080, 14" | |
|---|---|---|---|---|---|---|
| Display | -40% | -1% | -37% | -7% | -2% | |
| Display P3 Coverage (%) | 67.3 | 40.24 -40% | 66.6 -1% | 41.96 -38% | 63.5 -6% | 66.2 -2% |
| sRGB Coverage (%) | 98.9 | 60 -39% | 97.8 -1% | 63 -36% | 90.9 -8% | 98.3 -1% |
| AdobeRGB 1998 Coverage (%) | 69.5 | 41.57 -40% | 68.1 -2% | 43.37 -38% | 64.6 -7% | 67.8 -2% |
| Response Times | -19% | 4% | -6% | -3% | -5% | |
| Response Time Grey 50% / Grey 80% * (ms) | 40 ? | 44.8 ? -12% | 38 ? 5% | 42 ? -5% | 42 ? -5% | 41 ? -2% |
| Response Time Black / White * (ms) | 28 ? | 35.2 ? -26% | 27.2 ? 3% | 30 ? -7% | 28 ? -0% | 30 ? -7% |
| PWM Frequency (Hz) | 250 | 1000 ? | 24500 ? | 25000 ? | ||
| Screen | -70% | -10% | -32% | -27% | -4% | |
| Brightness middle (cd/m²) | 323 | 275 -15% | 401.7 24% | 255 -21% | 321 -1% | 291 -10% |
| Brightness (cd/m²) | 299 | 272 -9% | 386 29% | 218 -27% | 282 -6% | 276 -8% |
| Brightness Distribution (%) | 87 | 85 -2% | 95 9% | 72 -17% | 77 -11% | 90 3% |
| Black Level * (cd/m²) | 0.35 | 0.26 26% | 0.42 -20% | 0.08 77% | 0.2 43% | 0.27 23% |
| Contrast (:1) | 923 | 1058 15% | 956 4% | 3188 245% | 1605 74% | 1078 17% |
| Colorchecker dE 2000 * | 3.13 | 5.9 -88% | 4.11 -31% | 5.01 -60% | 6.35 -103% | 3.86 -23% |
| Colorchecker dE 2000 max. * | 6.96 | 20 -187% | 8.93 -28% | 17.44 -151% | 12.2 -75% | 8.26 -19% |
| Colorchecker dE 2000 calibrated * | 0.9 | 4.9 -444% | 1.36 -51% | 4.06 -351% | 1.88 -109% | |
| Greyscale dE 2000 * | 4.32 | 3.6 17% | 6.1 -41% | 3 31% | 8.35 -93% | 5.33 -23% |
| Gamma | 2.29 96% | 2.36 93% | 2.19 100% | 2.26 97% | 2.51 88% | 2.25 98% |
| CCT | 7436 87% | 6798 96% | 7222 90% | 6185 105% | 8227 79% | 7426 88% |
| Color Space (Percent of AdobeRGB 1998) (%) | 64 | 38.1 -40% | 62.7 -2% | 40 -37% | 59 -8% | 62 -3% |
| Color Space (Percent of sRGB) (%) | 99 | 59.6 -40% | 98.6 0% | 63 -36% | 91 -8% | 98 -1% |
| Totalt genomsnitt (program/inställningar) | -43% /
-58% | -2% /
-6% | -25% /
-29% | -12% /
-20% | -4% /
-4% |
* ... mindre är bättre
Visa svarstider
| ↔ Svarstid svart till vitt | ||
|---|---|---|
| 28 ms ... stiga ↗ och falla ↘ kombinerat | ↗ 15 ms stiga | 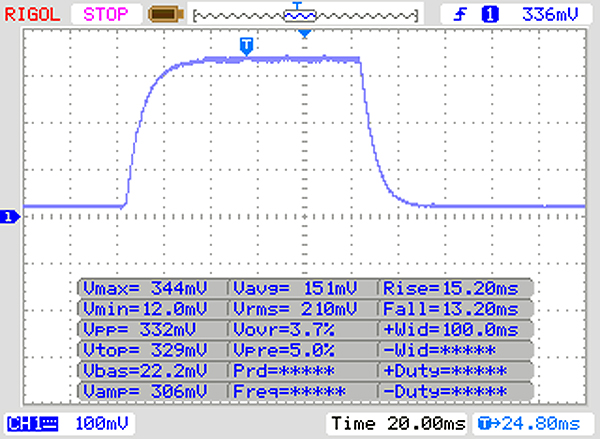 |
| ↘ 13 ms hösten | ||
| Skärmen visar relativt långsamma svarsfrekvenser i våra tester och kan vara för långsam för spelare. I jämförelse sträcker sig alla testade enheter från 0.1 (minst) till 240 (maximalt) ms. » 71 % av alla enheter är bättre. Detta innebär att den uppmätta svarstiden är sämre än genomsnittet av alla testade enheter (19.9 ms). | ||
| ↔ Svarstid 50 % grått till 80 % grått | ||
| 40 ms ... stiga ↗ och falla ↘ kombinerat | ↗ 22 ms stiga | 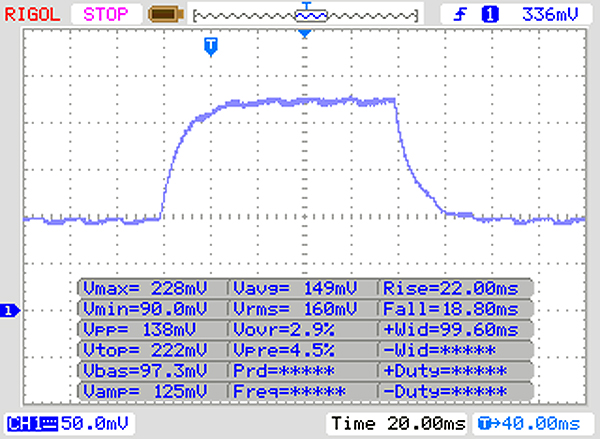 |
| ↘ 18 ms hösten | ||
| Skärmen visar långsamma svarsfrekvenser i våra tester och kommer att vara otillfredsställande för spelare. I jämförelse sträcker sig alla testade enheter från 0.165 (minst) till 636 (maximalt) ms. » 61 % av alla enheter är bättre. Detta innebär att den uppmätta svarstiden är sämre än genomsnittet av alla testade enheter (31.1 ms). | ||
Skärmflimmer / PWM (Puls-Width Modulation)
| Skärmflimmer / PWM upptäckt | 250 Hz | 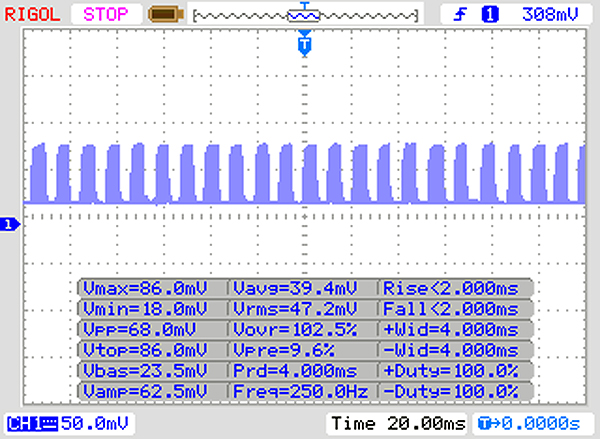 | |
Displayens bakgrundsbelysning flimrar vid 250 Hz (i värsta fall, t.ex. med PWM) . Frekvensen för 250 Hz är relativt låg, så känsliga användare kommer sannolikt att märka flimmer och uppleva ansträngda ögon vid den angivna ljusstyrkeinställningen och nedan. Som jämförelse: 52 % av alla testade enheter använder inte PWM för att dämpa skärmen. Om PWM upptäcktes mättes ett medelvärde av 7794 (minst: 5 - maximum: 343500) Hz. | |||
| PCMark 8 Home Score Accelerated v2 | 3581 poäng | |
| PCMark 8 Work Score Accelerated v2 | 5174 poäng | |
| PCMark 10 Score | 4061 poäng | |
Hjälp | ||
| Acer Swift 3 SF314-55G-768V WDC PC SN520 SDAPNUW-512G | Lenovo ThinkPad A485-20MU000CGE Samsung SSD PM981 MZVLB256HAHQ | Huawei MateBook 14 KLV-W29 Samsung SSD PM981 MZVLB512HAJQ | Acer TravelMate X3410-M-50DD Micron 1100 MTFDDAV256TBN | Asus Zenbook 14 UX433FA-A6018T WDC PC SN520 SDAPNUW-256G | Acer Swift 3 SF314-55-31N8 Kingston RBUSNS8154P3128GJ | Genomsnitt WDC PC SN520 SDAPNUW-512G | |
|---|---|---|---|---|---|---|---|
| CrystalDiskMark 5.2 / 6 | -20% | -6% | -62% | -21% | -41% | -8% | |
| Write 4K (MB/s) | 185.5 | 114.8 -38% | 165.9 -11% | 85.4 -54% | 99.9 -46% | 96.8 -48% | 138.5 ? -25% |
| Read 4K (MB/s) | 50.2 | 41.33 -18% | 28.04 -44% | 26.4 -47% | 40.03 -20% | 36.99 -26% | 44.2 ? -12% |
| Write Seq (MB/s) | 1175 | 1271 8% | 1009 -14% | 402.5 -66% | 973 -17% | 463.1 -61% | 1265 ? 8% |
| Read Seq (MB/s) | 1132 | 1171 3% | 962 -15% | 461.2 -59% | 1111 -2% | 794 -30% | 1237 ? 9% |
| Write 4K Q32T1 (MB/s) | 472.6 | 218.4 -54% | 572 21% | 175.8 -63% | 424.6 -10% | 291.7 -38% | 404 ? -15% |
| Read 4K Q32T1 (MB/s) | 642 | 308.5 -52% | 611 -5% | 228.8 -64% | 255.9 -60% | 352 -45% | 421 ? -34% |
| Write Seq Q32T1 (MB/s) | 1453 | 1460 0% | 1720 18% | 442.9 -70% | 1300 -11% | 468.1 -68% | 1491 ? 3% |
| Read Seq Q32T1 (MB/s) | 1738 | 1529 -12% | 1775 2% | 522 -70% | 1723 -1% | 1489 -14% | 1741 ? 0% |
| Write 4K Q8T8 (MB/s) | 1208 | 309 | 715 ? | ||||
| Read 4K Q8T8 (MB/s) | 983 | 247.1 | 1027 ? | ||||
| AS SSD | -43% | 6% | -68% | -29% | -51% | -13% | |
| Seq Read (MB/s) | 1438 | 1224 -15% | 1225 -15% | 492.9 -66% | 1389 -3% | 1201 -16% | 1363 ? -5% |
| Seq Write (MB/s) | 1352 | 1118 -17% | 1386 3% | 462.2 -66% | 795 -41% | 434.5 -68% | 1227 ? -9% |
| 4K Read (MB/s) | 47.35 | 42.46 -10% | 56.4 19% | 26.89 -43% | 37.3 -21% | 40.9 -14% | 40.8 ? -14% |
| 4K Write (MB/s) | 167.9 | 77.4 -54% | 137.6 -18% | 85.1 -49% | 130.8 -22% | 90 -46% | 127.3 ? -24% |
| 4K-64 Read (MB/s) | 1051 | 559 -47% | 1190 13% | 234.2 -78% | 653 -38% | 425.5 -60% | 957 ? -9% |
| 4K-64 Write (MB/s) | 1211 | 378.1 -69% | 1377 14% | 312.8 -74% | 605 -50% | 390.9 -68% | 1081 ? -11% |
| Access Time Read * (ms) | 0.081 | 0.046 | 0.114 | 0.184 | 0.07744 ? | ||
| Access Time Write * (ms) | 0.03 | 0.049 -63% | 0.026 13% | 0.056 -87% | 0.028 7% | 0.048 -60% | 0.03671 ? -22% |
| Score Read (Points) | 1242 | 724 -42% | 1369 10% | 310 -75% | 829 -33% | 586 -53% | 1134 ? -9% |
| Score Write (Points) | 1514 | 567 -63% | 1653 9% | 444 -71% | 815 -46% | 524 -65% | 1331 ? -12% |
| Score Total (Points) | 3397 | 1669 -51% | 3743 10% | 922 -73% | 2048 -40% | 1386 -59% | 3046 ? -10% |
| Copy ISO MB/s (MB/s) | 812 | 1837 | 923 | 601 | 310.1 | 1169 ? | |
| Copy Program MB/s (MB/s) | 209.4 | 473.6 | 453.6 | 246.8 | 88.4 | 446 ? | |
| Copy Game MB/s (MB/s) | 356.1 | 1216 | 523 | 549 | 166.4 | 874 ? | |
| Totalt genomsnitt (program/inställningar) | -32% /
-33% | 0% /
1% | -65% /
-65% | -25% /
-25% | -46% /
-47% | -11% /
-11% |
* ... mindre är bättre

| 3DMark | |
| 1280x720 Cloud Gate Standard Graphics | |
| Genomsnitt av klass Subnotebook (5577 - 61591, n=28, senaste 2 åren) | |
| Huawei MateBook 14 KLV-W29 | |
| HP Pavilion 15-cs2019ng | |
| Acer Aspire 5 A515-52G-723L | |
| Genomsnitt NVIDIA GeForce MX250 (13805 - 23863, n=25) | |
| Acer Swift 3 SF314-55G-768V | |
| Acer TravelMate X3410-M-50DD | |
| Asus Zenbook 14 UX433FA-A6018T | |
| Lenovo ThinkPad A485-20MU000CGE | |
| Acer Swift 3 SF314-55-31N8 | |
| 1920x1080 Fire Strike Graphics | |
| Genomsnitt av klass Subnotebook (832 - 16347, n=56, senaste 2 åren) | |
| HP Pavilion 15-cs2019ng | |
| Huawei MateBook 14 KLV-W29 | |
| Acer Aspire 5 A515-52G-723L | |
| Genomsnitt NVIDIA GeForce MX250 (2939 - 3885, n=29) | |
| Acer Swift 3 SF314-55G-768V | |
| Acer TravelMate X3410-M-50DD | |
| Lenovo ThinkPad A485-20MU000CGE | |
| Asus Zenbook 14 UX433FA-A6018T | |
| Acer Swift 3 SF314-55-31N8 | |
| 2560x1440 Time Spy Graphics | |
| Genomsnitt av klass Subnotebook (804 - 6288, n=55, senaste 2 åren) | |
| Huawei MateBook 14 KLV-W29 | |
| Acer Aspire 5 A515-52G-723L | |
| Genomsnitt NVIDIA GeForce MX250 (881 - 1169, n=22) | |
| 3DMark 11 Performance | 3942 poäng | |
| 3DMark Cloud Gate Standard Score | 14136 poäng | |
| 3DMark Fire Strike Score | 2762 poäng | |
Hjälp | ||
| BioShock Infinite | |
| 1366x768 High Preset | |
| Acer Aspire 5 A515-52G-723L | |
| Genomsnitt NVIDIA GeForce MX250 (84 - 100.5, n=14) | |
| HP Pavilion 15-cs2019ng | |
| Acer Swift 3 SF314-55G-768V | |
| Acer TravelMate X3410-M-50DD | |
| Asus Zenbook 14 UX433FA-A6018T | |
| Acer Swift 3 SF314-55-31N8 | |
| 1366x768 Medium Preset | |
| HP Pavilion 15-cs2019ng | |
| Genomsnitt NVIDIA GeForce MX250 (98.4 - 117.5, n=14) | |
| Acer Aspire 5 A515-52G-723L | |
| Acer Swift 3 SF314-55G-768V | |
| Acer TravelMate X3410-M-50DD | |
| Asus Zenbook 14 UX433FA-A6018T | |
| Acer Swift 3 SF314-55-31N8 | |
| 1280x720 Very Low Preset | |
| HP Pavilion 15-cs2019ng | |
| Genomsnitt NVIDIA GeForce MX250 (133.9 - 212, n=14) | |
| Acer Aspire 5 A515-52G-723L | |
| Acer Swift 3 SF314-55G-768V | |
| Acer TravelMate X3410-M-50DD | |
| Asus Zenbook 14 UX433FA-A6018T | |
| Acer Swift 3 SF314-55-31N8 | |
| Dota 2 Reborn | |
| 1280x720 min (0/3) fastest | |
| Acer Swift 3 SF314-55G-768V | |
| Genomsnitt av klass Subnotebook (33.7 - 183.5, n=61, senaste 2 åren) | |
| Genomsnitt NVIDIA GeForce MX250 (71 - 131, n=21) | |
| Acer Aspire 5 A515-52G-723L | |
| 1366x768 med (1/3) | |
| Acer Swift 3 SF314-55G-768V | |
| Genomsnitt av klass Subnotebook (25 - 149.1, n=61, senaste 2 åren) | |
| Genomsnitt NVIDIA GeForce MX250 (21.8 - 109, n=21) | |
| Acer Aspire 5 A515-52G-723L | |
| 1920x1080 high (2/3) | |
| Genomsnitt av klass Subnotebook (14.8 - 101.2, n=61, senaste 2 åren) | |
| Acer Aspire 5 A515-52G-723L | |
| Genomsnitt NVIDIA GeForce MX250 (8.6 - 77.4, n=21) | |
| Acer Swift 3 SF314-55G-768V | |
| 1920x1080 ultra (3/3) best looking | |
| Genomsnitt av klass Subnotebook (13 - 97, n=61, senaste 2 åren) | |
| Acer Swift 3 SF314-55G-768V | |
| Genomsnitt NVIDIA GeForce MX250 (7.8 - 67.5, n=21) | |
| Acer Aspire 5 A515-52G-723L | |
| låg | med. | hög | ultra | |
|---|---|---|---|---|
| BioShock Infinite (2013) | 175.5 | 98.4 | 84 | 32.27 |
| The Witcher 3 (2015) | 58 | 33 | 18 | |
| Dota 2 Reborn (2015) | 118 | 98.7 | 60.7 | 54.7 |
Ljudnivå
| Låg belastning |
| 31.5 / 31.5 / 31.5 dB(A) |
| Hög belastning |
| 33.4 / 33.6 dB(A) |
 | ||
30 dB tyst 40 dB(A) hörbar 50 dB(A) högt ljud |
||
min: | ||
(-) Den maximala temperaturen på ovansidan är 48.6 °C / 119 F, jämfört med genomsnittet av 35.9 °C / 97 F , allt från 21.4 till 59 °C för klassen Subnotebook.
(-) Botten värms upp till maximalt 49.2 °C / 121 F, jämfört med genomsnittet av 39.2 °C / 103 F
(+) Vid tomgångsbruk är medeltemperaturen för ovansidan 26.5 °C / 80 F, jämfört med enhetsgenomsnittet på 30.8 °C / ### class_avg_f### F.
(+) Handledsstöden och pekplattan är kallare än hudtemperaturen med maximalt 30.9 °C / 87.6 F och är därför svala att ta på.
(-) Medeltemperaturen för handledsstödsområdet på liknande enheter var 28.2 °C / 82.8 F (-2.7 °C / -4.8 F).
Acer Swift 3 SF314-55G-768V ljudanalys
(±) | högtalarljudstyrkan är genomsnittlig men bra (72.1 dB)
Bas 100 - 315 Hz
(-) | nästan ingen bas - i genomsnitt 24.1% lägre än medianen
(±) | linjäriteten för basen är genomsnittlig (9.6% delta till föregående frekvens)
Mellan 400 - 2000 Hz
(+) | balanserad mellan - endast 4.6% från medianen
(±) | linjäriteten för mids är genomsnittlig (9.1% delta till föregående frekvens)
Högsta 2 - 16 kHz
(+) | balanserade toppar - endast 2.5% från medianen
(+) | toppar är linjära (3.9% delta till föregående frekvens)
Totalt 100 - 16 000 Hz
(±) | linjäriteten för det totala ljudet är genomsnittlig (22.4% skillnad mot median)
Jämfört med samma klass
» 76% av alla testade enheter i den här klassen var bättre, 5% liknande, 19% sämre
» Den bästa hade ett delta på 5%, genomsnittet var 18%, sämst var 53%
Jämfört med alla testade enheter
» 65% av alla testade enheter var bättre, 6% liknande, 29% sämre
» Den bästa hade ett delta på 4%, genomsnittet var 24%, sämst var 134%
Apple MacBook 12 (Early 2016) 1.1 GHz ljudanalys
(+) | högtalare kan spela relativt högt (83.6 dB)
Bas 100 - 315 Hz
(±) | reducerad bas - i genomsnitt 11.3% lägre än medianen
(±) | linjäriteten för basen är genomsnittlig (14.2% delta till föregående frekvens)
Mellan 400 - 2000 Hz
(+) | balanserad mellan - endast 2.4% från medianen
(+) | mids är linjära (5.5% delta till föregående frekvens)
Högsta 2 - 16 kHz
(+) | balanserade toppar - endast 2% från medianen
(+) | toppar är linjära (4.5% delta till föregående frekvens)
Totalt 100 - 16 000 Hz
(+) | det totala ljudet är linjärt (10.2% skillnad mot median)
Jämfört med samma klass
» 7% av alla testade enheter i den här klassen var bättre, 2% liknande, 91% sämre
» Den bästa hade ett delta på 5%, genomsnittet var 18%, sämst var 53%
Jämfört med alla testade enheter
» 5% av alla testade enheter var bättre, 1% liknande, 94% sämre
» Den bästa hade ett delta på 4%, genomsnittet var 24%, sämst var 134%
| Av/Standby | |
| Låg belastning | |
| Hög belastning |
|
Förklaring:
min: | |
| Acer Swift 3 SF314-55G-768V i7-8565U, GeForce MX250, WDC PC SN520 SDAPNUW-512G, IPS, 1920x1080, 14" | Lenovo ThinkPad A485-20MU000CGE R5 PRO 2500U, Vega 8, Samsung SSD PM981 MZVLB256HAHQ, IPS LED, 1920x1080, 14" | Huawei MateBook 14 KLV-W29 i7-8565U, GeForce MX250, Samsung SSD PM981 MZVLB512HAJQ, IPS, 2160x1440, 14" | Acer TravelMate X3410-M-50DD i5-8550U, GeForce MX130, Micron 1100 MTFDDAV256TBN, IPS LED, 1920x1080, 14" | Asus Zenbook 14 UX433FA-A6018T i5-8265U, UHD Graphics 620, WDC PC SN520 SDAPNUW-256G, IPS, 1920x1080, 14" | Acer Swift 3 SF314-55-31N8 i3-8145U, UHD Graphics 620, Kingston RBUSNS8154P3128GJ, IPS, 1920x1080, 14" | Genomsnitt NVIDIA GeForce MX250 | Genomsnitt av klass Subnotebook | |
|---|---|---|---|---|---|---|---|---|
| Power Consumption | 2% | -16% | -5% | 26% | 37% | -12% | 9% | |
| Idle Minimum * (Watt) | 7.4 | 5.3 28% | 3.7 50% | 4.6 38% | 2.7 64% | 2.9 61% | 4.1 ? 45% | 3.82 ? 48% |
| Idle Average * (Watt) | 9.9 | 8.3 16% | 9.3 6% | 6.5 34% | 5.8 41% | 5.6 43% | 7.91 ? 20% | 6.61 ? 33% |
| Idle Maximum * (Watt) | 11.7 | 11.4 3% | 12.8 -9% | 8.5 27% | 10.2 13% | 6.1 48% | 10.4 ? 11% | 7.99 ? 32% |
| Load Average * (Watt) | 29 | 42 -45% | 58.8 -103% | 56 -93% | 34.9 -20% | 29 -0% | 58.6 ? -102% | 41.9 ? -44% |
| Load Maximum * (Watt) | 52 | 48.8 6% | 65 -25% | 67 -29% | 35 33% | 35.3 32% | 68.9 ? -33% | 64.1 ? -23% |
| Witcher 3 ultra * (Watt) | 55.8 |
* ... mindre är bättre
| Acer Swift 3 SF314-55G-768V i7-8565U, GeForce MX250, 50.7 Wh | Lenovo ThinkPad A485-20MU000CGE R5 PRO 2500U, Vega 8, 48 Wh | Huawei MateBook 14 KLV-W29 i7-8565U, GeForce MX250, 57.4 Wh | Acer TravelMate X3410-M-50DD i5-8550U, GeForce MX130, 57 Wh | Asus Zenbook 14 UX433FA-A6018T i5-8265U, UHD Graphics 620, 50 Wh | Acer Swift 3 SF314-55-31N8 i3-8145U, UHD Graphics 620, 50.7 Wh | Genomsnitt av klass Subnotebook | |
|---|---|---|---|---|---|---|---|
| Batteridrifttid | -32% | 19% | 24% | 16% | 26% | 55% | |
| Reader / Idle (h) | 16.1 | 11.2 -30% | 23.9 48% | 17.4 8% | 28.6 ? 78% | ||
| WiFi v1.3 (h) | 8.1 | 5.5 -32% | 8.4 4% | 10.9 35% | 9.4 16% | 10.2 26% | 14 ? 73% |
| Load (h) | 1.7 | 1.1 -35% | 1.8 6% | 2.2 29% | 1.946 ? 14% | ||
| H.264 (h) | 6.1 | 11.6 | 15.6 ? |
För
Emot
Omdöme - Mer prestanda i utbyte mot kortare batteritid
Läs den fullständiga versionen av den här recensionen på engelska här.
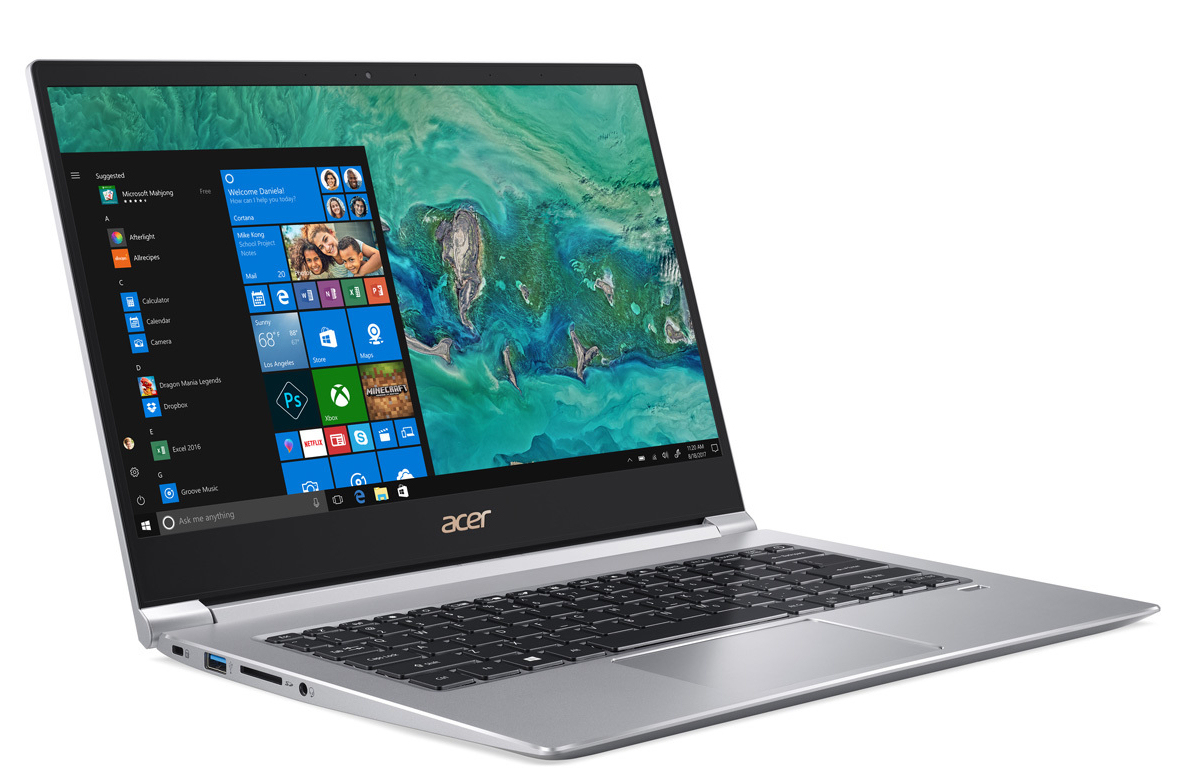
Acer Swift 3 visade i vårt test upp bra prestanda för både krävande kontorsapplikationer och för en del spel på låga grafikinställningar. Även om prestandan från i7-8565U-processorn sjunker en aning efter en kort stund kan den upprätthålla en nivå som ligger en bit över en Core i7-8550U eller en Ryzen 5 PRO 2500U. Den har dessutom bra batteritid på runt åtta timmar, vilket i kombination med kompakta dimensioner gör Swift 3 till en bra mobil kollega.
Med kraftigare hårdvara levererar Acer Swift 3 också bättre prestanda. Men priset man får betala är kortare batteritid och högre energiförbrukning.
När det kommer till skärmen tar Acer ett steg tillbaka jämfört med vårt test av Swift 3 i Januari 2019. Även om ljusstyrkan är lite högre så används PWM på en betydligt lägre frekvens. Även om det dedikerade grafikkortet Nvidia GeForce MX250 levererar bättre grafikprestanda åtföljs detta av högre energiförbrukning och kortare batteritid. För den som kan leva med kortare batteritid i utbyte mot ökad prestanda är Swift 3 värd en titt.
Acer Swift 3 SF314-55G-768V
- 05/27/2019 v6 (old)
Mike Wobker
Price comparison
