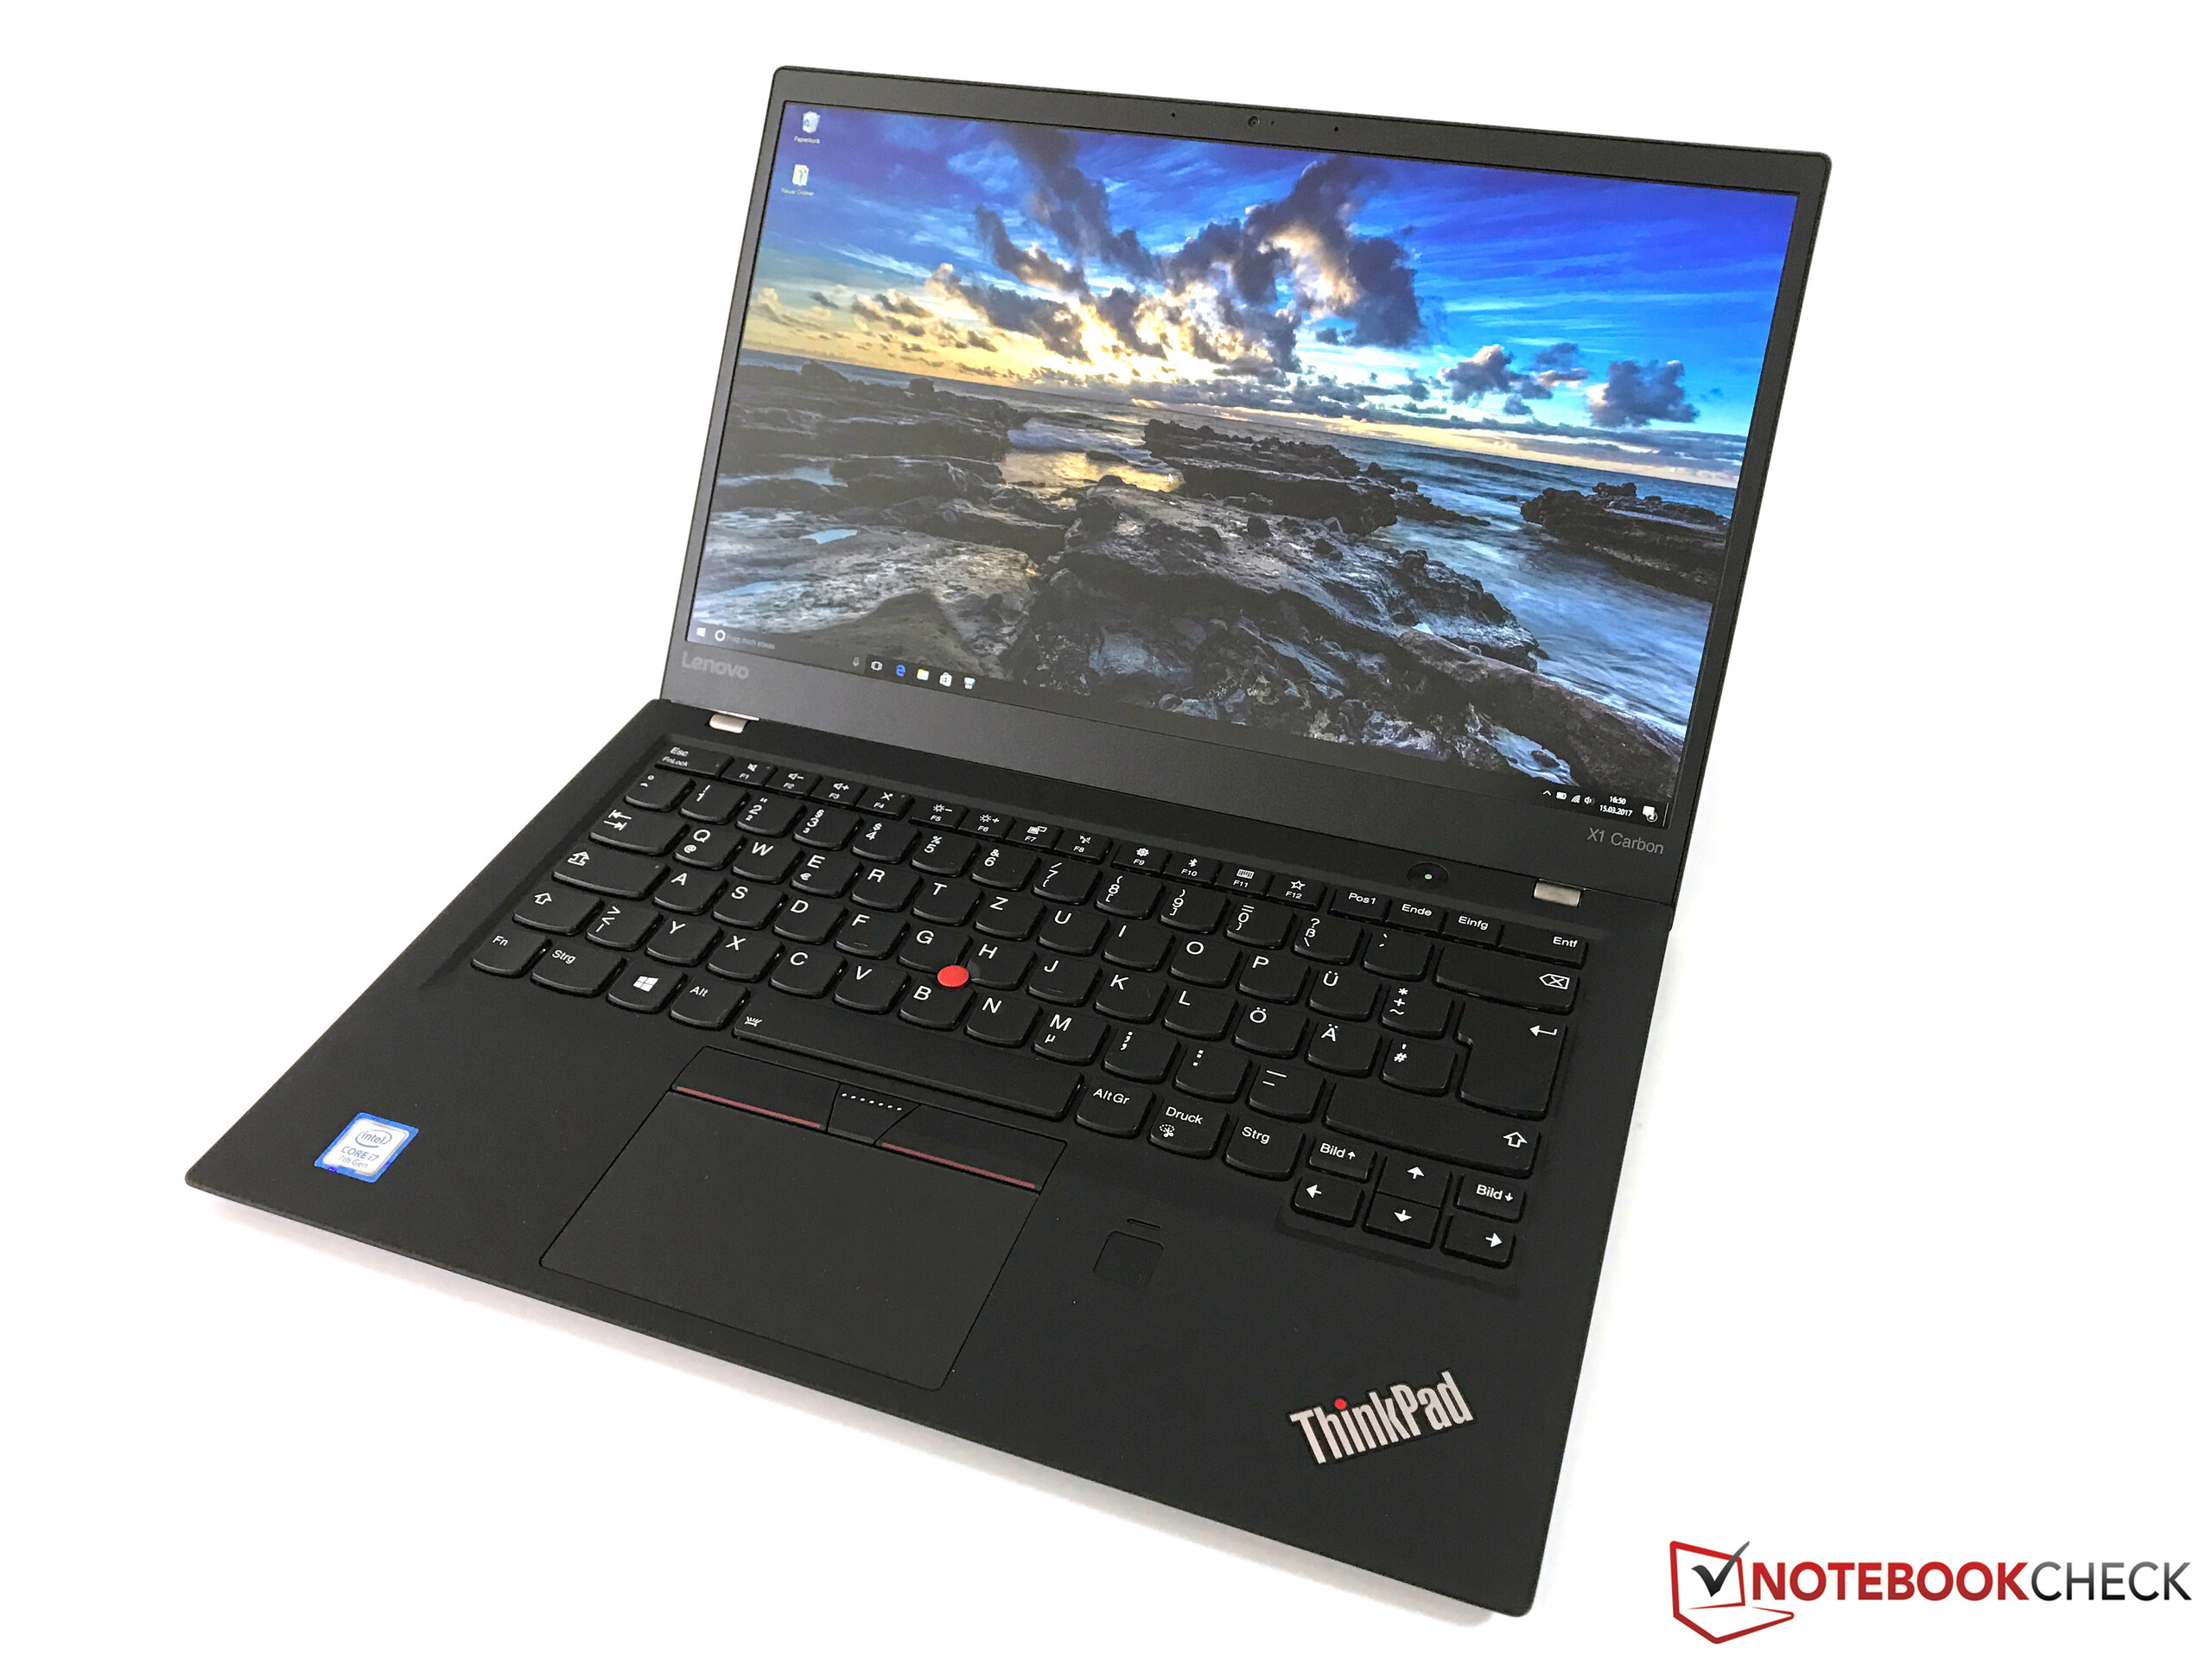
Test: Lenovo ThinkPad X1 Carbon 2017 (Core i7, Full-HD) (sammanfattning)
| SD Card Reader | |
| average JPG Copy Test (av. of 3 runs) | |
| Dell XPS 15 9560 (i7-7700HQ, UHD) | |
| Lenovo ThinkPad T470s-20HGS00V00 | |
| Lenovo ThinkPad T470-20HD002HGE | |
| Fujitsu LifeBook U747 | |
| Lenovo ThinkPad X1 Carbon 2017-20HQS03P00 | |
| maximum AS SSD Seq Read Test (1GB) | |
| Dell XPS 15 9560 (i7-7700HQ, UHD) | |
| Lenovo ThinkPad T470s-20HGS00V00 | |
| Lenovo ThinkPad T470-20HD002HGE | |
| Fujitsu LifeBook U747 | |
| Lenovo ThinkPad X1 Carbon 2017-20HQS03P00 | |
| Networking | |
| iperf3 transmit AX12 | |
| Apple MacBook Pro 15 2016 (2.6 GHz, 450) (Klaus I211) | |
| Lenovo ThinkPad X1 Carbon 2017-20HQS03P00 | |
| Lenovo ThinkPad T470-20HD002HGE | |
| Fujitsu LifeBook U747 | |
| Lenovo ThinkPad T470s-20HGS00V00 | |
| iperf3 receive AX12 | |
| Apple MacBook Pro 15 2016 (2.6 GHz, 450) (Klaus I211) | |
| Lenovo ThinkPad T470-20HD002HGE | |
| Fujitsu LifeBook U747 | |
| Lenovo ThinkPad X1 Carbon 2017-20HQS03P00 | |
| Lenovo ThinkPad T470s-20HGS00V00 | |
Skärmflimmer / PWM (Puls-Width Modulation)
| Skärmflimmer / PWM upptäcktes inte |  | ||
Som jämförelse: 52 % av alla testade enheter använder inte PWM för att dämpa skärmen. Om PWM upptäcktes mättes ett medelvärde av 7753 (minst: 5 - maximum: 343500) Hz. | |||
| |||||||||||||||||||||||||
Distribution av ljusstyrkan: 85 %
Mitt på batteriet: 308 cd/m²
Kontrast: 1296:1 (Svärta: 0.24 cd/m²)
ΔE ColorChecker Calman: 5.5 | ∀{0.5-29.43 Ø4.72}
ΔE Greyscale Calman: 6.2 | ∀{0.09-98 Ø4.97}
85.77% sRGB (Argyll 1.6.3 3D)
55.96% AdobeRGB 1998 (Argyll 1.6.3 3D)
62.4% AdobeRGB 1998 (Argyll 3D)
85.9% sRGB (Argyll 3D)
61.4% Display P3 (Argyll 3D)
Gamma: 2.02
CCT: 5950 K
| Lenovo ThinkPad X1 Carbon 2017-20HQS03P00 B140HAN03_1, , 1920x1080 | Lenovo ThinkPad X1 Carbon 20FB-005XUS 1920x1080 | Lenovo ThinkPad X1 Carbon 20FB003RGE VVX14T058J00, , 2560x1440 | Lenovo ThinkPad T470s-20HGS00V00 B140QAN01.5, , 2560x1440 | Lenovo ThinkPad T470-20HD002HGE N140HCA-EAB, , 1920x1080 | HP EliteBook Folio 1040 G3 AUO1136, , 2560x1440 | Fujitsu LifeBook U747 LG LP140WF3, , 1920x1080 | |
|---|---|---|---|---|---|---|---|
| Display | -3% | 10% | 12% | -30% | 12% | 2% | |
| Display P3 Coverage (%) | 61.4 | 58.9 -4% | 66.7 9% | 69 12% | 41.6 -32% | 67.9 11% | 66.1 8% |
| sRGB Coverage (%) | 85.9 | 83.1 -3% | 94.7 10% | 95.1 11% | 61.9 -28% | 96.8 13% | 84.8 -1% |
| AdobeRGB 1998 Coverage (%) | 62.4 | 60.3 -3% | 68.4 10% | 69.6 12% | 43.06 -31% | 70 12% | 62 -1% |
| Response Times | 0% | 9% | -2% | -4% | 2% | 20% | |
| Response Time Grey 50% / Grey 80% * (ms) | 41.6 ? | 47.2 ? -13% | 44 ? -6% | 46.4 ? -12% | 41.6 ? -0% | 46.4 ? -12% | 36 ? 13% |
| Response Time Black / White * (ms) | 31.6 ? | 27.6 ? 13% | 24 ? 24% | 28.8 ? 9% | 34 ? -8% | 26.4 ? 16% | 23.2 ? 27% |
| PWM Frequency (Hz) | 220 ? | ||||||
| Screen | 7% | 8% | -5% | -16% | 3% | 0% | |
| Brightness middle (cd/m²) | 311 | 321.7 3% | 272 -13% | 327 5% | 306 -2% | 327 5% | 291 -6% |
| Brightness (cd/m²) | 288 | 301 5% | 268 -7% | 311 8% | 287 0% | 316 10% | 296 3% |
| Brightness Distribution (%) | 85 | 89 5% | 95 12% | 88 4% | 88 4% | 87 2% | 84 -1% |
| Black Level * (cd/m²) | 0.24 | 0.294 -22% | 0.32 -33% | 0.25 -4% | 0.3 -25% | 0.35 -46% | 0.32 -33% |
| Contrast (:1) | 1296 | 1094 -16% | 850 -34% | 1308 1% | 1020 -21% | 934 -28% | 909 -30% |
| Colorchecker dE 2000 * | 5.5 | 3.96 28% | 2.61 53% | 6.1 -11% | 6.2 -13% | 4.39 20% | 4.3 22% |
| Colorchecker dE 2000 max. * | 9 | 6.69 26% | 6.43 29% | 12.2 -36% | 13.6 -51% | 7.27 19% | 7.5 17% |
| Greyscale dE 2000 * | 6.2 | 3.15 49% | 3.31 47% | 8.8 -42% | 5.8 6% | 4.69 24% | 4.3 31% |
| Gamma | 2.02 109% | 2.34 94% | 2.35 94% | 2.18 101% | 2.04 108% | 2.15 102% | 2.31 95% |
| CCT | 5950 109% | 7082 92% | 6360 102% | 6172 105% | 6277 104% | 7101 92% | 6529 100% |
| Color Space (Percent of AdobeRGB 1998) (%) | 55.96 | 53.8 -4% | 63 13% | 61.56 10% | 39.62 -29% | 62.52 12% | 55.46 -1% |
| Color Space (Percent of sRGB) (%) | 85.77 | 82.7 -4% | 95 11% | 94.88 11% | 61.44 -28% | 96.71 13% | 84.77 -1% |
| Totalt genomsnitt (program/inställningar) | 1% /
4% | 9% /
8% | 2% /
-1% | -17% /
-17% | 6% /
5% | 7% /
3% |
* ... mindre är bättre
Visa svarstider
| ↔ Svarstid svart till vitt | ||
|---|---|---|
| 31.6 ms ... stiga ↗ och falla ↘ kombinerat | ↗ 18.8 ms stiga | 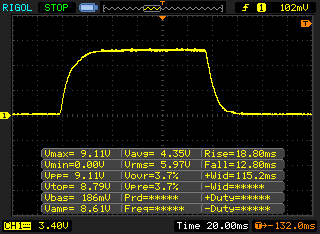 |
| ↘ 12.8 ms hösten | ||
| Skärmen visar långsamma svarsfrekvenser i våra tester och kommer att vara otillfredsställande för spelare. I jämförelse sträcker sig alla testade enheter från 0.1 (minst) till 240 (maximalt) ms. » 85 % av alla enheter är bättre. Detta innebär att den uppmätta svarstiden är sämre än genomsnittet av alla testade enheter (19.8 ms). | ||
| ↔ Svarstid 50 % grått till 80 % grått | ||
| 41.6 ms ... stiga ↗ och falla ↘ kombinerat | ↗ 20.4 ms stiga | 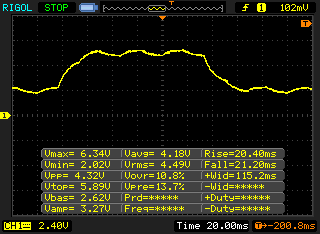 |
| ↘ 21.2 ms hösten | ||
| Skärmen visar långsamma svarsfrekvenser i våra tester och kommer att vara otillfredsställande för spelare. I jämförelse sträcker sig alla testade enheter från 0.165 (minst) till 636 (maximalt) ms. » 67 % av alla enheter är bättre. Detta innebär att den uppmätta svarstiden är sämre än genomsnittet av alla testade enheter (31 ms). | ||


| Cinebench R15 | |
| CPU Single 64Bit | |
| Lenovo ThinkPad T470s-20HGS00V00 | |
| Lenovo ThinkPad X1 Carbon 2017-20HQS03P00 | |
| Fujitsu LifeBook U747 | |
| Lenovo ThinkPad X1 Carbon 20FB003RGE | |
| Lenovo ThinkPad T470-20HD002HGE | |
| HP EliteBook Folio 1040 G3 | |
| CPU Multi 64Bit | |
| Lenovo ThinkPad T470s-20HGS00V00 | |
| Lenovo ThinkPad X1 Carbon 2017-20HQS03P00 | |
| Fujitsu LifeBook U747 | |
| Lenovo ThinkPad T470-20HD002HGE | |
| Lenovo ThinkPad X1 Carbon 20FB003RGE | |
| HP EliteBook Folio 1040 G3 | |
| PCMark 8 | |
| Home Score Accelerated v2 | |
| Lenovo ThinkPad X1 Carbon 2017-20HQS03P00 | |
| Lenovo ThinkPad T470s-20HGS00V00 | |
| Lenovo ThinkPad T470-20HD002HGE | |
| Fujitsu LifeBook U747 | |
| Lenovo ThinkPad X1 Carbon 20FB003RGE | |
| HP EliteBook Folio 1040 G3 | |
| Work Score Accelerated v2 | |
| Lenovo ThinkPad X1 Carbon 2017-20HQS03P00 | |
| Lenovo ThinkPad T470s-20HGS00V00 | |
| Lenovo ThinkPad T470-20HD002HGE | |
| Fujitsu LifeBook U747 | |
| Lenovo ThinkPad X1 Carbon 20FB003RGE | |
| HP EliteBook Folio 1040 G3 | |
| PCMark 8 Home Score Accelerated v2 | 4025 poäng | |
| PCMark 8 Creative Score Accelerated v2 | 4874 poäng | |
| PCMark 8 Work Score Accelerated v2 | 4978 poäng | |
Hjälp | ||
| Lenovo ThinkPad X1 Carbon 2017-20HQS03P00 Samsung PM961 NVMe MZVLW512HMJP | Lenovo ThinkPad T470s-20HGS00V00 Samsung SSD PM961 1TB M.2 PCIe 3.0 x4 NVMe (MZVLW1T0) | Lenovo ThinkPad X1 Carbon 20FB003RGE Samsung SSD PM871 MZNLN256HCHP | HP EliteBook Folio 1040 G3 Samsung SM951 MZVPV256HDGL m.2 PCI-e | Fujitsu LifeBook U747 Samsung MZYTY256HDHP | Lenovo ThinkPad T470-20HD002HGE Samsung PM961 NVMe MZVLW512HMJP | |
|---|---|---|---|---|---|---|
| CrystalDiskMark 3.0 | 2% | -59% | -0% | -54% | -18% | |
| Read Seq (MB/s) | 1827 | 1760 -4% | 439.3 -76% | 1649 -10% | 504 -72% | 1155 -37% |
| Write Seq (MB/s) | 1383 | 1666 20% | 308.1 -78% | 1265 -9% | 497.8 -64% | 1076 -22% |
| Read 512 (MB/s) | 814 | 832 2% | 299.5 -63% | 1252 54% | 396.7 -51% | 811 0% |
| Write 512 (MB/s) | 1098 | 1064 -3% | 304.2 -72% | 1244 13% | 283.4 -74% | 862 -21% |
| Read 4k (MB/s) | 61 | 53.2 -13% | 34.05 -44% | 53.3 -13% | 35.73 -41% | 55.5 -9% |
| Write 4k (MB/s) | 172.2 | 167.4 -3% | 86.5 -50% | 159.9 -7% | 87.8 -49% | 134.6 -22% |
| Read 4k QD32 (MB/s) | 601 | 630 5% | 339.6 -43% | 559 -7% | 399.1 -34% | 496.2 -17% |
| Write 4k QD32 (MB/s) | 495.6 | 533 8% | 279.2 -44% | 376.7 -24% | 249.7 -50% | 425.4 -14% |

| 3DMark 11 - 1280x720 Performance GPU | |
| Lenovo ThinkPad E470-20H2S00400 | |
| Lenovo ThinkPad T470s-20HGS00V00 | |
| Lenovo ThinkPad X1 Carbon 2017-20HQS03P00 | |
| Lenovo ThinkPad T470-20HD002HGE | |
| Fujitsu LifeBook U747 | |
| Lenovo ThinkPad X1 Carbon 20FB003RGE | |
| HP EliteBook Folio 1040 G3 | |
| 3DMark | |
| 1280x720 Cloud Gate Standard Graphics | |
| Lenovo ThinkPad T470s-20HGS00V00 | |
| Lenovo ThinkPad E470-20H2S00400 | |
| Lenovo ThinkPad X1 Carbon 2017-20HQS03P00 | |
| Lenovo ThinkPad X1 Carbon 20FB003RGE | |
| Lenovo ThinkPad T470-20HD002HGE | |
| Fujitsu LifeBook U747 | |
| HP EliteBook Folio 1040 G3 | |
| 1920x1080 Fire Strike Graphics | |
| Lenovo ThinkPad E470-20H2S00400 | |
| Lenovo ThinkPad T470s-20HGS00V00 | |
| Lenovo ThinkPad X1 Carbon 2017-20HQS03P00 | |
| Lenovo ThinkPad X1 Carbon 20FB003RGE | |
| HP EliteBook Folio 1040 G3 | |
| Lenovo ThinkPad T470-20HD002HGE | |
| Fujitsu LifeBook U747 | |
| 3DMark 11 Performance | 1815 poäng | |
| 3DMark Ice Storm Standard Score | 69541 poäng | |
| 3DMark Cloud Gate Standard Score | 6738 poäng | |
| 3DMark Fire Strike Score | 1001 poäng | |
Hjälp | ||
| låg | med. | hög | ultra | |
|---|---|---|---|---|
| Tomb Raider (2013) | 93.5 | 45.2 | 27.6 | 12.8 |
| BioShock Infinite (2013) | 59.2 | 31.4 | 26.6 | 8.6 |
| Battlefield 4 (2013) | 43.5 | 30.1 | 20.1 | 6.4 |
| The Witcher 3 (2015) | 15.2 | |||
| Rise of the Tomb Raider (2016) | 20.2 | 11.8 |
Ljudnivå
| Låg belastning |
| 29.3 / 29.3 / 32.2 dB(A) |
| Hög belastning |
| 34.3 / 39.3 dB(A) |
 | ||
30 dB tyst 40 dB(A) hörbar 50 dB(A) högt ljud |
||
min: | ||
| Lenovo ThinkPad X1 Carbon 2017-20HQS03P00 i7-7500U, HD Graphics 620 | Lenovo ThinkPad T470s-20HGS00V00 i7-7600U, HD Graphics 620 | Lenovo ThinkPad X1 Carbon 20FB003RGE 6500U, HD Graphics 520 | HP EliteBook Folio 1040 G3 6300U, HD Graphics 520 | Fujitsu LifeBook U747 i5-7200U, HD Graphics 620 | Lenovo ThinkPad T470-20HD002HGE i5-7200U, HD Graphics 620 | |
|---|---|---|---|---|---|---|
| Noise | -1% | 2% | 4% | 8% | 7% | |
| av / miljö * (dB) | 29.3 | 28.9 1% | 29.1 1% | 29.1 1% | 28.2 4% | 28 4% |
| Idle Minimum * (dB) | 29.3 | 28.9 1% | 29.1 1% | 29.1 1% | 28.2 4% | 28 4% |
| Idle Average * (dB) | 29.3 | 28.9 1% | 29.1 1% | 29.1 1% | 28.2 4% | 28 4% |
| Idle Maximum * (dB) | 32.2 | 30.1 7% | 29.1 10% | 29.1 10% | 28.2 12% | 29.4 9% |
| Load Average * (dB) | 34.3 | 39.2 -14% | 35.6 -4% | 32.6 5% | 31.2 9% | 31.4 8% |
| Load Maximum * (dB) | 39.3 | 39.2 -0% | 38.1 3% | 37.8 4% | 33 16% | 34.6 12% |
* ... mindre är bättre
(-) Den maximala temperaturen på ovansidan är 48 °C / 118 F, jämfört med genomsnittet av 34.3 °C / 94 F , allt från 21.2 till 62.5 °C för klassen Office.
(-) Botten värms upp till maximalt 47.2 °C / 117 F, jämfört med genomsnittet av 36.8 °C / 98 F
(+) Vid tomgångsbruk är medeltemperaturen för ovansidan 22.2 °C / 72 F, jämfört med enhetsgenomsnittet på 29.5 °C / ### class_avg_f### F.
(+) Handledsstöden och pekplattan är kallare än hudtemperaturen med maximalt 31.6 °C / 88.9 F och är därför svala att ta på.
(-) Medeltemperaturen för handledsstödsområdet på liknande enheter var 27.5 °C / 81.5 F (-4.1 °C / -7.4 F).
Lenovo ThinkPad X1 Carbon 2017-20HQS03P00 ljudanalys
(±) | högtalarljudstyrkan är genomsnittlig men bra (78.2 dB)
Bas 100 - 315 Hz
(-) | nästan ingen bas - i genomsnitt 16.5% lägre än medianen
(±) | linjäriteten för basen är genomsnittlig (8.7% delta till föregående frekvens)
Mellan 400 - 2000 Hz
(+) | balanserad mellan - endast 2.9% från medianen
(+) | mids är linjära (5% delta till föregående frekvens)
Högsta 2 - 16 kHz
(+) | balanserade toppar - endast 3.8% från medianen
(+) | toppar är linjära (6% delta till föregående frekvens)
Totalt 100 - 16 000 Hz
(±) | linjäriteten för det totala ljudet är genomsnittlig (16.3% skillnad mot median)
Jämfört med samma klass
» 19% av alla testade enheter i den här klassen var bättre, 7% liknande, 74% sämre
» Den bästa hade ett delta på 7%, genomsnittet var 21%, sämst var 53%
Jämfört med alla testade enheter
» 27% av alla testade enheter var bättre, 6% liknande, 68% sämre
» Den bästa hade ett delta på 4%, genomsnittet var 23%, sämst var 134%
HP EliteBook Folio 1040 G3 ljudanalys
(±) | högtalarljudstyrkan är genomsnittlig men bra (81.2 dB)
Bas 100 - 315 Hz
(-) | nästan ingen bas - i genomsnitt 25% lägre än medianen
(±) | linjäriteten för basen är genomsnittlig (13.4% delta till föregående frekvens)
Mellan 400 - 2000 Hz
(+) | balanserad mellan - endast 2.3% från medianen
(±) | linjäriteten för mids är genomsnittlig (7.1% delta till föregående frekvens)
Högsta 2 - 16 kHz
(+) | balanserade toppar - endast 1.8% från medianen
(+) | toppar är linjära (2.3% delta till föregående frekvens)
Totalt 100 - 16 000 Hz
(±) | linjäriteten för det totala ljudet är genomsnittlig (17.9% skillnad mot median)
Jämfört med samma klass
» 29% av alla testade enheter i den här klassen var bättre, 8% liknande, 63% sämre
» Den bästa hade ett delta på 7%, genomsnittet var 21%, sämst var 53%
Jämfört med alla testade enheter
» 37% av alla testade enheter var bättre, 8% liknande, 55% sämre
» Den bästa hade ett delta på 4%, genomsnittet var 23%, sämst var 134%
| Av/Standby | |
| Låg belastning | |
| Hög belastning |
|
Förklaring:
min: | |
| Lenovo ThinkPad X1 Carbon 2017-20HQS03P00 i7-7500U, HD Graphics 620, 1920x1080 | Lenovo ThinkPad T470s-20HGS00V00 i7-7600U, HD Graphics 620, 2560x1440 | Lenovo ThinkPad X1 Carbon 20FB003RGE 6500U, HD Graphics 520, 2560x1440 | HP EliteBook Folio 1040 G3 6300U, HD Graphics 520, 2560x1440 | Fujitsu LifeBook U747 i5-7200U, HD Graphics 620, 1920x1080 | Lenovo ThinkPad T470-20HD002HGE i5-7200U, HD Graphics 620, 1920x1080 | |
|---|---|---|---|---|---|---|
| Power Consumption | -13% | 7% | -22% | 5% | 20% | |
| Idle Minimum * (Watt) | 3.84 | 4.64 -21% | 3.8 1% | 6.3 -64% | 4.11 -7% | 3.21 16% |
| Idle Average * (Watt) | 6.3 | 8.93 -42% | 7.1 -13% | 9.4 -49% | 7.87 -25% | 6.15 2% |
| Idle Maximum * (Watt) | 8.6 | 9.12 -6% | 7.7 10% | 10.1 -17% | 8.74 -2% | 6.82 21% |
| Load Average * (Watt) | 41.9 | 42.2 -1% | 30.2 28% | 33.3 21% | 30.2 28% | 28.5 32% |
| Load Maximum * (Watt) | 48.7 | 47.3 3% | 44.7 8% | 49.5 -2% | 32.4 33% | 34.5 29% |
* ... mindre är bättre
| Lenovo ThinkPad X1 Carbon 2017-20HQS03P00 i7-7500U, HD Graphics 620, 57 Wh, 1920x1080 | Lenovo ThinkPad X1 Carbon 20FB003RGE 6500U, HD Graphics 520, 52 Wh, 2560x1440 | Lenovo ThinkPad T470s-20HGS00V00 i7-7600U, HD Graphics 620, 51 Wh, 2560x1440 | Lenovo ThinkPad T470-20HD002HGE i5-7200U, HD Graphics 620, 48 Wh, 1920x1080 | Fujitsu LifeBook U747 i5-7200U, HD Graphics 620, 50 Wh, 1920x1080 | HP EliteBook Folio 1040 G3 6300U, HD Graphics 520, 45.6 Wh, 2560x1440 | Lenovo ThinkPad X1 Carbon 20FB-005XUS 6300U, HD Graphics 520, 52 Wh, 1920x1080 | |
|---|---|---|---|---|---|---|---|
| Batteridrifttid | -12% | -21% | -8% | -11% | -22% | 0% | |
| H.264 (h) | 11.9 | 8.5 -29% | 7.6 -36% | 10.4 -13% | 8.2 -31% | 5.7 -52% | |
| WiFi v1.3 (h) | 8.3 | 7.2 -13% | 7 -16% | 7.3 -12% | 7.2 -13% | 5.2 -37% | 6.9 -17% |
| Load (h) | 1.8 | 1.9 6% | 1.6 -11% | 1.8 0% | 2 11% | 2.2 22% | 2.1 17% |
För
Emot
Lenovo ThinkPad X1 Carbon 2017-20HQS03P00
- 03/24/2017 v6 (old)
Andreas Osthoff
Price comparison
