Notebookcheck Logo

Test: Dell Latitude 13 7370 Ultrabook (sammanfattning)

The sound of silence. Latitude 13 7370 är en Dells nytolkning av en klassisk kontorsdator, med ramlös InfinityEdge-skärm, Core M-processorer och passiv kylning. Konceptet är lovande, men resultatet är inte perfekt.
Dell Latitude 13 7370 (Latitude Serie)
Processor
Intel Core m5-6Y57 2 x 1.1 - 2.8 GHz, Skylake
Grafikkort
Intel HD Graphics 515, Kärna: 900 MHz, Minne: 933 MHz, 20.19.15.4390
Minne
8 GB 
, Dual-Channel LPDDR3-1866, fastlött, inga lediga platser
Skärm
13.30 tum 16:9, 1920 x 1080 pixlar 166 PPI, Sharp LQ133M1, IPS, glansig: nej
Moderkort
Intel Skylake-Y Premium PCH
Hårddisk
Toshiba NVMe THNSN5256GPU7, 256 GB 
Ljudkort
Intel Skylake-U/Y PCH - High Definition Audio
Anslutningar
1 USB 3.0, 2 USB 3.1 Gen2, 2 Thunderbolt, 1 HDMI, 2 DisplayPort, 1 Kensingtonlås, Ljudanslutningar: Headset, Kortläsare: microSD, 1 SmartCard, 1 Fingeravtrycksläsare, NFC
Nätverk
Intel Dual Band Wireless-AC 8260 (a/b/g/n = Wi-Fi 4/ac = Wi-Fi 5/), Bluetooth 4.2
Storlek
höjd x bredd x djup (i mm) 14.3 x 305 x 211
Batteri
34 Wh Litiumpolymer, 4 celler
Operativsystem
Microsoft Windows 10 Pro 64 Bit
Camera
Webbkamera: HD
Övrigt
Högtalare: Stereo, Tangentbord: Chiclet, Tangentbordsbelysning: ja, Adapter, 45 Watt, 36 Månader Garanti, fanless
Vikt
1.247 kg, Strömförsörjning: 271 g
Pris
2200 Euro
Note: The manufacturer may use components from different suppliers including display panels, drives or memory sticks with similar specifications.


337 mm 234.5 mm 15.8 mm 1.4 kg333 mm 229 mm 16.5 mm 1.2 kg316 mm 227 mm 17.9 mm 1.2 kg306 mm 209 mm 20.3 mm 1.5 kg305 mm 211 mm 14.3 mm 1.2 kg280.5 mm 196.5 mm 13.1 mm 927 g297 mm 210 mm 1 mm 5.7 g
2x Thunderbolt 3, Micro-HDMI, SIM-Slot, SmartCard reader
microSD reader, headset port, USB 3.0, Kensington Lock

Screen Flickering / PWM (Pulse-Width Modulation)

To dim the screen, some notebooks will simply cycle the backlight on and off in rapid succession - a method called Pulse Width Modulation (PWM) . This cycling frequency should ideally be undetectable to the human eye. If said frequency is too low, users with sensitive eyes may experience strain or headaches or even notice the flickering altogether.
Screen flickering / PWM not detected

In comparison: 53 % of all tested devices do not use PWM to dim the display. If PWM was detected, an average of 17924 (minimum: 5 - maximum: 3846000) Hz was measured.

241
cd/m²
234
cd/m²
240
cd/m²
247
cd/m²
261
cd/m²
253
cd/m²
223
cd/m²
236
cd/m²
230
cd/m²
Distribution av ljusstyrkan
Sharp LQ133M1 tested with X-Rite i1Pro 2
Max: 261 cd/m² (Nits) Medel: 240.6 cd/m² Minimum: 13 cd/m²
Distribution av ljusstyrkan: 85 %
Mitt på batteriet: 261 cd/m²
Kontrast: 1004:1 (Svärta: 0.26 cd/m²)
ΔE Color 4.3 | 0.5-29.43 Ø5
ΔE Greyscale 5.82 | 0.57-98 Ø5.3
77.84% sRGB (Argyll 1.6.3 3D)
49.18% AdobeRGB 1998 (Argyll 1.6.3 3D)
53.9% AdobeRGB 1998 (Argyll 2.2.0 3D)
78.3% sRGB (Argyll 2.2.0 3D)
52.2% Display P3 (Argyll 2.2.0 3D)
Gamma: 2.44
Dell Latitude 13 7370
1920x1080, IPS
Lenovo ThinkPad X1 Carbon 20FB003RGE
2560x1440, IPS
HP EliteBook Folio 1040 G3
2560x1440, IPS
Toshiba Portege Z30-C-138
1920x1080, IPS
Apple MacBook 12 (Early 2016) 1.1 GHz
2304x1440, IPS
Display
25%
28%
28%
25%
Display P3 Coverage
52.2
66.7
28%
67.9
30%
67.9
30%
66.8
28%
sRGB Coverage
78.3
94.7
21%
96.8
24%
98
25%
95.4
22%
AdobeRGB 1998 Coverage
53.9
68.4
27%
70
30%
69.8
29%
68
26%
Response Times
21%
15%
17%
14%
Response Time Grey 50% / Grey 80% *
50.4 ?(20.4, 30)
44 ?(17, 27)
13%
46.4 ?(16.4, 30)
8%
42 ?(18, 24)
17%
41.2 ?(15.6, 25.6)
18%
Response Time Black / White *
33.6 ?(13.2, 20.4)
24 ?(5.2, 18.8)
29%
26.4 ?(6.8, 19.6)
21%
28 ?(7, 21)
17%
30.4 ?(6.8, 23.6)
10%
PWM Frequency
220 ?(90)
217 ?(40)
Screen
15%
10%
3%
23%
Brightness middle
261
272
4%
327
25%
300
15%
387
48%
Brightness
241
268
11%
316
31%
280
16%
358
49%
Brightness Distribution
85
95
12%
87
2%
87
2%
88
4%
Black Level *
0.26
0.32
-23%
0.35
-35%
0.31
-19%
0.47
-81%
Contrast
1004
850
-15%
934
-7%
968
-4%
823
-18%
Colorchecker dE 2000 *
4.3
2.61
39%
4.39
-2%
4.9
-14%
1.6
63%
Colorchecker dE 2000 max. *
8.66
6.43
26%
7.27
16%
8.91
-3%
4
54%
Greyscale dE 2000 *
5.82
3.31
43%
4.69
19%
6.69
-15%
1
83%
Gamma
2.44 90%
2.35 94%
2.15 102%
2.33 94%
2.26 97%
CCT
6771 96%
6360 102%
7101 92%
6487 100%
6680 97%
Color Space (Percent of AdobeRGB 1998)
49.18
63
28%
62.52
27%
63
28%
61.6
25%
Color Space (Percent of sRGB)
77.84
95
22%
96.71
24%
98
26%
82.2
6%
Total Average (Program / Settings)
20% / 18%
18% / 14%
16% / 10%
21% / 22%

* ... smaller is better

Display Response Times

Display response times show how fast the screen is able to change from one color to the next. Slow response times can lead to afterimages and can cause moving objects to appear blurry (ghosting). Gamers of fast-paced 3D titles should pay special attention to fast response times.
       Response Time Black to White
33.6 ms ... rise ↗ and fall ↘ combined↗ 13.2 ms rise
↘ 20.4 ms fall
The screen shows slow response rates in our tests and will be unsatisfactory for gamers.
In comparison, all tested devices range from 0.1 (minimum) to 240 (maximum) ms. » 89 % of all devices are better.
This means that the measured response time is worse than the average of all tested devices (21.5 ms).
       Response Time 50% Grey to 80% Grey
50.4 ms ... rise ↗ and fall ↘ combined↗ 20.4 ms rise
↘ 30 ms fall
The screen shows slow response rates in our tests and will be unsatisfactory for gamers.
In comparison, all tested devices range from 0.2 (minimum) to 636 (maximum) ms. » 85 % of all devices are better.
This means that the measured response time is worse than the average of all tested devices (33.7 ms).
Cinebench R15
CPU Single 64Bit
Lenovo ThinkPad X1 Carbon 20FB003RGE
Intel Core i7-6500U
128 Points +27%
HP EliteBook Folio 1040 G3
Intel Core i5-6300U
124 Points +23%
Lenovo ThinkPad X260-20F60041GE
Intel Core i5-6200U
112 Points +11%
Dell Latitude 13 7370
Intel Core m5-6Y57
101 Points
Apple MacBook 12 (Early 2015) 1.1 GHz
Intel Core M-5Y31
98 Points -3%
Apple MacBook 12 (Early 2015) 1.1 GHz
Intel Core M-5Y31
98 Points -3%
Apple MacBook 12 (Early 2016) 1.1 GHz
Intel Core m3-6Y30
91 Points -10%
Apple MacBook 12 (Early 2016) 1.1 GHz
Intel Core m3-6Y30
90 Points -11%
Microsoft Surface Pro 4, Core m3
Intel Core m3-6Y30
88 Points -13%
Toshiba Portege Z30-C-138
Intel Core i7-6500U
84 Points -17%
CPU Multi 64Bit
Lenovo ThinkPad X1 Carbon 20FB003RGE
Intel Core i7-6500U
310 Points +72%
HP EliteBook Folio 1040 G3
Intel Core i5-6300U
303 Points +68%
Lenovo ThinkPad X260-20F60041GE
Intel Core i5-6200U
289 Points +61%
Toshiba Portege Z30-C-138
Intel Core i7-6500U
288 Points +60%
Apple MacBook 12 (Early 2016) 1.1 GHz
Intel Core m3-6Y30
218 Points +21%
Apple MacBook 12 (Early 2015) 1.1 GHz
Intel Core M-5Y31
211 Points +17%
Apple MacBook 12 (Early 2015) 1.1 GHz
Intel Core M-5Y31
205 Points +14%
Microsoft Surface Pro 4, Core m3
Intel Core m3-6Y30
206 Points +14%
Dell Latitude 13 7370
Intel Core m5-6Y57
180 Points
Cinebench R11.5
CPU Single 64Bit
Lenovo ThinkPad X1 Carbon 20FB003RGE
Intel Core i7-6500U
1.47 Points +27%
Lenovo ThinkPad X260-20F60041GE
Intel Core i5-6200U
1.32 Points +14%
Dell Latitude 13 7370
Intel Core m5-6Y57
1.16 Points
Apple MacBook 12 (Early 2015) 1.1 GHz
Intel Core M-5Y31
1.15 Points -1%
Apple MacBook 12 (Early 2015) 1.1 GHz
Intel Core M-5Y31
1.02 Points -12%
Apple MacBook 12 (Early 2016) 1.1 GHz
Intel Core m3-6Y30
1 Points -14%
Apple MacBook 12 (Early 2016) 1.1 GHz
Intel Core m3-6Y30
0.95 Points -18%
Microsoft Surface Pro 4, Core m3
Intel Core m3-6Y30
0.98 Points -16%
CPU Multi 64Bit
Lenovo ThinkPad X1 Carbon 20FB003RGE
Intel Core i7-6500U
3.46 Points +70%
Lenovo ThinkPad X260-20F60041GE
Intel Core i5-6200U
3.19 Points +57%
Apple MacBook 12 (Early 2016) 1.1 GHz
Intel Core m3-6Y30
2.35 Points +16%
Apple MacBook 12 (Early 2016) 1.1 GHz
Intel Core m3-6Y30
2.29 Points +13%
Apple MacBook 12 (Early 2015) 1.1 GHz
Intel Core M-5Y31
2.3 Points +13%
Apple MacBook 12 (Early 2015) 1.1 GHz
Intel Core M-5Y31
2.09 Points +3%
Microsoft Surface Pro 4, Core m3
Intel Core m3-6Y30
2.27 Points +12%
Dell Latitude 13 7370
Intel Core m5-6Y57
2.03 Points
X264 HD Benchmark 4.0
Pass 1
Lenovo ThinkPad X1 Carbon 20FB003RGE
Intel Core i7-6500U
108.6 fps +17%
Dell Latitude 13 7370
Intel Core m5-6Y57
92.6 fps
Microsoft Surface Pro 4, Core m3
Intel Core m3-6Y30
76.8 fps -17%
Apple MacBook 12 (Early 2015) 1.1 GHz
Intel Core M-5Y31
72 fps -22%
Apple MacBook 12 (Early 2016) 1.1 GHz
Intel Core m3-6Y30
69 (61.3min - 76.8max) fps -25%
Pass 2
Lenovo ThinkPad X1 Carbon 20FB003RGE
Intel Core i7-6500U
20.31 fps +73%
Microsoft Surface Pro 4, Core m3
Intel Core m3-6Y30
14.15 fps +21%
Apple MacBook 12 (Early 2016) 1.1 GHz
Intel Core m3-6Y30
13 (11.7min - 14.2max) fps +11%
Dell Latitude 13 7370
Intel Core m5-6Y57
11.72 fps
Apple MacBook 12 (Early 2015) 1.1 GHz
Intel Core M-5Y31
9.52 fps -19%
Cinebench R10 Shading 32Bit
5591
Cinebench R10 Rendering Multiple CPUs 32Bit
6652
Cinebench R10 Rendering Single 32Bit
3889
Cinebench R11.5 CPU Multi 64Bit
2.03 Points
Cinebench R11.5 OpenGL 64Bit
22.14 fps
Cinebench R11.5 CPU Single 64Bit
1.16 Points
Cinebench R15 CPU Multi 64Bit
180 Points
Cinebench R15 CPU Single 64Bit
101 Points
Cinebench R15 Ref. Match 64Bit
97.8 %
Cinebench R15 OpenGL 64Bit
26.81 fps
Hjälp
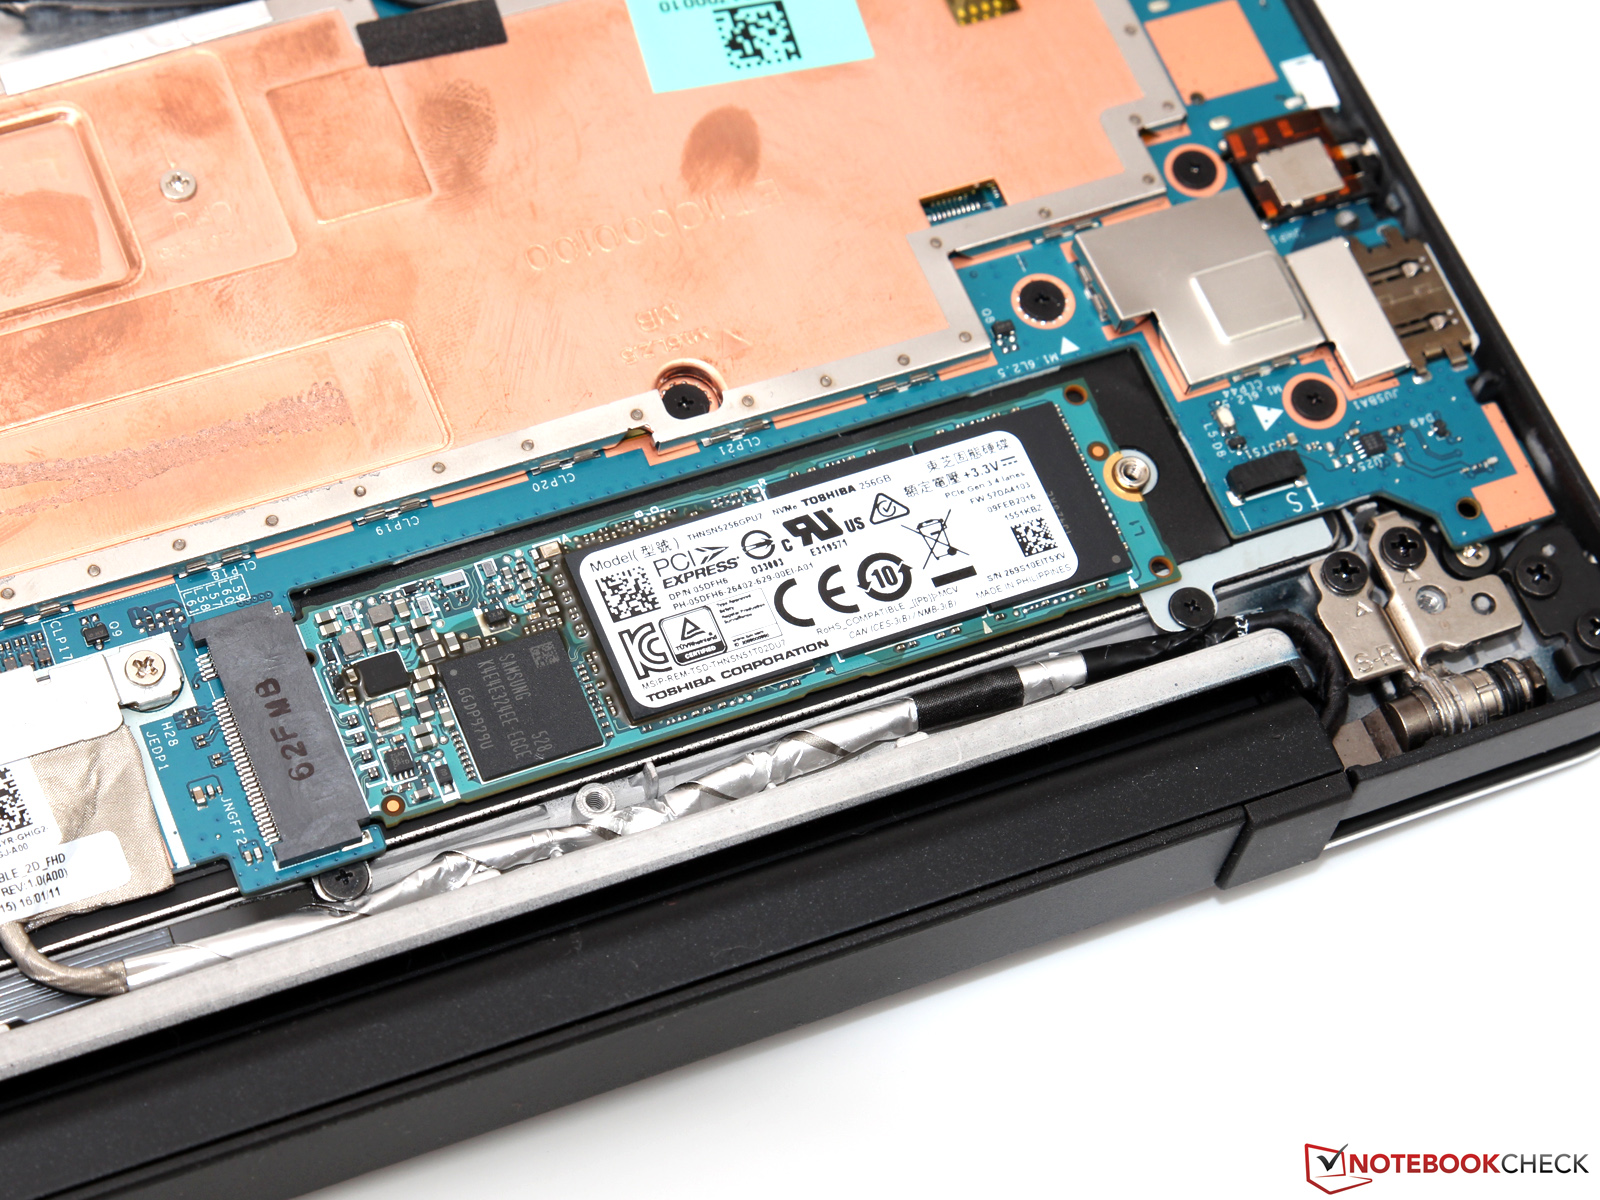
Dell Latitude 13 7370
Toshiba NVMe THNSN5256GPU7
Lenovo ThinkPad X1 Carbon 20FB003RGE
Samsung SSD PM871 MZNLN256HCHP
HP EliteBook Folio 1040 G3
Samsung SM951 MZVPV256HDGL m.2 PCI-e
Toshiba Portege Z30-C-138
Toshiba HG6 THNSNJ512G8NY
Apple MacBook 12 (Early 2016) 1.1 GHz
Apple SSD AP0256
AS SSD
-40%
75%
-52%
-30%
Seq Read
1425
499.1
-65%
1839
29%
494.9
-65%
1056
-26%
Seq Write
889
294
-67%
1190
34%
431.9
-51%
651
-27%
4K Read
35.72
30.43
-15%
47.72
34%
16.97
-52%
16.4
-54%
4K Write
97.9
74.6
-24%
126.6
29%
65.6
-33%
22.1
-77%
4K-64 Read
450.6
370.4
-18%
1858
312%
217.9
-52%
509
13%
4K-64 Write
347.2
253.4
-27%
344.3
-1%
147.9
-57%
283
-18%
Copy ISO MB/s
704
236.2
-66%
1313
87%
545
-23%
Toshiba NVMe THNSN5256GPU7
Överföringshastighet min.: 386.9 MB/s
Överföringshastighet max.: 879 MB/s
Överföringshastighet med.: 754 MB/s
Accesstid: 0.1 ms
Burst rate: 275.2 MB/s
CPU-användning: 4.8 %
PCMark 8
Home Score Accelerated v2
Lenovo ThinkPad X1 Carbon 20FB003RGE
HD Graphics 520, 6500U, Samsung SSD PM871 MZNLN256HCHP
3385 Points +11%
HP EliteBook Folio 1040 G3
HD Graphics 520, 6300U, Samsung SM951 MZVPV256HDGL m.2 PCI-e
3305 Points +8%
Toshiba Portege Z30-C-138
HD Graphics 520, 6500U, Toshiba HG6 THNSNJ512G8NY
3271 Points +7%
Dell Latitude 13 7370
HD Graphics 515, 6Y57, Toshiba NVMe THNSN5256GPU7
3048 Points
Apple MacBook 12 (Early 2015) 1.1 GHz
HD Graphics 5300, 5Y31, Apple SSD AP0256
2671 Points -12%
Apple MacBook 12 (Early 2016) 1.1 GHz
HD Graphics 515, 6Y30, Apple SSD AP0256
2550 Points -16%
Microsoft Surface Pro 4, Core m3
HD Graphics 515, 6Y30, Samsung MZFLV128 NVMe
2426 Points -20%
Creative Score Accelerated v2
Lenovo ThinkPad X1 Carbon 20FB003RGE
HD Graphics 520, 6500U, Samsung SSD PM871 MZNLN256HCHP
4150 Points +18%
HP EliteBook Folio 1040 G3
HD Graphics 520, 6300U, Samsung SM951 MZVPV256HDGL m.2 PCI-e
4058 Points +15%
Dell Latitude 13 7370
HD Graphics 515, 6Y57, Toshiba NVMe THNSN5256GPU7
3528 Points
Apple MacBook 12 (Early 2015) 1.1 GHz
HD Graphics 5300, 5Y31, Apple SSD AP0256
3276 Points -7%
Microsoft Surface Pro 4, Core m3
HD Graphics 515, 6Y30, Samsung MZFLV128 NVMe
2968 Points -16%
Work Score Accelerated v2
Lenovo ThinkPad X1 Carbon 20FB003RGE
HD Graphics 520, 6500U, Samsung SSD PM871 MZNLN256HCHP
4342 Points +2%
HP EliteBook Folio 1040 G3
HD Graphics 520, 6300U, Samsung SM951 MZVPV256HDGL m.2 PCI-e
4241 Points 0%
Dell Latitude 13 7370
HD Graphics 515, 6Y57, Toshiba NVMe THNSN5256GPU7
4238 Points
Apple MacBook 12 (Early 2016) 1.1 GHz
HD Graphics 515, 6Y30, Apple SSD AP0256
3550 Points -16%
Apple MacBook 12 (Early 2015) 1.1 GHz
HD Graphics 5300, 5Y31, Apple SSD AP0256
3488 Points -18%
Microsoft Surface Pro 4, Core m3
HD Graphics 515, 6Y30, Samsung MZFLV128 NVMe
3186 Points -25%
PCMark 7 - Score
Lenovo ThinkPad X1 Carbon 20FB003RGE
HD Graphics 520, 6500U, Samsung SSD PM871 MZNLN256HCHP
5350 Points +28%
Microsoft Surface Pro 4, Core m3
HD Graphics 515, 6Y30, Samsung MZFLV128 NVMe
4274 Points +3%
Dell Latitude 13 7370
HD Graphics 515, 6Y57, Toshiba NVMe THNSN5256GPU7
4165 Points
PCMark 7 Score
4165 poäng
PCMark 8 Home Score Accelerated v2
3048 poäng
PCMark 8 Creative Score Accelerated v2
3528 poäng
PCMark 8 Work Score Accelerated v2
4238 poäng
Hjälp
3DMark 11 - 1280x720 Performance GPU
Lenovo ThinkPad X1 Carbon 20FB003RGE
Intel Core i7-6500U, Intel HD Graphics 520
1386 Points +40%
HP EliteBook Folio 1040 G3
Intel Core i5-6300U, Intel HD Graphics 520
1377 Points +39%
Toshiba Portege Z30-C-138
Intel Core i7-6500U, Intel HD Graphics 520
1377 Points +39%
Microsoft Surface Pro 4, Core m3
Intel Core m3-6Y30, Intel HD Graphics 515
1206 Points +22%
Apple MacBook 12 (Early 2016) 1.1 GHz
Intel Core m3-6Y30, Intel HD Graphics 515
1186 Points +20%
Dell Latitude 13 7370
Intel Core m5-6Y57, Intel HD Graphics 515
992 Points
Apple MacBook 12 (Early 2015) 1.1 GHz
Intel Core M-5Y31, Intel HD Graphics 5300
859 Points -13%
3DMark
1280x720 Cloud Gate Standard Graphics
Lenovo ThinkPad X1 Carbon 20FB003RGE
Intel Core i7-6500U, Intel HD Graphics 520
7516 Points +61%
HP EliteBook Folio 1040 G3
Intel Core i5-6300U, Intel HD Graphics 520
6708 Points +44%
Microsoft Surface Pro 4, Core m3
Intel Core m3-6Y30, Intel HD Graphics 515
6597 Points +42%
Apple MacBook 12 (Early 2016) 1.1 GHz
Intel Core m3-6Y30, Intel HD Graphics 515
6078 Points +30%
Apple MacBook 12 (Early 2015) 1.1 GHz
Intel Core M-5Y31, Intel HD Graphics 5300
5512 Points +18%
Dell Latitude 13 7370
Intel Core m5-6Y57, Intel HD Graphics 515
4658 Points
1920x1080 Fire Strike Graphics
Lenovo ThinkPad X1 Carbon 20FB003RGE
Intel Core i7-6500U, Intel HD Graphics 520
959 Points +70%
HP EliteBook Folio 1040 G3
Intel Core i5-6300U, Intel HD Graphics 520
900 Points +59%
Microsoft Surface Pro 4, Core m3
Intel Core m3-6Y30, Intel HD Graphics 515
810 Points +43%
Apple MacBook 12 (Early 2016) 1.1 GHz
Intel Core m3-6Y30, Intel HD Graphics 515
735 Points +30%
Apple MacBook 12 (Early 2015) 1.1 GHz
Intel Core M-5Y31, Intel HD Graphics 5300
671 Points +19%
Dell Latitude 13 7370
Intel Core m5-6Y57, Intel HD Graphics 515
565 Points
3DMark 06 Standard Score
6244 poäng
3DMark 11 Performance
1094 poäng
3DMark Ice Storm Standard Score
38931 poäng
3DMark Cloud Gate Standard Score
3481 poäng
3DMark Fire Strike Score
509 poäng
Hjälp
låg med. hög ultra
BioShock Infinite (2013) 38 20.3 17.6 5.3
Metro: Last Light (2013) 16.4 13.5 8.7
Battlefield 4 (2013) 24.6 18.2 12.8
Låg belastning
 29 °C30.5 °C29.6 °C 
 27.8 °C30 °C28.6 °C 
 26.4 °C26.3 °C26.5 °C 
Max: 30.5 °C
Medel: 28.3 °C
29.3 °C30.1 °C28.3 °C
30.5 °C31.2 °C29.6 °C
27.1 °C26.9 °C26.1 °C
Max: 31.2 °C
Medel: 28.8 °C
Strömförsörjning (max.)  30.5 °C | Rumstemperatur 21.4 °C | Fluke 62 Max
(±) The average temperature for the upper side under maximal load is 35.7 °C / 96 F, compared to the average of 30.7 °C / 87 F for the devices in the class Subnotebook.
(±) The maximum temperature on the upper side is 43.2 °C / 110 F, compared to the average of 35.9 °C / 97 F, ranging from 21.4 to 59 °C for the class Subnotebook.
(-) The bottom heats up to a maximum of 50.8 °C / 123 F, compared to the average of 39.4 °C / 103 F
(+) In idle usage, the average temperature for the upper side is 28.3 °C / 83 F, compared to the device average of 30.7 °C / 87 F.
(+) The palmrests and touchpad are cooler than skin temperature with a maximum of 29.8 °C / 85.6 F and are therefore cool to the touch.
(±) The average temperature of the palmrest area of similar devices was 28.3 °C / 82.9 F (-1.5 °C / -2.7 F).
Strömförbrukning
Av/Standbydarklight 0.35 / 0.5 Watt
Låg belastningdarkmidlight 5 / 7.5 / 8 Watt
Hög belastning midlight 15.3 / 26.8 Watt
 color bar
Förklaring: min: dark, med: mid, max: light        Metrahit Energy
Currently we use the Metrahit Energy, a professional single phase power quality and energy measurement digital multimeter, for our measurements. Find out more about it here. All of our test methods can be found here.
Dell Latitude 13 7370
34 Wh
Lenovo ThinkPad X1 Carbon 20FB003RGE
52 Wh
HP EliteBook Folio 1040 G3
45.6 Wh
Toshiba Portege Z30-C-138
52 Wh
Apple MacBook 12 (Early 2016) 1.1 GHz
41.4 Wh
Battery Runtime
18%
-16%
-6%
33%
Reader / Idle
588
942
60%
530
-10%
H.264
391
510
30%
339
-13%
512
31%
WiFi v1.3
367
429
17%
309
-16%
345
-6%
501
37%
Load
176
115
-35%
131
-26%
231
31%
Batteritid
Låg belastning (utan WLAN, min. ljusstyrka)
9tim 48min
WiFi Websurfing
6tim 07min
Big Buck Bunny H.264 1080p
6tim 31min
Hög belastning (maximal ljusstyrka)
2tim 56min

För

+ sofistikerat och robust chassi
+ framtidssäkra portar
+ snabb trådlös uppkoppling
+ exakta inmatningsenheter
+ låga temperaturer
+ fläktlös
+ 3 års garanti

Emot

- bara 1x USB Typ A
- automatisk styrning av ljusstyrka och kontrast
- begränsade uppgraderingsmöjligheter
- väldigt högt prism
Dell Latitude 13 7370, courtesy of Dell Germany

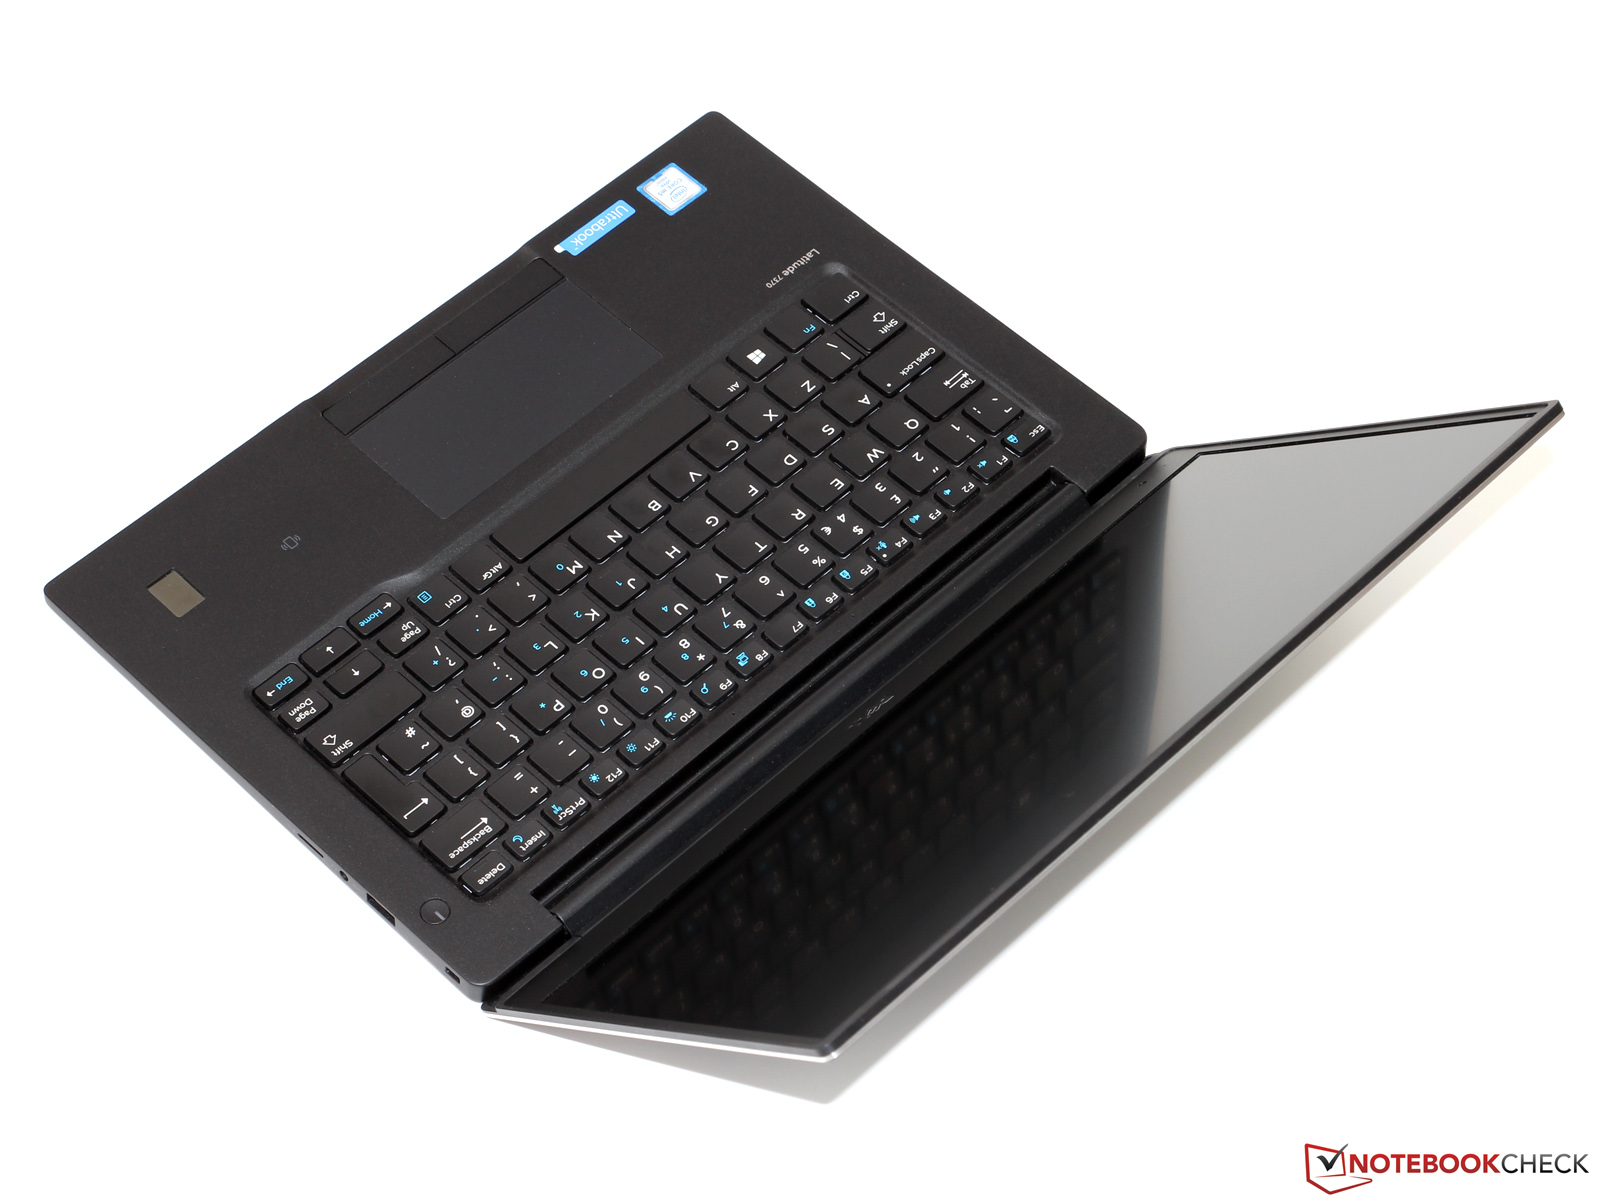
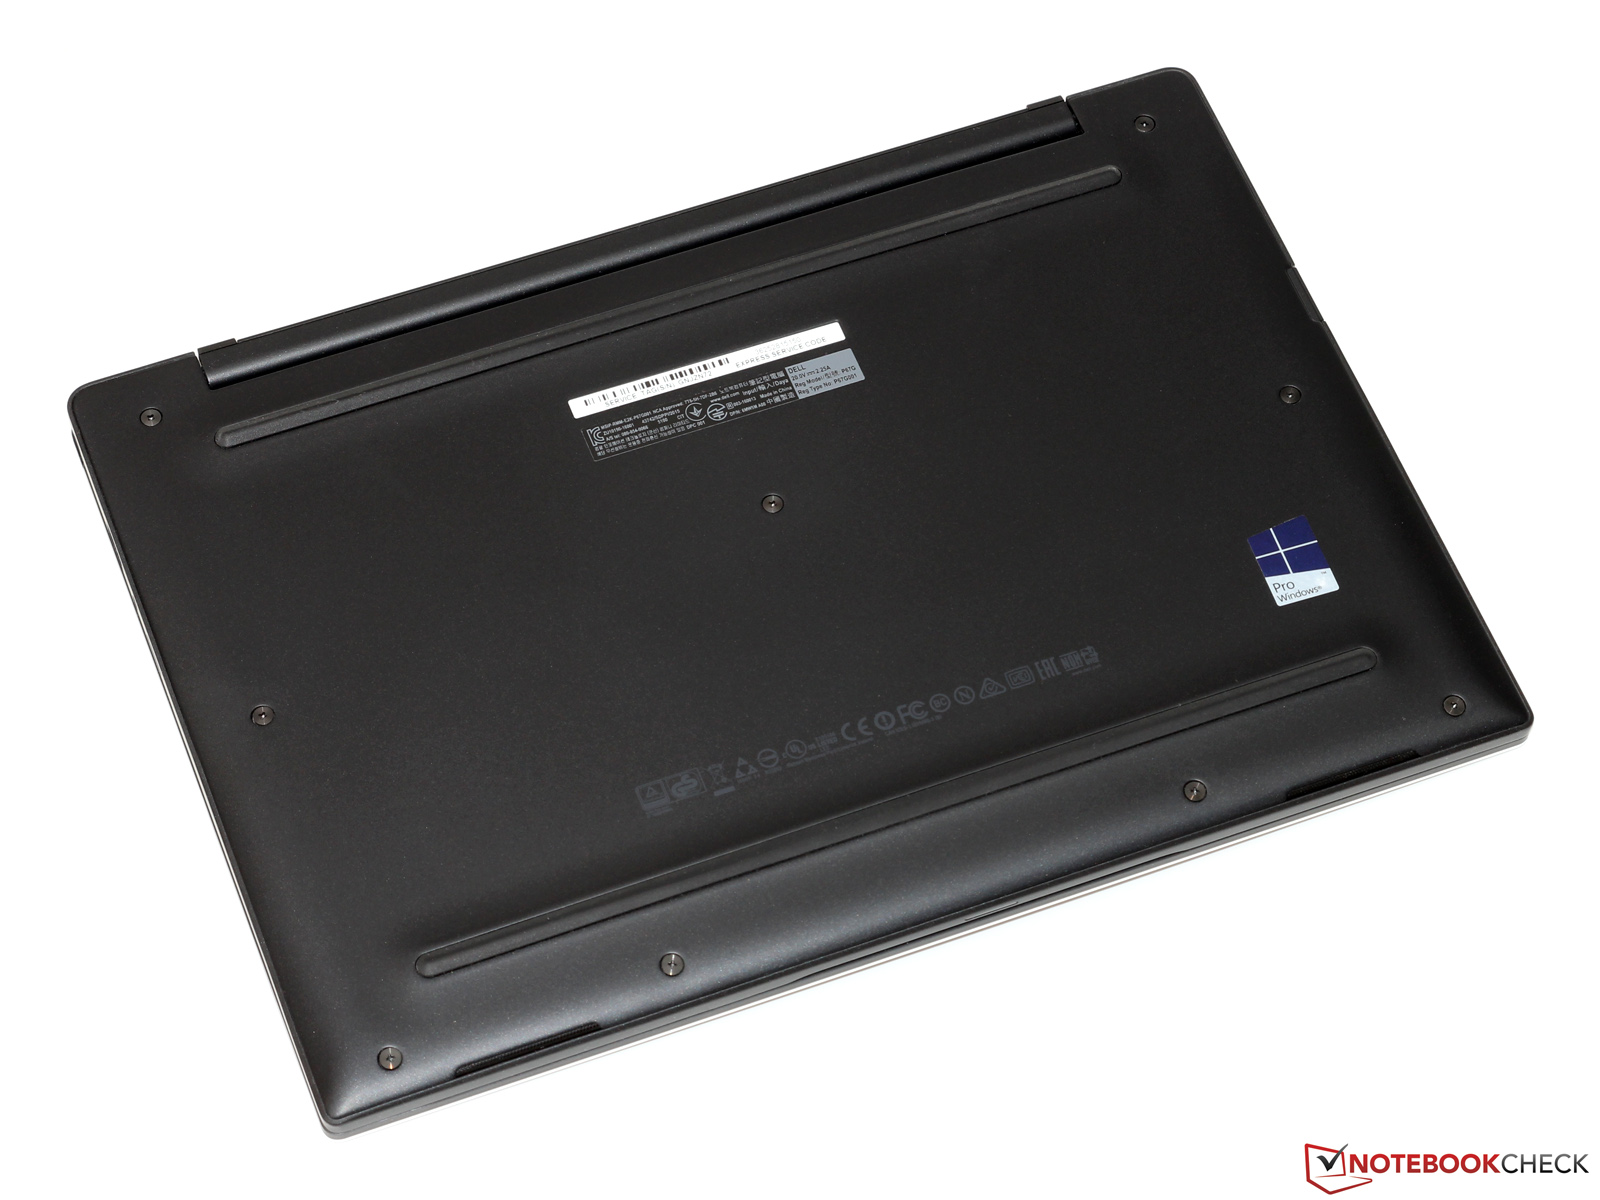
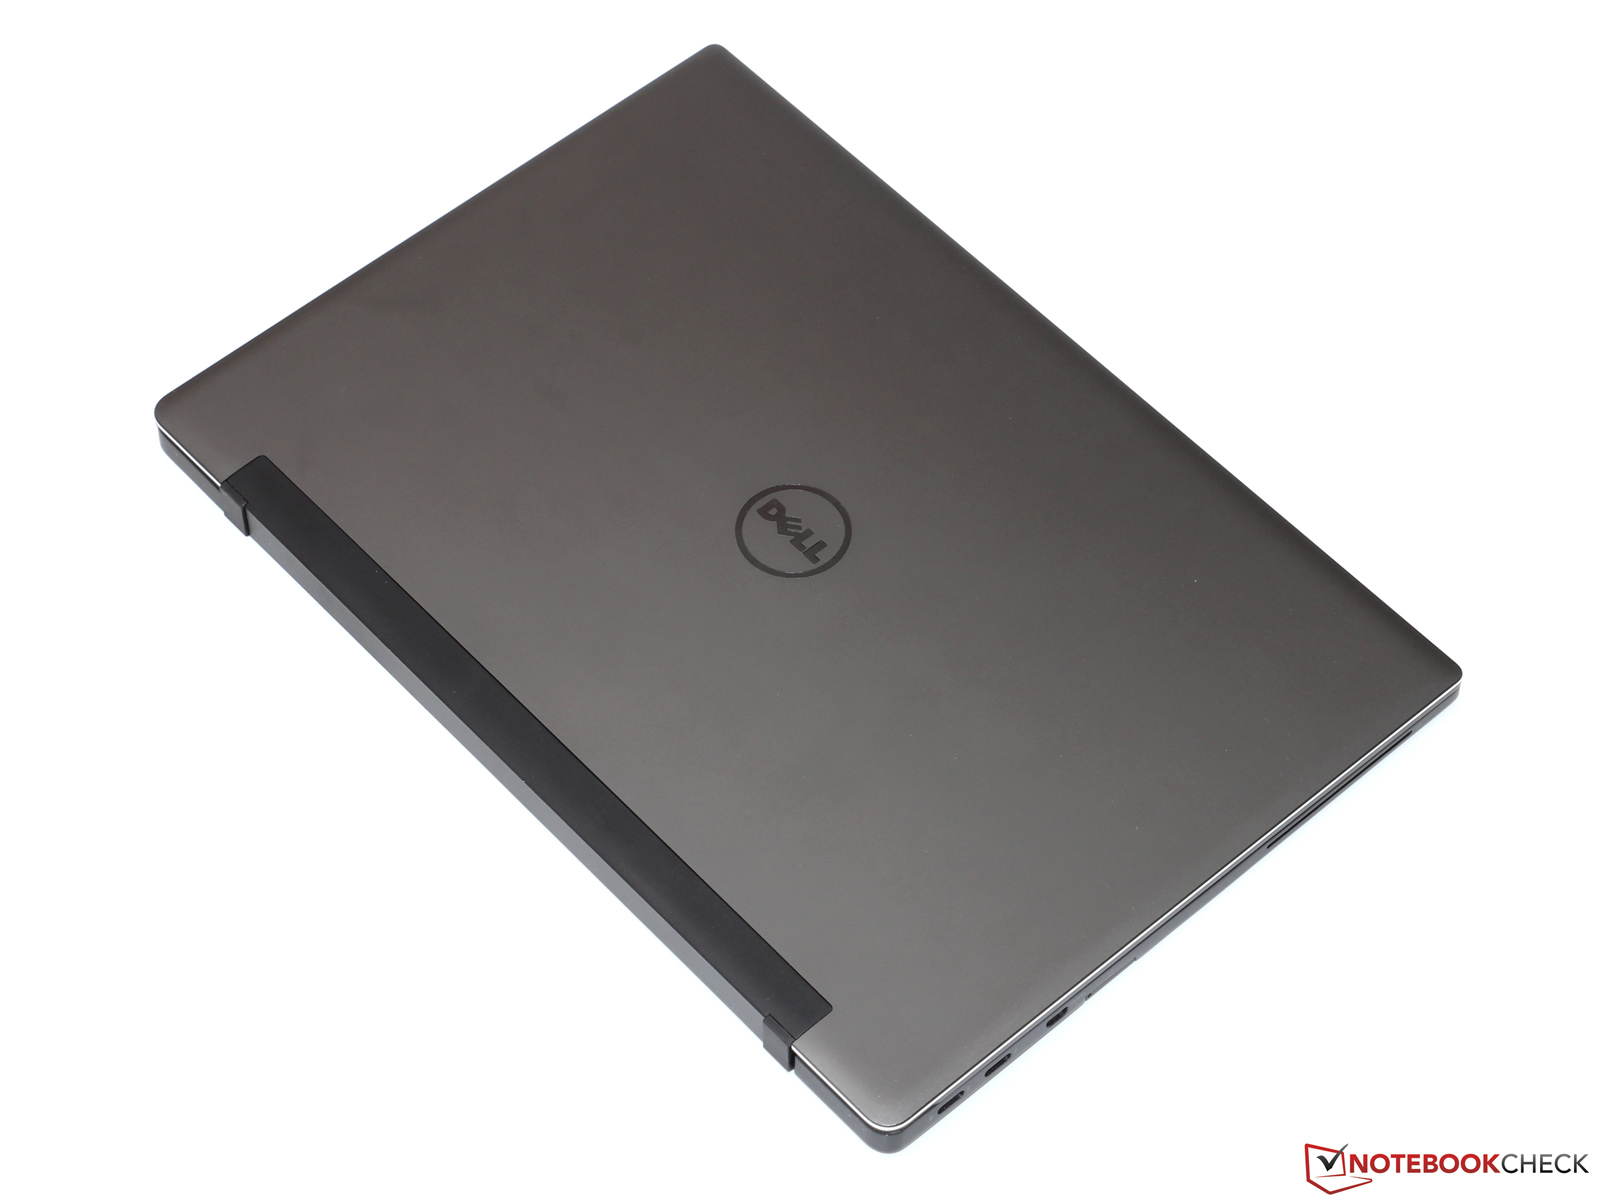
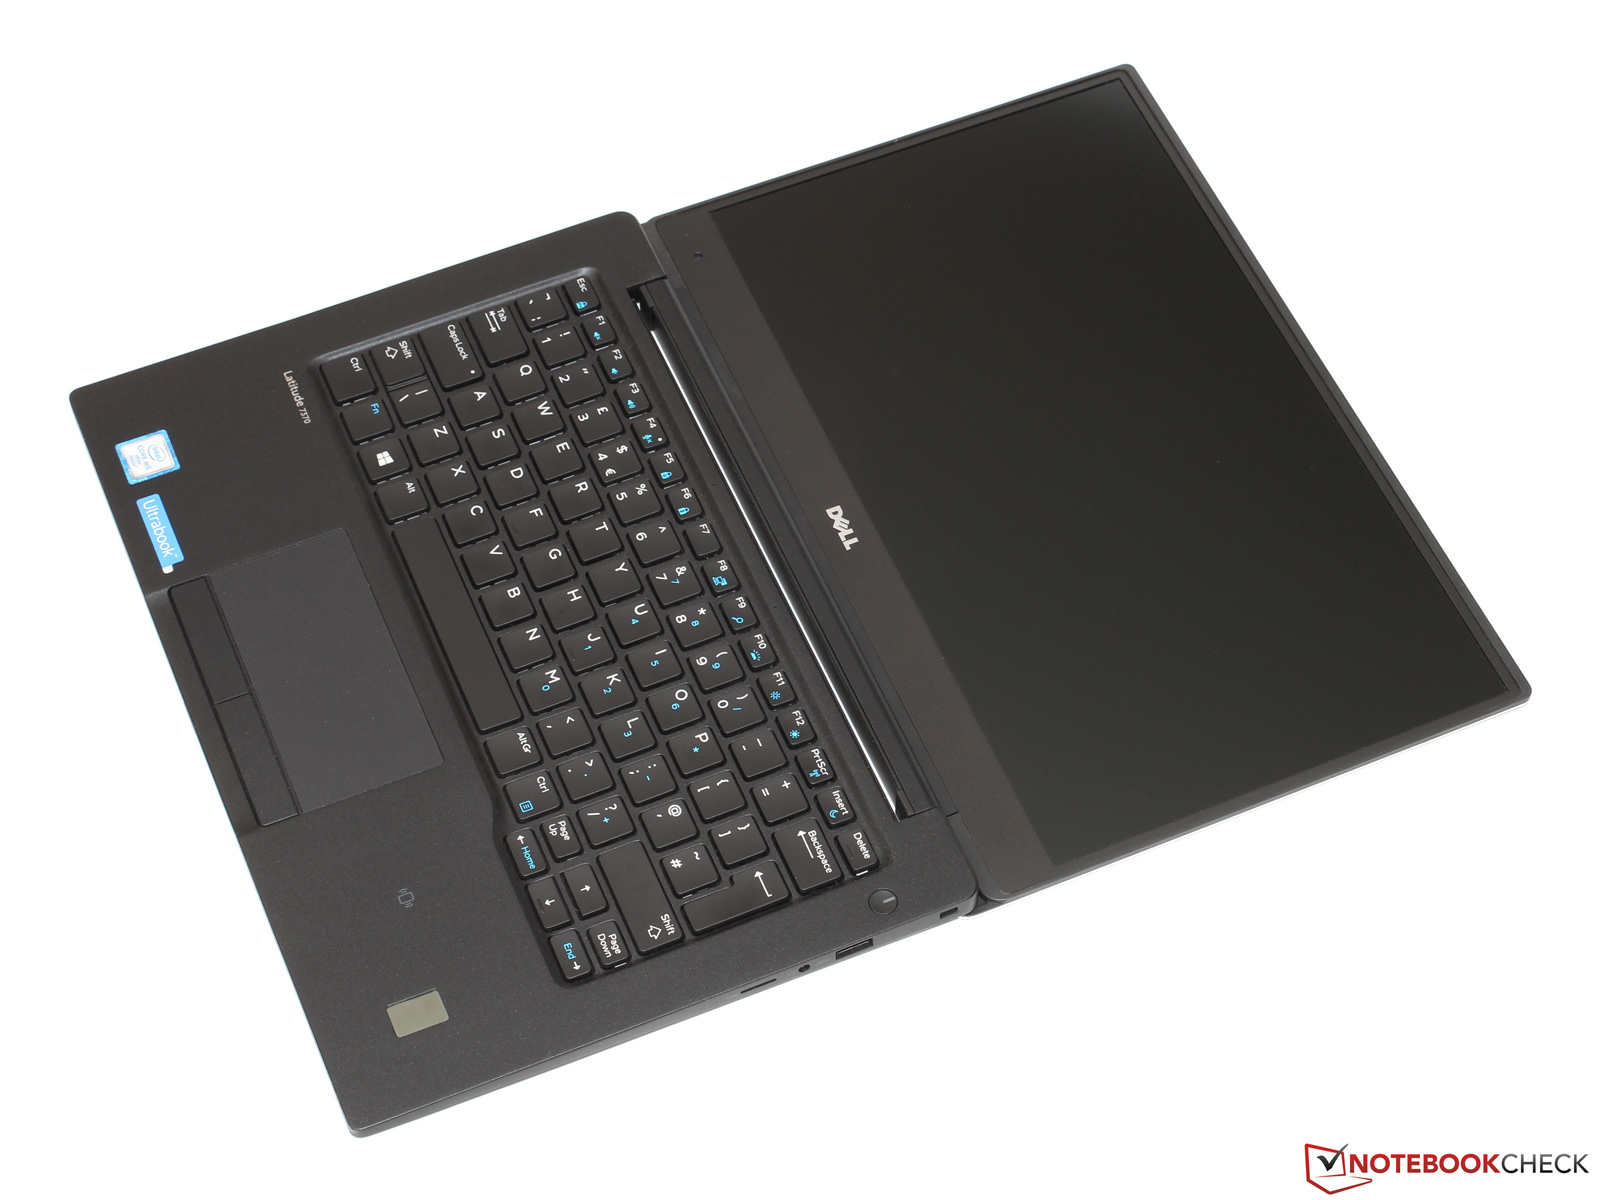
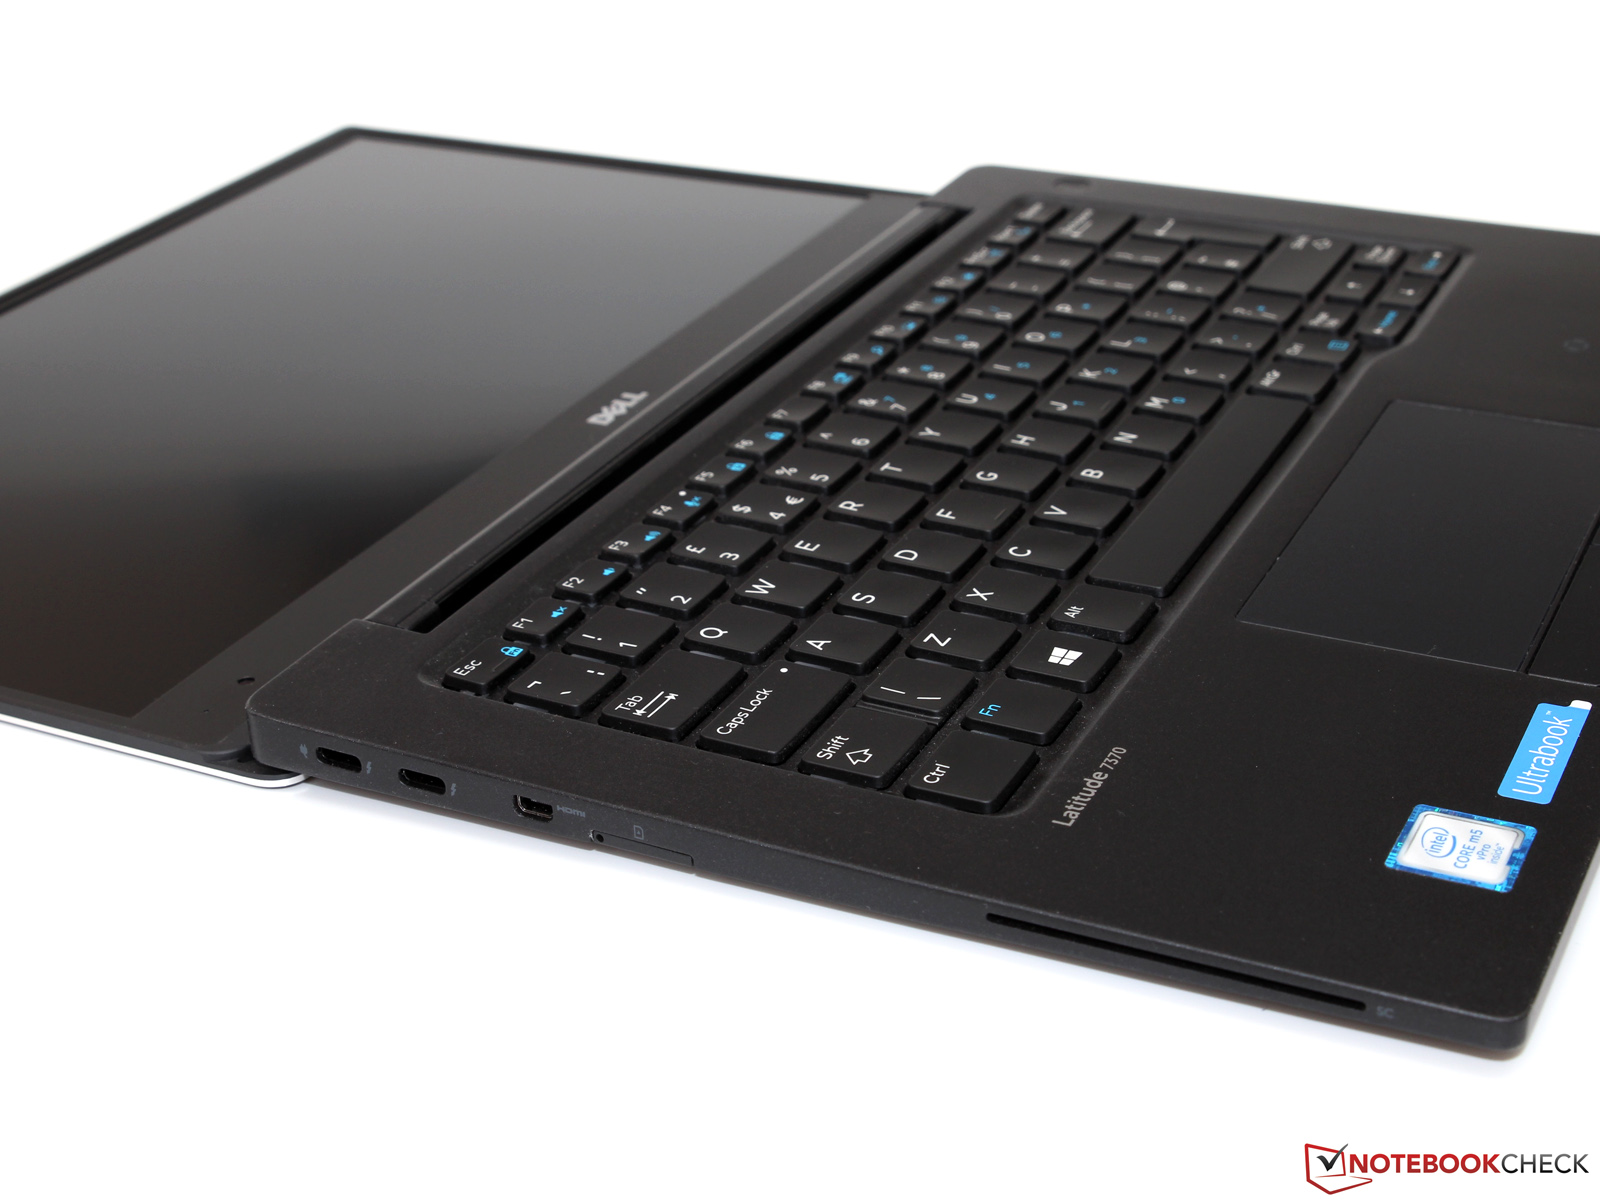
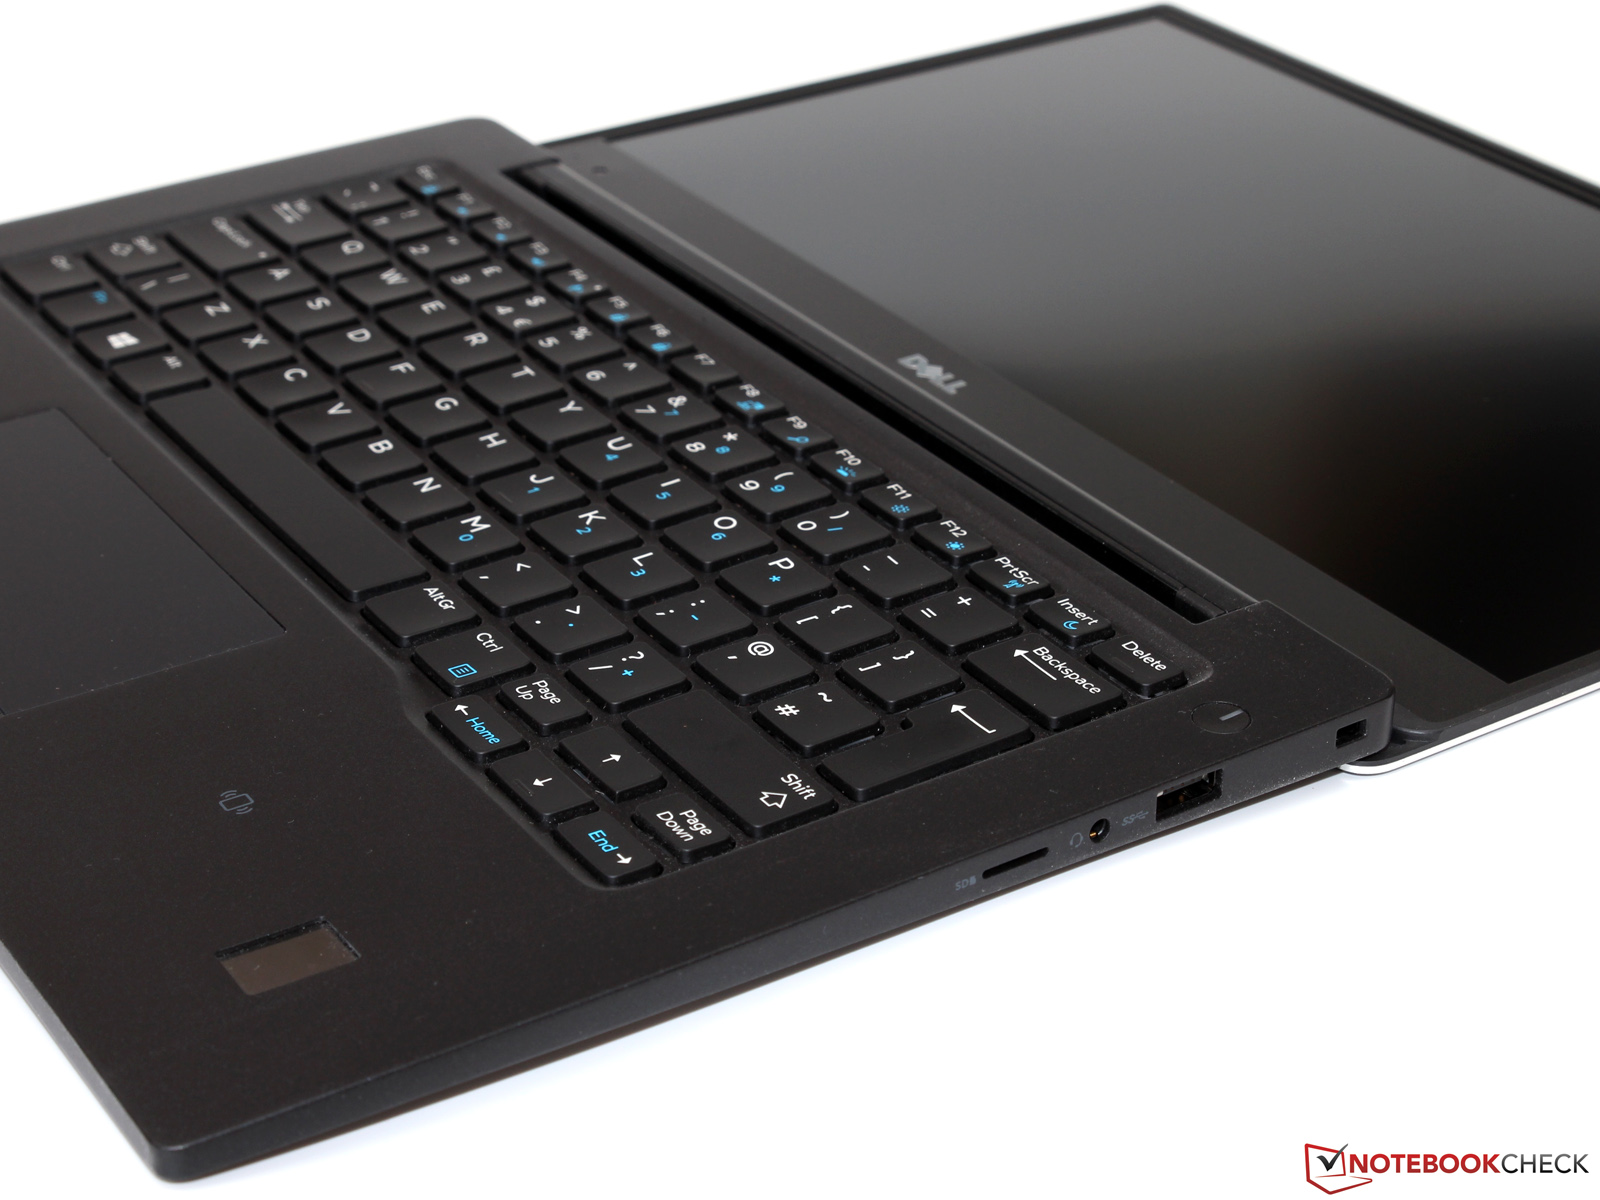
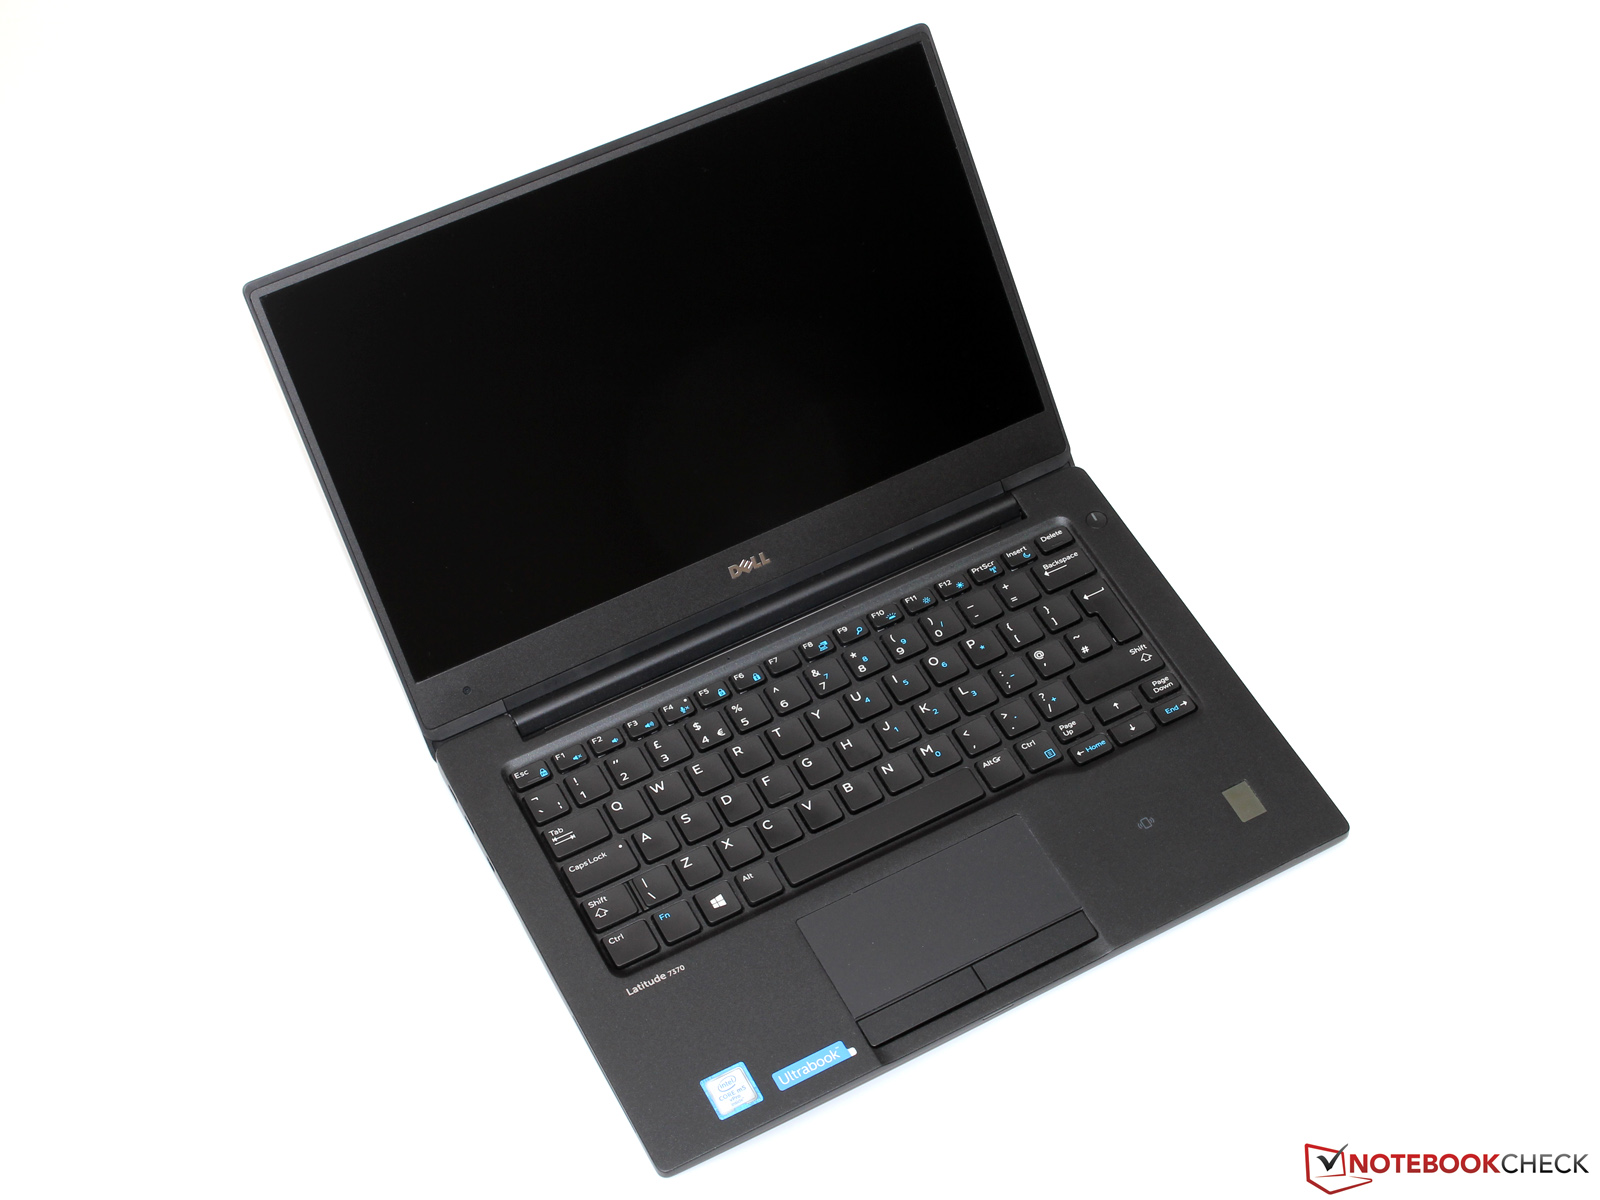
Dell Latitude 13 7370 sticker ut från vanliga bärbara företagsdatorer med en nästan ramlös skärm, passiv kylning och Thunderbolt 3-portar. Datorn är lätt, smidig och övertygar med felfri byggkvalitet, stabilitet och bra inmatningsenheter. 

Prestandan från Core-m-plattformen är också OK. Kortare toppar av hög belastning hanteras – åtminstone efter BIOS-uppdateringen – nästan lika bra som av aktivt kylda konkurrenter. Under ihållande belastning reduceras klockfrekvensen och prestandan märkbart, men det är sällsynt med vanliga kontorsprogram.

Att 7370 missar ett toppbetyg beror främst på skärmen. Dell använder en anständig panel med kraftfull bakgrundsbelysning, men du kan inte alltid använda den på grund av den automatiska justeringen av ljusstyrka och kontrast. Det är ett irriterande problem som vi hoppas att ännu en BIOS-uppdatering kan lösa. 

Om så är fallet står bara det extremt höga priset i vägen för en köprekommendation. För närvarande kostar maskinen ca 2200 euro, så Latitude 13 är absolut inget fynd. Även den (visserligen mer konsumentinriktade) Apple MacBook 12 är betydligt billigare.

Dell Latitude 13 7370 - 05/12/2016 v5.1(old)
Till Schönborn

Design
90 /  98 → 91%
Tangentbord
90%
Mus
93%
Anslutningar
67 / 80 → 84%
Vikt
72 / 35-78 → 86%
Batteri
88%
Skärm
80%
Spelprestanda
52 / 68 → 77%
Programprestanda
77 / 87 → 89%
Temperatur
88 / 91 → 97%
Ljudnivå
100%
Audio
70 / 91 → 77%
Camera
45 / 85 → 53%
Medel
78%
87%
Subnotebook - Vägt medel

Pricecompare

Please share our article, every link counts!
> Bärbara datorer, laptops - tester och nyheter > Tester > Test: Dell Latitude 13 7370 Ultrabook (sammanfattning)
Till Schönborn, 2016-06-12 (Update: 2016-06-12)