Test: Dell Latitude 7200 2-in-1 - Hybridenhet som lämnar ett gott intryck trots att tangentbordet ger efter (Sammanfattning)
| SD Card Reader | |
| average JPG Copy Test (av. of 3 runs) | |
| Dell Latitude 7200 (Toshiba Exceria Pro M501 64 GB UHS-II) | |
| Lenovo ThinkPad X1 Tablet G3-20KJ001NGE (Toshiba Exceria Pro M501 UHS-II) | |
| Microsoft Surface Pro 6, Core i7, 512 GB (Toshiba Exceria Pro M501 microSDXC 64GB) | |
| Genomsnitt av klass Convertible (28.1 - 197, n=23, senaste 2 åren) | |
| maximum AS SSD Seq Read Test (1GB) | |
| Dell Latitude 7200 (Toshiba Exceria Pro M501 64 GB UHS-II) | |
| Genomsnitt av klass Convertible (28.9 - 254, n=22, senaste 2 åren) | |
| Microsoft Surface Pro 6, Core i7, 512 GB (Toshiba Exceria Pro M501 microSDXC 64GB) | |
| Lenovo ThinkPad X1 Tablet G3-20KJ001NGE (Toshiba Exceria Pro M501 UHS-II) | |
| |||||||||||||||||||||||||
Distribution av ljusstyrkan: 88 %
Mitt på batteriet: 394 cd/m²
Kontrast: 1432:1 (Svärta: 0.28 cd/m²)
ΔE ColorChecker Calman: 1.8 | ∀{0.5-29.43 Ø4.73}
calibrated: 1.1
ΔE Greyscale Calman: 1.6 | ∀{0.09-98 Ø4.97}
99.4% sRGB (Argyll 1.6.3 3D)
66.6% AdobeRGB 1998 (Argyll 1.6.3 3D)
72.6% AdobeRGB 1998 (Argyll 3D)
99.5% sRGB (Argyll 3D)
71.6% Display P3 (Argyll 3D)
Gamma: 2.14
CCT: 6702 K
| Dell Latitude 7200 SHP14A3 LQ123N1, , 1920x1280, 12.3" | Lenovo ThinkPad X1 Tablet G3-20KJ001NGE LP130QP1-SPA1, , 3000x2000, 13" | HP Elite x2 1013 G3-2TT14EA AU Optronics AUO101A, , 3000x2000, 13" | Microsoft Surface Pro 6, Core i7, 512 GB LGPhilips LP123WQ112604, , 2736x1824, 12.3" | |
|---|---|---|---|---|
| Display | -3% | -5% | -5% | |
| Display P3 Coverage (%) | 71.6 | 68.1 -5% 67.8 -5% | 67.5 -6% | 67.1 -6% |
| sRGB Coverage (%) | 99.5 | 99.4 0% 99.1 0% | 96.7 -3% | 95.5 -4% |
| AdobeRGB 1998 Coverage (%) | 72.6 | 69.9 -4% 69.3 -5% | 68.2 -6% | 67.9 -6% |
| Response Times | -7% | 18% | 23% | |
| Response Time Grey 50% / Grey 80% * (ms) | 52 ? | 47.2 ? 9% | 47 ? 10% | 43 ? 17% |
| Response Time Black / White * (ms) | 34.8 ? | 42.4 ? -22% | 26 ? 25% | 25 ? 28% |
| PWM Frequency (Hz) | 1645 ? | 22000 ? | ||
| Screen | -30% | -51% | -36% | |
| Brightness middle (cd/m²) | 401 | 474 18% | 452 13% | 484 21% |
| Brightness (cd/m²) | 385 | 418 9% | 412 7% | 473 23% |
| Brightness Distribution (%) | 88 | 76 -14% | 85 -3% | 91 3% |
| Black Level * (cd/m²) | 0.28 | 0.33 -18% | 0.48 -71% | 0.33 -18% |
| Contrast (:1) | 1432 | 1436 0% | 942 -34% | 1467 2% |
| Colorchecker dE 2000 * | 1.8 | 3.2 -78% | 4.05 -125% | 4.29 -138% |
| Colorchecker dE 2000 max. * | 3.4 | 6.1 -79% | 6.64 -95% | 6.46 -90% |
| Colorchecker dE 2000 calibrated * | 1.1 | 0.9 18% | 1.56 -42% | 1.34 -22% |
| Greyscale dE 2000 * | 1.6 | 4.5 -181% | 4.87 -204% | 4.3 -169% |
| Gamma | 2.14 103% | 2.07 106% | 2.71 81% | 2.51 88% |
| CCT | 6702 97% | 5881 111% | 7160 91% | 7315 89% |
| Color Space (Percent of AdobeRGB 1998) (%) | 66.6 | 64 -4% | 62 -7% | 62 -7% |
| Color Space (Percent of sRGB) (%) | 99.4 | 99.4 0% | 97 -2% | 95 -4% |
| Totalt genomsnitt (program/inställningar) | -13% /
-19% | -13% /
-34% | -6% /
-23% |
* ... mindre är bättre
Visa svarstider
| ↔ Svarstid svart till vitt | ||
|---|---|---|
| 34.8 ms ... stiga ↗ och falla ↘ kombinerat | ↗ 18.4 ms stiga | 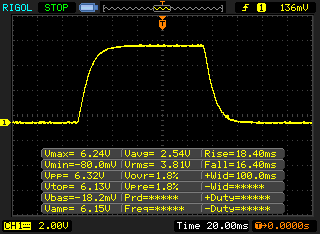 |
| ↘ 16.4 ms hösten | ||
| Skärmen visar långsamma svarsfrekvenser i våra tester och kommer att vara otillfredsställande för spelare. I jämförelse sträcker sig alla testade enheter från 0.1 (minst) till 240 (maximalt) ms. » 92 % av alla enheter är bättre. Detta innebär att den uppmätta svarstiden är sämre än genomsnittet av alla testade enheter (19.9 ms). | ||
| ↔ Svarstid 50 % grått till 80 % grått | ||
| 52 ms ... stiga ↗ och falla ↘ kombinerat | ↗ 26 ms stiga | 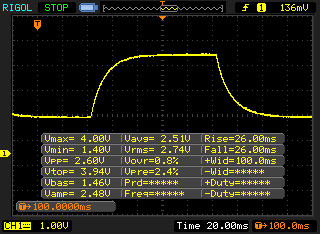 |
| ↘ 26 ms hösten | ||
| Skärmen visar långsamma svarsfrekvenser i våra tester och kommer att vara otillfredsställande för spelare. I jämförelse sträcker sig alla testade enheter från 0.165 (minst) till 636 (maximalt) ms. » 88 % av alla enheter är bättre. Detta innebär att den uppmätta svarstiden är sämre än genomsnittet av alla testade enheter (31.1 ms). | ||
Skärmflimmer / PWM (Puls-Width Modulation)
| Skärmflimmer / PWM upptäckt | 1645 Hz | ≤ 25 % ljusstyrka inställning | 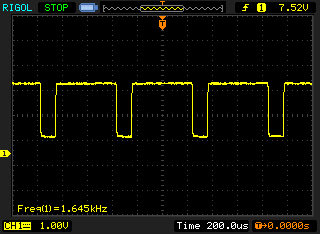 |
Displayens bakgrundsbelysning flimrar vid 1645 Hz (i värsta fall, t.ex. med PWM) Flimrande upptäckt vid en ljusstyrkeinställning på 25 % och lägre. Det ska inte finnas något flimmer eller PWM över denna ljusstyrkeinställning. Frekvensen för 1645 Hz är ganska hög, så de flesta användare som är känsliga för PWM bör inte märka något flimmer. Som jämförelse: 52 % av alla testade enheter använder inte PWM för att dämpa skärmen. Om PWM upptäcktes mättes ett medelvärde av 7798 (minst: 5 - maximum: 343500) Hz. | |||
| PCMark 8 Home Score Accelerated v2 | 3392 poäng | |
| PCMark 8 Work Score Accelerated v2 | 4858 poäng | |
| PCMark 10 Score | 3782 poäng | |
Hjälp | ||
| Dell Latitude 7200 WDC PC SN520 SDAPNUW-512G | Lenovo ThinkPad X1 Tablet G3-20KJ001NGE Samsung PM961 MZVLW256HEHP | HP Elite x2 1013 G3-2TT14EA Samsung PM961 MZVLW256HEHP | Microsoft Surface Pro 6, Core i7, 512 GB Toshiba KBG30ZPZ512G | Genomsnitt WDC PC SN520 SDAPNUW-512G | |
|---|---|---|---|---|---|
| CrystalDiskMark 5.2 / 6 | -2% | 9% | -29% | 7% | |
| Write 4K (MB/s) | 131.9 | 95.4 -28% | 91 -31% | 83.2 -37% | 138.5 ? 5% |
| Read 4K (MB/s) | 45.47 | 39.19 -14% | 36.84 -19% | 43.84 -4% | 44.2 ? -3% |
| Write Seq (MB/s) | 1021 | 1197 17% | 636 -38% | 1265 ? 24% | |
| Read Seq (MB/s) | 1085 | 1705 57% | 900 -17% | 1237 ? 14% | |
| Write 4K Q32T1 (MB/s) | 444.9 | 399.2 -10% | 355.8 -20% | 192.9 -57% | 404 ? -9% |
| Read 4K Q32T1 (MB/s) | 366.6 | 260.7 -29% | 256.9 -30% | 247.4 -33% | 421 ? 15% |
| Write Seq Q32T1 (MB/s) | 1458 | 1287 -12% | 1222 -16% | 861 -41% | 1491 ? 2% |
| Read Seq Q32T1 (MB/s) | 1640 | 3025 84% | 3460 111% | 1615 -2% | 1741 ? 6% |

| 3DMark 11 Performance | 1992 poäng | |
| 3DMark Cloud Gate Standard Score | 7916 poäng | |
| 3DMark Fire Strike Score | 1071 poäng | |
Hjälp | ||
| låg | med. | hög | ultra | |
|---|---|---|---|---|
| BioShock Infinite (2013) | 67.6 | 34.6 | 29.2 | 9.5 |
| The Witcher 3 (2015) | 16.4 | |||
| Dota 2 Reborn (2015) | 73 | 43.3 | 19.9 | 17.8 |
| Rise of the Tomb Raider (2016) | 21.9 | |||
| X-Plane 11.11 (2018) | 22.1 | 14.7 | 13.1 |
Ljudnivå
| Låg belastning |
| 28.8 / 28.8 / 28.8 dB(A) |
| Hög belastning |
| 30.1 / 30.1 dB(A) |
 | ||
30 dB tyst 40 dB(A) hörbar 50 dB(A) högt ljud |
||
min: | ||
(±) Den maximala temperaturen på ovansidan är 42.5 °C / 109 F, jämfört med genomsnittet av 35.4 °C / 96 F , allt från 19.6 till 60 °C för klassen Convertible.
(+) Botten värms upp till maximalt 39.4 °C / 103 F, jämfört med genomsnittet av 36.9 °C / 98 F
(+) Vid tomgångsbruk är medeltemperaturen för ovansidan 22.9 °C / 73 F, jämfört med enhetsgenomsnittet på 30.3 °C / ### class_avg_f### F.
(+) Handledsstöden och pekplattan är kallare än hudtemperaturen med maximalt 30.9 °C / 87.6 F och är därför svala att ta på.
(-) Medeltemperaturen för handledsstödsområdet på liknande enheter var 28 °C / 82.4 F (-2.9 °C / -5.2 F).
Dell Latitude 7200 ljudanalys
(-) | inte särskilt höga högtalare (69.2 dB)
Bas 100 - 315 Hz
(-) | nästan ingen bas - i genomsnitt 17.3% lägre än medianen
(±) | linjäriteten för basen är genomsnittlig (9.2% delta till föregående frekvens)
Mellan 400 - 2000 Hz
(+) | balanserad mellan - endast 4.5% från medianen
(±) | linjäriteten för mids är genomsnittlig (7.5% delta till föregående frekvens)
Högsta 2 - 16 kHz
(+) | balanserade toppar - endast 4.9% från medianen
(±) | linjäriteten för toppar är genomsnittlig (7.2% delta till föregående frekvens)
Totalt 100 - 16 000 Hz
(±) | linjäriteten för det totala ljudet är genomsnittlig (26.7% skillnad mot median)
Jämfört med samma klass
» 83% av alla testade enheter i den här klassen var bättre, 3% liknande, 14% sämre
» Den bästa hade ett delta på 6%, genomsnittet var 20%, sämst var 57%
Jämfört med alla testade enheter
» 82% av alla testade enheter var bättre, 4% liknande, 14% sämre
» Den bästa hade ett delta på 4%, genomsnittet var 24%, sämst var 134%
Microsoft Surface Pro 6, Core i7, 512 GB ljudanalys
(-) | inte särskilt höga högtalare (69.1 dB)
Bas 100 - 315 Hz
(±) | reducerad bas - i genomsnitt 11.4% lägre än medianen
(±) | linjäriteten för basen är genomsnittlig (10.6% delta till föregående frekvens)
Mellan 400 - 2000 Hz
(+) | balanserad mellan - endast 4.3% från medianen
(±) | linjäriteten för mids är genomsnittlig (10.4% delta till föregående frekvens)
Högsta 2 - 16 kHz
(±) | högre toppar - i genomsnitt 5.7% högre än medianen
(±) | linjäriteten för toppar är genomsnittlig (8.1% delta till föregående frekvens)
Totalt 100 - 16 000 Hz
(±) | linjäriteten för det totala ljudet är genomsnittlig (21.4% skillnad mot median)
Jämfört med samma klass
» 56% av alla testade enheter i den här klassen var bättre, 12% liknande, 32% sämre
» Den bästa hade ett delta på 6%, genomsnittet var 20%, sämst var 57%
Jämfört med alla testade enheter
» 60% av alla testade enheter var bättre, 7% liknande, 33% sämre
» Den bästa hade ett delta på 4%, genomsnittet var 24%, sämst var 134%
| Av/Standby | |
| Låg belastning | |
| Hög belastning |
|
Förklaring:
min: | |
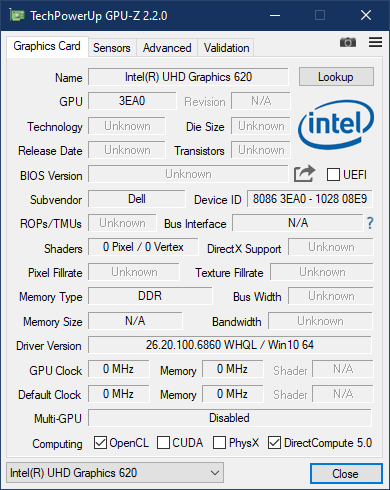
| Dell Latitude 7200 i5-8365U, UHD Graphics 620, WDC PC SN520 SDAPNUW-512G, IPS LED, 1920x1280, 12.3" | Lenovo ThinkPad X1 Tablet G3-20KJ001NGE i5-8250U, UHD Graphics 620, Samsung PM961 MZVLW256HEHP, IPS, 3000x2000, 13" | HP Elite x2 1013 G3-2TT14EA i5-8350U, UHD Graphics 620, Samsung PM961 MZVLW256HEHP, IPS, 3000x2000, 13" | Microsoft Surface Pro 6, Core i7, 512 GB i7-8650U, UHD Graphics 620, Toshiba KBG30ZPZ512G, IPS, 2736x1824, 12.3" | |
|---|---|---|---|---|
| Power Consumption | -38% | -25% | -13% | |
| Idle Minimum * (Watt) | 3.3 | 4.8 -45% | 4.9 -48% | 3.2 3% |
| Idle Average * (Watt) | 5.8 | 9 -55% | 8.9 -53% | 8.7 -50% |
| Idle Maximum * (Watt) | 6.5 | 10.5 -62% | 11 -69% | 10.4 -60% |
| Load Average * (Watt) | 37 | 42.8 -16% | 32 14% | 29.2 21% |
| Load Maximum * (Watt) | 51.3 | 57.8 -13% | 36 30% | 40.8 20% |
* ... mindre är bättre
| Dell Latitude 7200 i5-8365U, UHD Graphics 620, 38 Wh | Lenovo ThinkPad X1 Tablet G3-20KJ001NGE i5-8250U, UHD Graphics 620, 42 Wh | HP Elite x2 1013 G3-2TT14EA i5-8350U, UHD Graphics 620, 50 Wh | Microsoft Surface Pro 6, Core i7, 512 GB i7-8650U, UHD Graphics 620, 45 Wh | Genomsnitt av klass Convertible | |
|---|---|---|---|---|---|
| Batteridrifttid | -7% | 6% | 22% | 52% | |
| H.264 (h) | 8.2 | 8.7 6% | 6.5 -21% | 15.3 ? 87% | |
| WiFi v1.3 (h) | 7 | 6.6 -6% | 7.7 10% | 8.5 21% | 11.9 ? 70% |
| Load (h) | 1.8 | 1.4 -22% | 2.3 28% | 2.2 22% | 1.779 ? -1% |
| Reader / Idle (h) | 13.2 | 13 | 18.1 | 27.7 ? |
För
Emot

Läs den fullständiga versionen av den här recensionen på engelska här.
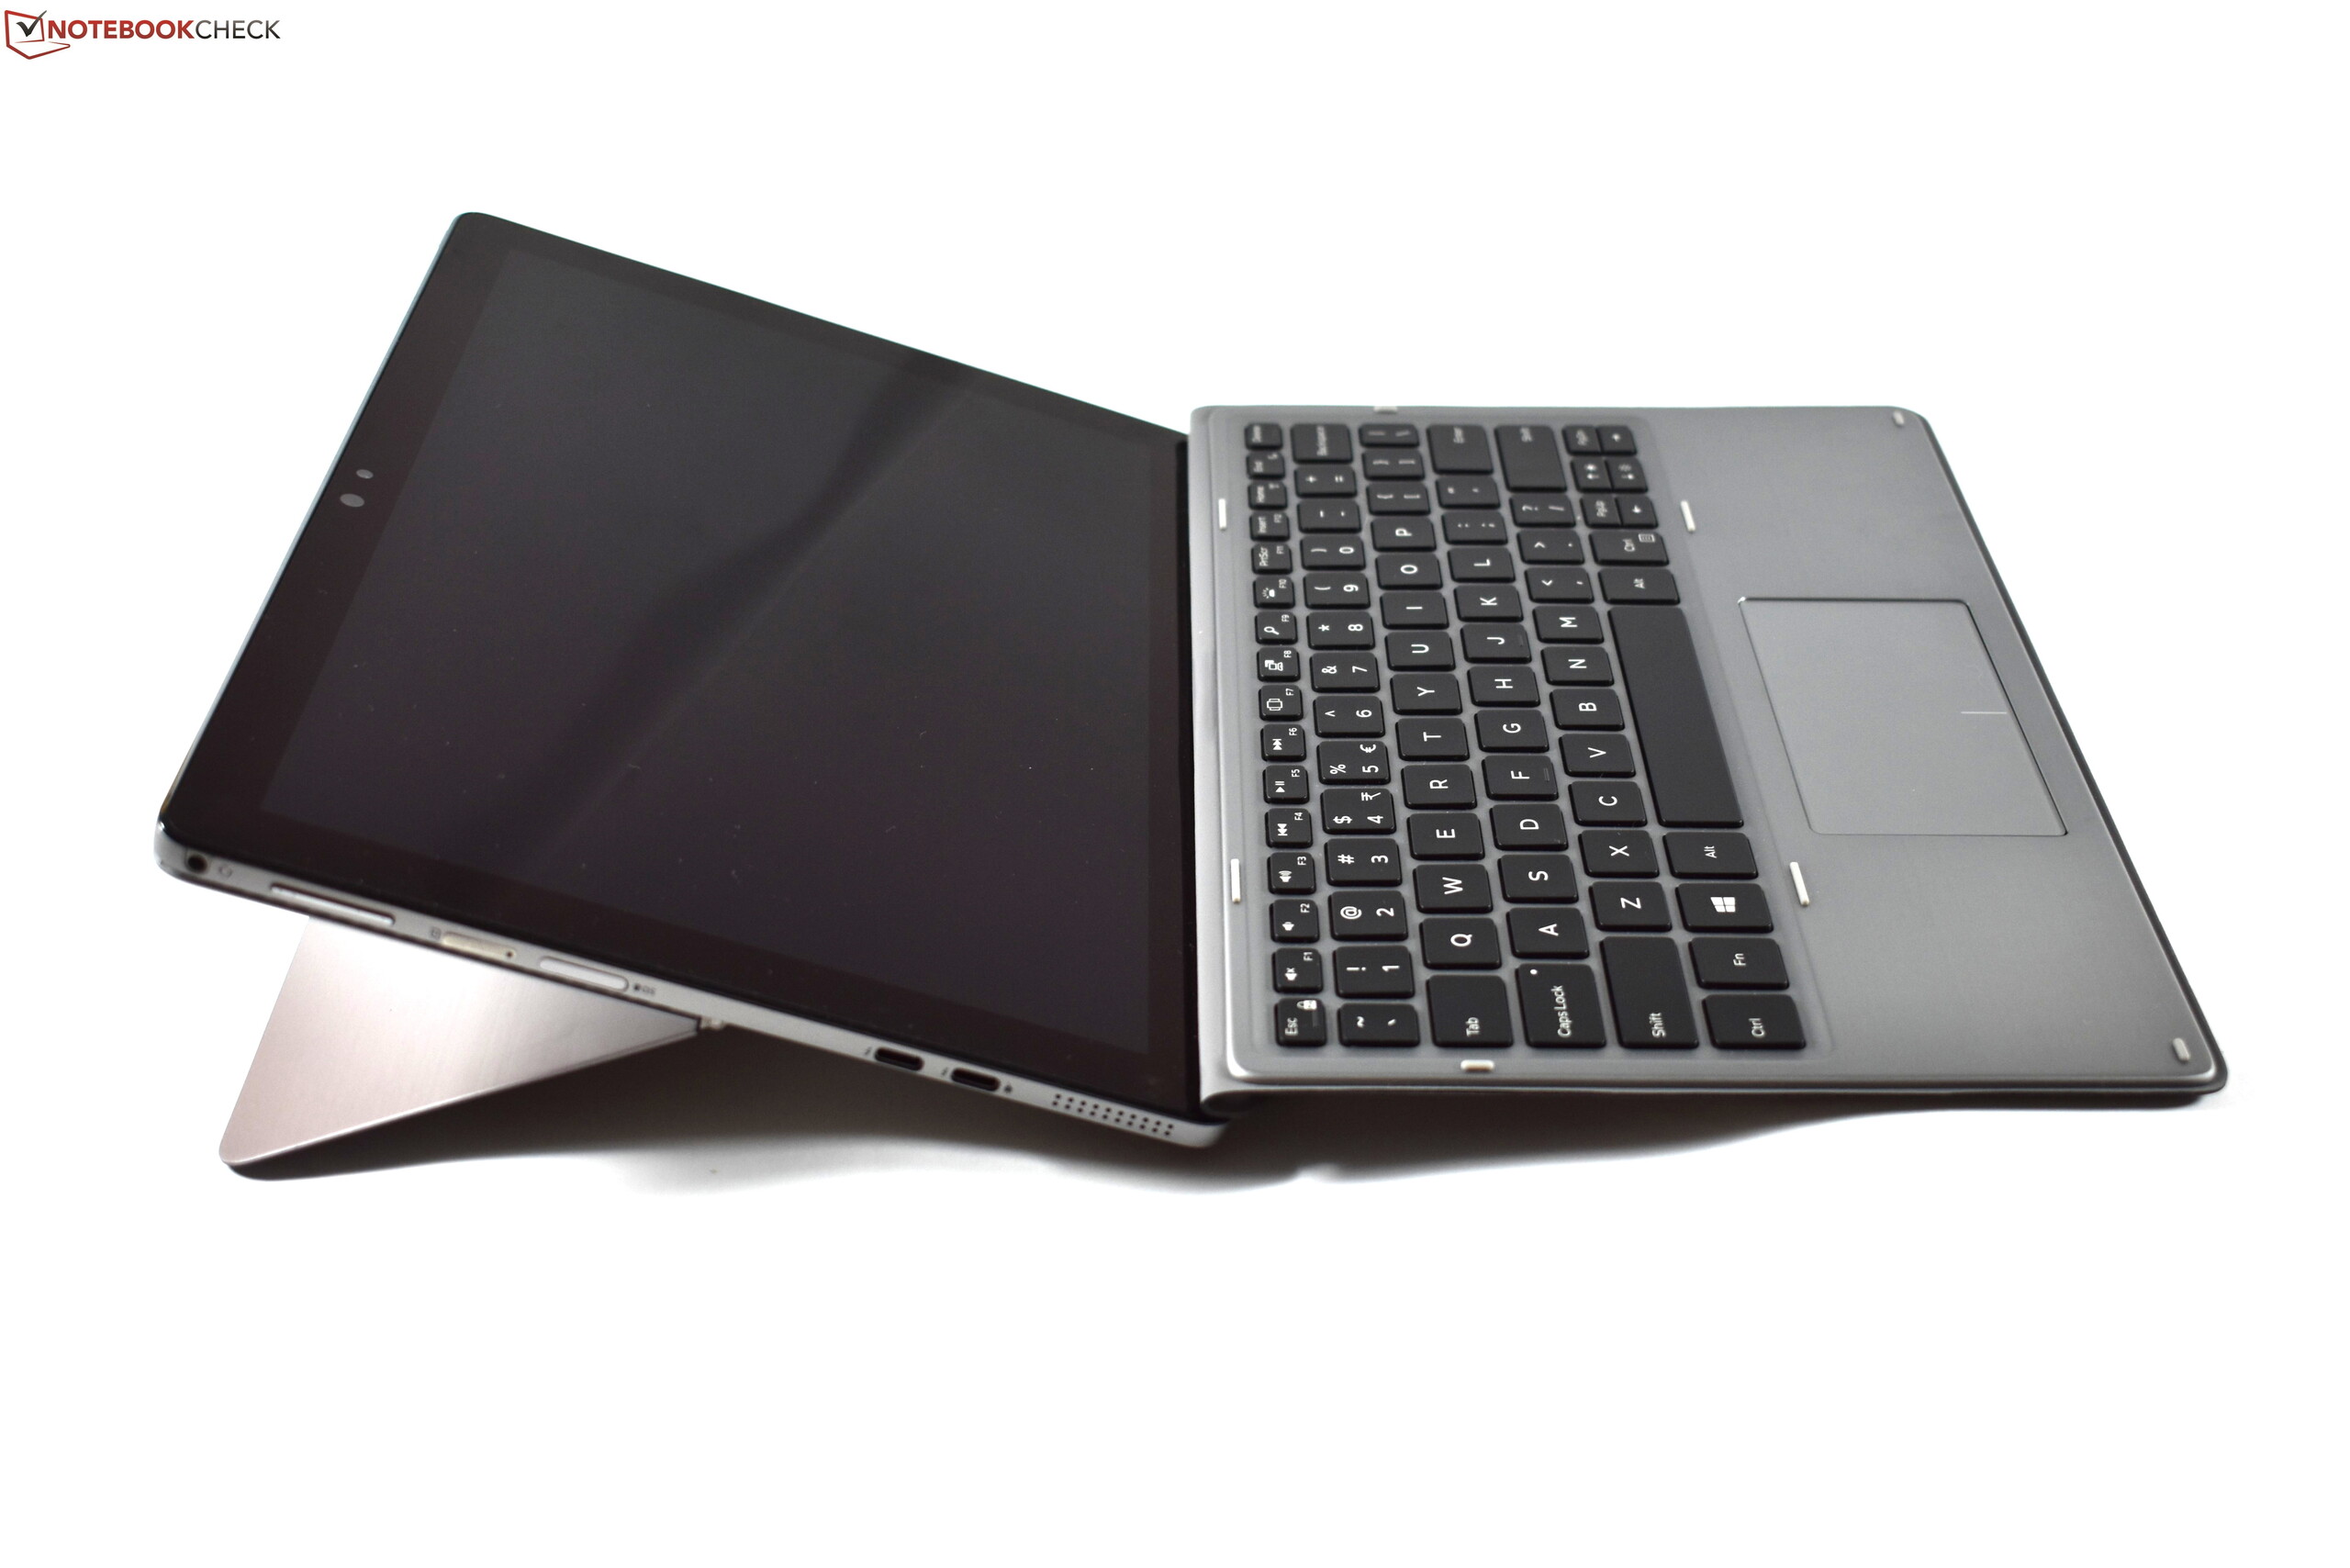
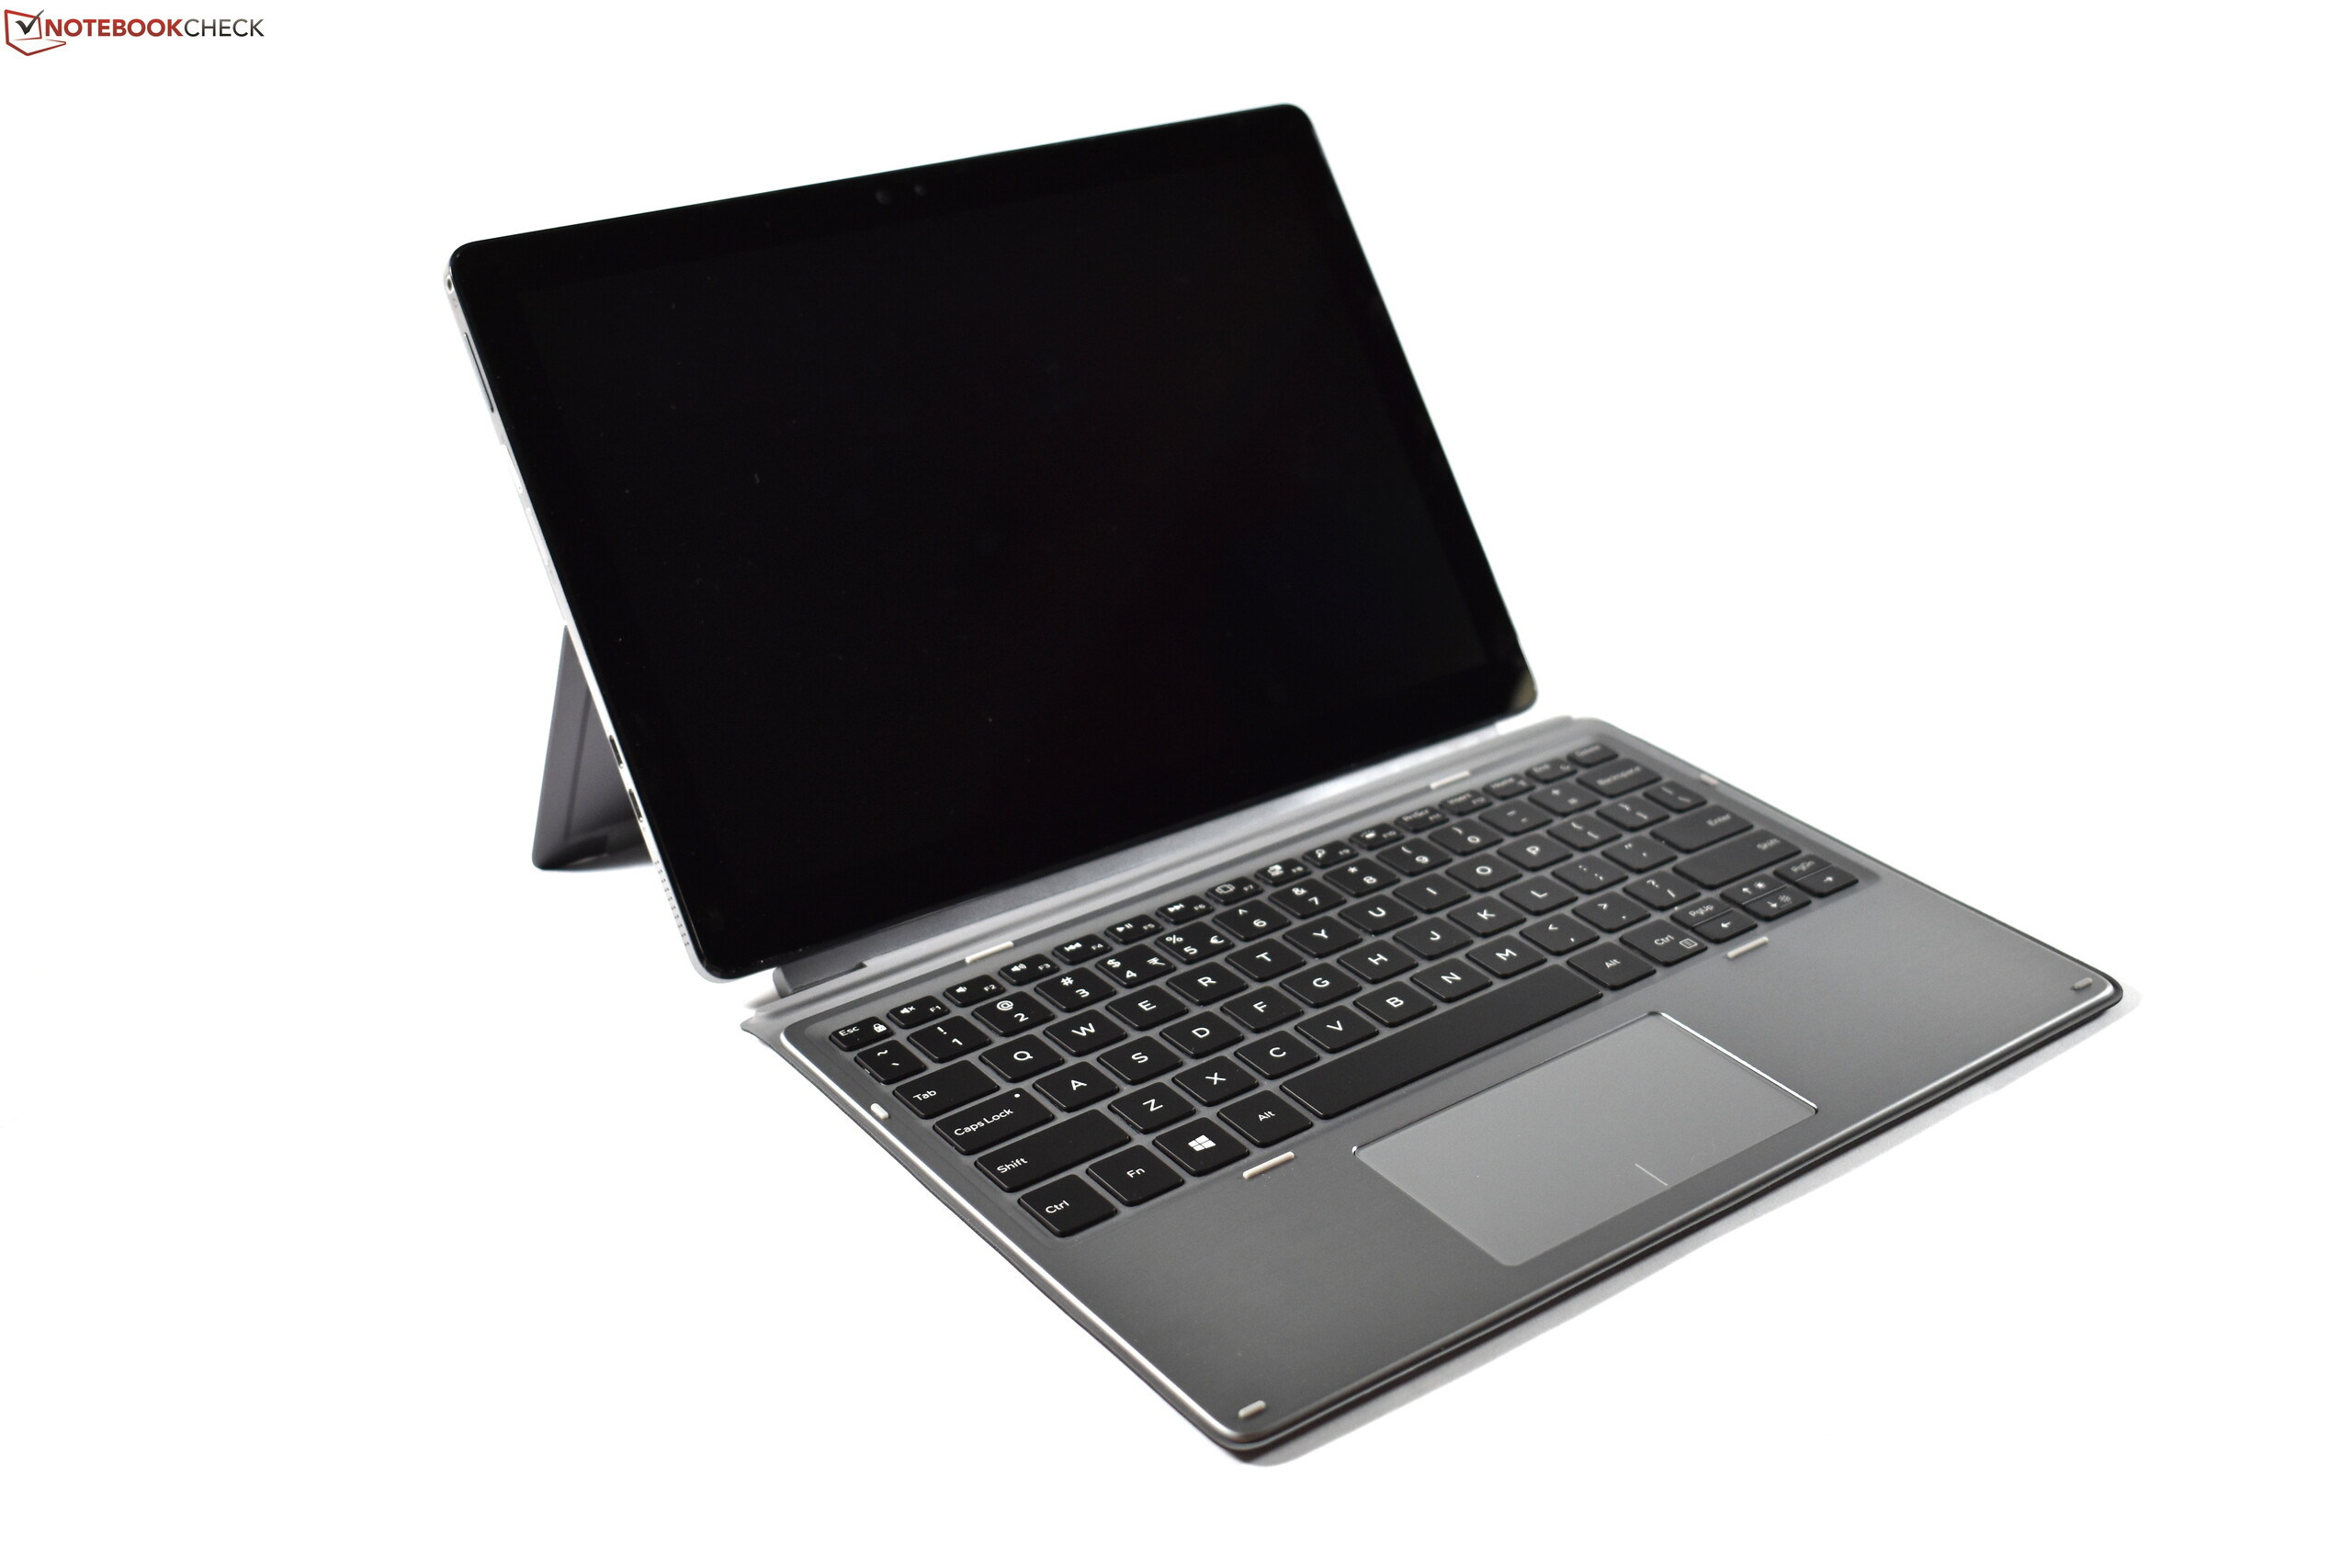
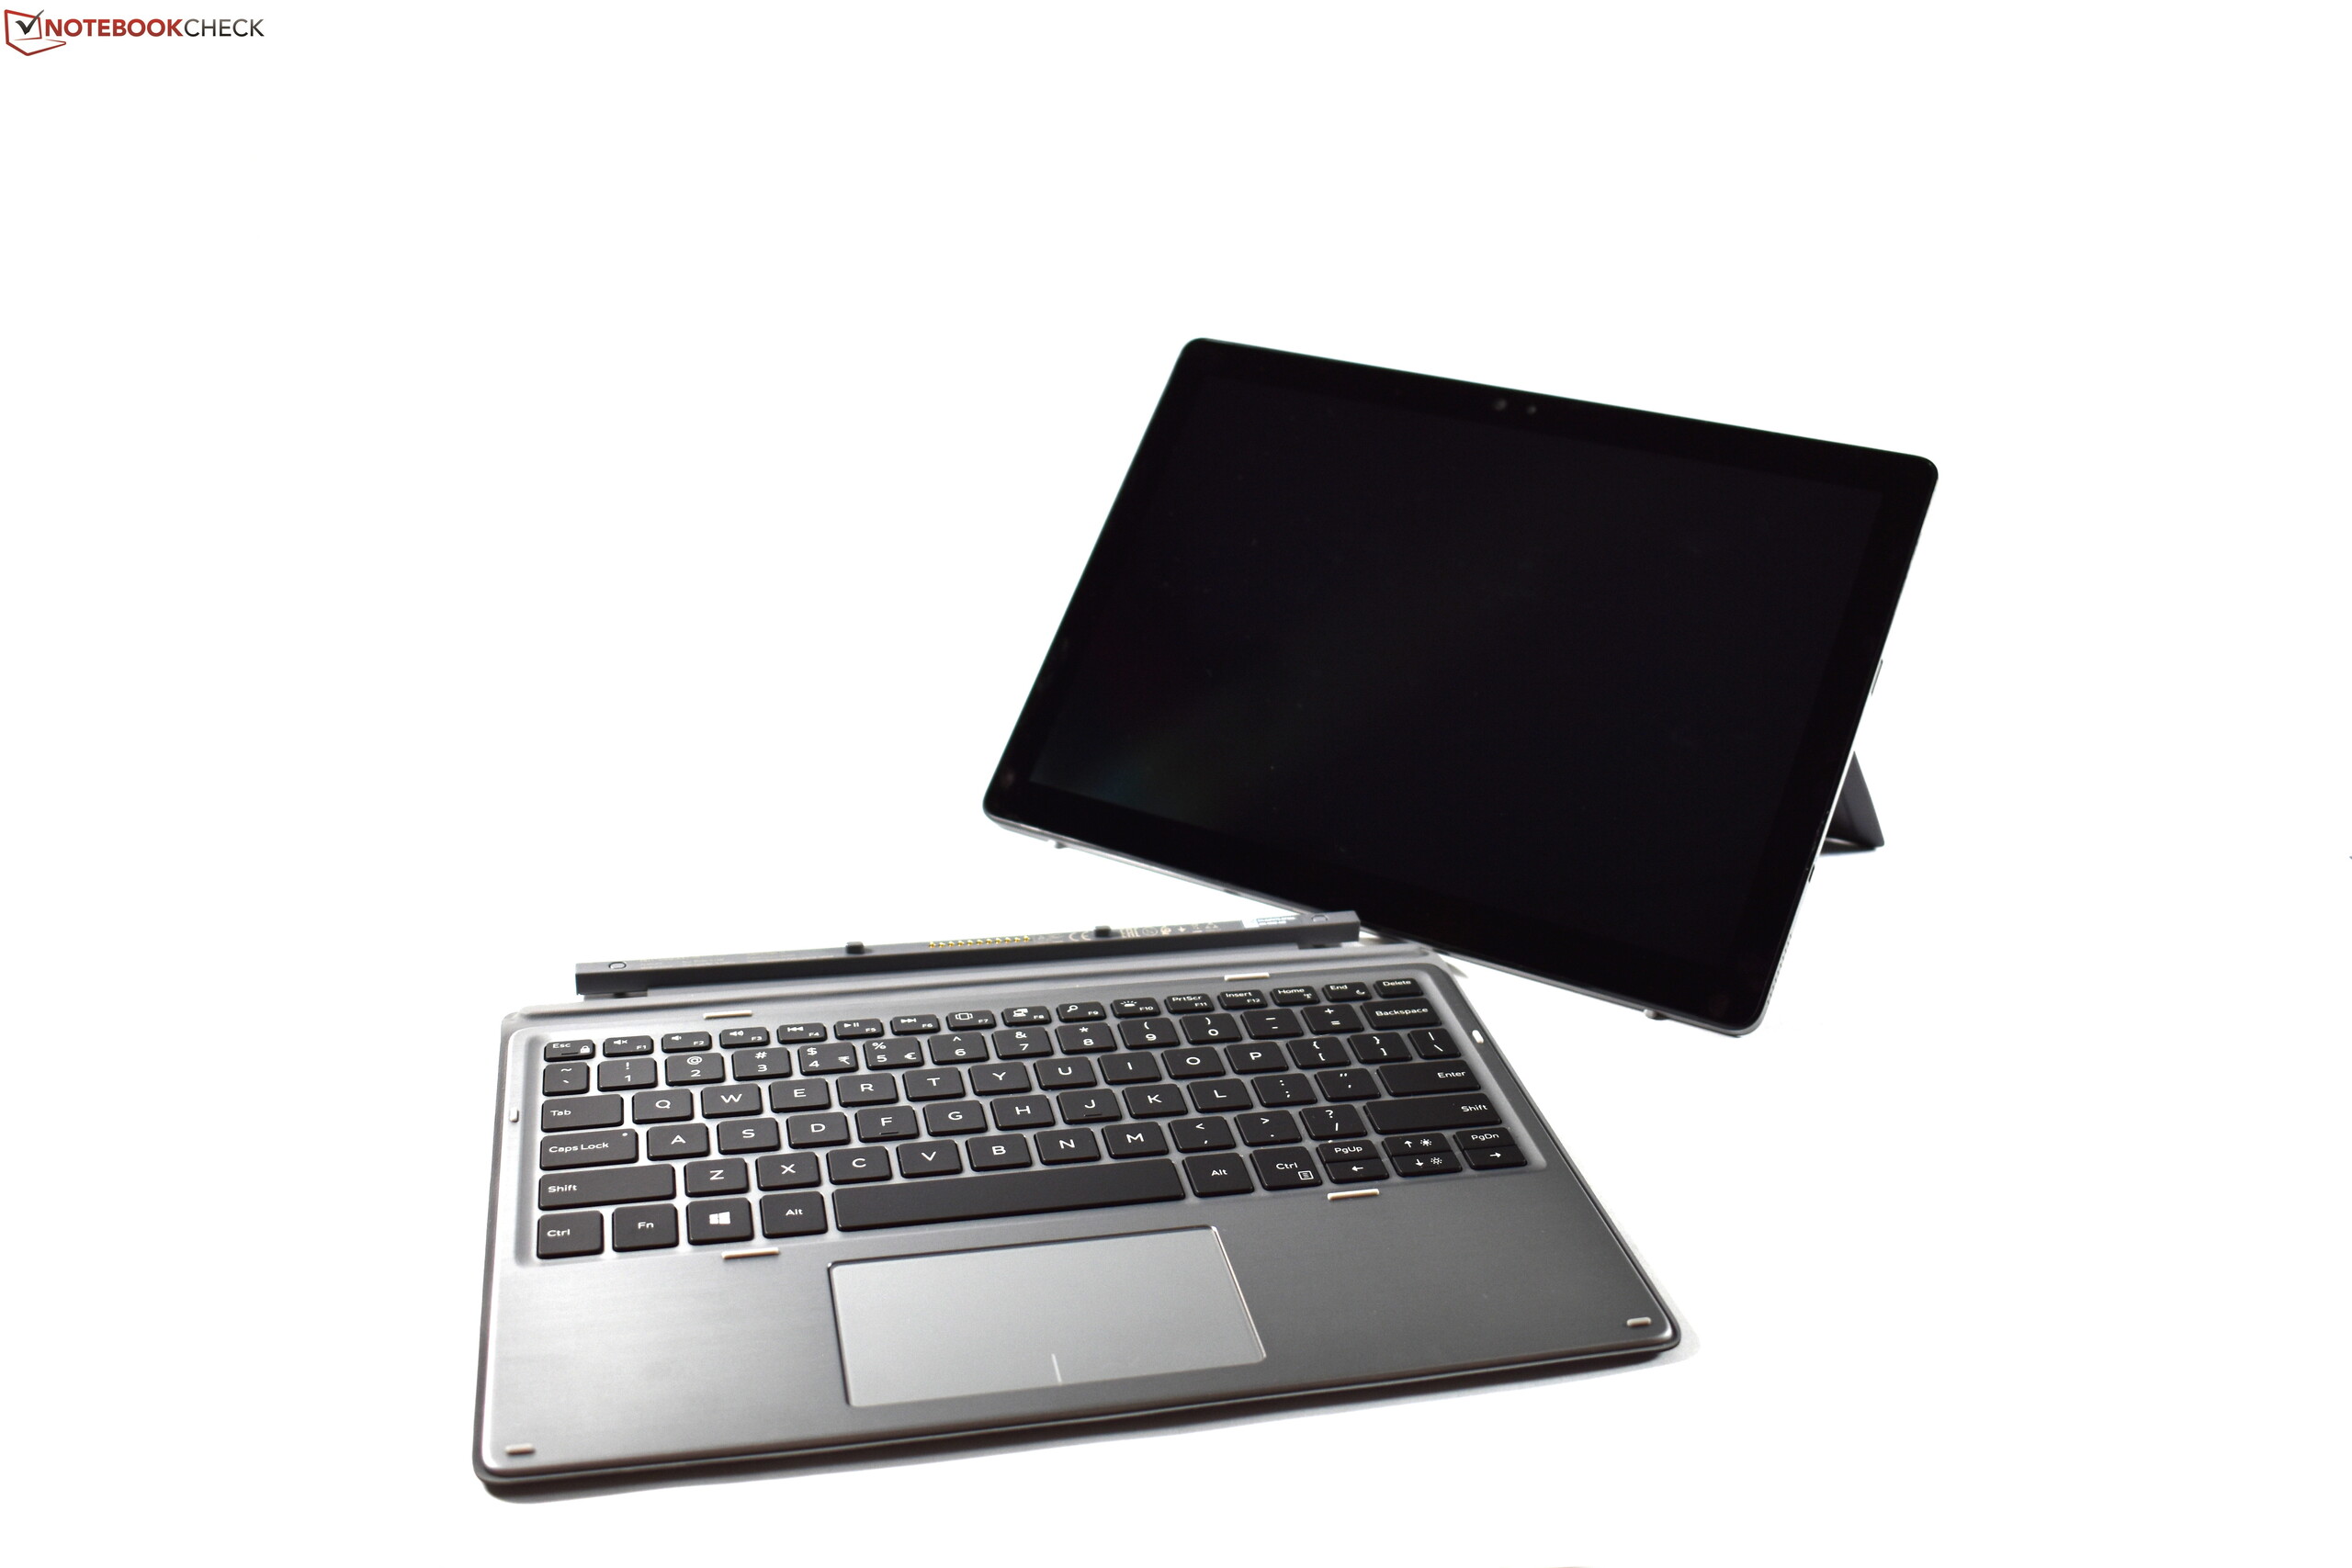
En Surface-klon? Dell hade nog undvikit att beskriva Dell Latitude 7200 2-in-1 så även om det passar. Dell utgår fram samma grundkoncept som Microsoft Surface Pro 6, med både styrkor och svagheter.
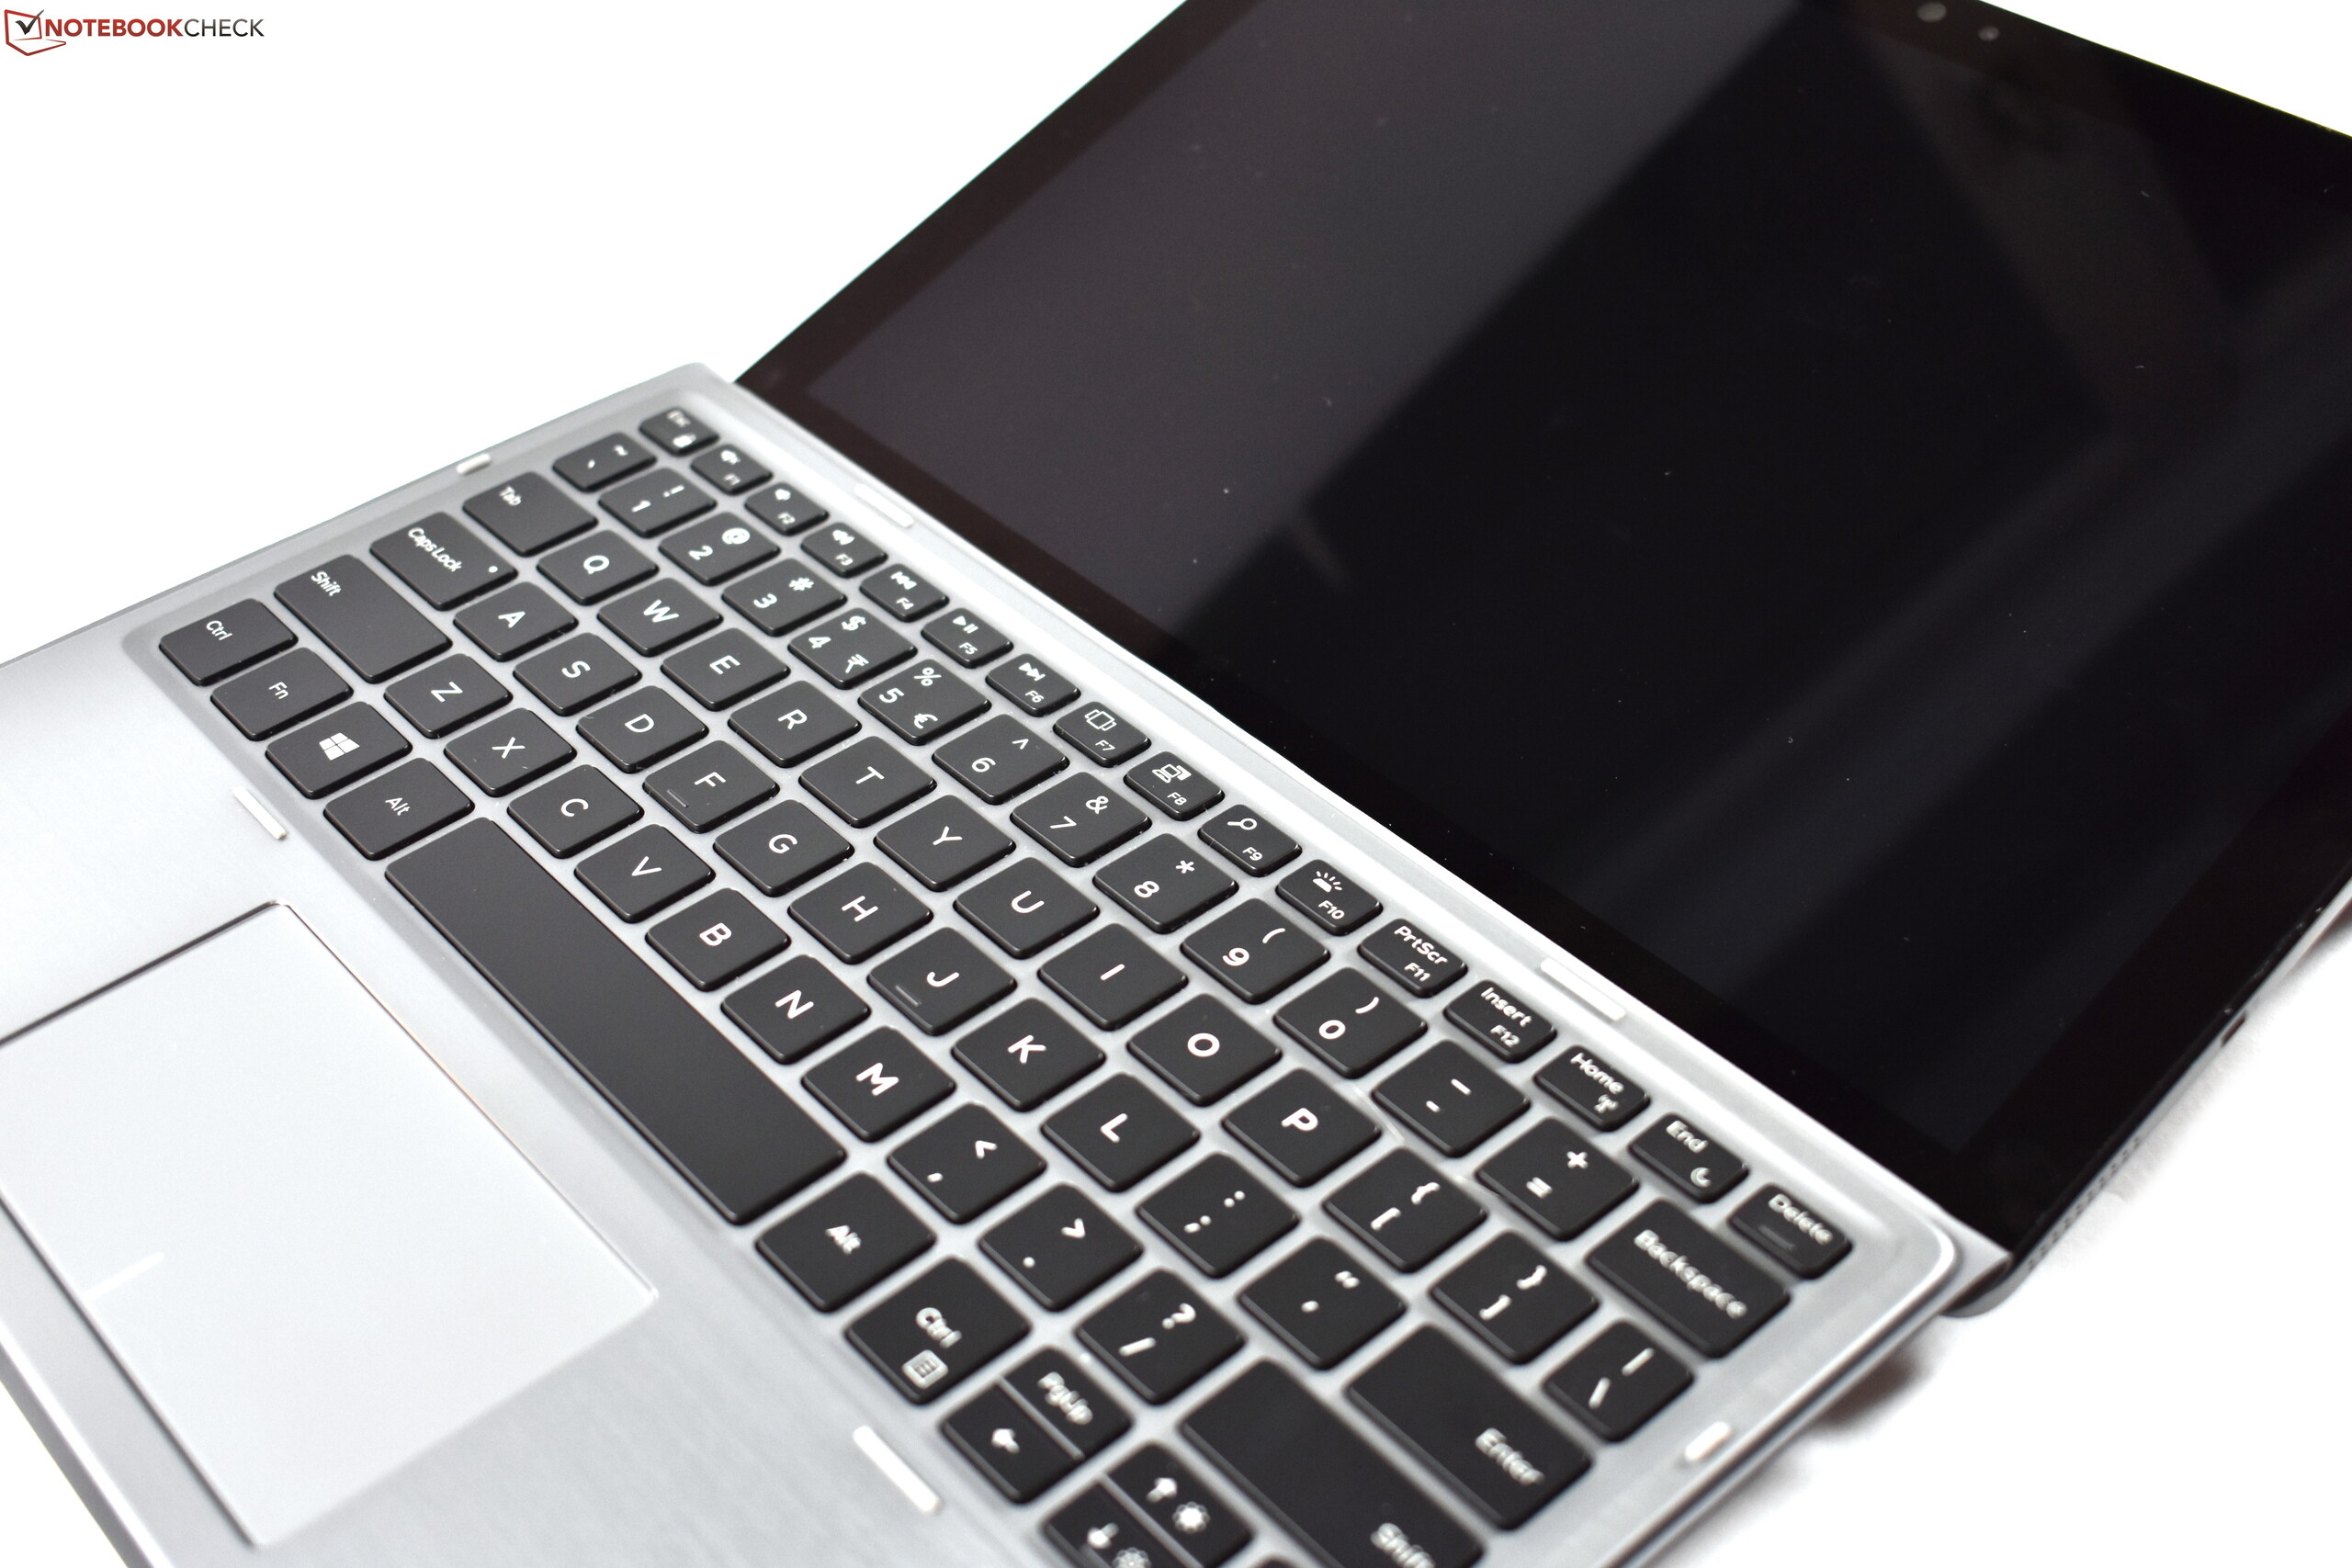
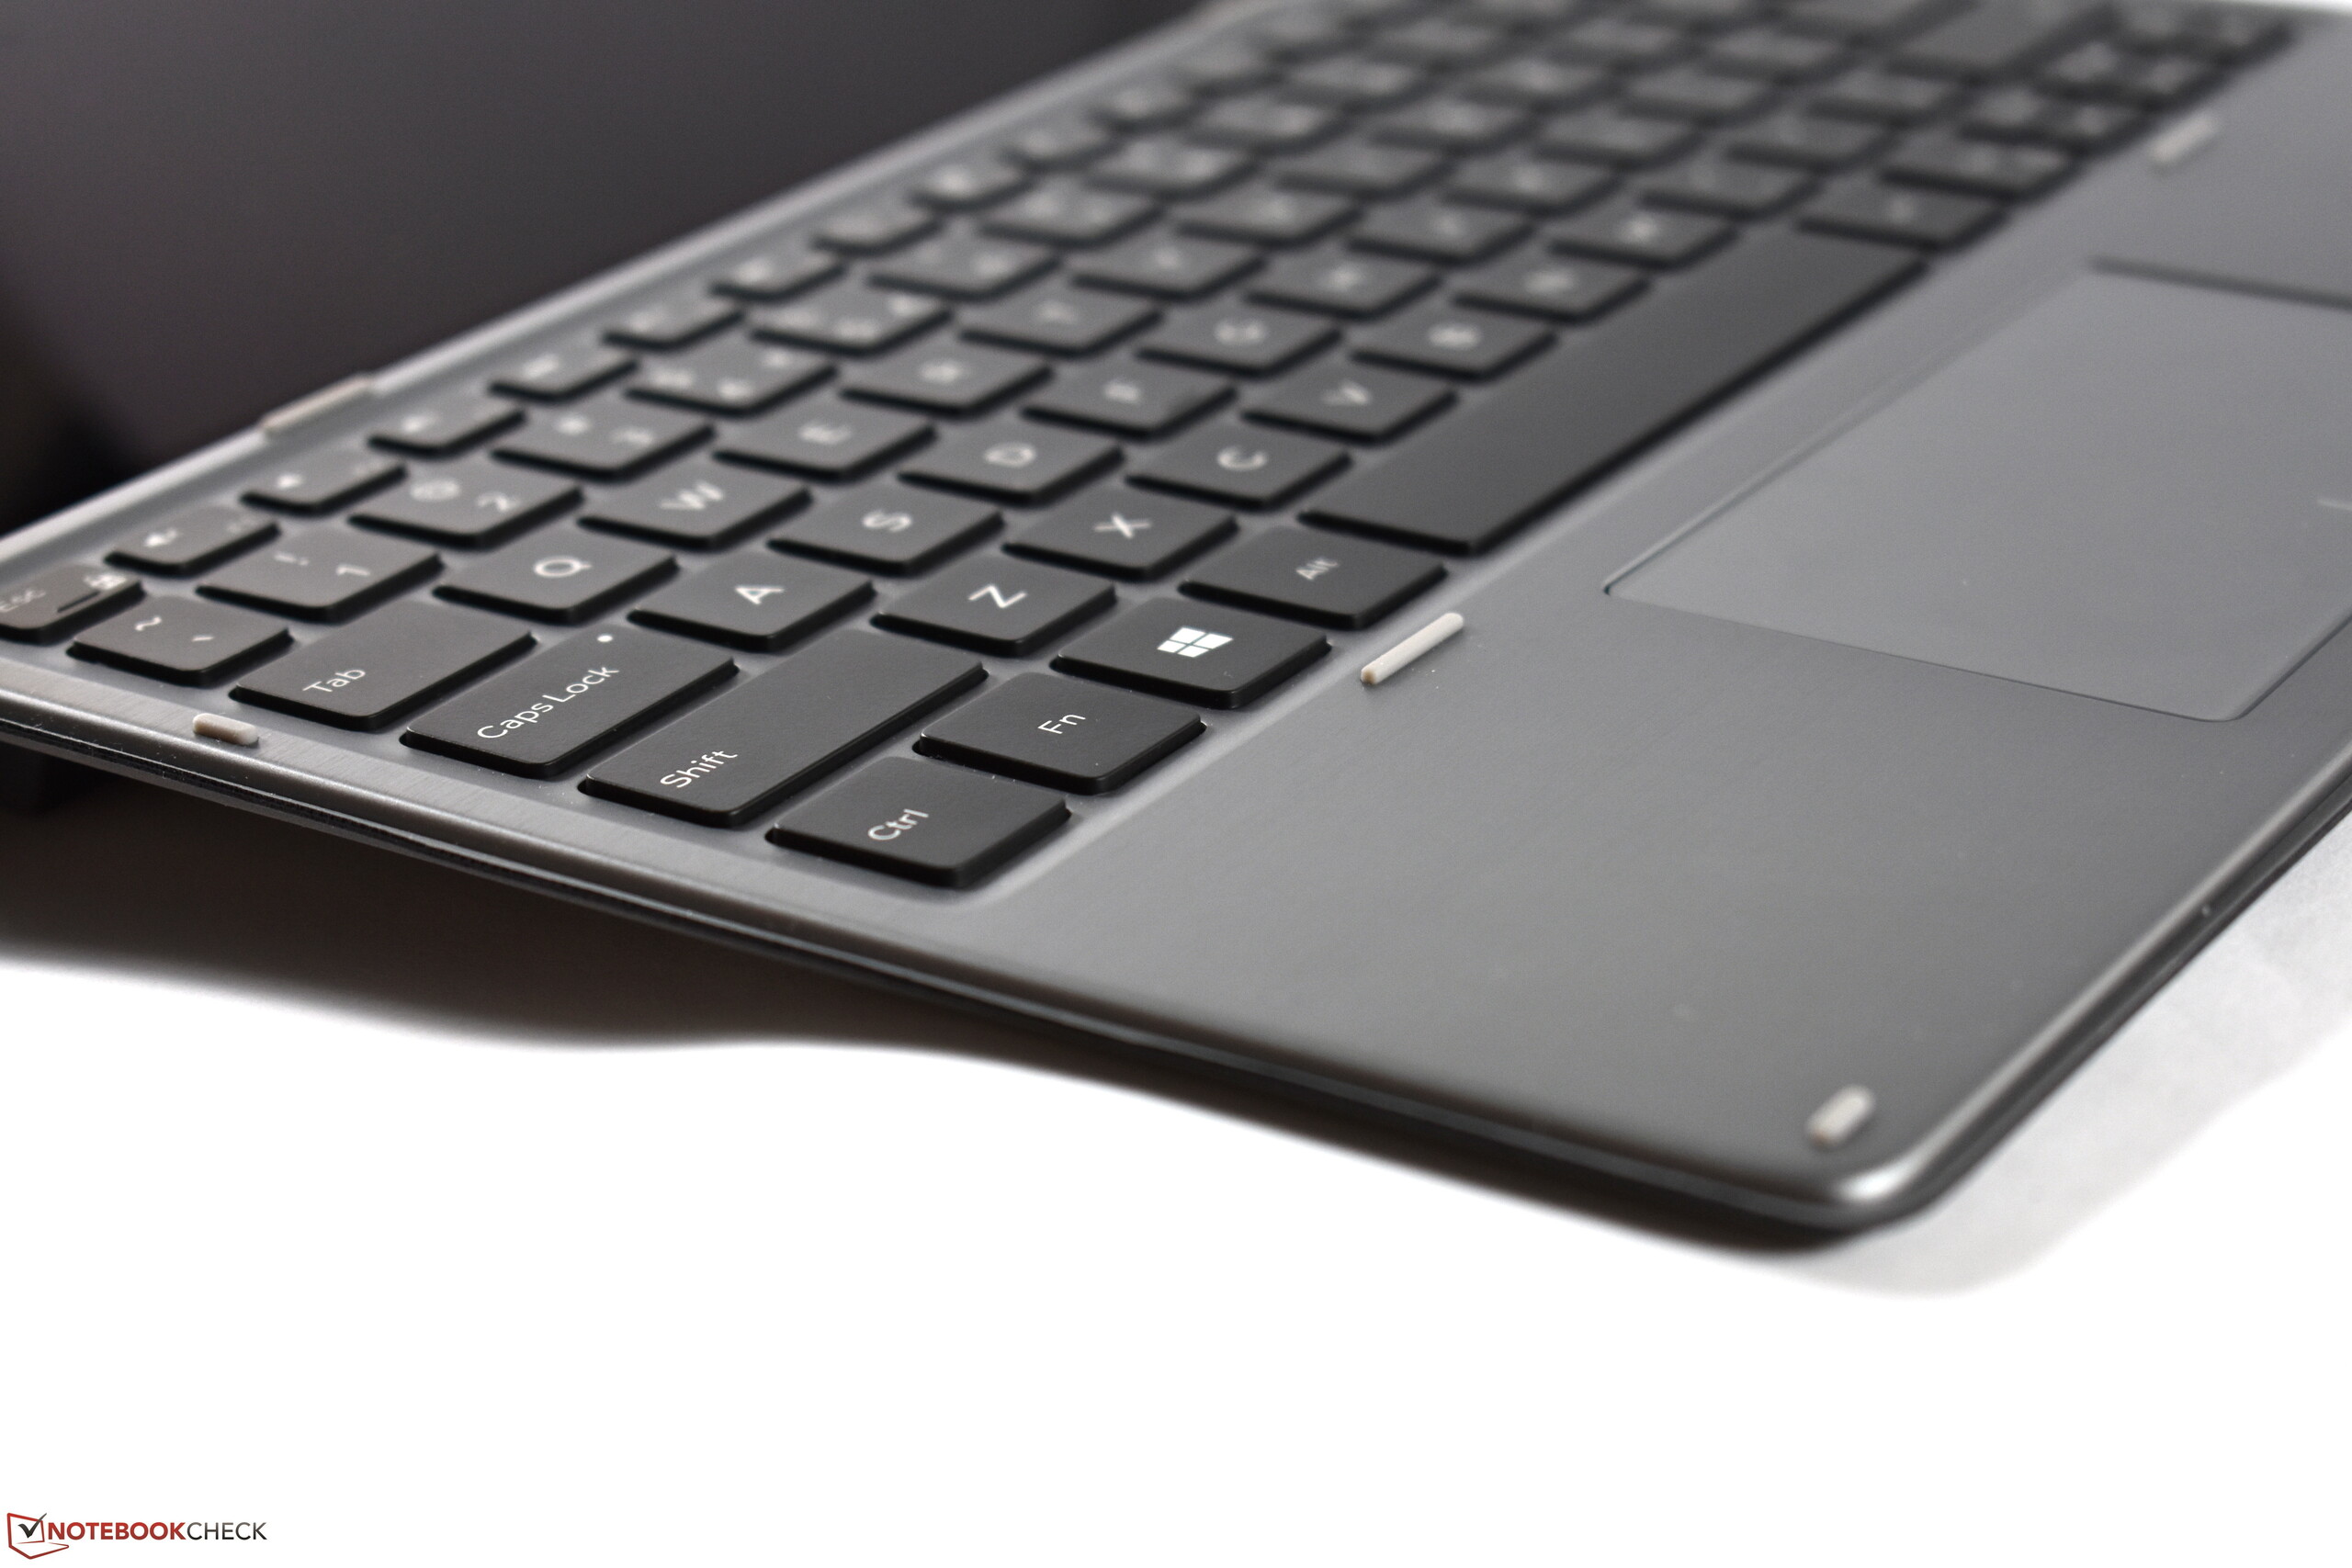
En av styrkorna med enheter från den här kategorin är definitivt skärmarna, där även Dell Latitude 7200 2-in-1 använder det bekväma 3:2-formatet och har hög färgrymdstäckning. Nackdelar är istället en blank yta och lägre ljusstyrka jämfört med konkurrenterna, även om Dells dator definitivt inte presterar allt för dåligt på det området. Däremot är tangentbordet en svag punkt. Tangentbordsöverdraget saknar stabilitet vilket påverkar skrivupplevelsen negativt. Dessa två saker utgör de största skillnaderna gentemot en "riktig" laptop som Dell Latitude 7300.
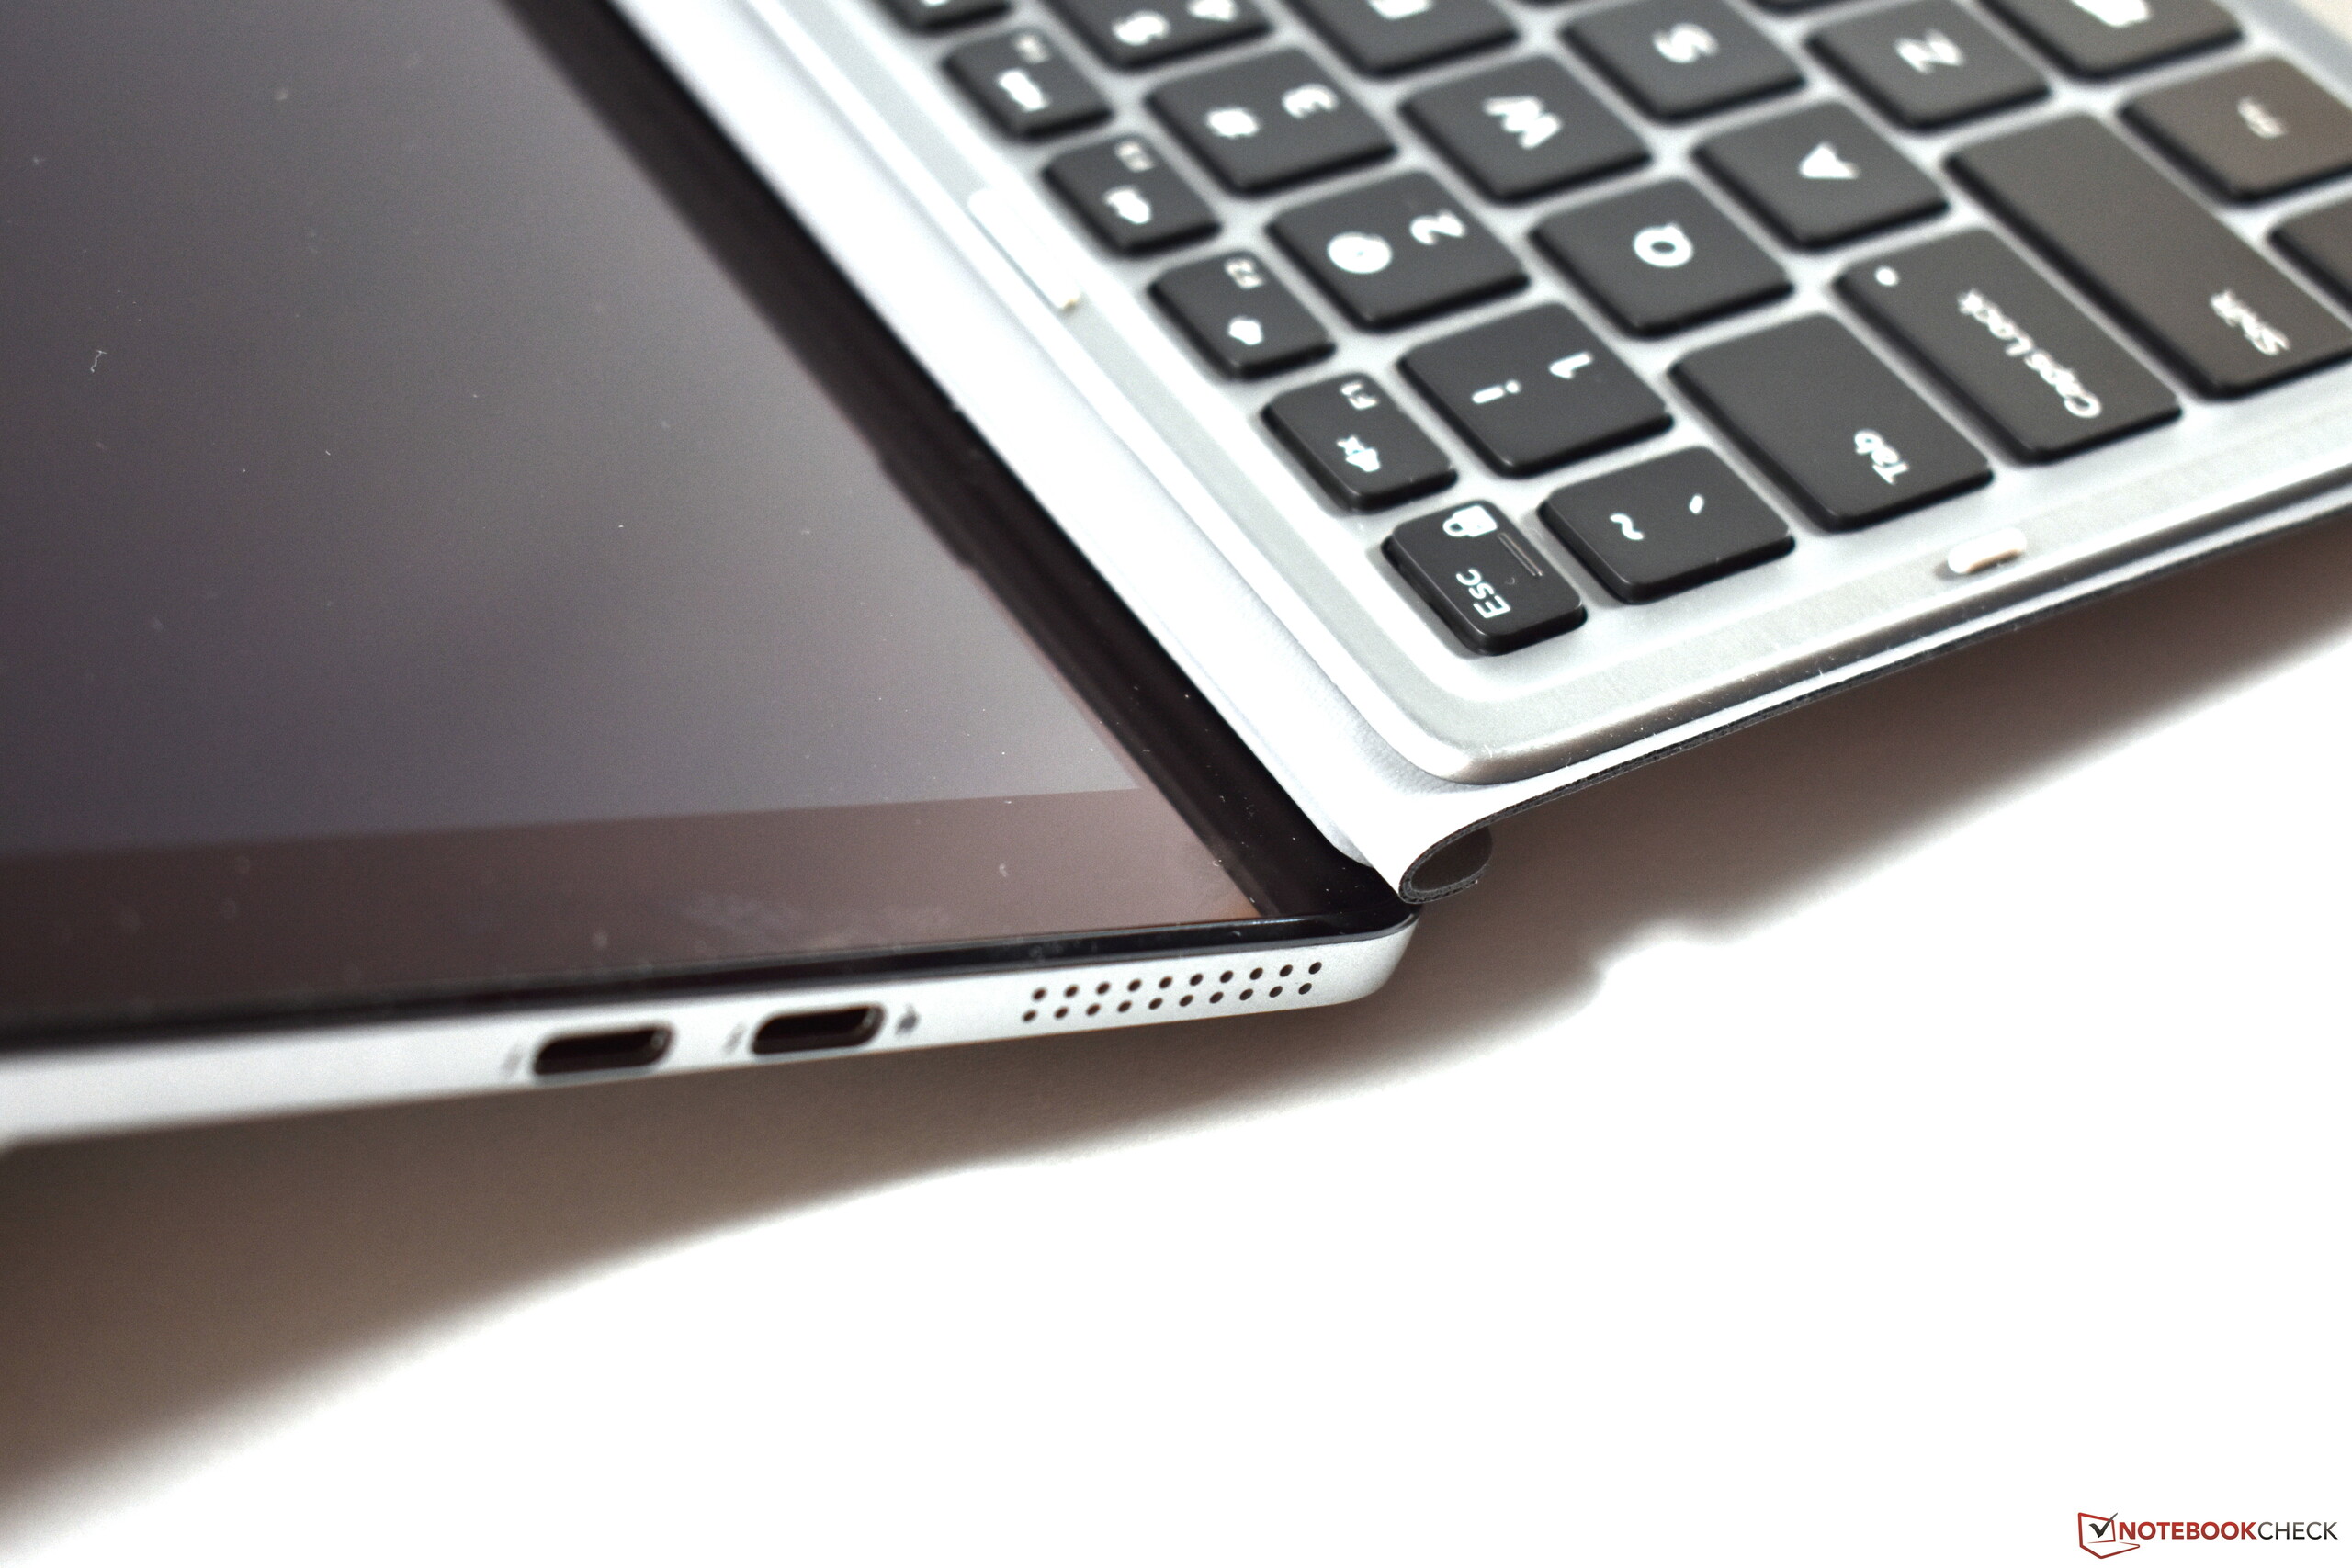
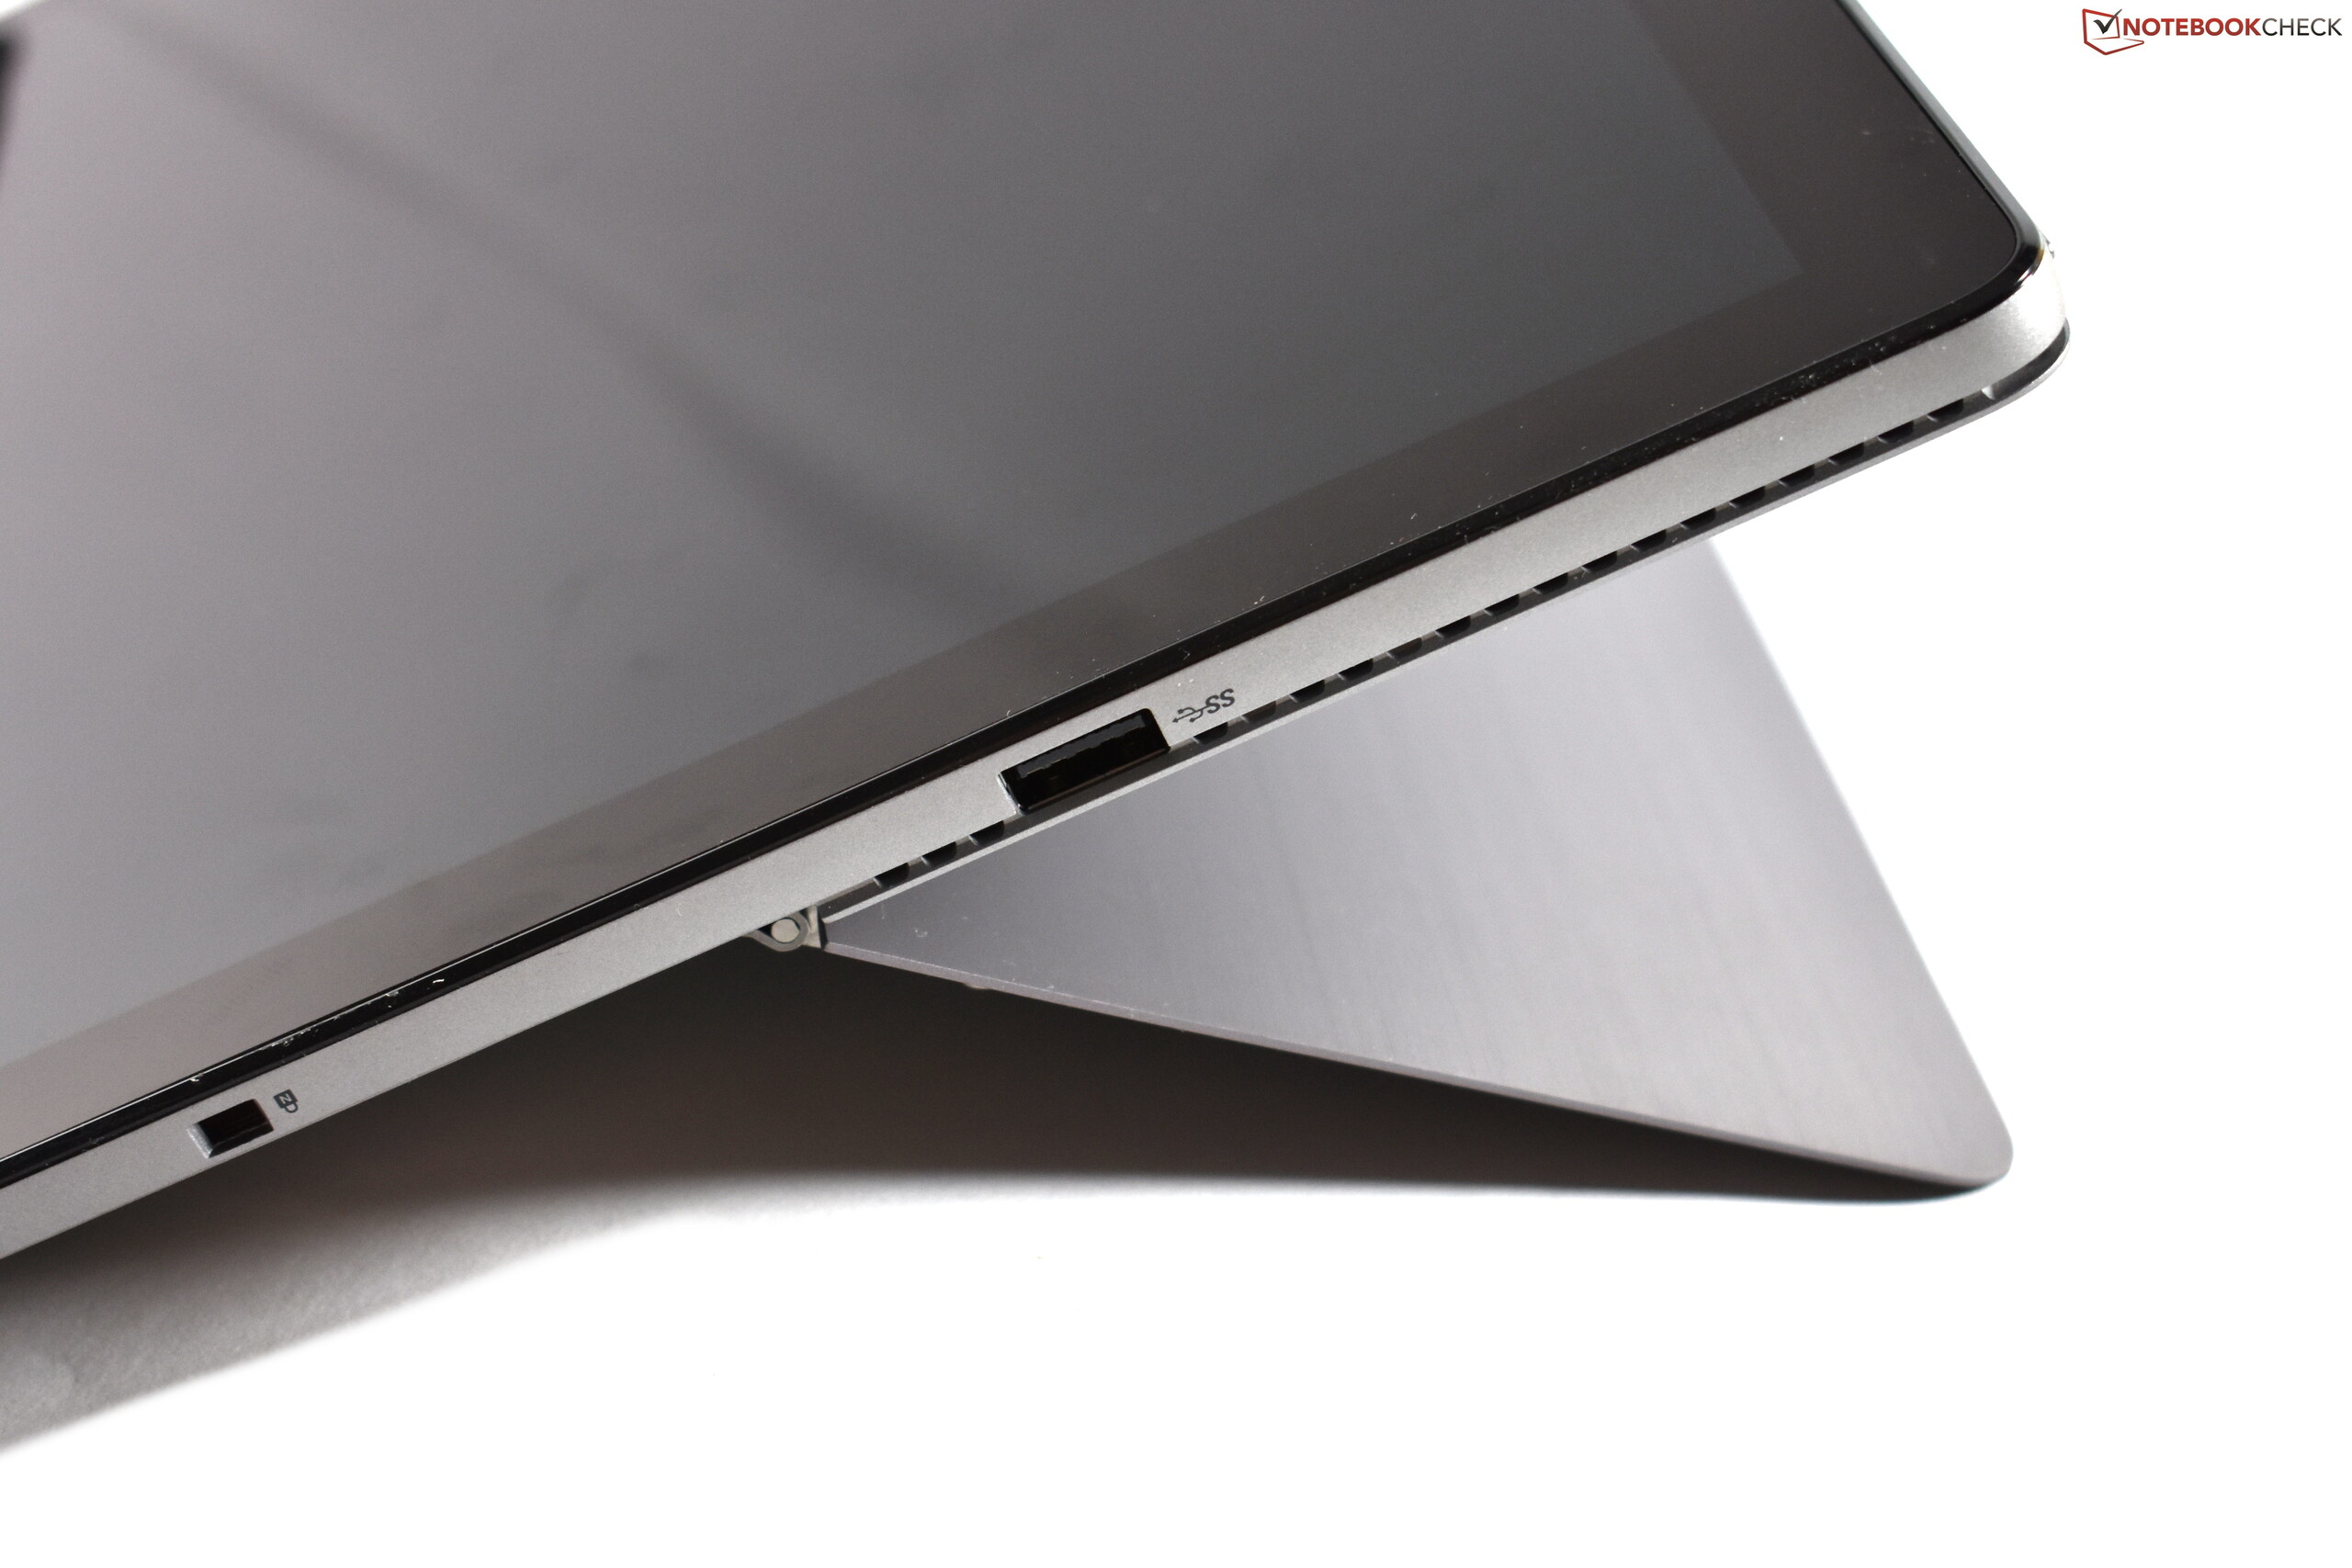
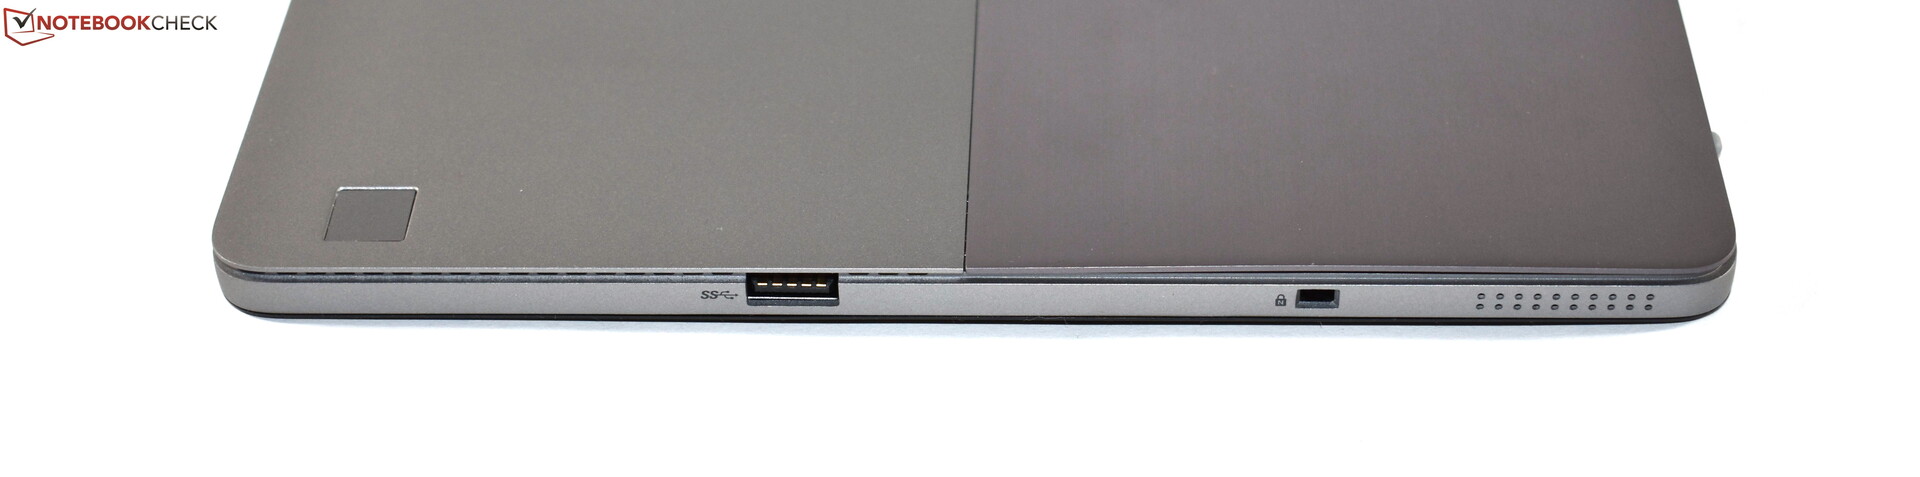
För att vara en omvandlingsbar enhet imponerar Dell Latitude 7200 2-in-1 med bra anslutbarhet och goda servicemöjligheter. Andra saker vi uppskattade med Dell Latitude 7200 2-in-1 var den tysta driften, det högkvalitativa höljet, den bekväma styrplattan och den utförliga garantin. En snabb microSD-kortläsare och inbyggt WWAN är ytterligare fördelar. På den negativa sidan finns CPU-prestandan, som är sämre än på exempelvis Microsoft Surface Pro 6.
Dell gör inga misstag här, så vi kan med gott samvete rekommendera Dell Latitude 7200 2-in-1.
För att sammanfatta så kan vi rekommendera Dell Latitude 7200 2-in-1 då det är en riktigt bra surfplatta för företaget. Men om du vill köpa den får du fundera igenom vad du prioriterar. Om du tycker skärmen är det viktigaste kanske en surfplatta är en bättre lösning. Om det är tangentbordet är det istället bättre du skaffar en vanlig laptop såsom Dell Latitude 7300.
Dell Latitude 7200
- 09/26/2019 v7 (old)
Benjamin Herzig