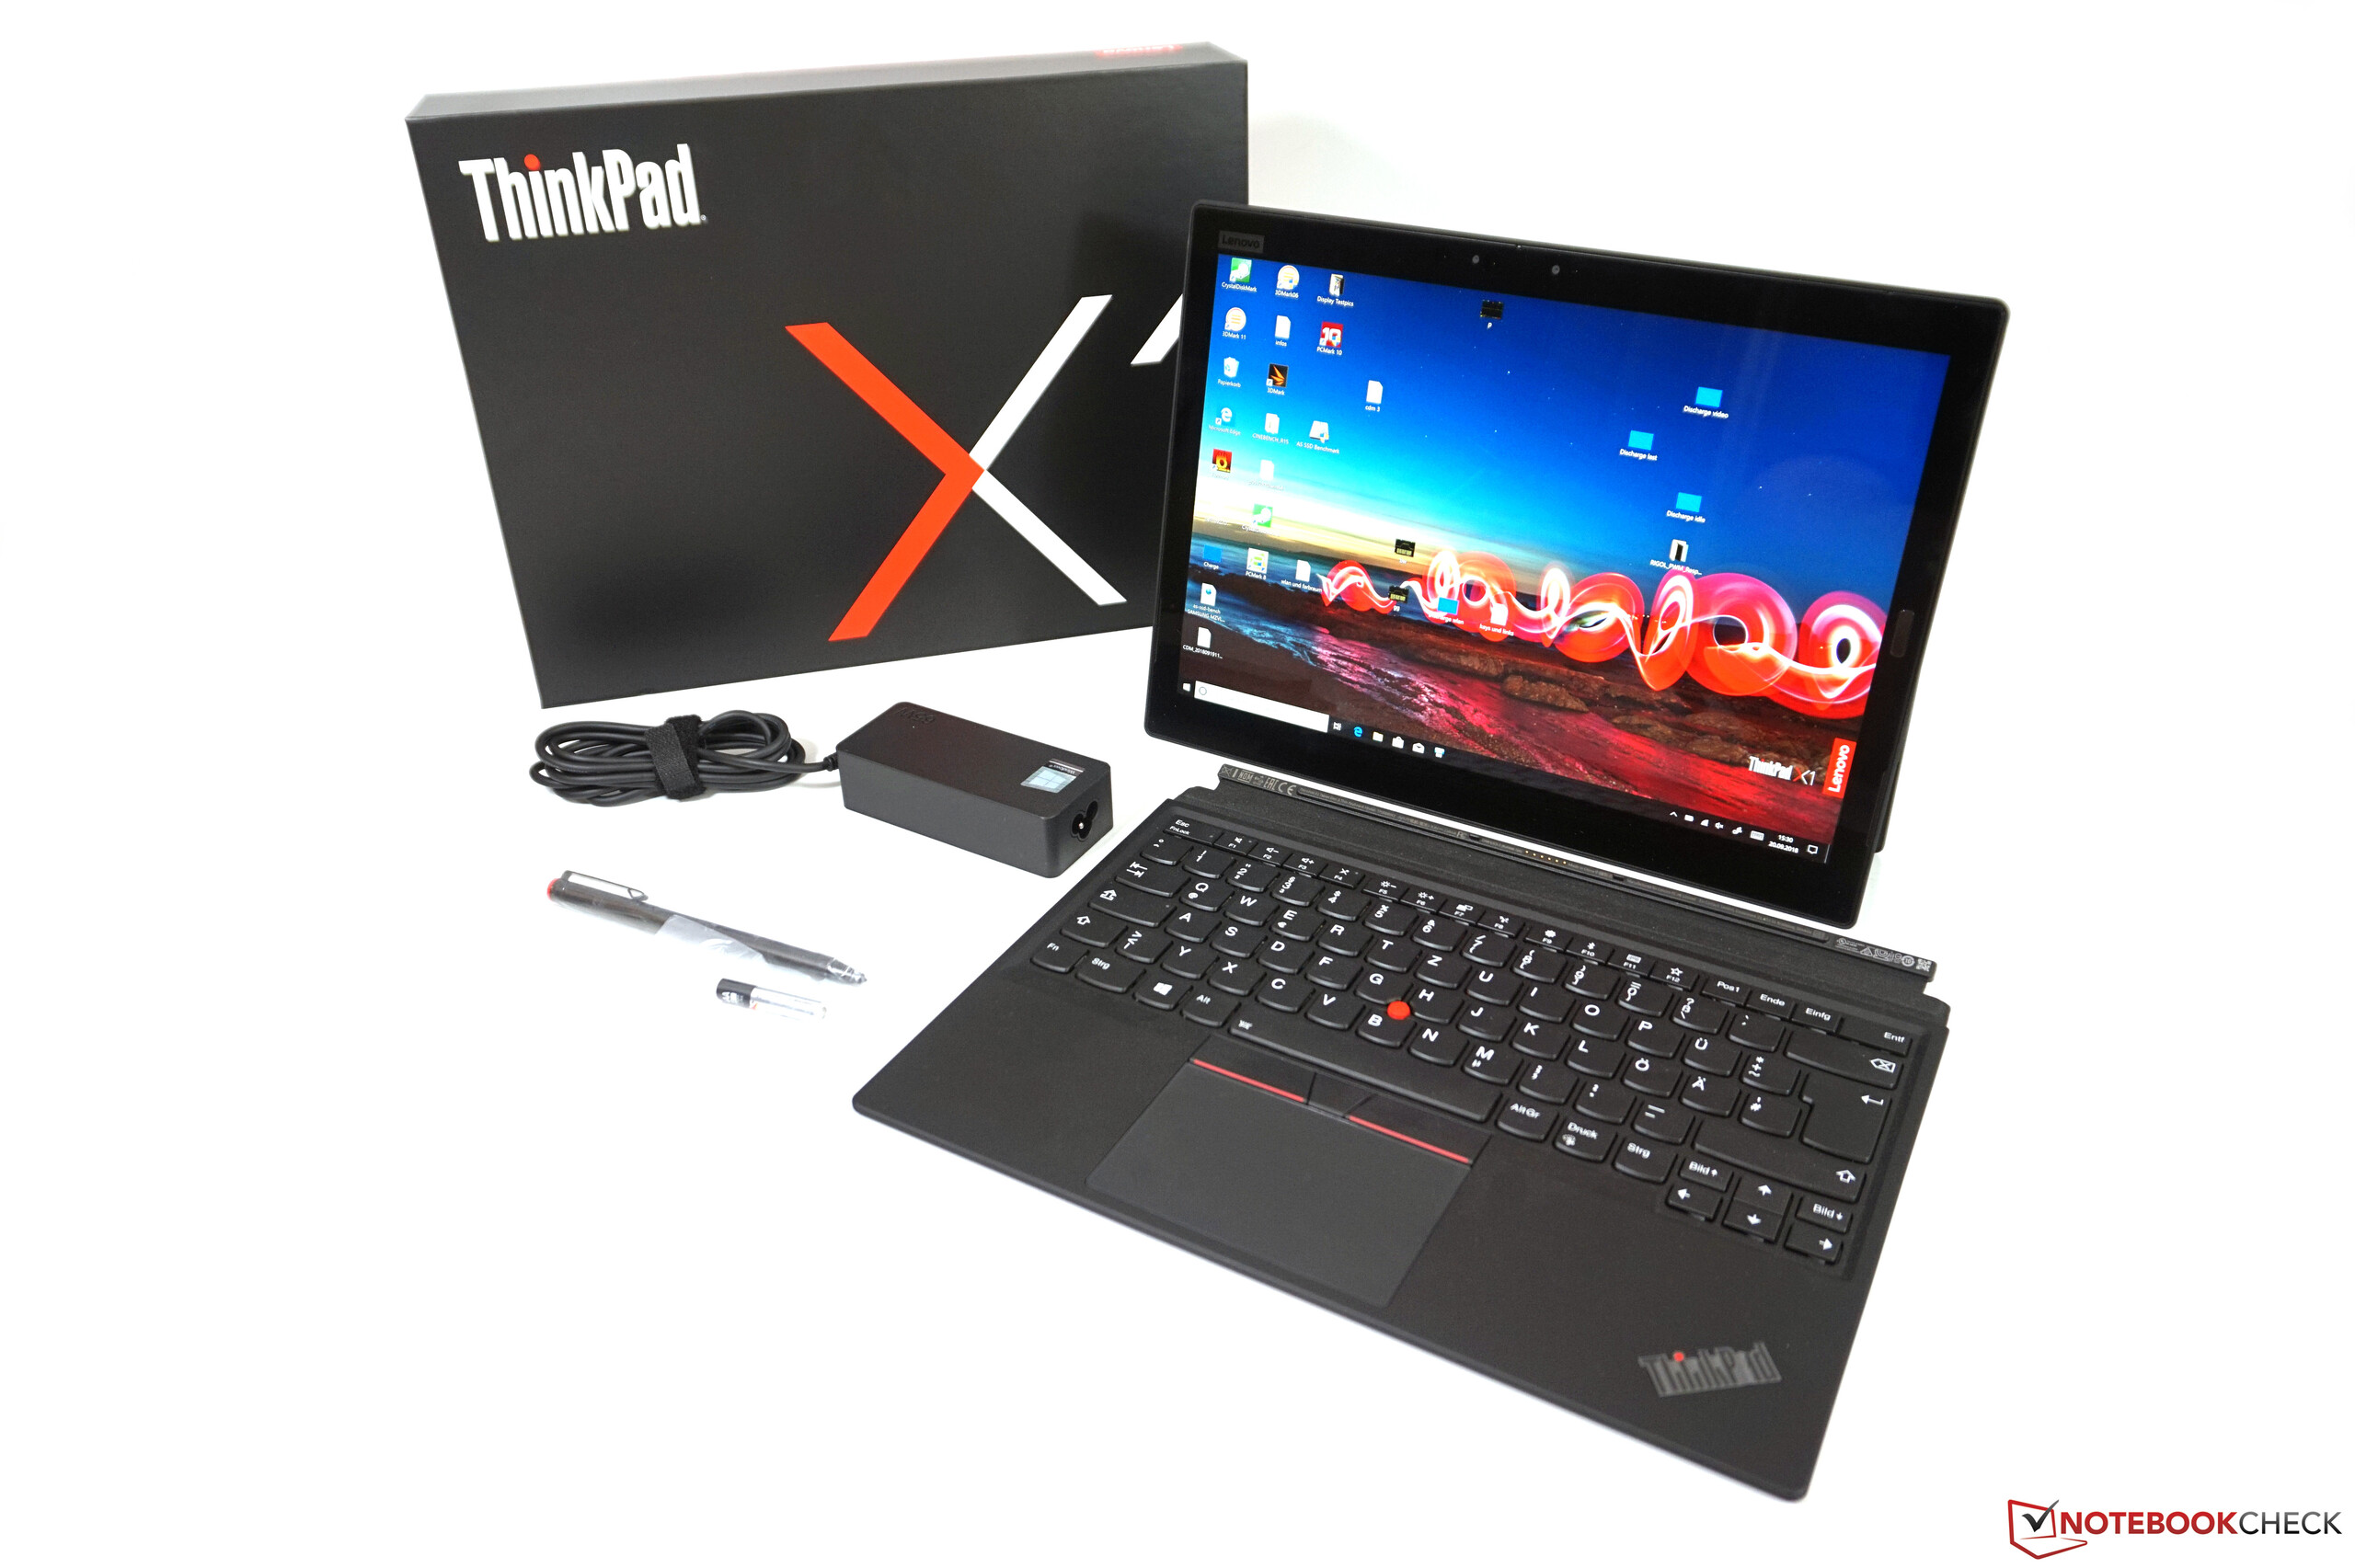
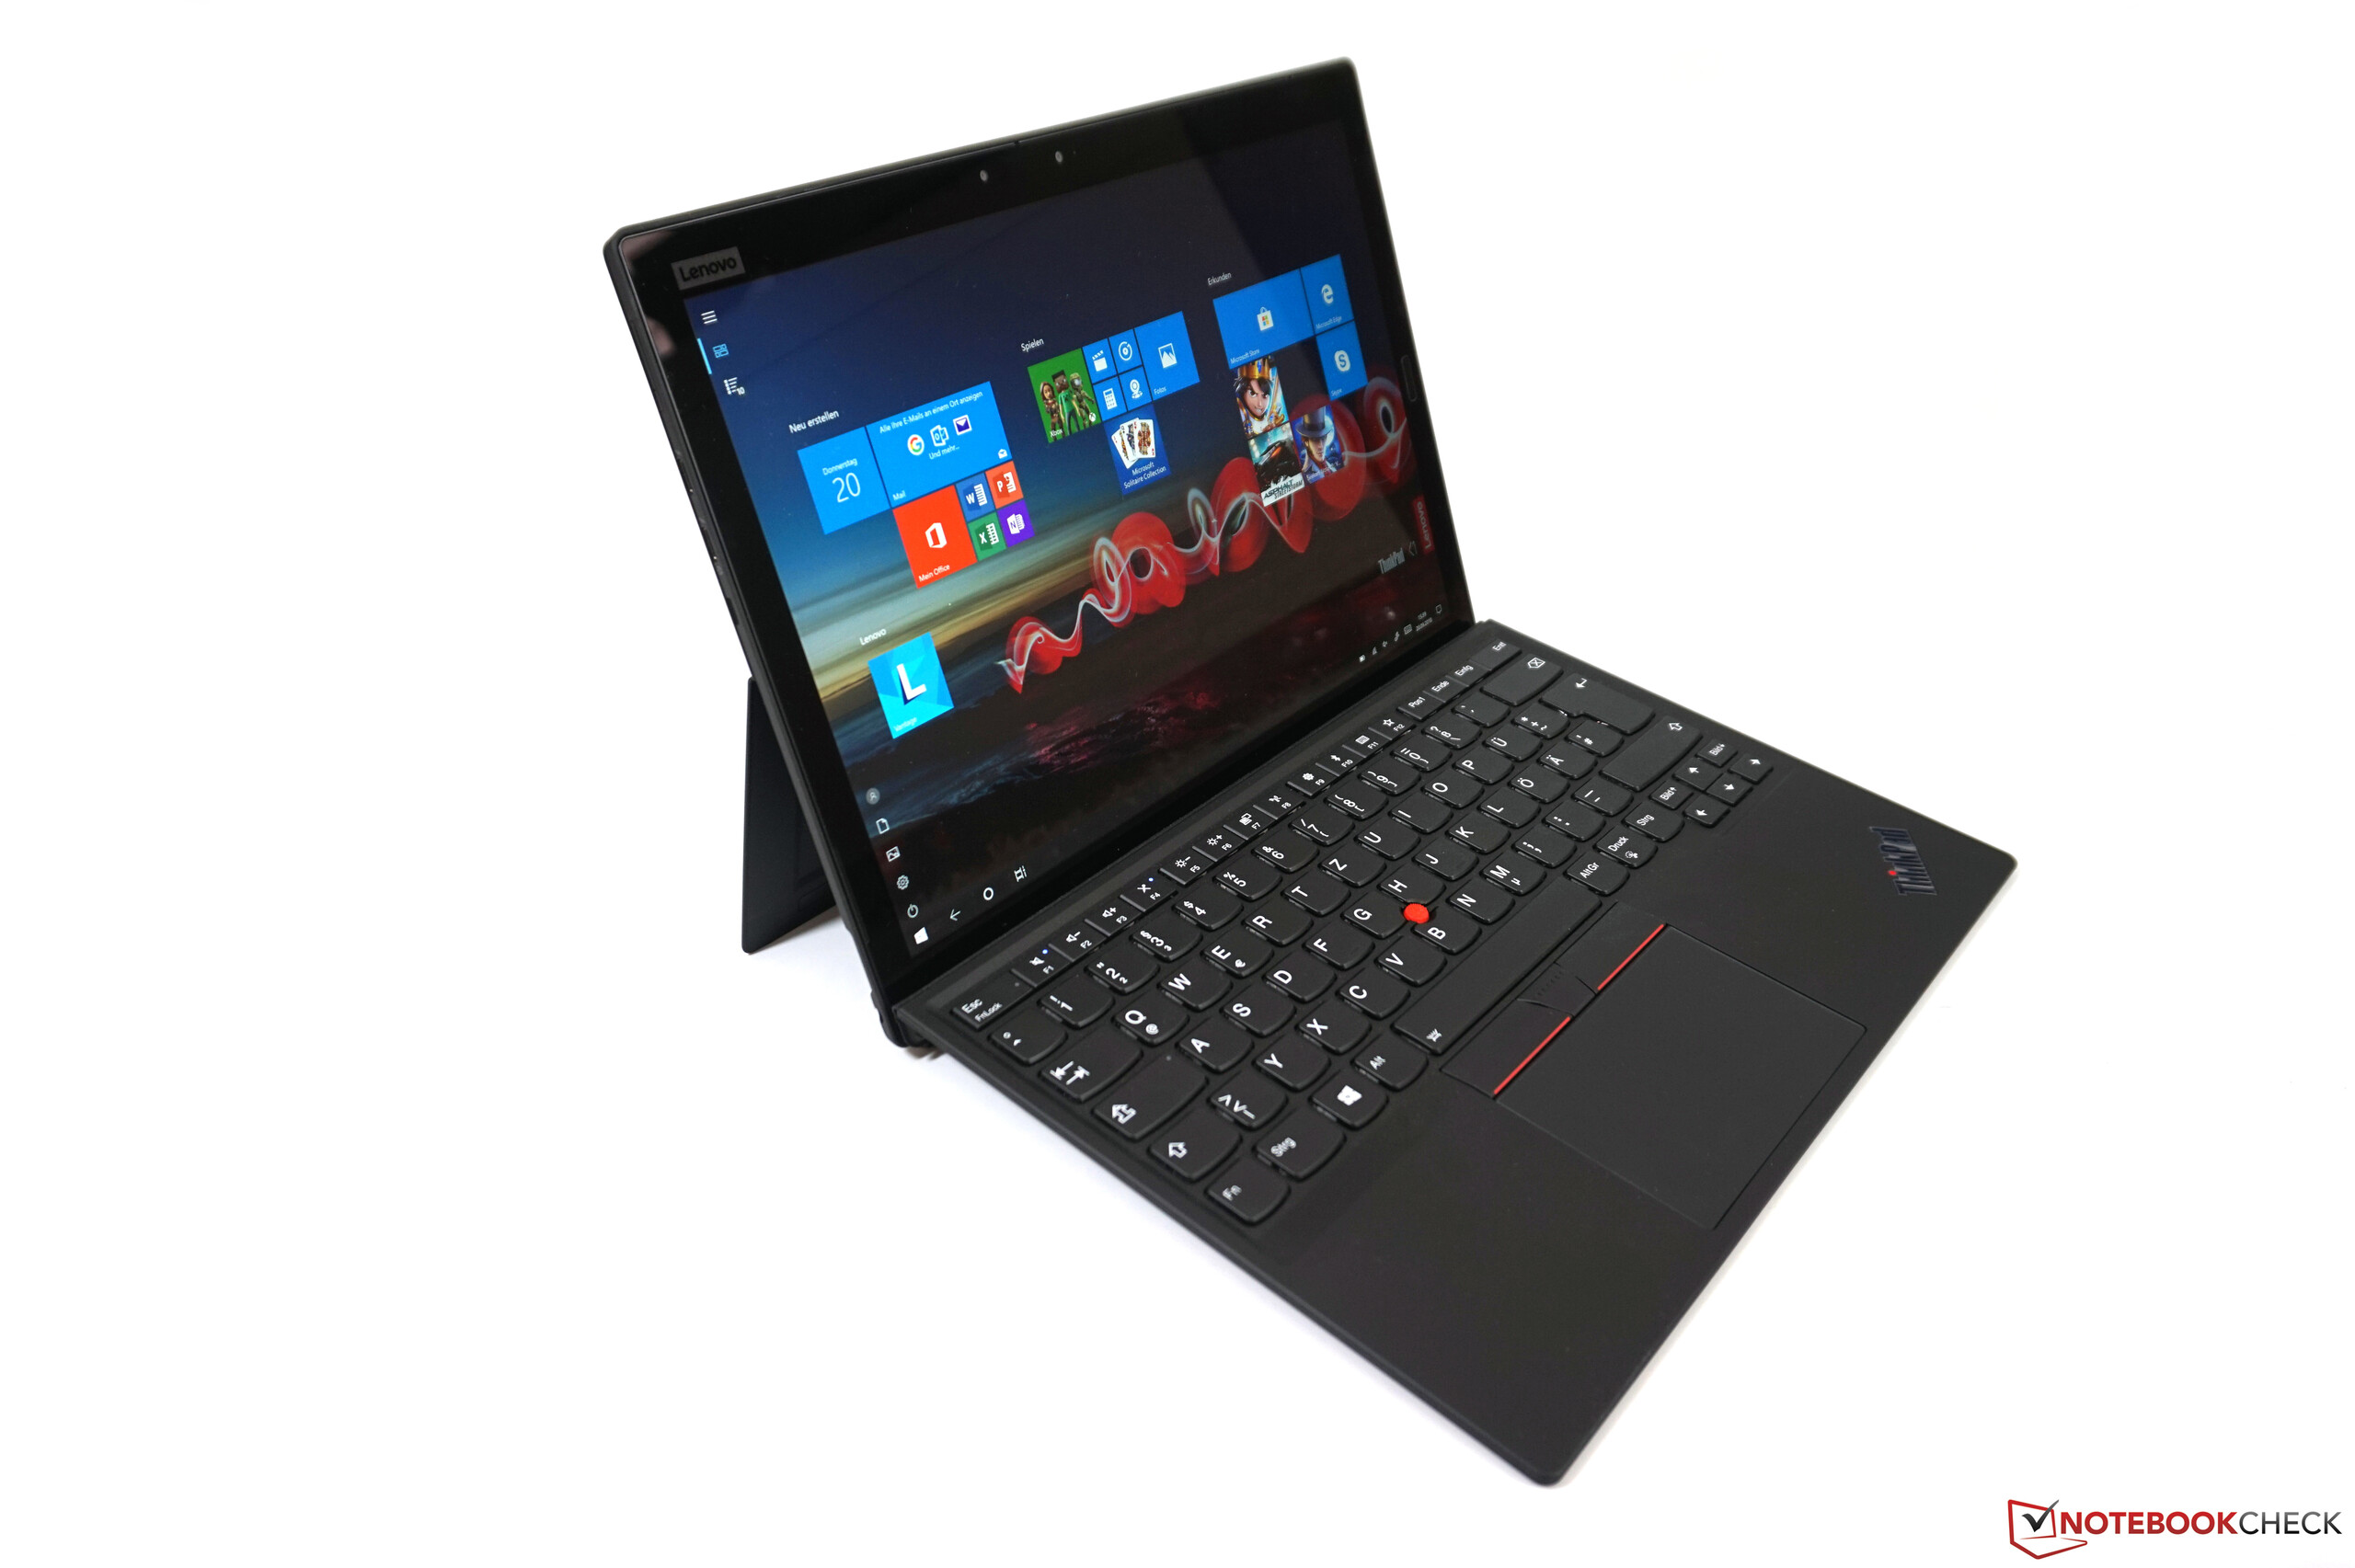
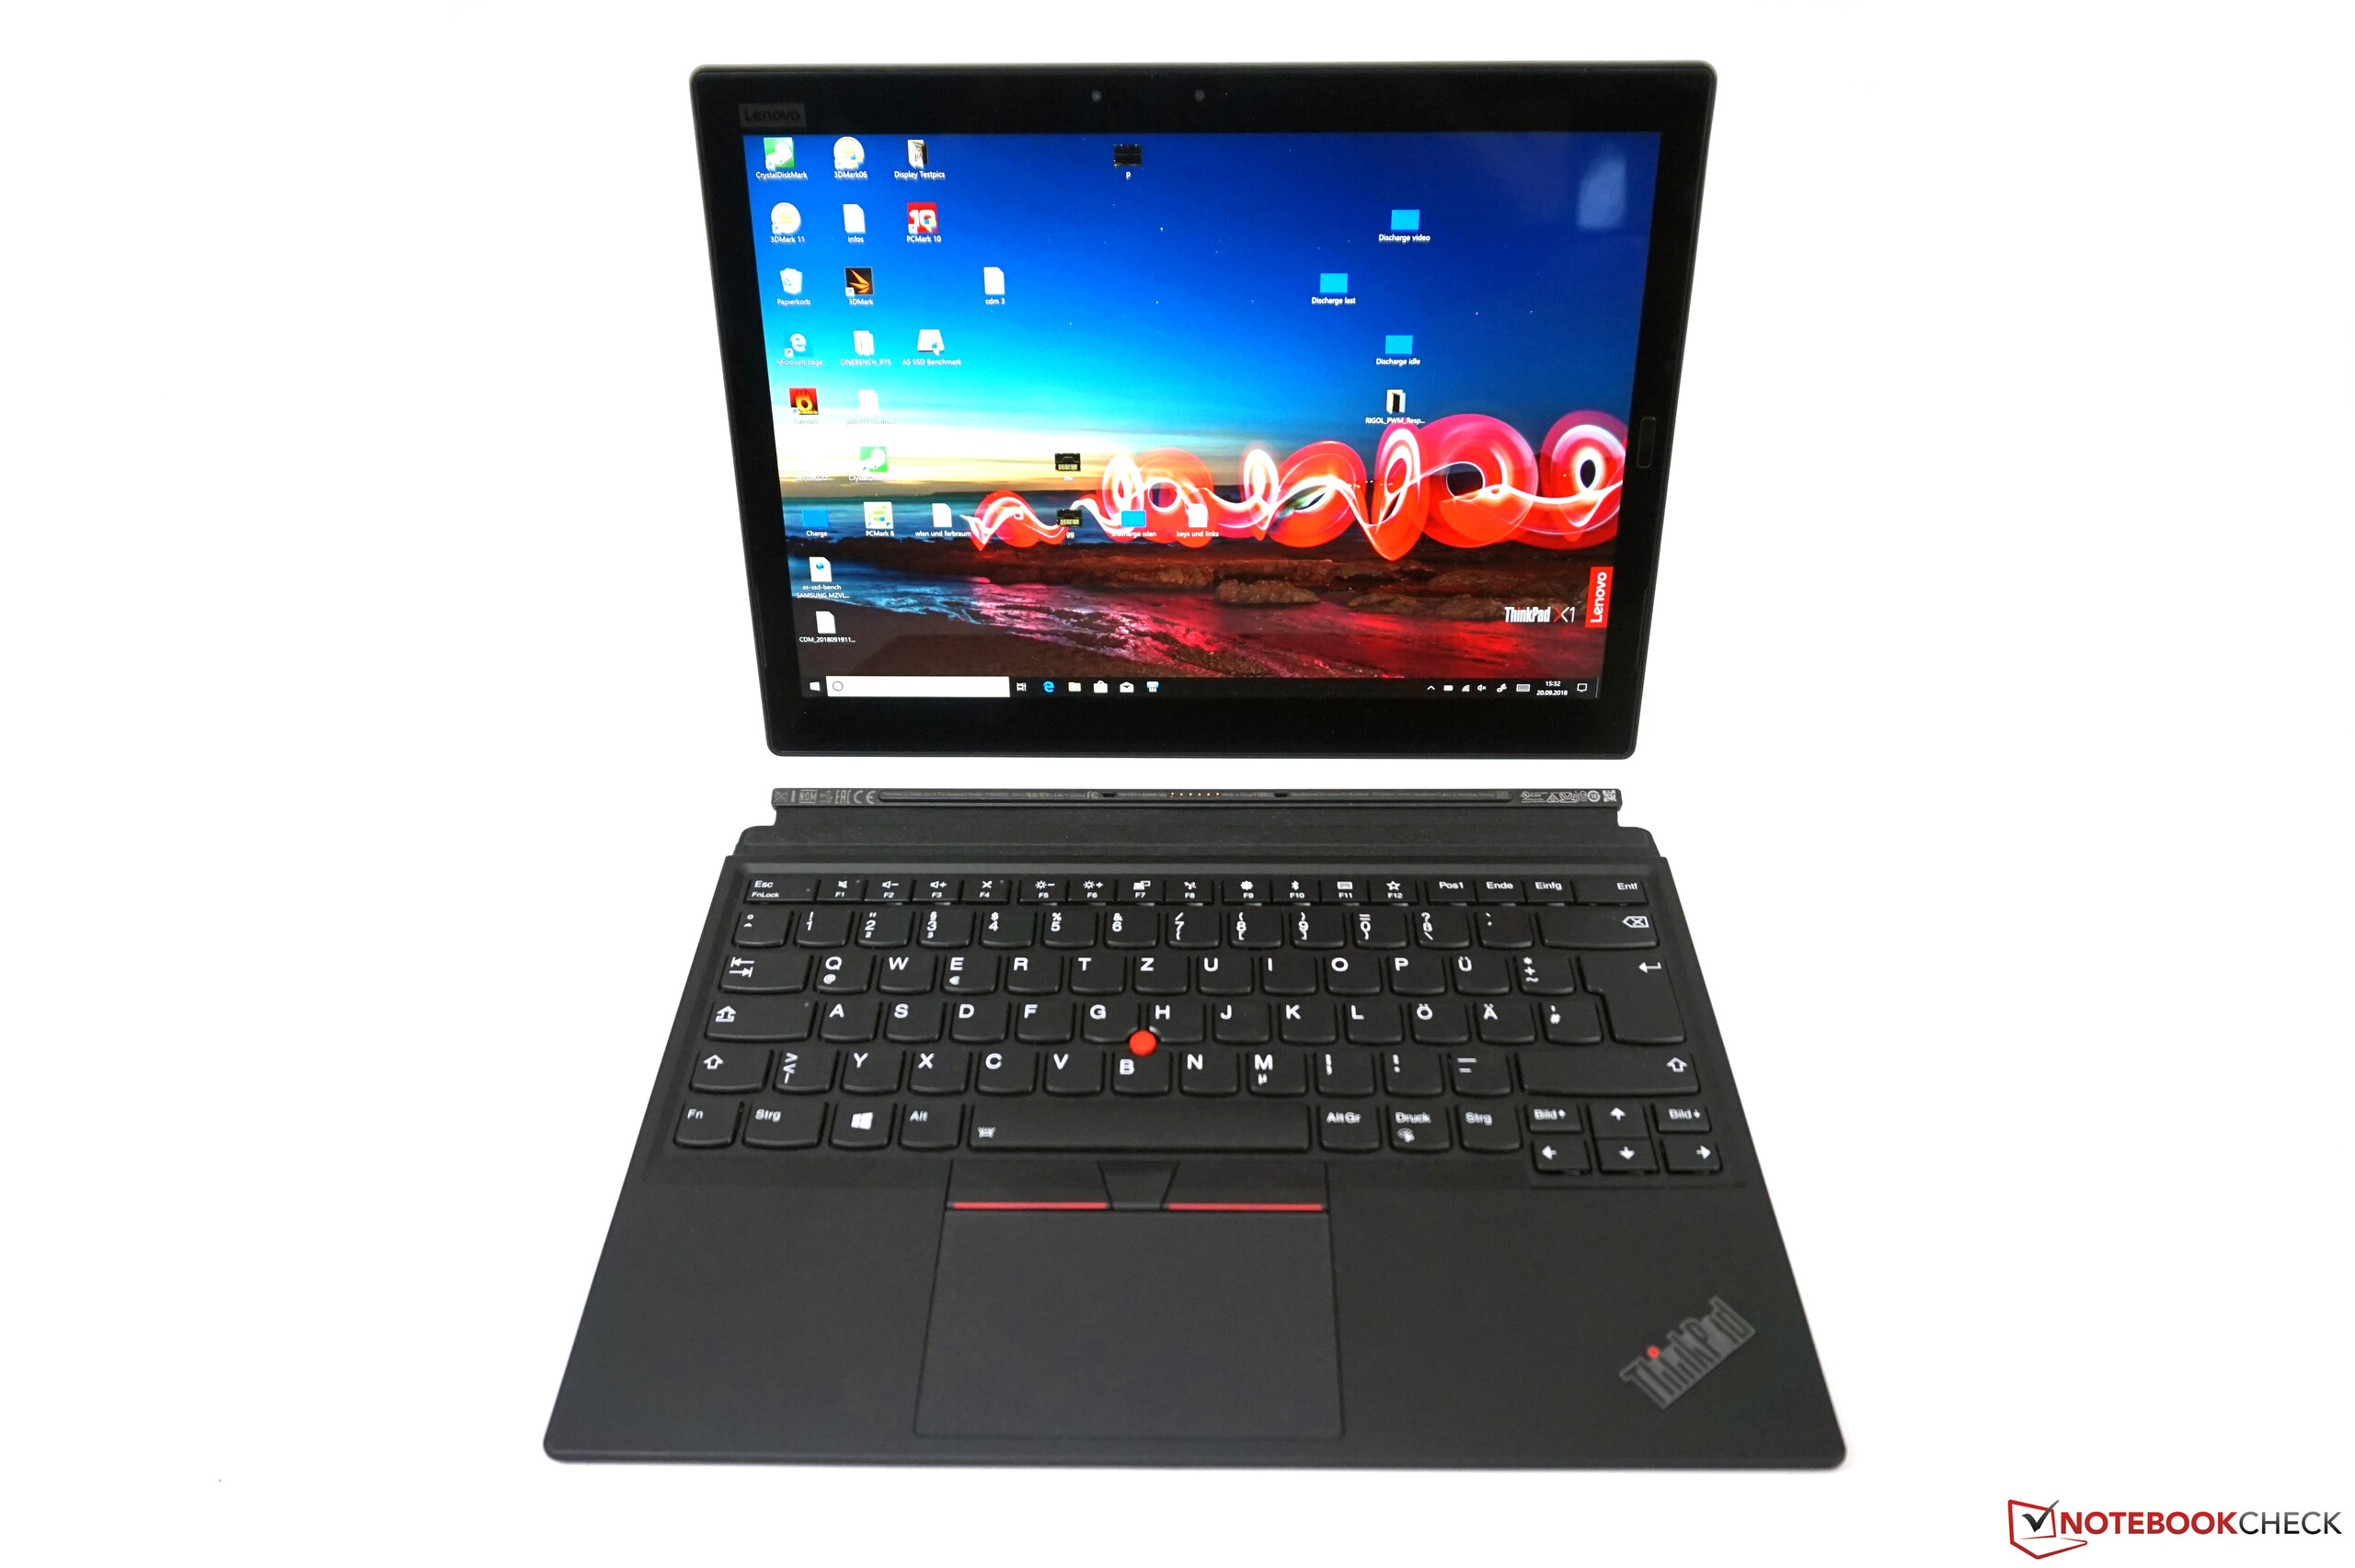
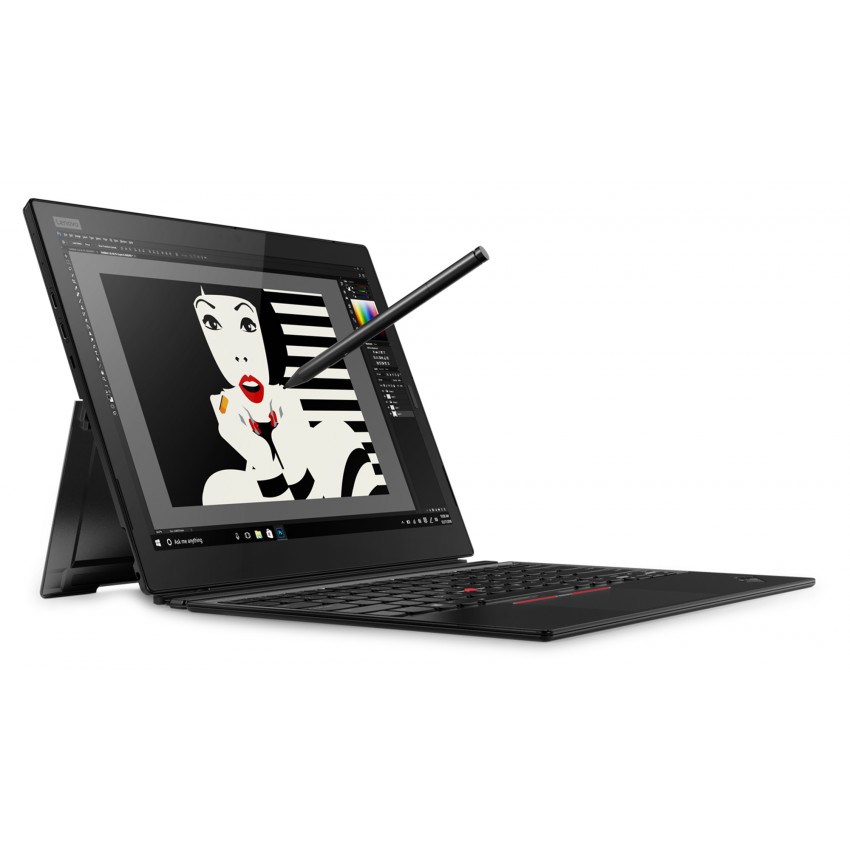
Test: Lenovo ThinkPad X1 Tablet 2018 (i5, 3K-IPS) Omvandlingsbar (Sammanfattning)
| SD Card Reader | |
| average JPG Copy Test (av. of 3 runs) | |
| Dell Latitude 5290 2-in-1 (Toshiba Exceria Pro M501 UHS-II) | |
| Lenovo ThinkPad X1 Tablet G3-20KJ001NGE (Toshiba Exceria Pro M501 UHS-II) | |
| Microsoft Surface Pro 6, Core i7, 512 GB (Toshiba Exceria Pro M501 microSDXC 64GB) | |
| Lenovo ThinkPad X1 Tablet Gen 2 (Toshiba Exceria Pro SDXC 64 GB UHS-II) | |
| Genomsnitt av klass Convertible (29.4 - 186, n=21, senaste 2 åren) | |
| maximum AS SSD Seq Read Test (1GB) | |
| Dell Latitude 5290 2-in-1 (Toshiba Exceria Pro M501 UHS-II) | |
| Genomsnitt av klass Convertible (67.5 - 254, n=20, senaste 2 åren) | |
| Lenovo ThinkPad X1 Tablet Gen 2 (Toshiba Exceria Pro SDXC 64 GB UHS-II) | |
| Microsoft Surface Pro 6, Core i7, 512 GB (Toshiba Exceria Pro M501 microSDXC 64GB) | |
| Lenovo ThinkPad X1 Tablet G3-20KJ001NGE (Toshiba Exceria Pro M501 UHS-II) | |
| Networking | |
| iperf3 transmit AX12 | |
| HP Elite x2 1013 G3-2TT14EA | |
| Toshiba Portege X30T-E-109 | |
| Microsoft Surface Pro 6, Core i7, 512 GB | |
| Lenovo ThinkPad X1 Tablet G3-20KJ001NGE | |
| Lenovo ThinkPad X1 Tablet Gen 2 | |
| Dell Latitude 5290 2-in-1 | |
| iperf3 receive AX12 | |
| Dell Latitude 5290 2-in-1 | |
| Lenovo ThinkPad X1 Tablet G3-20KJ001NGE | |
| Microsoft Surface Pro 6, Core i7, 512 GB | |
| Lenovo ThinkPad X1 Tablet Gen 2 | |
| Toshiba Portege X30T-E-109 | |
| HP Elite x2 1013 G3-2TT14EA | |
| |||||||||||||||||||||||||
Distribution av ljusstyrkan: 76 %
Mitt på batteriet: 470 cd/m²
Kontrast: 1436:1 (Svärta: 0.33 cd/m²)
ΔE ColorChecker Calman: 3.2 | ∀{0.5-29.43 Ø4.71}
calibrated: 0.9
ΔE Greyscale Calman: 4.5 | ∀{0.09-98 Ø4.96}
99.4% sRGB (Argyll 1.6.3 3D)
64% AdobeRGB 1998 (Argyll 1.6.3 3D)
69.3% AdobeRGB 1998 (Argyll 3D)
99.1% sRGB (Argyll 3D)
68.1% Display P3 (Argyll 3D)
Gamma: 2.07
CCT: 5881 K
| Lenovo ThinkPad X1 Tablet G3-20KJ001NGE LP130QP1-SPA1, , 3000x2000, 13" | HP Elite x2 1013 G3-2TT14EA AU Optronics AUO101A, , 3000x2000, 13" | Microsoft Surface Pro 6, Core i7, 512 GB LGPhilips LP123WQ112604, , 2736x1824, 12.3" | Dell Latitude 5290 2-in-1 SHP1479, , 1920x1280, 12.3" | Toshiba Portege X30T-E-109 Toshiba TOS508F, , 1920x1080, 13.3" | Lenovo ThinkPad X1 Tablet Gen 2 LSN120QL01L01, , 2160x1440, 12" | |
|---|---|---|---|---|---|---|
| Display | -2% | -3% | 2% | -5% | ||
| Display P3 Coverage (%) | 68.1 67.8 | 67.5 -1% | 67.1 -1% | 70.5 4% | 67.2 -1% | |
| sRGB Coverage (%) | 99.4 99.1 | 96.7 -3% | 95.5 -4% | 98.6 -1% | 90.8 -9% | |
| AdobeRGB 1998 Coverage (%) | 69.9 69.3 | 68.2 -2% | 67.9 -3% | 71.5 2% | 66.5 -5% | |
| Response Times | 20% | 25% | -3% | 12% | 43% | |
| Response Time Grey 50% / Grey 80% * (ms) | 47.2 ? | 47 ? -0% | 43 ? 9% | 56.8 ? -20% | 42 ? 11% | 28.4 ? 40% |
| Response Time Black / White * (ms) | 42.4 ? | 26 ? 39% | 25 ? 41% | 36 ? 15% | 37 ? 13% | 22.8 ? 46% |
| PWM Frequency (Hz) | 22000 ? | 1852 ? | 17000 ? | 221.2 ? | ||
| Screen | -18% | -5% | -16% | -39% | -23% | |
| Brightness middle (cd/m²) | 474 | 452 -5% | 484 2% | 548 16% | 350 -26% | 388.1 -18% |
| Brightness (cd/m²) | 418 | 412 -1% | 473 13% | 545 30% | 343 -18% | 344 -18% |
| Brightness Distribution (%) | 76 | 85 12% | 91 20% | 86 13% | 73 -4% | 78 3% |
| Black Level * (cd/m²) | 0.33 | 0.48 -45% | 0.33 -0% | 0.51 -55% | 0.29 12% | 0.39 -18% |
| Contrast (:1) | 1436 | 942 -34% | 1467 2% | 1075 -25% | 1207 -16% | 995 -31% |
| Colorchecker dE 2000 * | 3.2 | 4.05 -27% | 4.29 -34% | 3.65 -14% | 6.36 -99% | 4.6 -44% |
| Colorchecker dE 2000 max. * | 6.1 | 6.64 -9% | 6.46 -6% | 7.15 -17% | 11.63 -91% | 9.1 -49% |
| Colorchecker dE 2000 calibrated * | 0.9 | 1.56 -73% | 1.34 -49% | 1.81 -101% | 1.7 -89% | |
| Greyscale dE 2000 * | 4.5 | 4.87 -8% | 4.3 4% | 5.5 -22% | 8.04 -79% | 6.1 -36% |
| Gamma | 2.07 106% | 2.71 81% | 2.51 88% | 2.154 102% | 2.47 89% | 2.07 106% |
| CCT | 5881 111% | 7160 91% | 7315 89% | 7052 92% | 7716 84% | 7104 91% |
| Color Space (Percent of AdobeRGB 1998) (%) | 64 | 62 -3% | 62 -3% | 65.2 2% | 59 -8% | 59 -8% |
| Color Space (Percent of sRGB) (%) | 99.4 | 97 -2% | 95 -4% | 99.1 0% | 91 -8% | 91 -8% |
| Totalt genomsnitt (program/inställningar) | 0% /
-10% | 6% /
-1% | -6% /
-11% | -11% /
-26% | 10% /
-12% |
* ... mindre är bättre
Visa svarstider
| ↔ Svarstid svart till vitt | ||
|---|---|---|
| 42.4 ms ... stiga ↗ och falla ↘ kombinerat | ↗ 19.6 ms stiga | 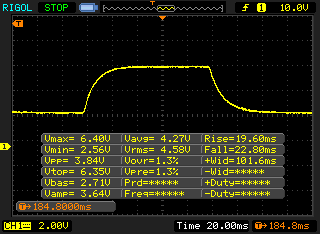 |
| ↘ 22.8 ms hösten | ||
| Skärmen visar långsamma svarsfrekvenser i våra tester och kommer att vara otillfredsställande för spelare. I jämförelse sträcker sig alla testade enheter från 0.1 (minst) till 240 (maximalt) ms. » 98 % av alla enheter är bättre. Detta innebär att den uppmätta svarstiden är sämre än genomsnittet av alla testade enheter (19.8 ms). | ||
| ↔ Svarstid 50 % grått till 80 % grått | ||
| 47.2 ms ... stiga ↗ och falla ↘ kombinerat | ↗ 21.2 ms stiga | 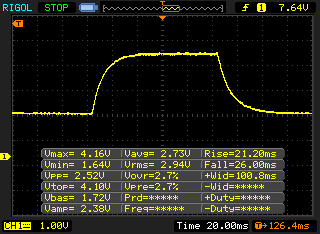 |
| ↘ 26 ms hösten | ||
| Skärmen visar långsamma svarsfrekvenser i våra tester och kommer att vara otillfredsställande för spelare. I jämförelse sträcker sig alla testade enheter från 0.165 (minst) till 636 (maximalt) ms. » 82 % av alla enheter är bättre. Detta innebär att den uppmätta svarstiden är sämre än genomsnittet av alla testade enheter (31 ms). | ||
Skärmflimmer / PWM (Puls-Width Modulation)
| Skärmflimmer / PWM upptäcktes inte | 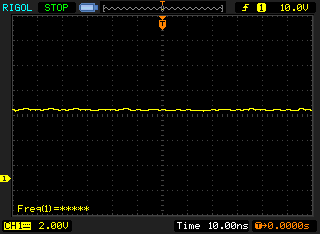 | ||
Som jämförelse: 52 % av alla testade enheter använder inte PWM för att dämpa skärmen. Om PWM upptäcktes mättes ett medelvärde av 7754 (minst: 5 - maximum: 343500) Hz. | |||

| Cinebench R15 | |
| CPU Single 64Bit | |
| Genomsnitt av klass Convertible (149.8 - 317, n=48, senaste 2 åren) | |
| Microsoft Surface Pro 6, Core i7, 512 GB | |
| Dell Latitude 5290 2-in-1 | |
| Lenovo ThinkPad X1 Tablet G3 LTE i7 | |
| HP Elite x2 1013 G3-2TT14EA | |
| Genomsnitt Intel Core i5-8250U (81 - 147, n=97) | |
| Lenovo ThinkPad X1 Tablet G3-20KJ001NGE | |
| Toshiba Portege X30T-E-109 | |
| Lenovo ThinkPad X1 Tablet Gen 2 | |
| CPU Multi 64Bit | |
| Genomsnitt av klass Convertible (478 - 4940, n=48, senaste 2 åren) | |
| Lenovo ThinkPad X1 Tablet G3-20KJ001NGE (Undervolting) | |
| Lenovo ThinkPad X1 Tablet G3-20KJ001NGE | |
| Lenovo ThinkPad X1 Tablet G3 LTE i7 | |
| Microsoft Surface Pro 6, Core i7, 512 GB | |
| Genomsnitt Intel Core i5-8250U (320 - 730, n=101) | |
| Dell Latitude 5290 2-in-1 | |
| HP Elite x2 1013 G3-2TT14EA | |
| Toshiba Portege X30T-E-109 | |
| Lenovo ThinkPad X1 Tablet Gen 2 | |
| PCMark 8 | |
| Home Score Accelerated v2 | |
| Genomsnitt av klass Convertible (n=1senaste 2 åren) | |
| Dell Latitude 5290 2-in-1 | |
| Genomsnitt Intel Core i5-8250U, Intel UHD Graphics 620 (2986 - 4458, n=69) | |
| Lenovo ThinkPad X1 Tablet G3-20KJ001NGE | |
| HP Elite x2 1013 G3-2TT14EA | |
| Microsoft Surface Pro 6, Core i7, 512 GB | |
| Lenovo ThinkPad X1 Tablet Gen 2 | |
| Toshiba Portege X30T-E-109 | |
| Work Score Accelerated v2 | |
| Genomsnitt av klass Convertible (n=1senaste 2 åren) | |
| Dell Latitude 5290 2-in-1 | |
| Genomsnitt Intel Core i5-8250U, Intel UHD Graphics 620 (2699 - 5106, n=58) | |
| Toshiba Portege X30T-E-109 | |
| Lenovo ThinkPad X1 Tablet Gen 2 | |
| Microsoft Surface Pro 6, Core i7, 512 GB | |
| HP Elite x2 1013 G3-2TT14EA | |
| Lenovo ThinkPad X1 Tablet G3-20KJ001NGE | |
| Creative Score Accelerated v2 | |
| Dell Latitude 5290 2-in-1 | |
| Lenovo ThinkPad X1 Tablet G3-20KJ001NGE | |
| HP Elite x2 1013 G3-2TT14EA | |
| Genomsnitt Intel Core i5-8250U, Intel UHD Graphics 620 (3308 - 5090, n=35) | |
| Microsoft Surface Pro 6, Core i7, 512 GB | |
| Lenovo ThinkPad X1 Tablet Gen 2 | |
| PCMark 8 Home Score Accelerated v2 | 3479 poäng | |
| PCMark 8 Creative Score Accelerated v2 | 4767 poäng | |
| PCMark 8 Work Score Accelerated v2 | 4136 poäng | |
| PCMark 10 Score | 3544 poäng | |
Hjälp | ||

| 3DMark 11 - 1280x720 Performance GPU | |
| Genomsnitt av klass Convertible (1505 - 40732, n=48, senaste 2 åren) | |
| Microsoft Surface Pro 6, Core i7, 512 GB | |
| Lenovo ThinkPad X1 Tablet G3-20KJ001NGE | |
| Genomsnitt Intel UHD Graphics 620 (1144 - 3432, n=244) | |
| Dell Latitude 5290 2-in-1 | |
| HP Elite x2 1013 G3-2TT14EA | |
| Toshiba Portege X30T-E-109 | |
| Lenovo ThinkPad X1 Tablet Gen 2 | |
| 3DMark | |
| 1280x720 Cloud Gate Standard Graphics | |
| Genomsnitt av klass Convertible (7885 - 57566, n=32, senaste 2 åren) | |
| Microsoft Surface Pro 6, Core i7, 512 GB | |
| Dell Latitude 5290 2-in-1 | |
| Genomsnitt Intel UHD Graphics 620 (6205 - 16400, n=225) | |
| Lenovo ThinkPad X1 Tablet G3-20KJ001NGE | |
| HP Elite x2 1013 G3-2TT14EA | |
| Lenovo ThinkPad X1 Tablet Gen 2 | |
| 1920x1080 Fire Strike Graphics | |
| Genomsnitt av klass Convertible (1185 - 27447, n=48, senaste 2 åren) | |
| Lenovo ThinkPad X1 Tablet G3-20KJ001NGE | |
| Dell Latitude 5290 2-in-1 | |
| Genomsnitt Intel UHD Graphics 620 (557 - 2608, n=213) | |
| HP Elite x2 1013 G3-2TT14EA | |
| Lenovo ThinkPad X1 Tablet Gen 2 | |
| 3DMark 11 Performance | 2041 poäng | |
| 3DMark Cloud Gate Standard Score | 8625 poäng | |
| 3DMark Fire Strike Score | 1103 poäng | |
Hjälp | ||
| låg | med. | hög | ultra | |
|---|---|---|---|---|
| BioShock Infinite (2013) | 59.2 | 34.8 | 30.2 | 10.1 |
| The Witcher 3 (2015) | 12.1 | |||
| Rocket League (2017) | 59.2 | 35.1 | 23.1 |
| 3DMark 11 | |
| 1280x720 Performance | |
| Lenovo ThinkPad X1 Tablet G3-20KJ001NGE | |
| Lenovo ThinkPad X1 Tablet G3-20KJ001NGE | |
| 1280x720 Performance GPU | |
| Lenovo ThinkPad X1 Tablet G3-20KJ001NGE | |
| Lenovo ThinkPad X1 Tablet G3-20KJ001NGE | |
| 1280x720 Performance Physics | |
| Lenovo ThinkPad X1 Tablet G3-20KJ001NGE | |
| Lenovo ThinkPad X1 Tablet G3-20KJ001NGE | |
| 3DMark | |
| 1920x1080 Fire Strike Score | |
| Lenovo ThinkPad X1 Tablet G3-20KJ001NGE | |
| Lenovo ThinkPad X1 Tablet G3-20KJ001NGE | |
| 1920x1080 Fire Strike Graphics | |
| Lenovo ThinkPad X1 Tablet G3-20KJ001NGE | |
| Lenovo ThinkPad X1 Tablet G3-20KJ001NGE | |
| 1920x1080 Fire Strike Physics | |
| Lenovo ThinkPad X1 Tablet G3-20KJ001NGE | |
| Lenovo ThinkPad X1 Tablet G3-20KJ001NGE | |
| BioShock Infinite | |
| 1920x1080 Ultra Preset, DX11 (DDOF) | |
| Lenovo ThinkPad X1 Tablet G3-20KJ001NGE | |
| Lenovo ThinkPad X1 Tablet G3-20KJ001NGE | |
| 1366x768 High Preset | |
| Lenovo ThinkPad X1 Tablet G3-20KJ001NGE | |
| Lenovo ThinkPad X1 Tablet G3-20KJ001NGE | |
| 1366x768 Medium Preset | |
| Lenovo ThinkPad X1 Tablet G3-20KJ001NGE | |
| Lenovo ThinkPad X1 Tablet G3-20KJ001NGE | |
| 1280x720 Very Low Preset | |
| Lenovo ThinkPad X1 Tablet G3-20KJ001NGE | |
| Lenovo ThinkPad X1 Tablet G3-20KJ001NGE | |
| Rocket League | |
| 1920x1080 High Quality AA:High FX | |
| Lenovo ThinkPad X1 Tablet G3-20KJ001NGE | |
| Lenovo ThinkPad X1 Tablet G3-20KJ001NGE | |
| 1920x1080 Quality AA:Medium FX | |
| Lenovo ThinkPad X1 Tablet G3-20KJ001NGE | |
| Lenovo ThinkPad X1 Tablet G3-20KJ001NGE | |
| 1280x720 Performance | |
| Lenovo ThinkPad X1 Tablet G3-20KJ001NGE | |
| Lenovo ThinkPad X1 Tablet G3-20KJ001NGE | |
| The Witcher 3 | |
| 1920x1080 Ultra Graphics & Postprocessing (HBAO+) | |
| Lenovo ThinkPad X1 Tablet G3-20KJ001NGE | |
| 1920x1080 High Graphics & Postprocessing (Nvidia HairWorks Off) | |
| Lenovo ThinkPad X1 Tablet G3-20KJ001NGE | |
| 1366x768 Medium Graphics & Postprocessing | |
| Lenovo ThinkPad X1 Tablet G3-20KJ001NGE | |
| 1024x768 Low Graphics & Postprocessing | |
| Lenovo ThinkPad X1 Tablet G3-20KJ001NGE | |
| Lenovo ThinkPad X1 Tablet G3-20KJ001NGE | |
Ljudnivå
| Låg belastning |
| 29.8 / 29.8 / 31.3 dB(A) |
| Hög belastning |
| 35.9 / 38.6 dB(A) |
 | ||
30 dB tyst 40 dB(A) hörbar 50 dB(A) högt ljud |
||
min: | ||
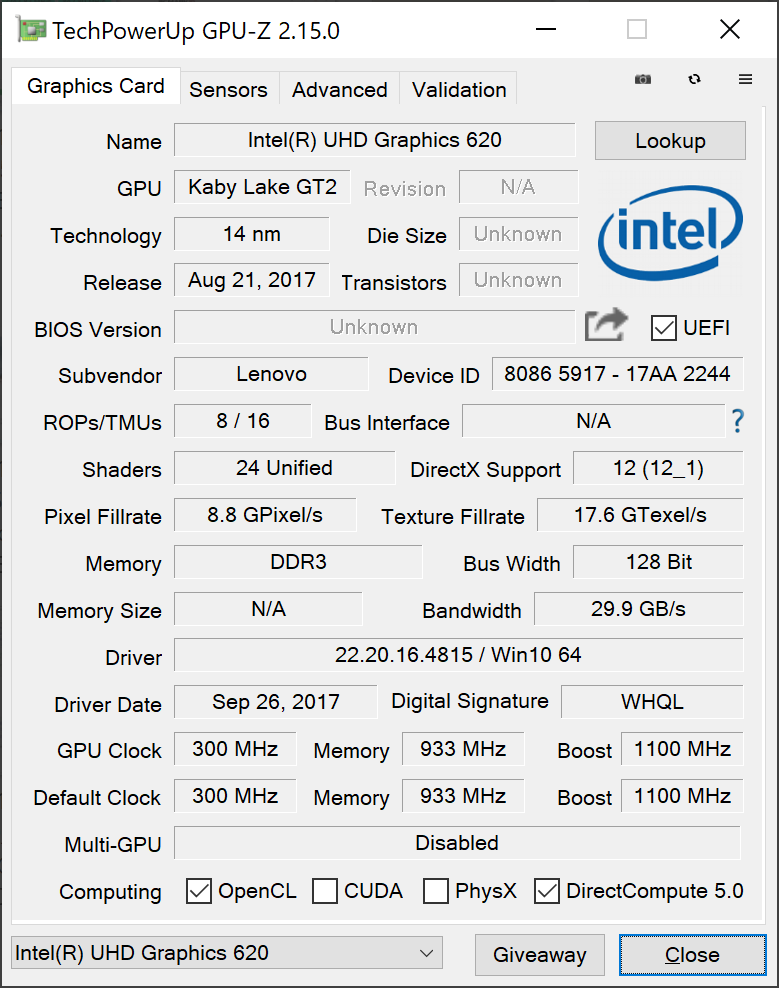
| Lenovo ThinkPad X1 Tablet G3-20KJ001NGE UHD Graphics 620, i5-8250U, Samsung PM961 MZVLW256HEHP | HP Elite x2 1013 G3-2TT14EA UHD Graphics 620, i5-8350U, Samsung PM961 MZVLW256HEHP | Microsoft Surface Pro 6, Core i7, 512 GB UHD Graphics 620, i7-8650U, Toshiba KBG30ZPZ512G | Dell Latitude 5290 2-in-1 UHD Graphics 620, i5-8350U, Toshiba XG5 KXG50ZNV256G | Toshiba Portege X30T-E-109 UHD Graphics 620, i5-8550U, Samsung SSD PM981 MZVLB1T0HALR | |
|---|---|---|---|---|---|
| Noise | 3% | 3% | 6% | 2% | |
| av / miljö * (dB) | 29.8 | 30.3 -2% | 30.3 -2% | 28.5 4% | 30.3 -2% |
| Idle Minimum * (dB) | 29.8 | 30.3 -2% | 30.3 -2% | 28.5 4% | 30.9 -4% |
| Idle Average * (dB) | 29.8 | 30.3 -2% | 30.3 -2% | 28.5 4% | 30.9 -4% |
| Idle Maximum * (dB) | 31.3 | 31.2 -0% | 30.3 3% | 28.5 9% | 32.3 -3% |
| Load Average * (dB) | 35.9 | 32.8 9% | 33.5 7% | 28.5 21% | 32.7 9% |
| Load Maximum * (dB) | 38.6 | 32.9 15% | 33.5 13% | 41.6 -8% | 32.7 15% |
* ... mindre är bättre
(±) Den maximala temperaturen på ovansidan är 44.3 °C / 112 F, jämfört med genomsnittet av 35.4 °C / 96 F , allt från 19.6 till 60 °C för klassen Convertible.
(-) Botten värms upp till maximalt 48.9 °C / 120 F, jämfört med genomsnittet av 36.9 °C / 98 F
(+) Vid tomgångsbruk är medeltemperaturen för ovansidan 26.7 °C / 80 F, jämfört med enhetsgenomsnittet på 30.3 °C / ### class_avg_f### F.
(±) Handledsstöden och pekplattan kan bli väldigt varma vid beröring med maximalt 37.6 °C / 99.7 F.
(-) Medeltemperaturen för handledsstödsområdet på liknande enheter var 28 °C / 82.4 F (-9.6 °C / -17.3 F).
Lenovo ThinkPad X1 Tablet G3-20KJ001NGE ljudanalys
(±) | högtalarljudstyrkan är genomsnittlig men bra (73.6 dB)
Bas 100 - 315 Hz
(-) | nästan ingen bas - i genomsnitt 21.7% lägre än medianen
(±) | linjäriteten för basen är genomsnittlig (9.5% delta till föregående frekvens)
Mellan 400 - 2000 Hz
(+) | balanserad mellan - endast 4.7% från medianen
(±) | linjäriteten för mids är genomsnittlig (7.8% delta till föregående frekvens)
Högsta 2 - 16 kHz
(±) | högre toppar - i genomsnitt 7.8% högre än medianen
(±) | linjäriteten för toppar är genomsnittlig (14.2% delta till föregående frekvens)
Totalt 100 - 16 000 Hz
(-) | det totala ljudet är inte linjärt (33.2% skillnad mot median)
Jämfört med samma klass
» 93% av alla testade enheter i den här klassen var bättre, 1% liknande, 6% sämre
» Den bästa hade ett delta på 6%, genomsnittet var 20%, sämst var 57%
Jämfört med alla testade enheter
» 92% av alla testade enheter var bättre, 1% liknande, 7% sämre
» Den bästa hade ett delta på 4%, genomsnittet var 23%, sämst var 134%
HP Elite x2 1013 G3-2TT14EA ljudanalys
(±) | högtalarljudstyrkan är genomsnittlig men bra (74.4 dB)
Bas 100 - 315 Hz
(-) | nästan ingen bas - i genomsnitt 15.1% lägre än medianen
(±) | linjäriteten för basen är genomsnittlig (10.9% delta till föregående frekvens)
Mellan 400 - 2000 Hz
(±) | högre mellan - i genomsnitt 7.9% högre än median
(±) | linjäriteten för mids är genomsnittlig (11.3% delta till föregående frekvens)
Högsta 2 - 16 kHz
(±) | högre toppar - i genomsnitt 5.2% högre än medianen
(+) | toppar är linjära (6.8% delta till föregående frekvens)
Totalt 100 - 16 000 Hz
(±) | linjäriteten för det totala ljudet är genomsnittlig (20.8% skillnad mot median)
Jämfört med samma klass
» 55% av alla testade enheter i den här klassen var bättre, 10% liknande, 35% sämre
» Den bästa hade ett delta på 6%, genomsnittet var 20%, sämst var 57%
Jämfört med alla testade enheter
» 56% av alla testade enheter var bättre, 8% liknande, 36% sämre
» Den bästa hade ett delta på 4%, genomsnittet var 23%, sämst var 134%
Microsoft Surface Pro 6, Core i7, 512 GB ljudanalys
(-) | inte särskilt höga högtalare (69.1 dB)
Bas 100 - 315 Hz
(±) | reducerad bas - i genomsnitt 11.4% lägre än medianen
(±) | linjäriteten för basen är genomsnittlig (10.6% delta till föregående frekvens)
Mellan 400 - 2000 Hz
(+) | balanserad mellan - endast 4.3% från medianen
(±) | linjäriteten för mids är genomsnittlig (10.4% delta till föregående frekvens)
Högsta 2 - 16 kHz
(±) | högre toppar - i genomsnitt 5.7% högre än medianen
(±) | linjäriteten för toppar är genomsnittlig (8.1% delta till föregående frekvens)
Totalt 100 - 16 000 Hz
(±) | linjäriteten för det totala ljudet är genomsnittlig (21.4% skillnad mot median)
Jämfört med samma klass
» 57% av alla testade enheter i den här klassen var bättre, 12% liknande, 32% sämre
» Den bästa hade ett delta på 6%, genomsnittet var 20%, sämst var 57%
Jämfört med alla testade enheter
» 60% av alla testade enheter var bättre, 7% liknande, 33% sämre
» Den bästa hade ett delta på 4%, genomsnittet var 23%, sämst var 134%
| Av/Standby | |
| Låg belastning | |
| Hög belastning |
|
Förklaring:
min: | |
| Lenovo ThinkPad X1 Tablet G3-20KJ001NGE i5-8250U, UHD Graphics 620, Samsung PM961 MZVLW256HEHP, IPS, 3000x2000, 13" | HP Elite x2 1013 G3-2TT14EA i5-8350U, UHD Graphics 620, Samsung PM961 MZVLW256HEHP, IPS, 3000x2000, 13" | Microsoft Surface Pro 6, Core i7, 512 GB i7-8650U, UHD Graphics 620, Toshiba KBG30ZPZ512G, IPS, 2736x1824, 12.3" | Dell Latitude 5290 2-in-1 i5-8350U, UHD Graphics 620, Toshiba XG5 KXG50ZNV256G, IPS, 1920x1280, 12.3" | Toshiba Portege X30T-E-109 i5-8550U, UHD Graphics 620, Samsung SSD PM981 MZVLB1T0HALR, IPS, 1920x1080, 13.3" | Lenovo ThinkPad X1 Tablet Gen 2 i5-7Y54, HD Graphics 615, Samsung PM961 MZVLW256HEHP, IPS, 2160x1440, 12" | Genomsnitt Intel UHD Graphics 620 | Genomsnitt av klass Convertible | |
|---|---|---|---|---|---|---|---|---|
| Power Consumption | 11% | 20% | 22% | 5% | 34% | 19% | 6% | |
| Idle Minimum * (Watt) | 4.8 | 4.9 -2% | 3.2 33% | 3 37% | 4.7 2% | 5 -4% | 3.81 ? 21% | 4.28 ? 11% |
| Idle Average * (Watt) | 9 | 8.9 1% | 8.7 3% | 7.2 20% | 9.4 -4% | 6.3 30% | 6.94 ? 23% | 6.96 ? 23% |
| Idle Maximum * (Watt) | 10.5 | 11 -5% | 10.4 1% | 10 5% | 16 -52% | 7.8 26% | 8.75 ? 17% | 8.67 ? 17% |
| Load Average * (Watt) | 42.8 | 32 25% | 29.2 32% | 37.1 13% | 26.4 38% | 19.5 54% | 35 ? 18% | 45.1 ? -5% |
| Load Maximum * (Watt) | 57.8 | 36 38% | 40.8 29% | 38.2 34% | 34 41% | 19.6 66% | 47.5 ? 18% | 67.7 ? -17% |
* ... mindre är bättre
| Lenovo ThinkPad X1 Tablet G3-20KJ001NGE i5-8250U, UHD Graphics 620, 42 Wh | HP Elite x2 1013 G3-2TT14EA i5-8350U, UHD Graphics 620, 50 Wh | Microsoft Surface Pro 6, Core i7, 512 GB i7-8650U, UHD Graphics 620, 45 Wh | Dell Latitude 5290 2-in-1 i5-8350U, UHD Graphics 620, 42 Wh | Toshiba Portege X30T-E-109 i5-8550U, UHD Graphics 620, Wh | Lenovo ThinkPad X1 Tablet Gen 2 i5-7Y54, HD Graphics 615, 37 Wh | Genomsnitt av klass Convertible | |
|---|---|---|---|---|---|---|---|
| Batteridrifttid | 14% | 41% | -12% | 39% | 17% | 70% | |
| Reader / Idle (h) | 13.2 | 13 -2% | 18.1 37% | 11 -17% | 26.7 ? 102% | ||
| H.264 (h) | 8.7 | 6.5 -25% | 15 ? 72% | ||||
| WiFi v1.3 (h) | 6.6 | 7.7 17% | 8.5 29% | 5 -24% | 9.2 39% | 7.4 12% | 12 ? 82% |
| Load (h) | 1.4 | 2.3 64% | 2.2 57% | 1.4 0% | 2.2 57% | 1.713 ? 22% |
För
Emot
Läs den fullständiga versionen av den här recensionen på engelska här.
Låt oss börja med frågan vi ställde oss i inledningen - är nya Lenovo ThinkPad X1 Tablet den bästa omvandlingsbara företagsmodellen? Frågan kan inte besvaras generellt, för de konkurrerande enheterna är så olika när det kommer till detaljnivå. Det beror istället på hur användaren planerar att använda enheten. Om lång batteritid krävs och enheten ofta kommer användas utomhus så finns det bättre alternativ. Det finns också enheter som erbjuder fler portar med större variation. Om en matt skärm behövs blir man heller inte nöjd med X1 Tablet.
Men trots det har vi i vår recension sett att tredje generationen av X1 Tablet är en riktigt bra enhet totalt sett. Ja, den har svagheter, men de påverkar inte alla användare på samma sätt. Om enheten i huvudsak används tillsammans med en dockningsstation och surfplattan i huvudsak används för att göra anteckningar under möten så bör den medelmåttiga batteritiden och avsaknaden av en USB A-port inte vara något problem.
Låt oss prata om de positiva aspekterna: Ett stabilt chassi, riktigt bra inmatningsenheter som inkluderar ett utmärkt tangentbord, en riktigt bra skärm (särskilt efter kalibrering) och USB C med Thunderbolt 3. I och med övergången till moderna fyrkärniga processorer levererar denna omvandlingsbara samma nivå av CPU-prestanda som vanliga företagsinriktade ultrabook-modeller. Med det sagt, i7-processorn som finns som tillval till X1 Tablet är inte värd pengarna och är mycket långsammare än i5-processorn vid ihållande belastning.
Med en helt omarbetad ThinkPad X1 Tablet erbjuder Lenovo en bra omvandlingsbar för företaget som ytterligare suddar ut gränserna mellan surfplatta och typisk företags-subnotebook. Men X1 Tablet slår inga nya rekord när det kommer till batteritid och i7-processorn som finns som tillval är inte värd pengarna.
Att gränserna mellan de kända enhetstyperna allt mer suddas ut blir uppenbart när man tittar på vårt betyg. Sett som en omvandlingsbar modell får X1 Tablet 89%. Hade enheten poängsatts som en kontorslaptop eller subnotebook hade den fått 90%, då de kategorierna lägger större tonvikt på inmatningsenheter och anslutningar - två kategorier där ThinkPad X1 Tablet lyckas bra (i fråga om anslutbarheten tack vare moderna portar och många säkerhetsfunktioner).
Lenovo ThinkPad X1 Tablet G3-20KJ001NGE
- 10/17/2019 v7 (old)
Andreas Osthoff
Price comparison
