Test: Apple iPhone SE 2020 - Liten telefon vars hjärta slår snabbt (Sammanfattning)
Testgrupp
Gradering | Datum | Modell | Vikt | Enheten | Storlek | Upplösning | Pris |
|---|---|---|---|---|---|---|---|
| 85.2 % v7 (old) | 05/2020 | Apple iPhone SE 2020 A13 Bionic, A13 Bionic GPU | 148 g | 128 GB NVMe | 4.70" | 1334x750 | |
| 85.7 % v7 (old) | 12/2019 | Google Pixel 4 SD 855, Adreno 640 | 162 g | 64 GB UFS 2.1 Flash | 5.70" | 2280x1080 | |
| 86.5 % v7 (old) | 10/2019 | Apple iPhone 11 A13 Bionic, A13 Bionic GPU | 194 g | 64 GB SSD | 6.10" | 1792x828 | |
| 82.9 % v7 (old) | 10/2017 | Apple iPhone 8 A11 Bionic, A11 Bionic GPU | 148 g | Apple 256 GB (iPhone 8 / Plus) | 4.70" | 1334x750 | |
| 86 % v7 (old) | 03/2020 | Samsung Galaxy S10 Lite SD 855, Adreno 640 | 186 g | 128 GB UFS 3.0 Flash | 6.70" | 2400x1080 | |
| 83.8 % v7 (old) | 01/2020 | Xiaomi Mi Note 10 Pro SD 730G, Adreno 618 | 208 g | 256 GB UFS 2.0 Flash | 6.47" | 2340x1080 |
| Networking | |
| iperf3 transmit AX12 | |
| Apple iPhone SE 2020 | |
| Google Pixel 4 | |
| Apple iPhone 11 | |
| Samsung Galaxy S10 Lite | |
| Xiaomi Mi Note 10 Pro | |
| iperf3 receive AX12 | |
| Apple iPhone SE 2020 | |
| Samsung Galaxy S10 Lite | |
| Apple iPhone 11 | |
| Google Pixel 4 | |
| Xiaomi Mi Note 10 Pro | |


| |||||||||||||||||||||||||
Distribution av ljusstyrkan: 92 %
Mitt på batteriet: 688 cd/m²
Kontrast: 2457:1 (Svärta: 0.28 cd/m²)
ΔE ColorChecker Calman: 1 | ∀{0.5-29.43 Ø4.71}
ΔE Greyscale Calman: 1.7 | ∀{0.09-98 Ø4.96}
99.9% sRGB (Calman 2D)
Gamma: 2.25
CCT: 6790 K
| Apple iPhone SE 2020 IPS, 1334x750, 4.7" | Apple iPhone 8 IPS True Tone, 1334x750, 4.7" | Apple iPhone 11 IPS, 1792x828, 6.1" | Google Pixel 4 OLED, 2280x1080, 5.7" | Samsung Galaxy S10 Lite Super AMOLED Plus, 2400x1080, 6.7" | Xiaomi Mi Note 10 Pro AMOLED, 2340x1080, 6.5" | |
|---|---|---|---|---|---|---|
| Screen | -18% | -19% | 8% | -71% | -132% | |
| Brightness middle (cd/m²) | 688 | 604 -12% | 679 -1% | 554 -19% | 622 -10% | 579 -16% |
| Brightness (cd/m²) | 659 | 580 -12% | 671 2% | 550 -17% | 630 -4% | 576 -13% |
| Brightness Distribution (%) | 92 | 91 -1% | 93 1% | 94 2% | 96 4% | 89 -3% |
| Black Level * (cd/m²) | 0.28 | 0.44 -57% | 0.68 -143% | |||
| Contrast (:1) | 2457 | 1373 -44% | 999 -59% | |||
| Colorchecker dE 2000 * | 1 | 1.2 -20% | 0.8 20% | 0.8 20% | 2.7 -170% | 4.61 -361% |
| Colorchecker dE 2000 max. * | 2.2 | 2.3 -5% | 2.4 -9% | 1.4 36% | 5.9 -168% | 7.72 -251% |
| Greyscale dE 2000 * | 1.7 | 1.6 6% | 1.1 35% | 1.3 24% | 3 -76% | 4.2 -147% |
| Gamma | 2.25 98% | 2.25 98% | 2.24 98% | 2.22 99% | 2.09 105% | 2.244 98% |
| CCT | 6790 96% | 6688 97% | 6610 98% | 6213 105% | 6246 104% | 7201 90% |
* ... mindre är bättre
Skärmflimmer / PWM (Puls-Width Modulation)
| Skärmflimmer / PWM upptäcktes inte | 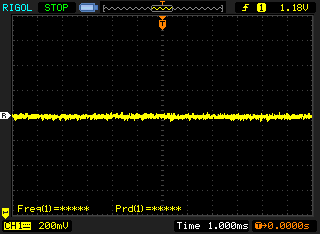 | ||
Som jämförelse: 52 % av alla testade enheter använder inte PWM för att dämpa skärmen. Om PWM upptäcktes mättes ett medelvärde av 7741 (minst: 5 - maximum: 343500) Hz. | |||
Visa svarstider
| ↔ Svarstid svart till vitt | ||
|---|---|---|
| 21.2 ms ... stiga ↗ och falla ↘ kombinerat | ↗ 6 ms stiga | 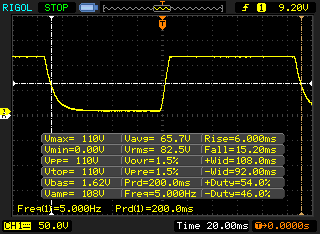 |
| ↘ 15.2 ms hösten | ||
| Skärmen visar bra svarsfrekvens i våra tester, men kan vara för långsam för konkurrenskraftiga spelare. I jämförelse sträcker sig alla testade enheter från 0.1 (minst) till 240 (maximalt) ms. » 48 % av alla enheter är bättre. Det betyder att den uppmätta svarstiden liknar genomsnittet av alla testade enheter (19.8 ms). | ||
| ↔ Svarstid 50 % grått till 80 % grått | ||
| 36.8 ms ... stiga ↗ och falla ↘ kombinerat | ↗ 9.2 ms stiga | 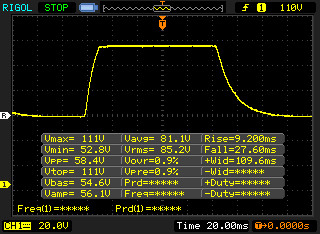 |
| ↘ 27.6 ms hösten | ||
| Skärmen visar långsamma svarsfrekvenser i våra tester och kommer att vara otillfredsställande för spelare. I jämförelse sträcker sig alla testade enheter från 0.165 (minst) till 636 (maximalt) ms. » 53 % av alla enheter är bättre. Detta innebär att den uppmätta svarstiden är sämre än genomsnittet av alla testade enheter (30.9 ms). | ||
| AnTuTu v8 - Total Score (sortera efter värde) | |
| Apple iPhone SE 2020 | |
| Google Pixel 4 | |
| Samsung Galaxy S10 Lite | |
| Apple iPhone 11 Pro | |
| Genomsnitt Apple A13 Bionic (489463 - 534558, n=3) | |
| Basemark GPU 1.2 | |
| 1920x1080 Metal Medium Offscreen (sortera efter värde) | |
| Apple iPhone SE 2020 | |
| Genomsnitt Apple A13 Bionic (136.6 - 153, n=2) | |
| Genomsnitt av klass Smartphone (n=1senaste 2 åren) | |
| Metal Medium Native (sortera efter värde) | |
| Apple iPhone SE 2020 | |
| Genomsnitt Apple A13 Bionic (94.9 - 211, n=2) | |
| Genomsnitt av klass Smartphone (n=1senaste 2 åren) | |
| Jetstream 2 - 2.0 Total | |
| Genomsnitt av klass Smartphone (63.9 - 423, n=116, senaste 2 åren) | |
| Apple iPhone SE 2020 (Safari Mobile 13.1) | |
| Genomsnitt Apple A13 Bionic (128.5 - 142.2, n=5) | |
| Apple iPhone 11 (Safari Mobile 13.0) | |
| Samsung Galaxy S10 Lite (Chrome 80) | |
| Google Pixel 4 (Chrome 78) | |
| JetStream 1.1 - 1.1 Total | |
| Apple iPhone 11 (Safari Mobile 13.0) | |
| Genomsnitt Apple A13 Bionic (279 - 302, n=5) | |
| Apple iPhone SE 2020 (Safari Mobile 13.1) | |
| Apple iPhone 8 | |
| Samsung Galaxy S10 Lite (Chrome 80) | |
| Google Pixel 4 (Chrome 78) | |
| Speedometer 2.0 - Result 2.0 | |
| Genomsnitt av klass Smartphone (49.3 - 733, n=76, senaste 2 åren) | |
| Genomsnitt Apple A13 Bionic (153 - 171, n=5) | |
| Apple iPhone SE 2020 (Safari Mobile 13.1) | |
| Apple iPhone 11 (Safari Mobile 13.0) | |
| Samsung Galaxy S10 Lite (Chrome 80) | |
| Google Pixel 4 (Chrome 78) | |
| WebXPRT 3 - Overall | |
| Apple iPhone 11 (Safari Mobile 13.0) | |
| Genomsnitt Apple A13 Bionic (146 - 202, n=5) | |
| Genomsnitt av klass Smartphone (104 - 380, n=12, senaste 2 åren) | |
| Apple iPhone SE 2020 (Safari Mobile 13.1) | |
| Samsung Galaxy S10 Lite (Chrome 80) | |
| Google Pixel 4 (Chrome 78) | |
| Octane V2 - Total Score | |
| Genomsnitt av klass Smartphone (2800 - 126661, n=141, senaste 2 åren) | |
| Apple iPhone SE 2020 (Safari Mobile 13.1) | |
| Apple iPhone 11 (Safari Mobile 13.0) | |
| Genomsnitt Apple A13 Bionic (47288 - 49388, n=5) | |
| Apple iPhone 8 | |
| Samsung Galaxy S10 Lite (Chrome 80) | |
| Google Pixel 4 (Chrome 78) | |
| Mozilla Kraken 1.1 - Total | |
| Samsung Galaxy S10 Lite (Chrome 80) | |
| Google Pixel 4 (Chrome 78) | |
| Genomsnitt av klass Smartphone (257 - 28190, n=120, senaste 2 åren) | |
| Apple iPhone 8 | |
| Apple iPhone 11 (Safari Mobile 13.0) | |
| Genomsnitt Apple A13 Bionic (545 - 573, n=5) | |
| Apple iPhone SE 2020 (Safari Mobile 13.1) | |
* ... mindre är bättre
(±) Den maximala temperaturen på ovansidan är 40.5 °C / 105 F, jämfört med genomsnittet av 35.3 °C / 96 F , allt från 21.9 till 247 °C för klassen Smartphone.
(±) Botten värms upp till maximalt 41.4 °C / 107 F, jämfört med genomsnittet av 34 °C / 93 F
(±) Vid tomgångsbruk är medeltemperaturen för ovansidan 32 °C / 90 F, jämfört med enhetsgenomsnittet på 33 °C / ### class_avg_f### F.
Apple iPhone SE 2020 ljudanalys
(+) | högtalare kan spela relativt högt (86.4 dB)
Bas 100 - 315 Hz
(-) | nästan ingen bas - i genomsnitt 22% lägre än medianen
(±) | linjäriteten för basen är genomsnittlig (9.2% delta till föregående frekvens)
Mellan 400 - 2000 Hz
(±) | reducerade mids - i genomsnitt 6.3% lägre än median
(+) | mids är linjära (5.6% delta till föregående frekvens)
Högsta 2 - 16 kHz
(±) | högre toppar - i genomsnitt 8.4% högre än medianen
(+) | toppar är linjära (4.2% delta till föregående frekvens)
Totalt 100 - 16 000 Hz
(±) | linjäriteten för det totala ljudet är genomsnittlig (22.6% skillnad mot median)
Jämfört med samma klass
» 49% av alla testade enheter i den här klassen var bättre, 6% liknande, 44% sämre
» Den bästa hade ett delta på 11%, genomsnittet var 34%, sämst var 134%
Jämfört med alla testade enheter
» 67% av alla testade enheter var bättre, 6% liknande, 28% sämre
» Den bästa hade ett delta på 4%, genomsnittet var 23%, sämst var 134%
Apple iPhone 8 ljudanalys
(±) | högtalarljudstyrkan är genomsnittlig men bra (78.4 dB)
Bas 100 - 315 Hz
(±) | reducerad bas - i genomsnitt 14.6% lägre än medianen
(±) | linjäriteten för basen är genomsnittlig (9.2% delta till föregående frekvens)
Mellan 400 - 2000 Hz
(+) | balanserad mellan - endast 4.3% från medianen
(+) | mids är linjära (4.2% delta till föregående frekvens)
Högsta 2 - 16 kHz
(±) | högre toppar - i genomsnitt 5.1% högre än medianen
(+) | toppar är linjära (4.7% delta till föregående frekvens)
Totalt 100 - 16 000 Hz
(±) | linjäriteten för det totala ljudet är genomsnittlig (18.2% skillnad mot median)
Jämfört med samma klass
» 18% av alla testade enheter i den här klassen var bättre, 8% liknande, 73% sämre
» Den bästa hade ett delta på 11%, genomsnittet var 34%, sämst var 134%
Jämfört med alla testade enheter
» 39% av alla testade enheter var bättre, 8% liknande, 53% sämre
» Den bästa hade ett delta på 4%, genomsnittet var 23%, sämst var 134%
| Av/Standby | |
| Låg belastning | |
| Hög belastning |
|
Förklaring:
min: | |
| Apple iPhone SE 2020 1822 mAh | Google Pixel 4 2800 mAh | Apple iPhone 11 3110 mAh | Apple iPhone 8 1821 mAh | Samsung Galaxy S10 Lite 4500 mAh | Genomsnitt Apple A13 Bionic | Genomsnitt av klass Smartphone | |
|---|---|---|---|---|---|---|---|
| Power Consumption | -70% | -63% | -27% | -42% | -92% | -92% | |
| Idle Minimum * (Watt) | 0.44 | 1.01 -130% | 0.56 -27% | 0.54 -23% | 0.58 -32% | 0.76 ? -73% | 0.879 ? -100% |
| Idle Average * (Watt) | 1.56 | 1.63 -4% | 2.99 -92% | 1.63 -4% | 1.55 1% | 3.39 ? -117% | 1.474 ? 6% |
| Idle Maximum * (Watt) | 1.63 | 1.69 -4% | 3.02 -85% | 1.67 -2% | 1.64 -1% | 3.44 ? -111% | 1.663 ? -2% |
| Load Average * (Watt) | 2.32 | 4.67 -101% | 4.17 -80% | 2.74 -18% | 4.29 -85% | 4.66 ? -101% | 6.75 ? -191% |
| Load Maximum * (Watt) | 4.12 | 8.78 -113% | 5.44 -32% | 7.78 -89% | 8.03 -95% | 6.42 ? -56% | 11.2 ? -172% |
* ... mindre är bättre
| Apple iPhone SE 2020 1822 mAh | Google Pixel 4 2800 mAh | Apple iPhone 11 3110 mAh | Apple iPhone 8 1821 mAh | Samsung Galaxy S10 Lite 4500 mAh | Xiaomi Mi Note 10 Pro 5260 mAh | |
|---|---|---|---|---|---|---|
| Batteridrifttid | -16% | 56% | 3% | 44% | 59% | |
| Reader / Idle (h) | 32.3 | 16.8 -48% | 46.1 43% | 27.2 -16% | 41.7 29% | |
| H.264 (h) | 11.4 | 10.3 -10% | 19.1 68% | 11.6 2% | 19.7 73% | |
| WiFi v1.3 (h) | 11.6 | 7.7 -34% | 14.4 24% | 9.8 -16% | 13.7 18% | 18.5 59% |
| Load (h) | 2.4 | 3.1 29% | 4.5 88% | 3.4 42% | 3.7 54% |
För
Emot
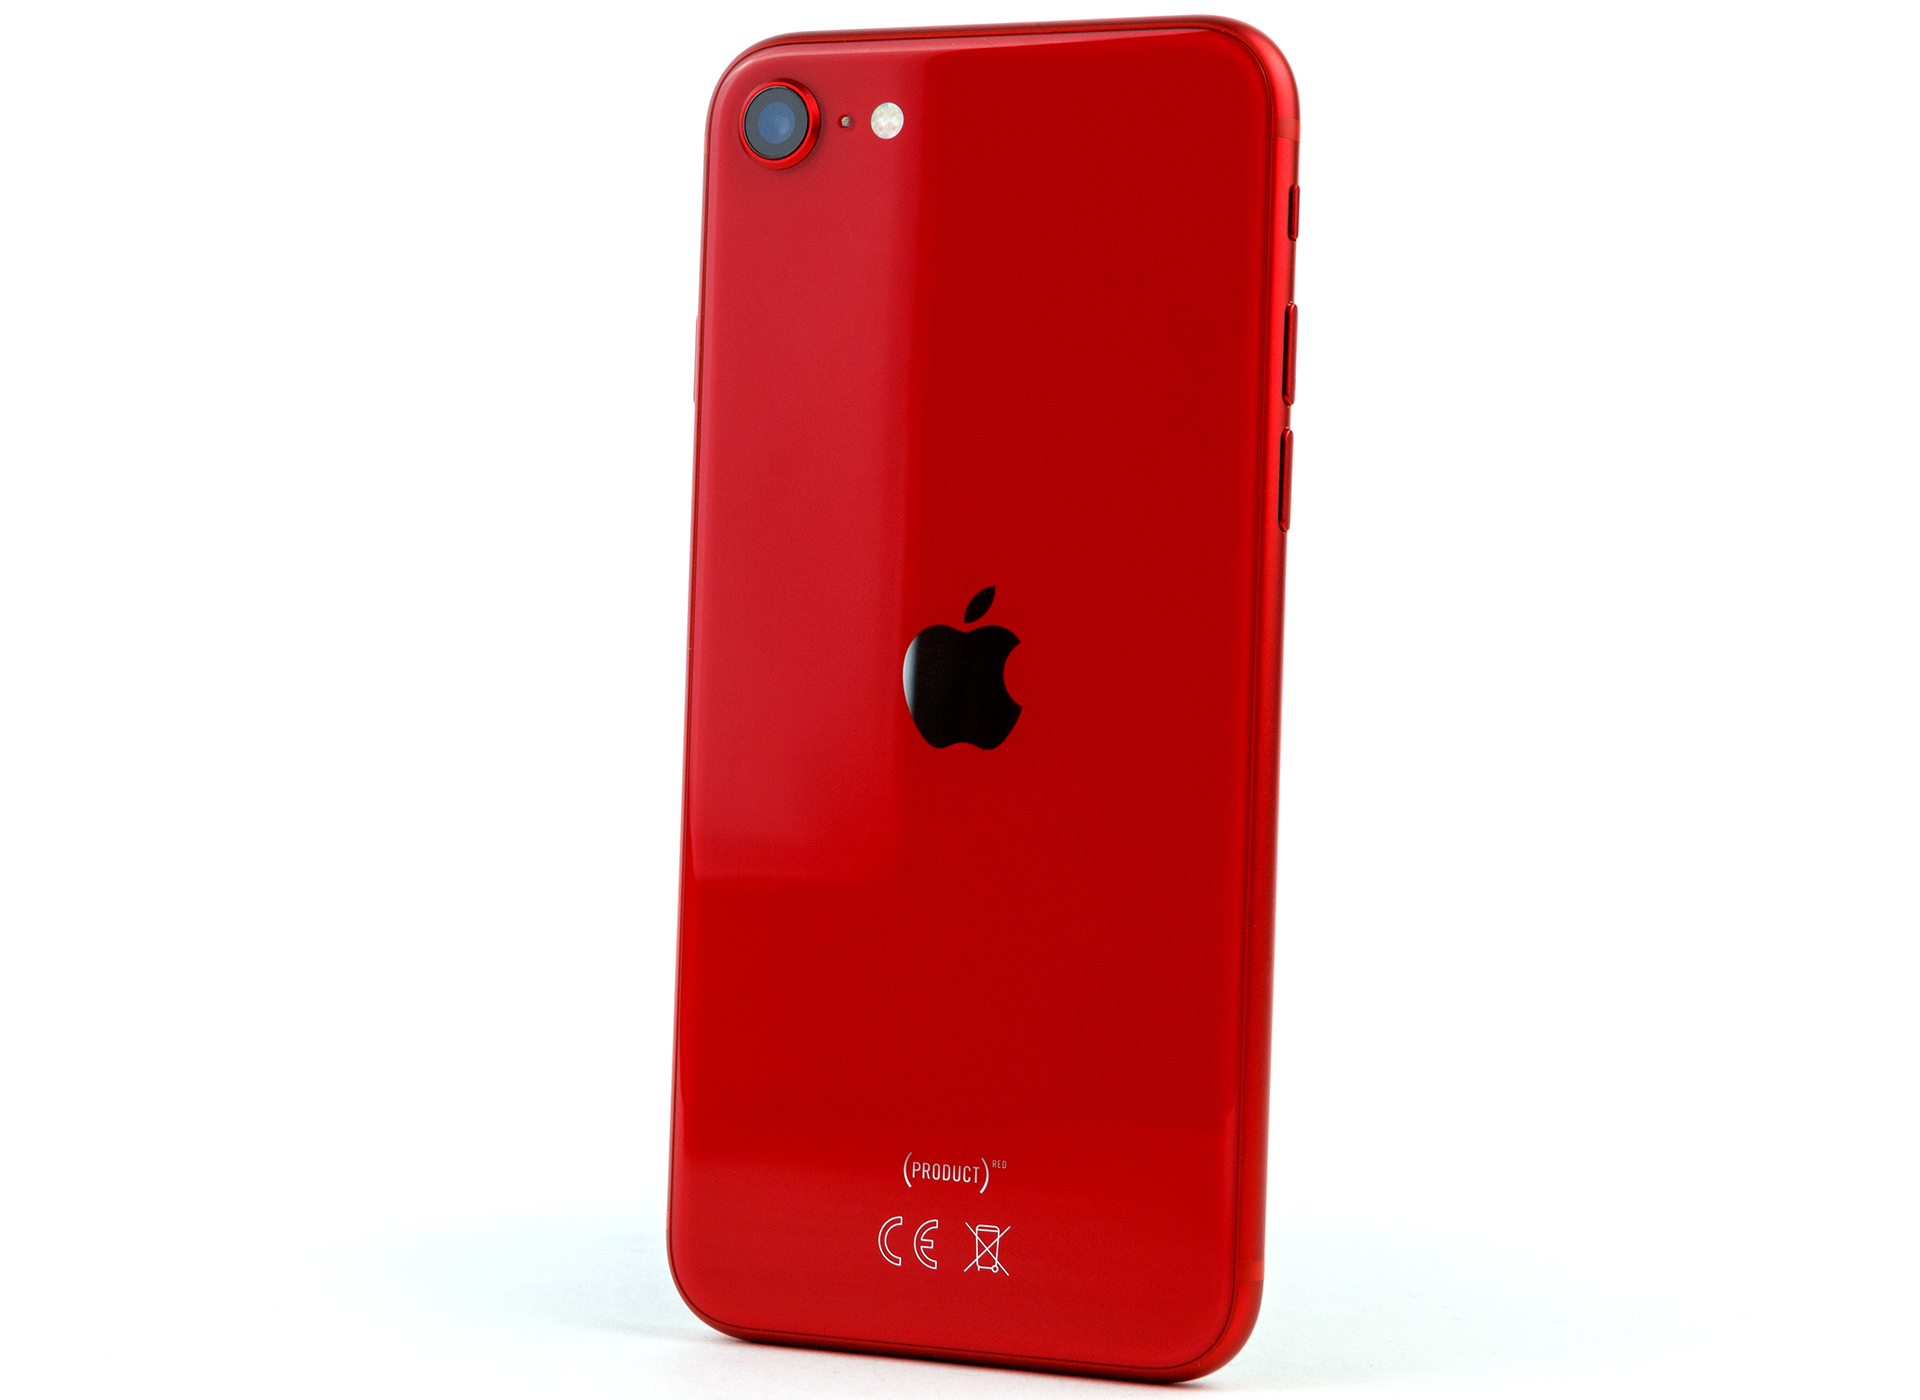
Omdöme - Framgångsrik uppfräschning av iPhone 8, men inte för alla

Läs den fullständiga versionen av den här recensionen på engelska här.
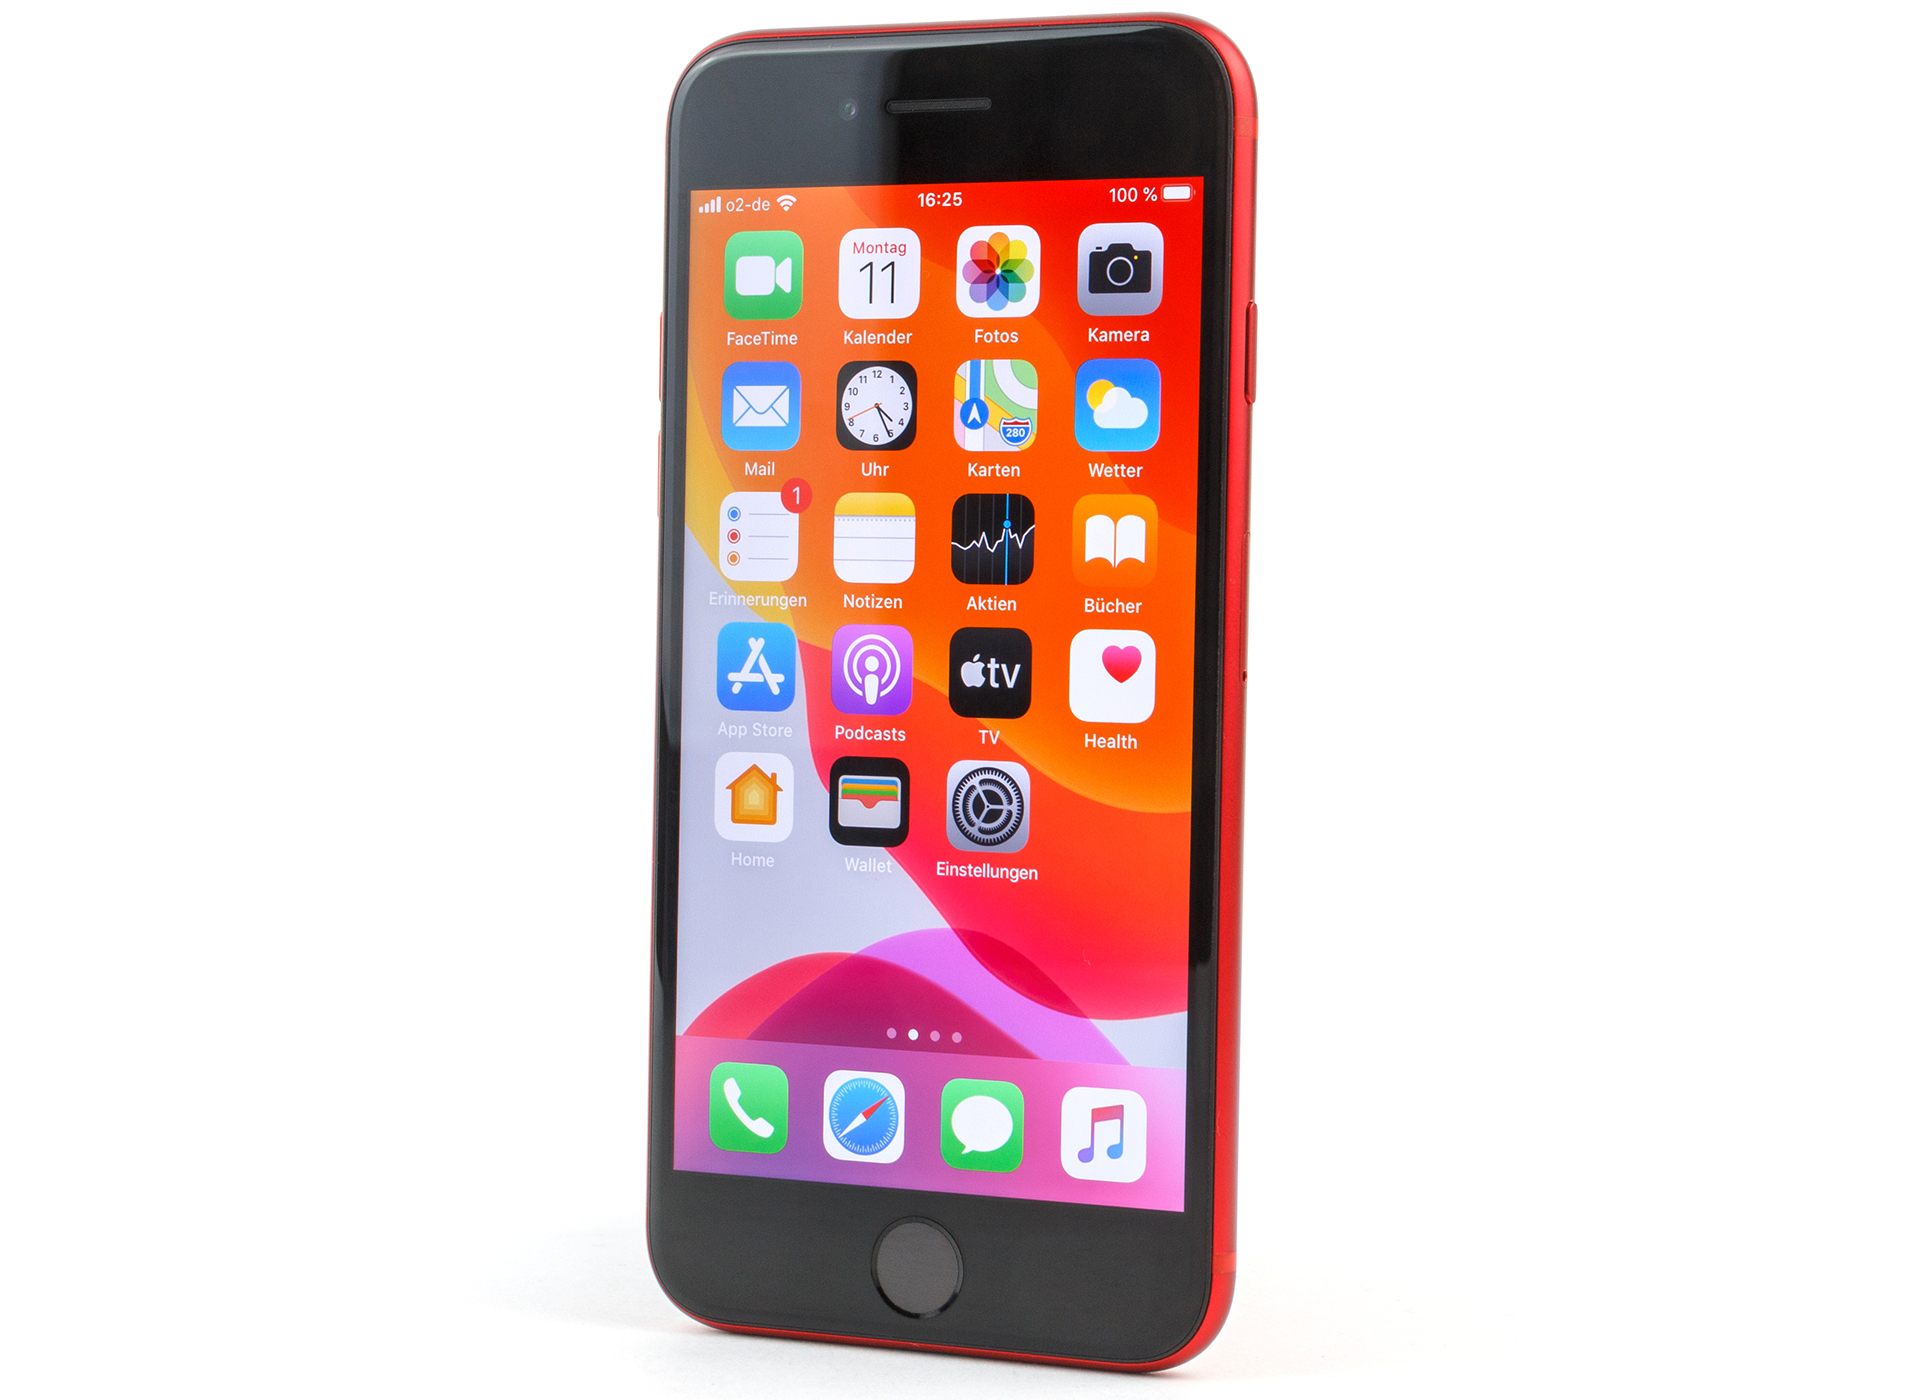
Med iPhone SE har Apple släppt en tilltalande smartphone som står ut med en snabb processor, en utmärkt skärm, snabbt WiFi och en lång uppdateringsperiod. Den är dessutom vattenskyddad och har stöd för trådlös laddning.
iPhone SE (2020) är för tillfället den billigaste biljetten till Apples universum.
De största svagheterna är en liten skärm och ett dåligt skärm-till-kropp förhållande. Men den som byter upp sig från en iPhone 6, 7, 8 eller första generationens SE kommer troligen inte tycka det är ett problem. Det är precis den målgruppen iPhone SE2 riktar sig åt. Som jämförelse lär Android-användare knappast övertalas på grund av ovanstående brister och eftersom kameran har så få möjligheter. För den gruppen är iPhone 11 troligen ett mer tilltalande alternativ.
iPhone SE (2020) är en riktigt polerad bit teknik. Samtidigt är Google Pixel 4 det enda egentliga alternativet för köpare som är intresserade av en Android-baserad motsvarighet, som i det här fallet har mer skärm i förhållande till kroppen, en 90 Hz-panel, en dualkamera och sämre batteritid till samma pris.
Apple iPhone SE 2020
- 05/15/2020 v7 (old)
Daniel Schmidt
Price comparison
