Notebookcheck Logo

Recension av Intel NUC 12 Dragon Canyon med Intel Core i9-12900

Speldator eller arbetshäst? Nuvarande Intel NUC 12 Extreme Kit innehåller ett Compute Element som vi redan känner till. Ändå finns det några viktiga förändringar, eftersom ett Compute Element med en CPU i sockel baserad på LGA1700 kan hysa olika processorer. Med den förinstallerade Intel Core i9-12900 får du i dagsläget ett riktigt snabbt och kompakt system.

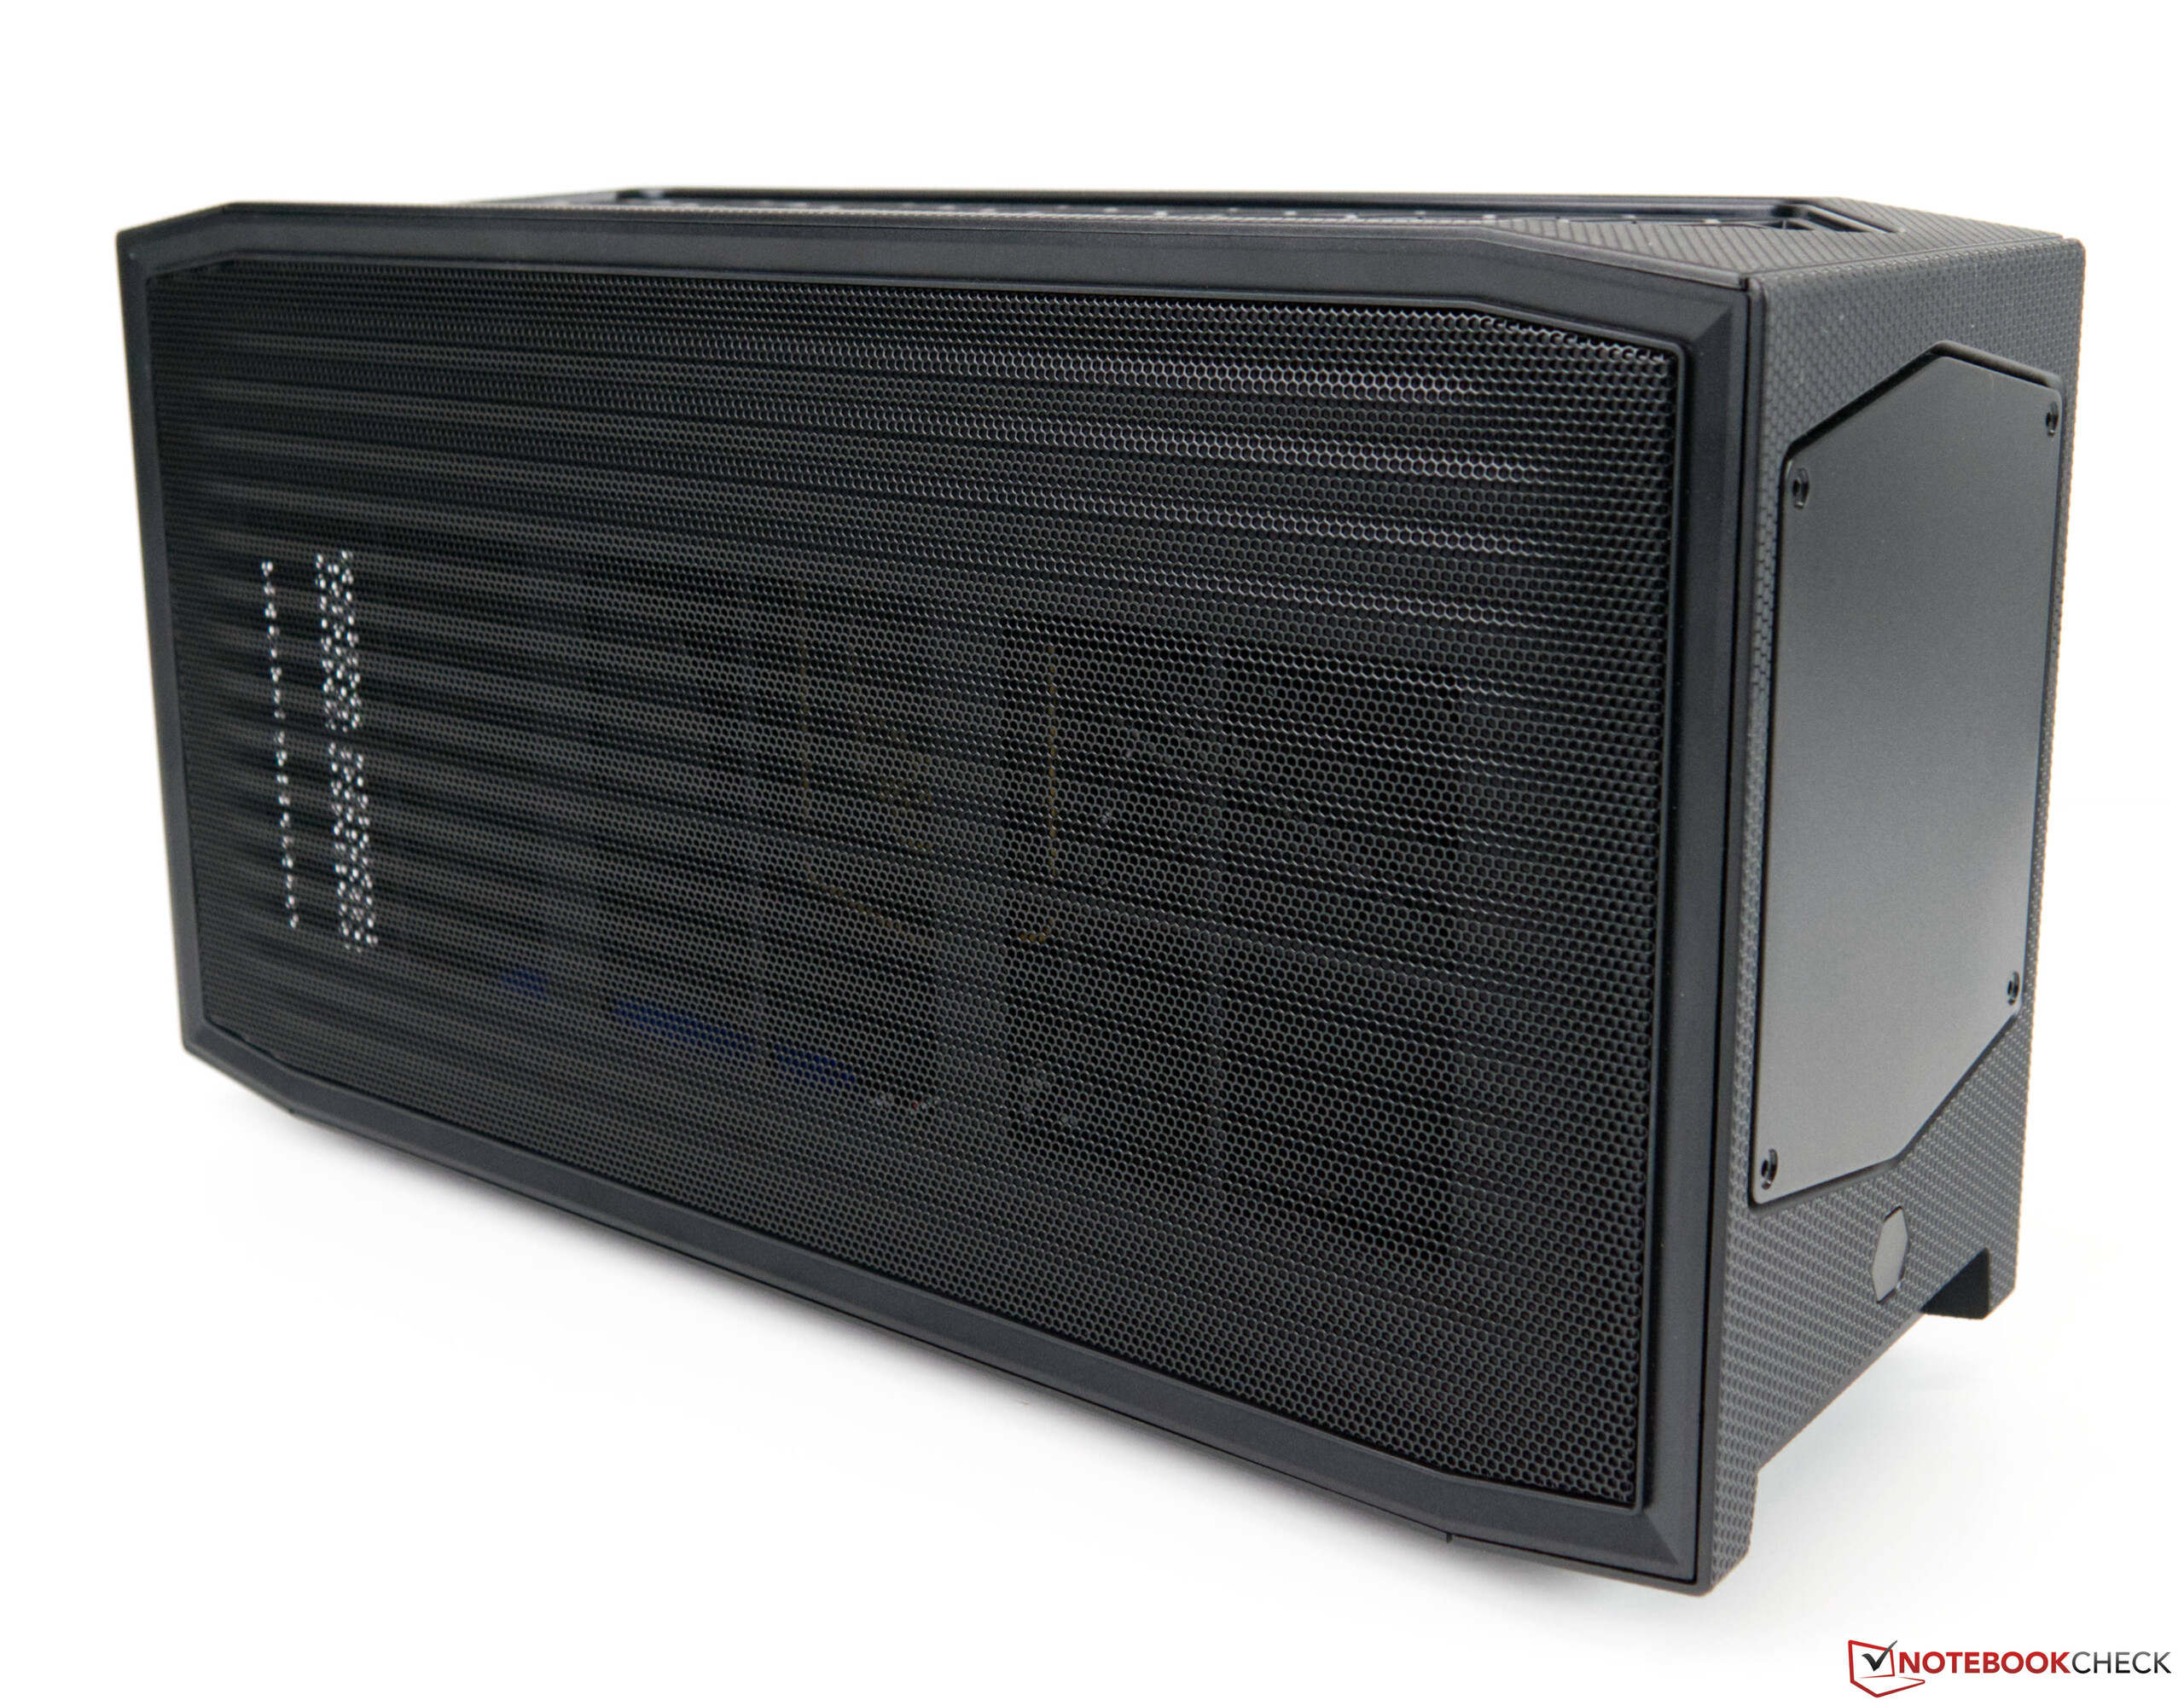
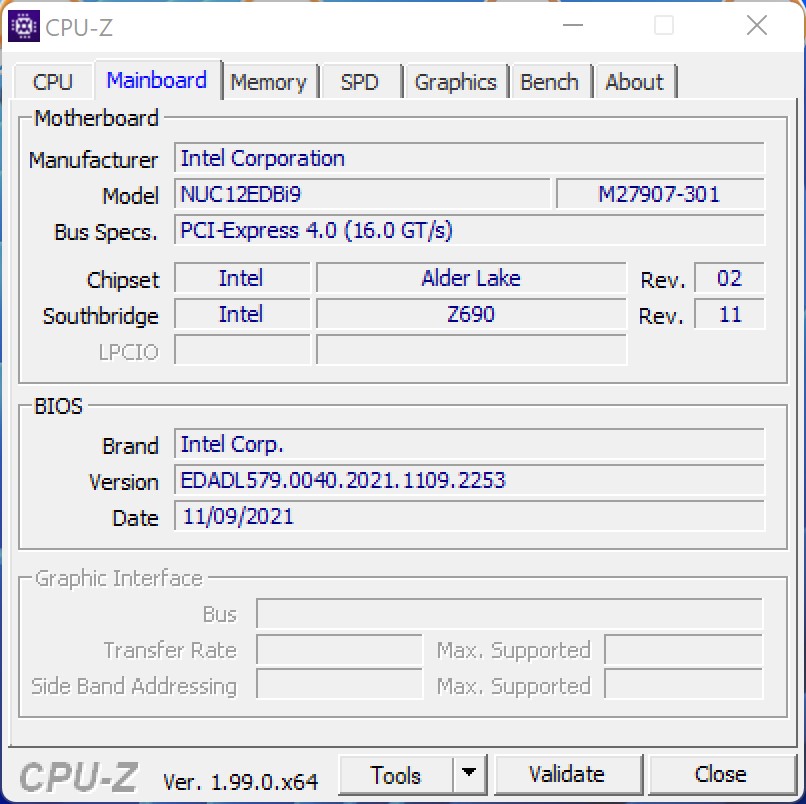
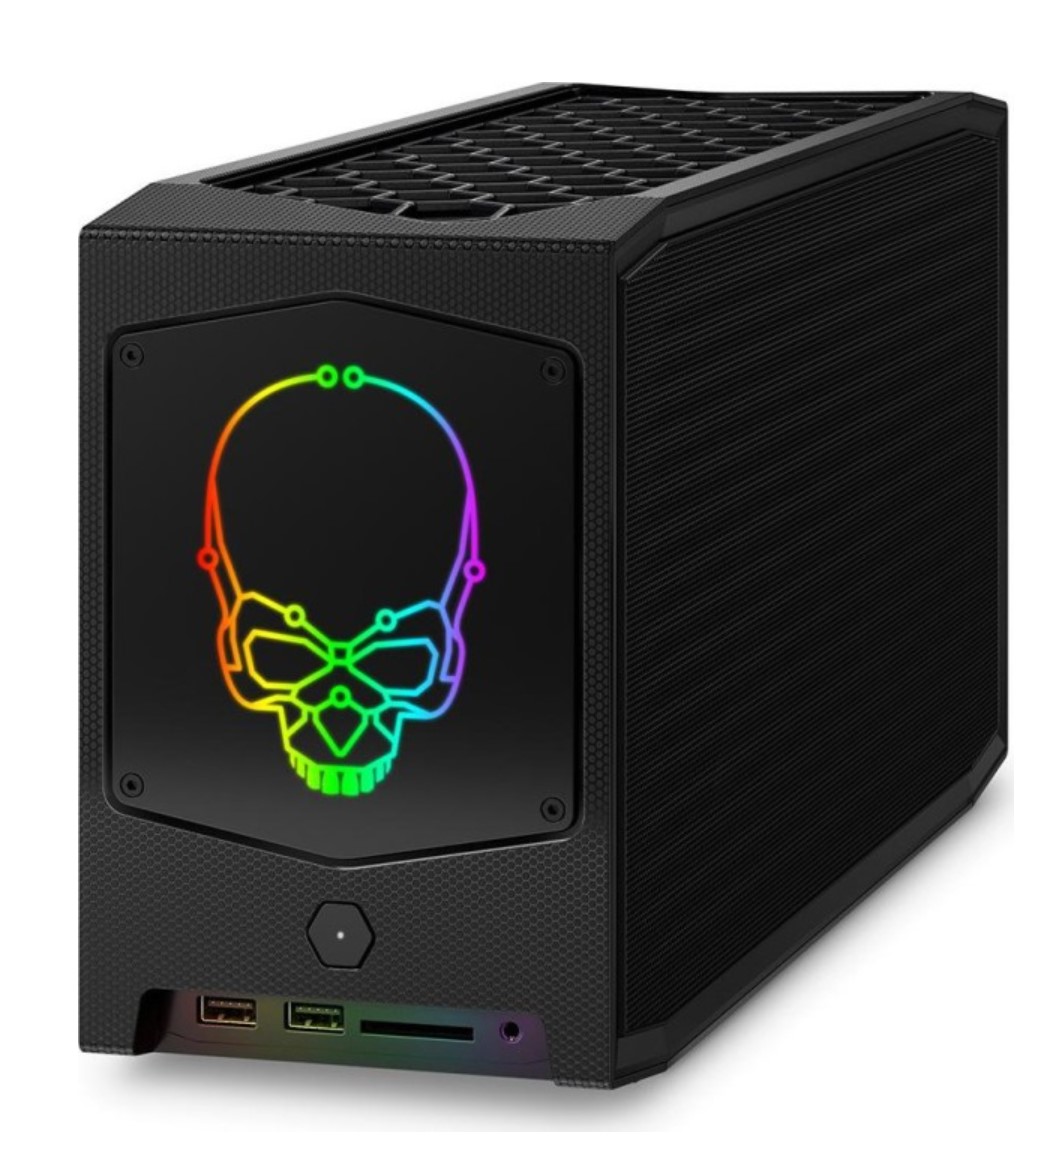
Intel NUC Extreme Kit har redan varit känt under en längre tid. Med sin kompakta konstruktion och goda utrustning sticker den ut från mängden, och designen av den kompakta skrivbordsdatorn är lätt att känna igen,utan tvekan.

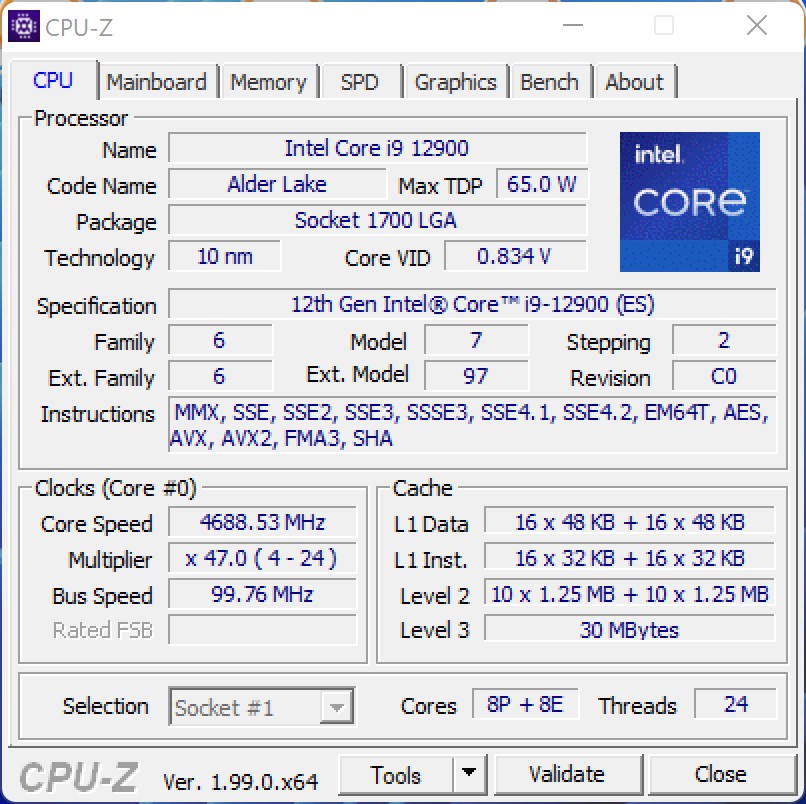
Vi tog nyligen en detaljerad titt påIntel NUC 11 Extreme Kit alias Beast Canyon och blev redan då överraskade av dess kraftfulla kapacitet. Med Intel NUC 12 Extreme Kit alias Dragon Canyon presenterar Intel nu efterföljaren och visar att det finns ännu mer kraft nu med den nya processorn. Men detta kunde också förväntas på grund av framstegen i chiputvecklingen, eftersom Alder Lake har en betydande fördel jämfört med den äldre Tiger Lake -plattformen. Den använder fortfarande Compute Element som vi redan känner till, vilket kombinerar alla viktiga komponenter i en dator. För första gången går Intel i riktning mot att använda en socketed CPU som vi känner till från det vanliga stationära segmentet. Här används Intel Core i9-12900 från den aktuella Alder Lake S-serien. Precis som Intel Core i9-12900K erbjuder processorn de P- och E-kärnor som vi redan känner till och som kan arbeta med upp till 24 trådar samtidigt. Med en något lägre TDP förväntar vi oss dock också en något lägre prestanda. Mer information om detta hittar du i prestandasegmentet längre ner.

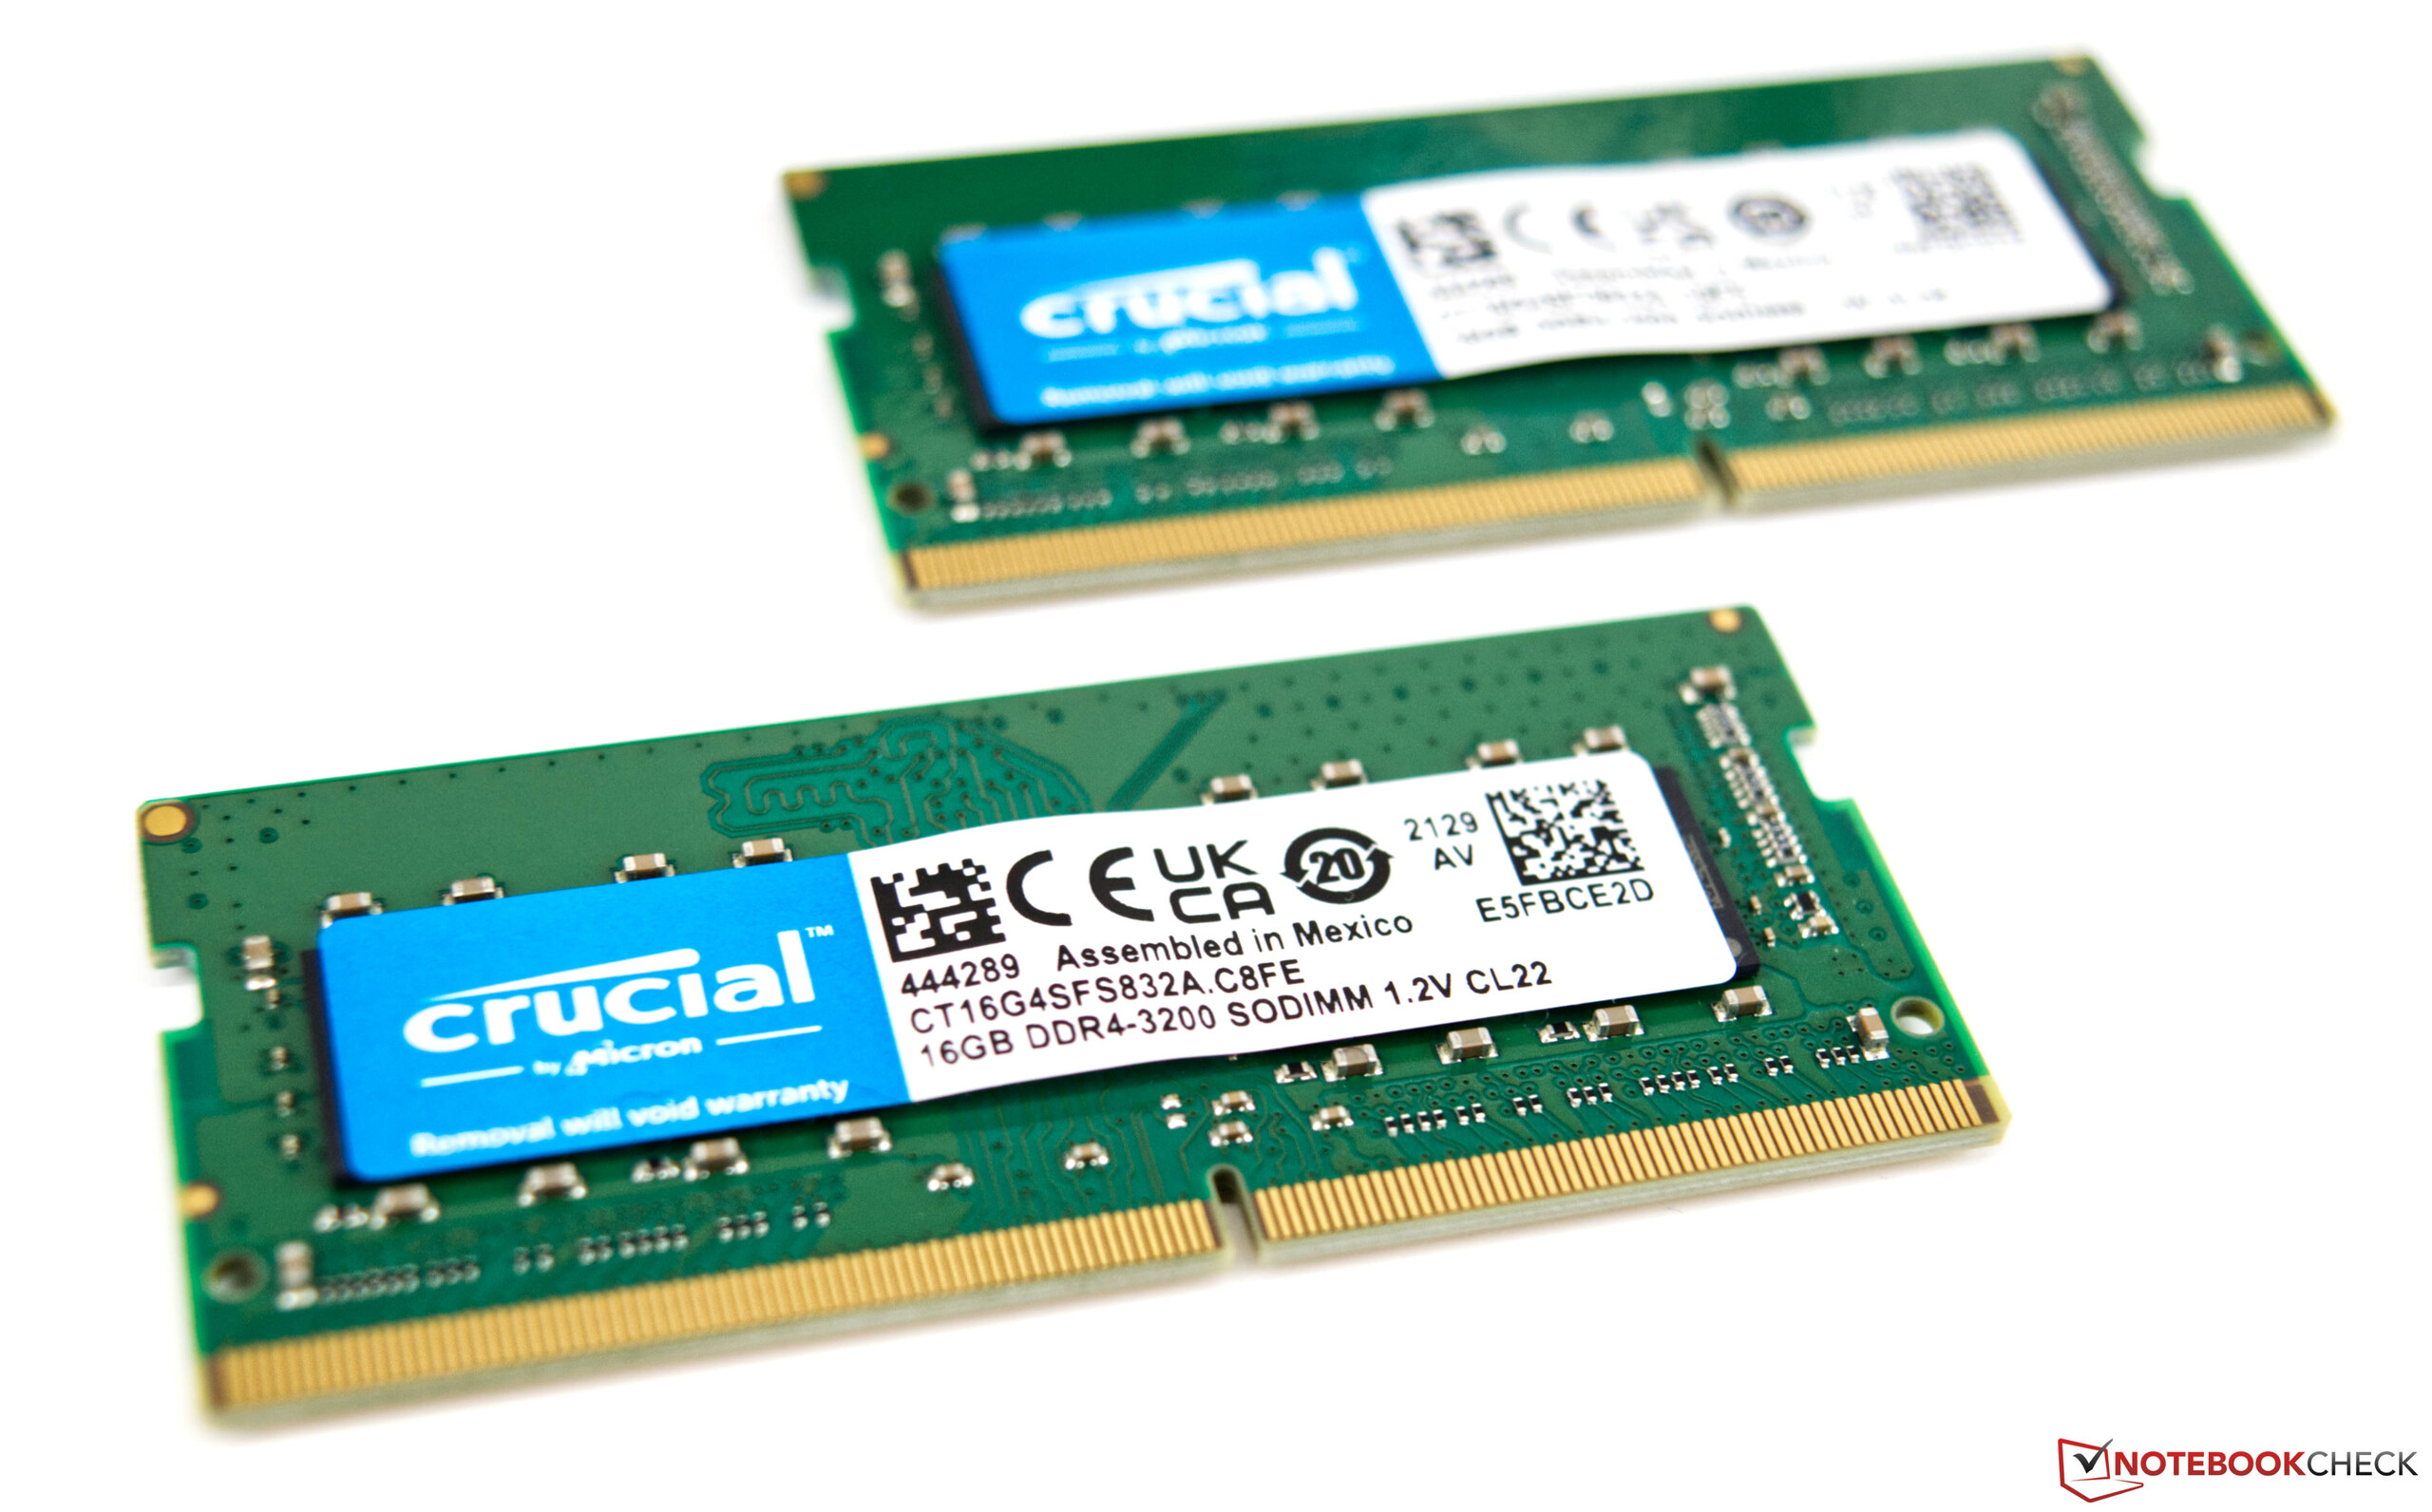
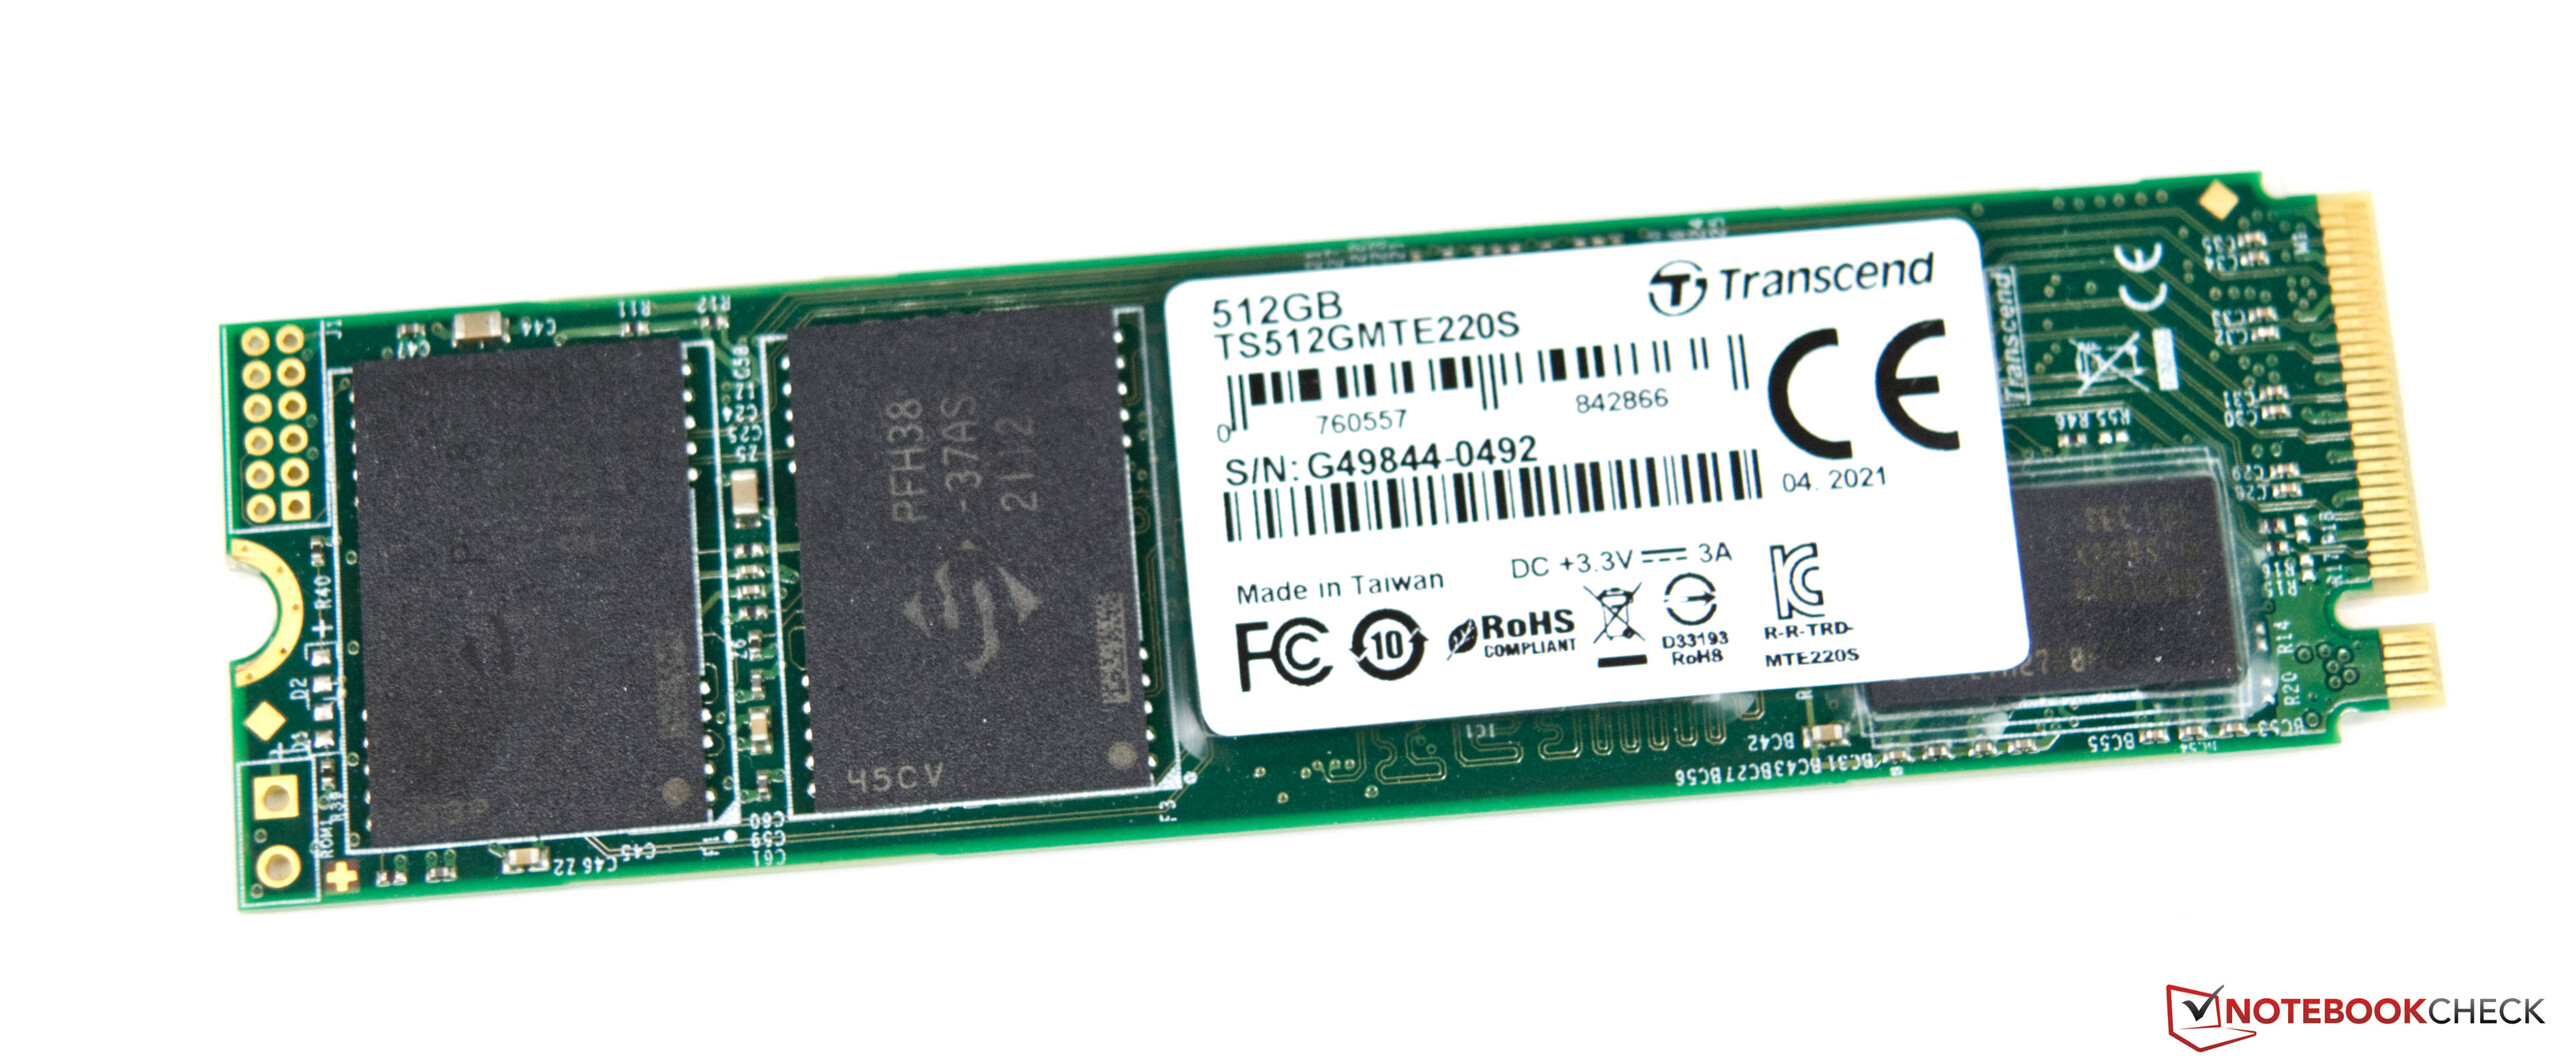
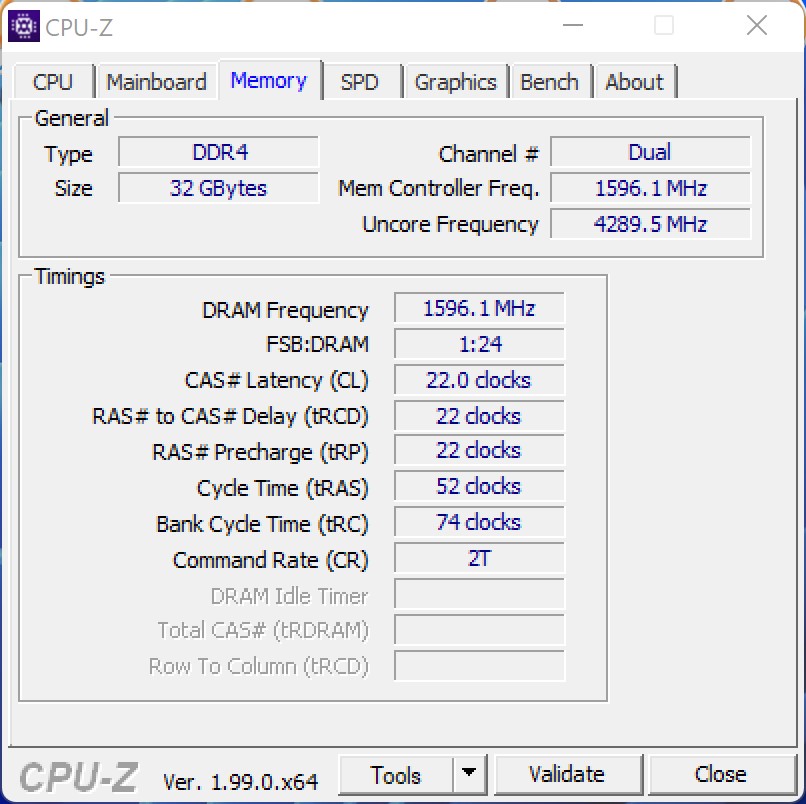
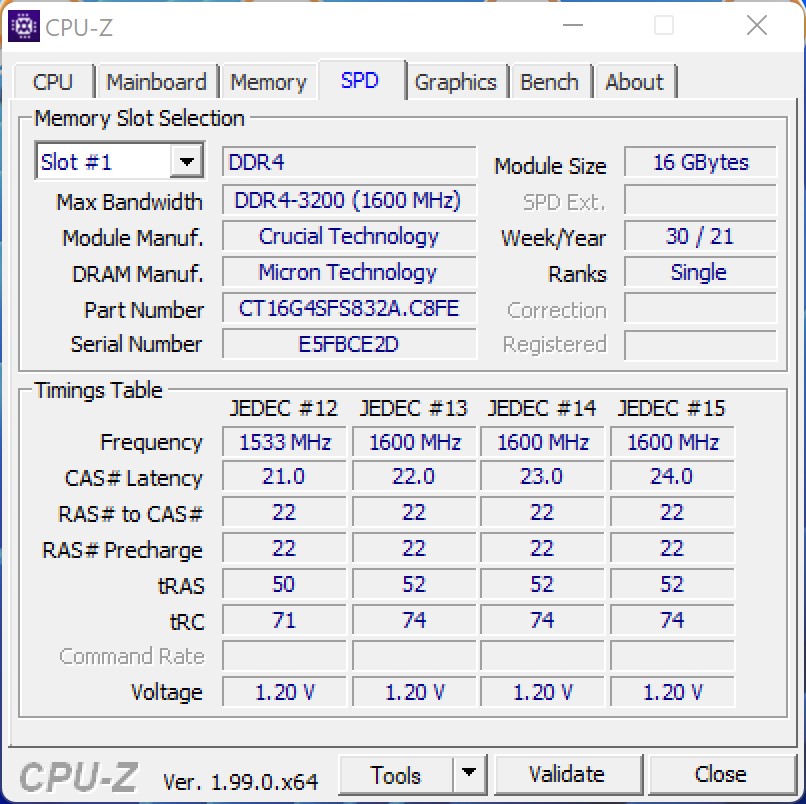
När du köper Intel NUC 12 Extreme Kit måste du tänka på att detta är ett barebone-system. SSD, RAM-minne och ett dedikerat grafikkort ingår inte. För dessa tittade vi på våra egna förnödenheter och utrustade systemet med en 512 GB NVME SSD och 32 GB DDR4 RAM. När det gäller det dedikerade grafikkortet valde vi avsiktligt Nvidia GeForce RTX 3060, för att möjliggöra en rättvis jämförelse med Intel NUC 11 Extreme Kit.

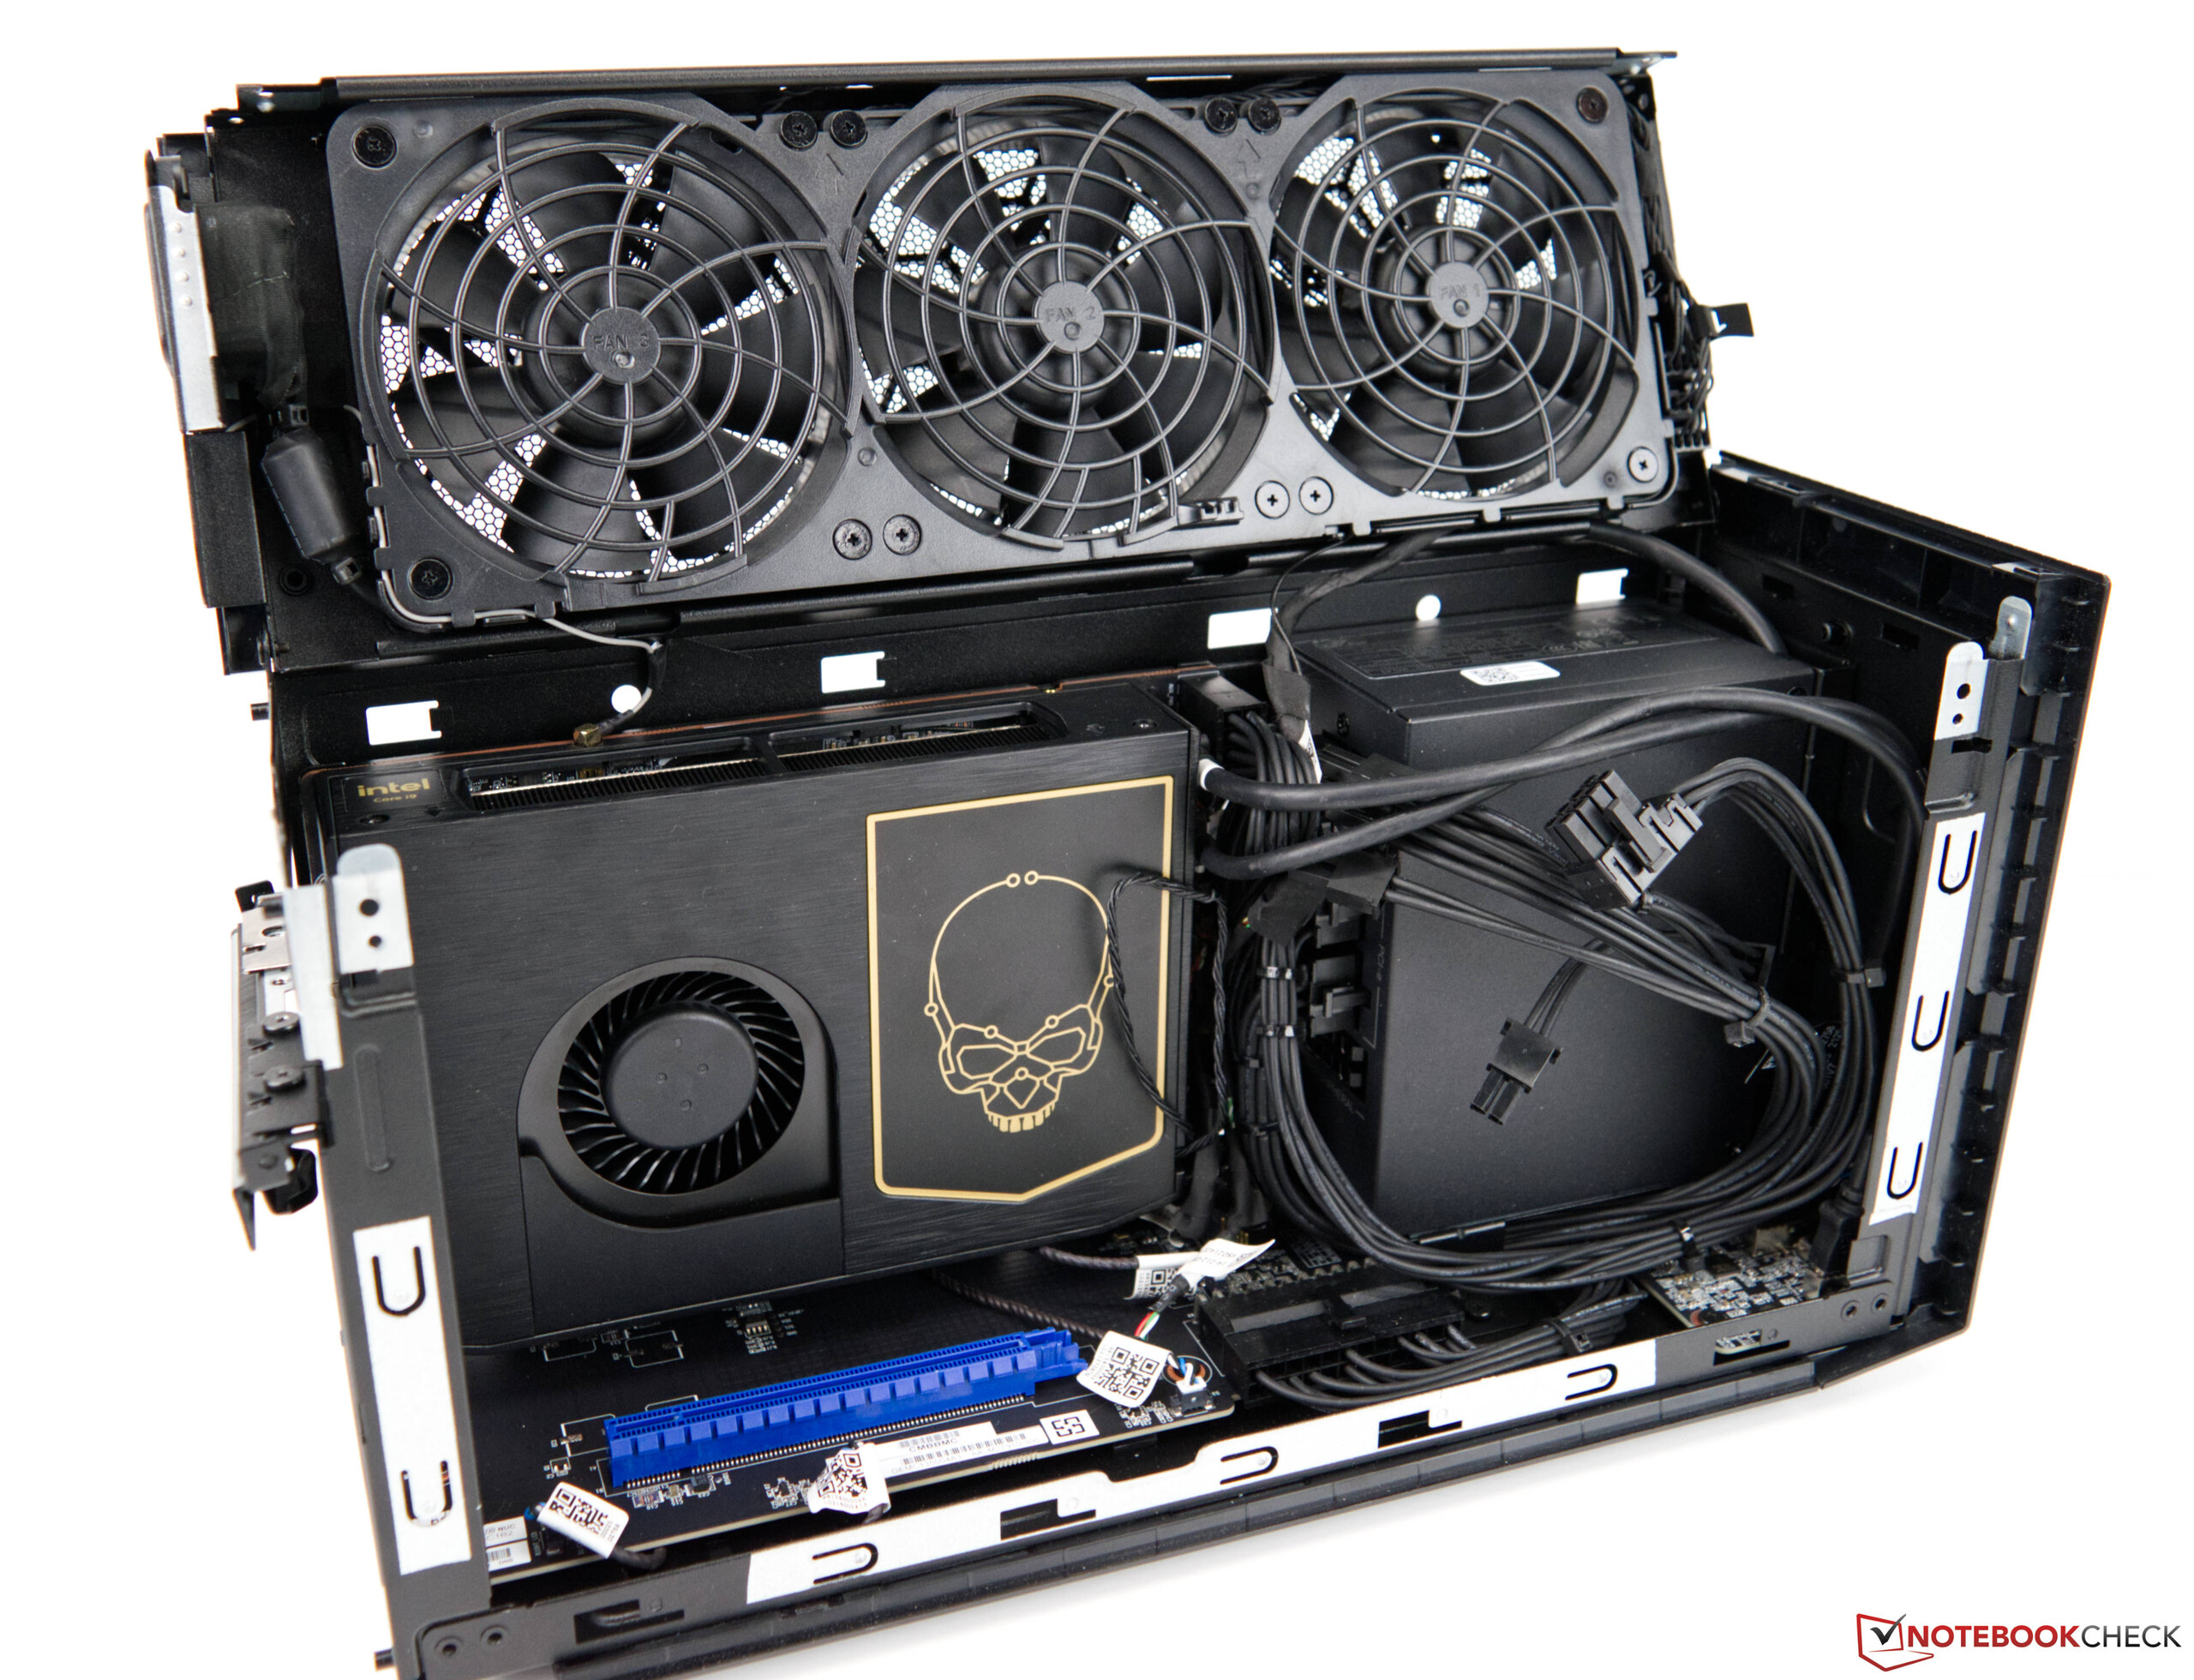
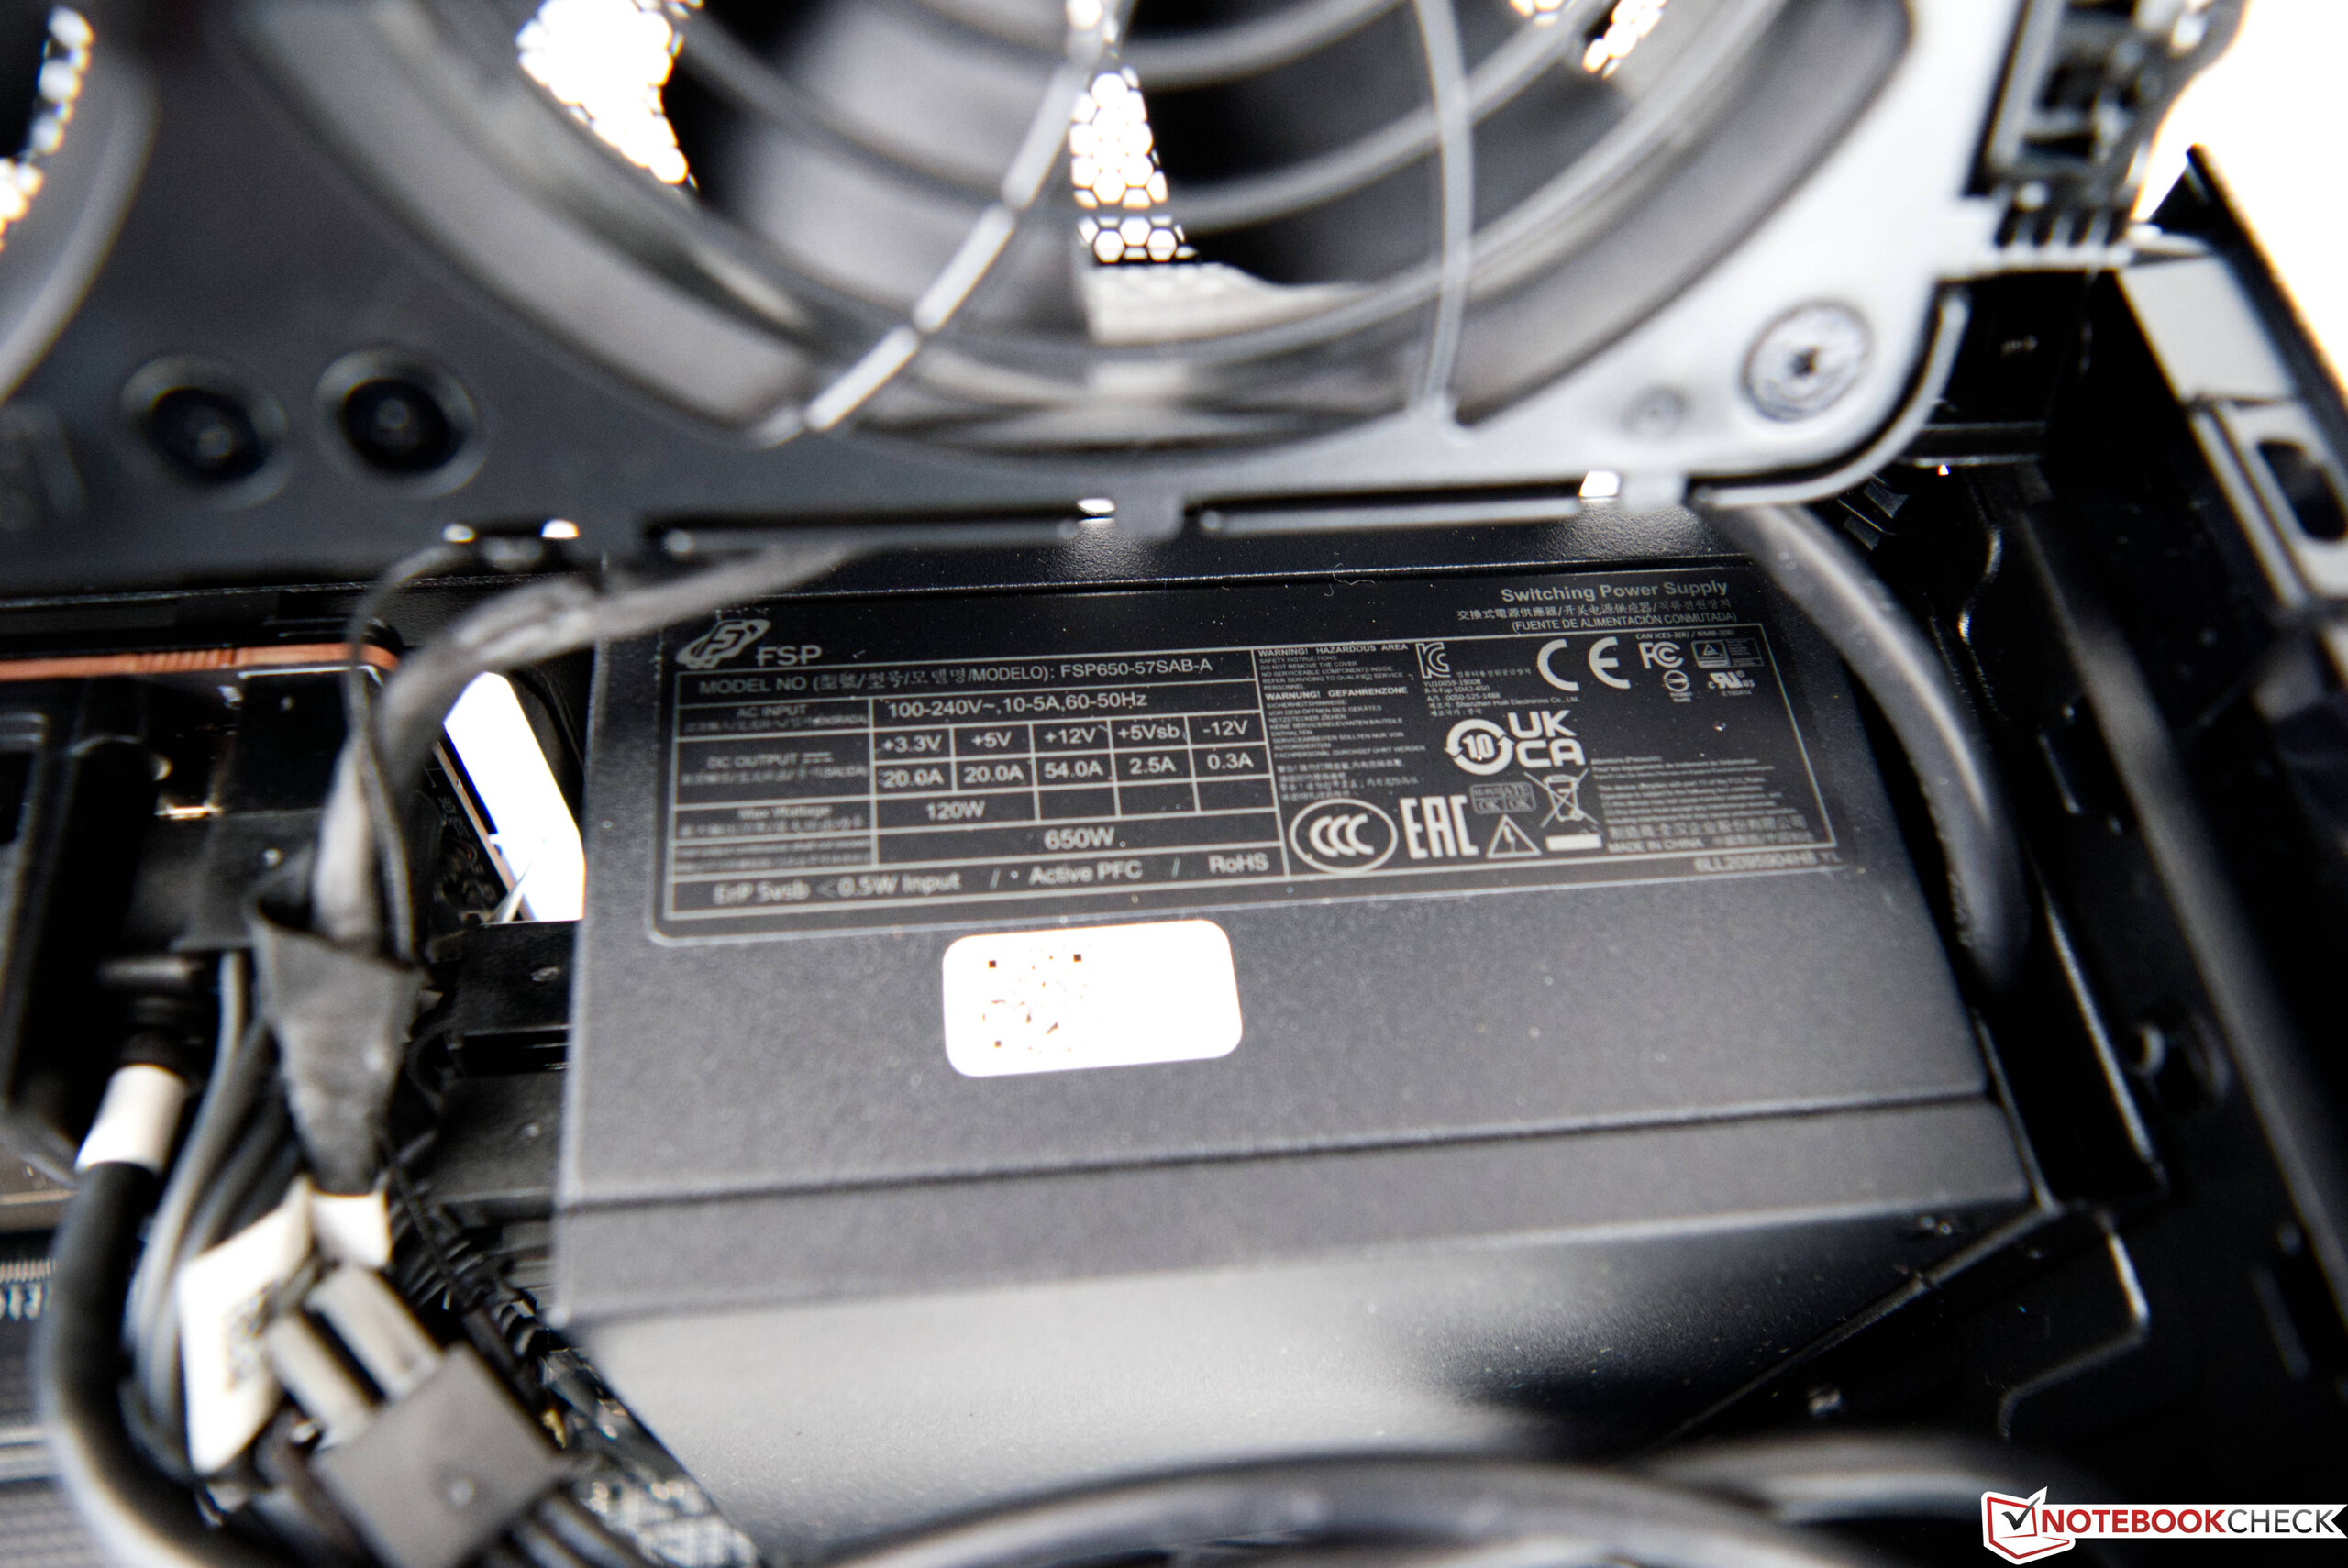
För ett dedikerat grafikkort kan du använda modeller med en maximal längd på 30,5 cm (~12 tum). SFX-strömförsörjningen på 650 watt ger tillräckligt med kraft för att även köra de nuvarande avancerade modellerna. Kylningen av dessa pixelacceleratorer bör dock inte ta upp mer än två kortplatser. Du kan för närvarande få Intel NUC 12 Extreme Kit för 1450 euro (~1589 dollar).

Intel Dragon Canyon NUC - RTX 3060
Processor
Intel Core i9-12900 16 x 2.4 - 5.1 GHz, 202 W PL2 / Short Burst, 65 W PL1 / Sustained, Alder Lake
Grafikkort
NVIDIA GeForce RTX 3060 - 12 GB VRAM, Kärna: 1777 MHz, Minne: 15000 MHz, GDDR6, Nvidia 511.79
Minne
32 GB 
, DDR4-3200
Moderkort
Intel Z690 (Alder Lake-S PCH)
Hårddisk
Transcend M.2 SSD 2200S TS512GMTE220S, 512 GB 
Anslutningar
1 USB 2.0, 10 USB 3.1 Gen2, 2 Thunderbolt, 1 HDMI, 1 DisplayPort, Kortläsare: SDXC with UHS-II support
Nätverk
Aquantia AQtion 10Gbit Network Adapter (10/100/1000/2500/5000/10000MBit/s), Intel Wi-Fi 6E AX211 (a/b/g/h/n = Wi-Fi 4/ac = Wi-Fi 5/ax = Wi-Fi 6/ Wi-Fi 6E 6 GHz), Bluetooth 5.2
Storlek
höjd x bredd x djup (i mm) 189 x 120 x 357
Övrigt
36 Månader Garanti
Pris
0 Kr
Note: The manufacturer may use components from different suppliers including display panels, drives or memory sticks with similar specifications.


Intel NUC 12 Extreme Kit Dragon Canyon
SO-DIMM 32-GB DDR4-3200
Transcend 512 GB NVME-SSD

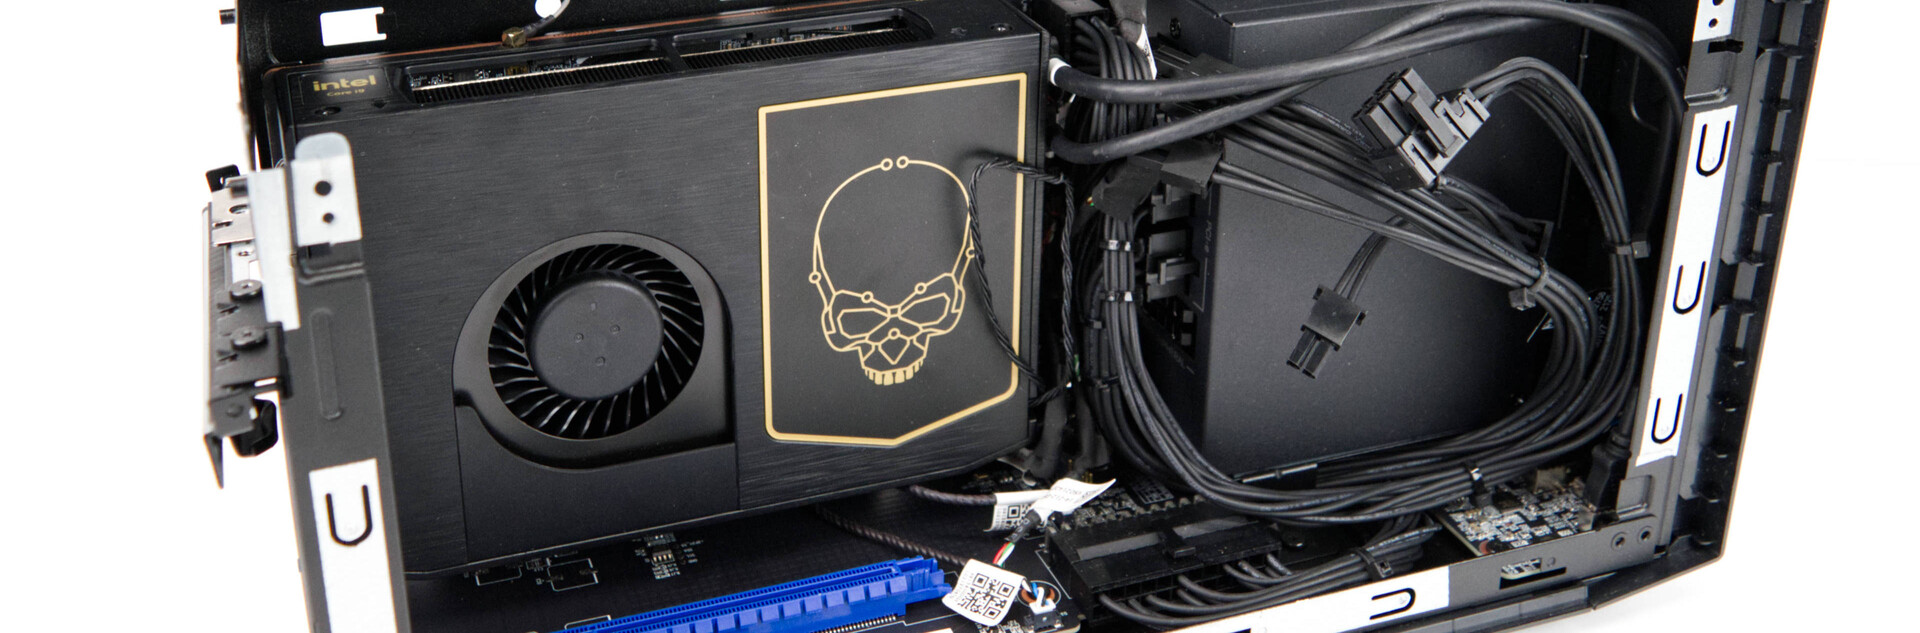
Intel NUC 12 Extreme Compute Element i detalj

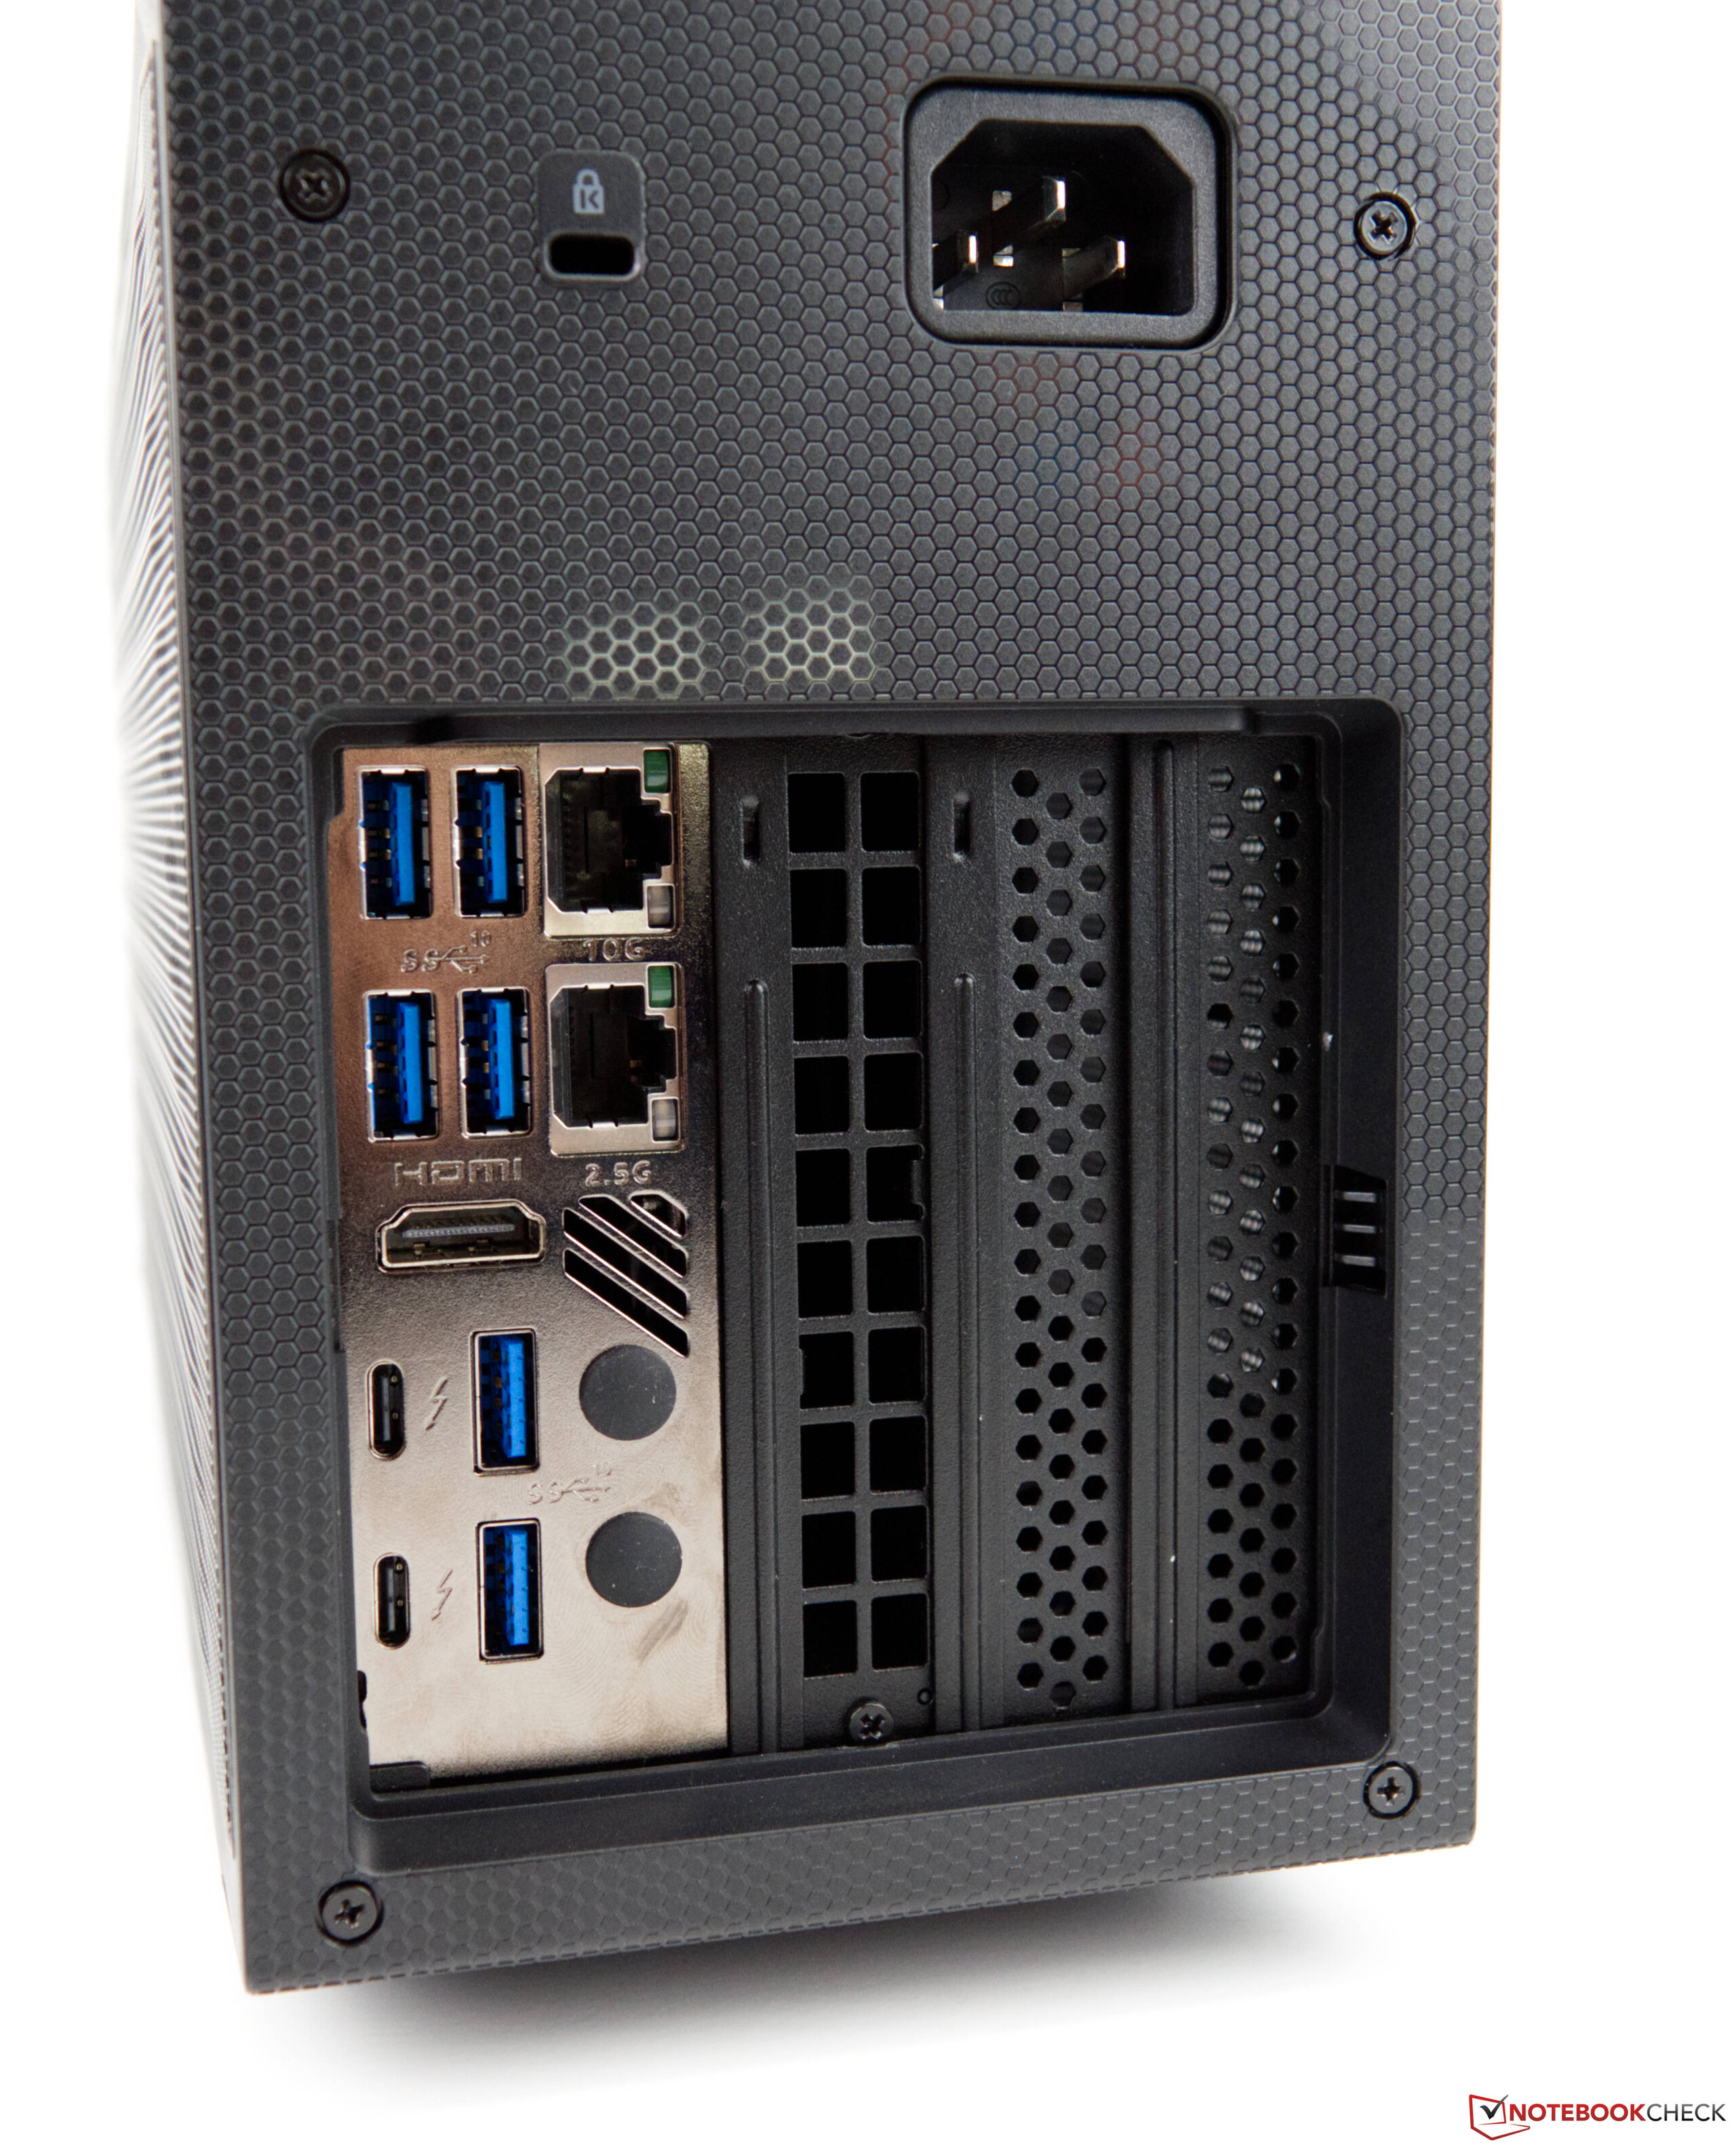
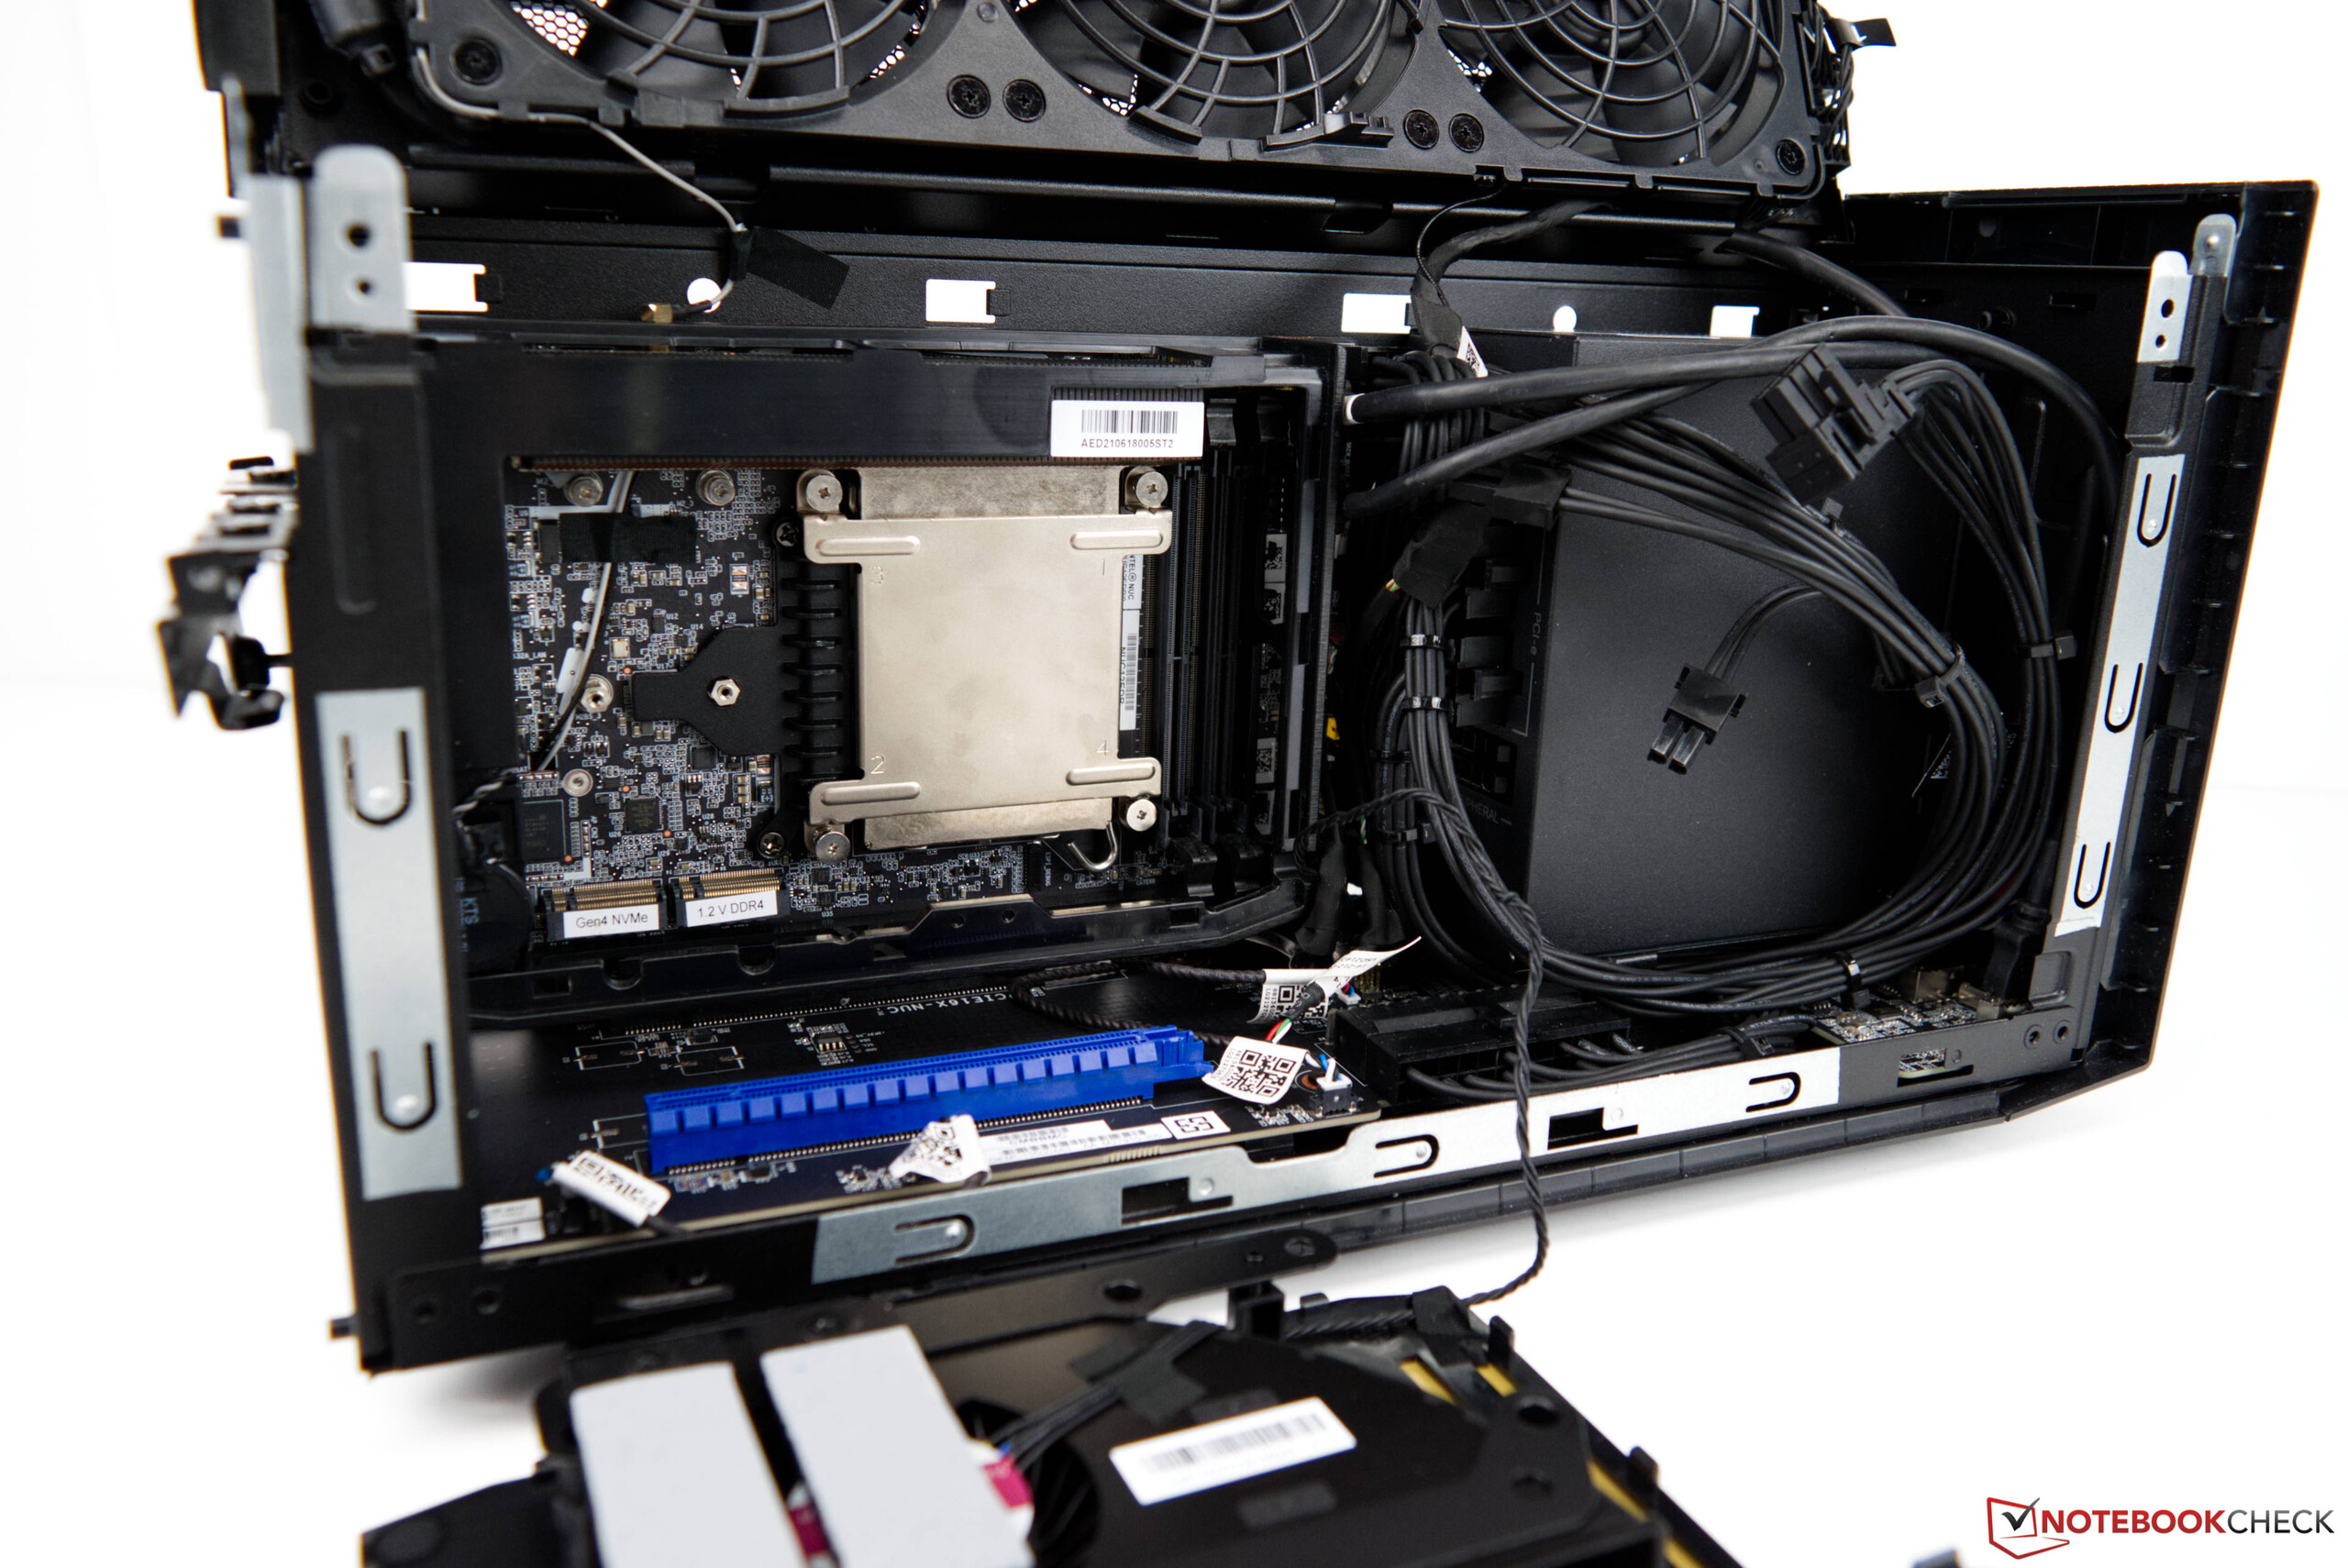
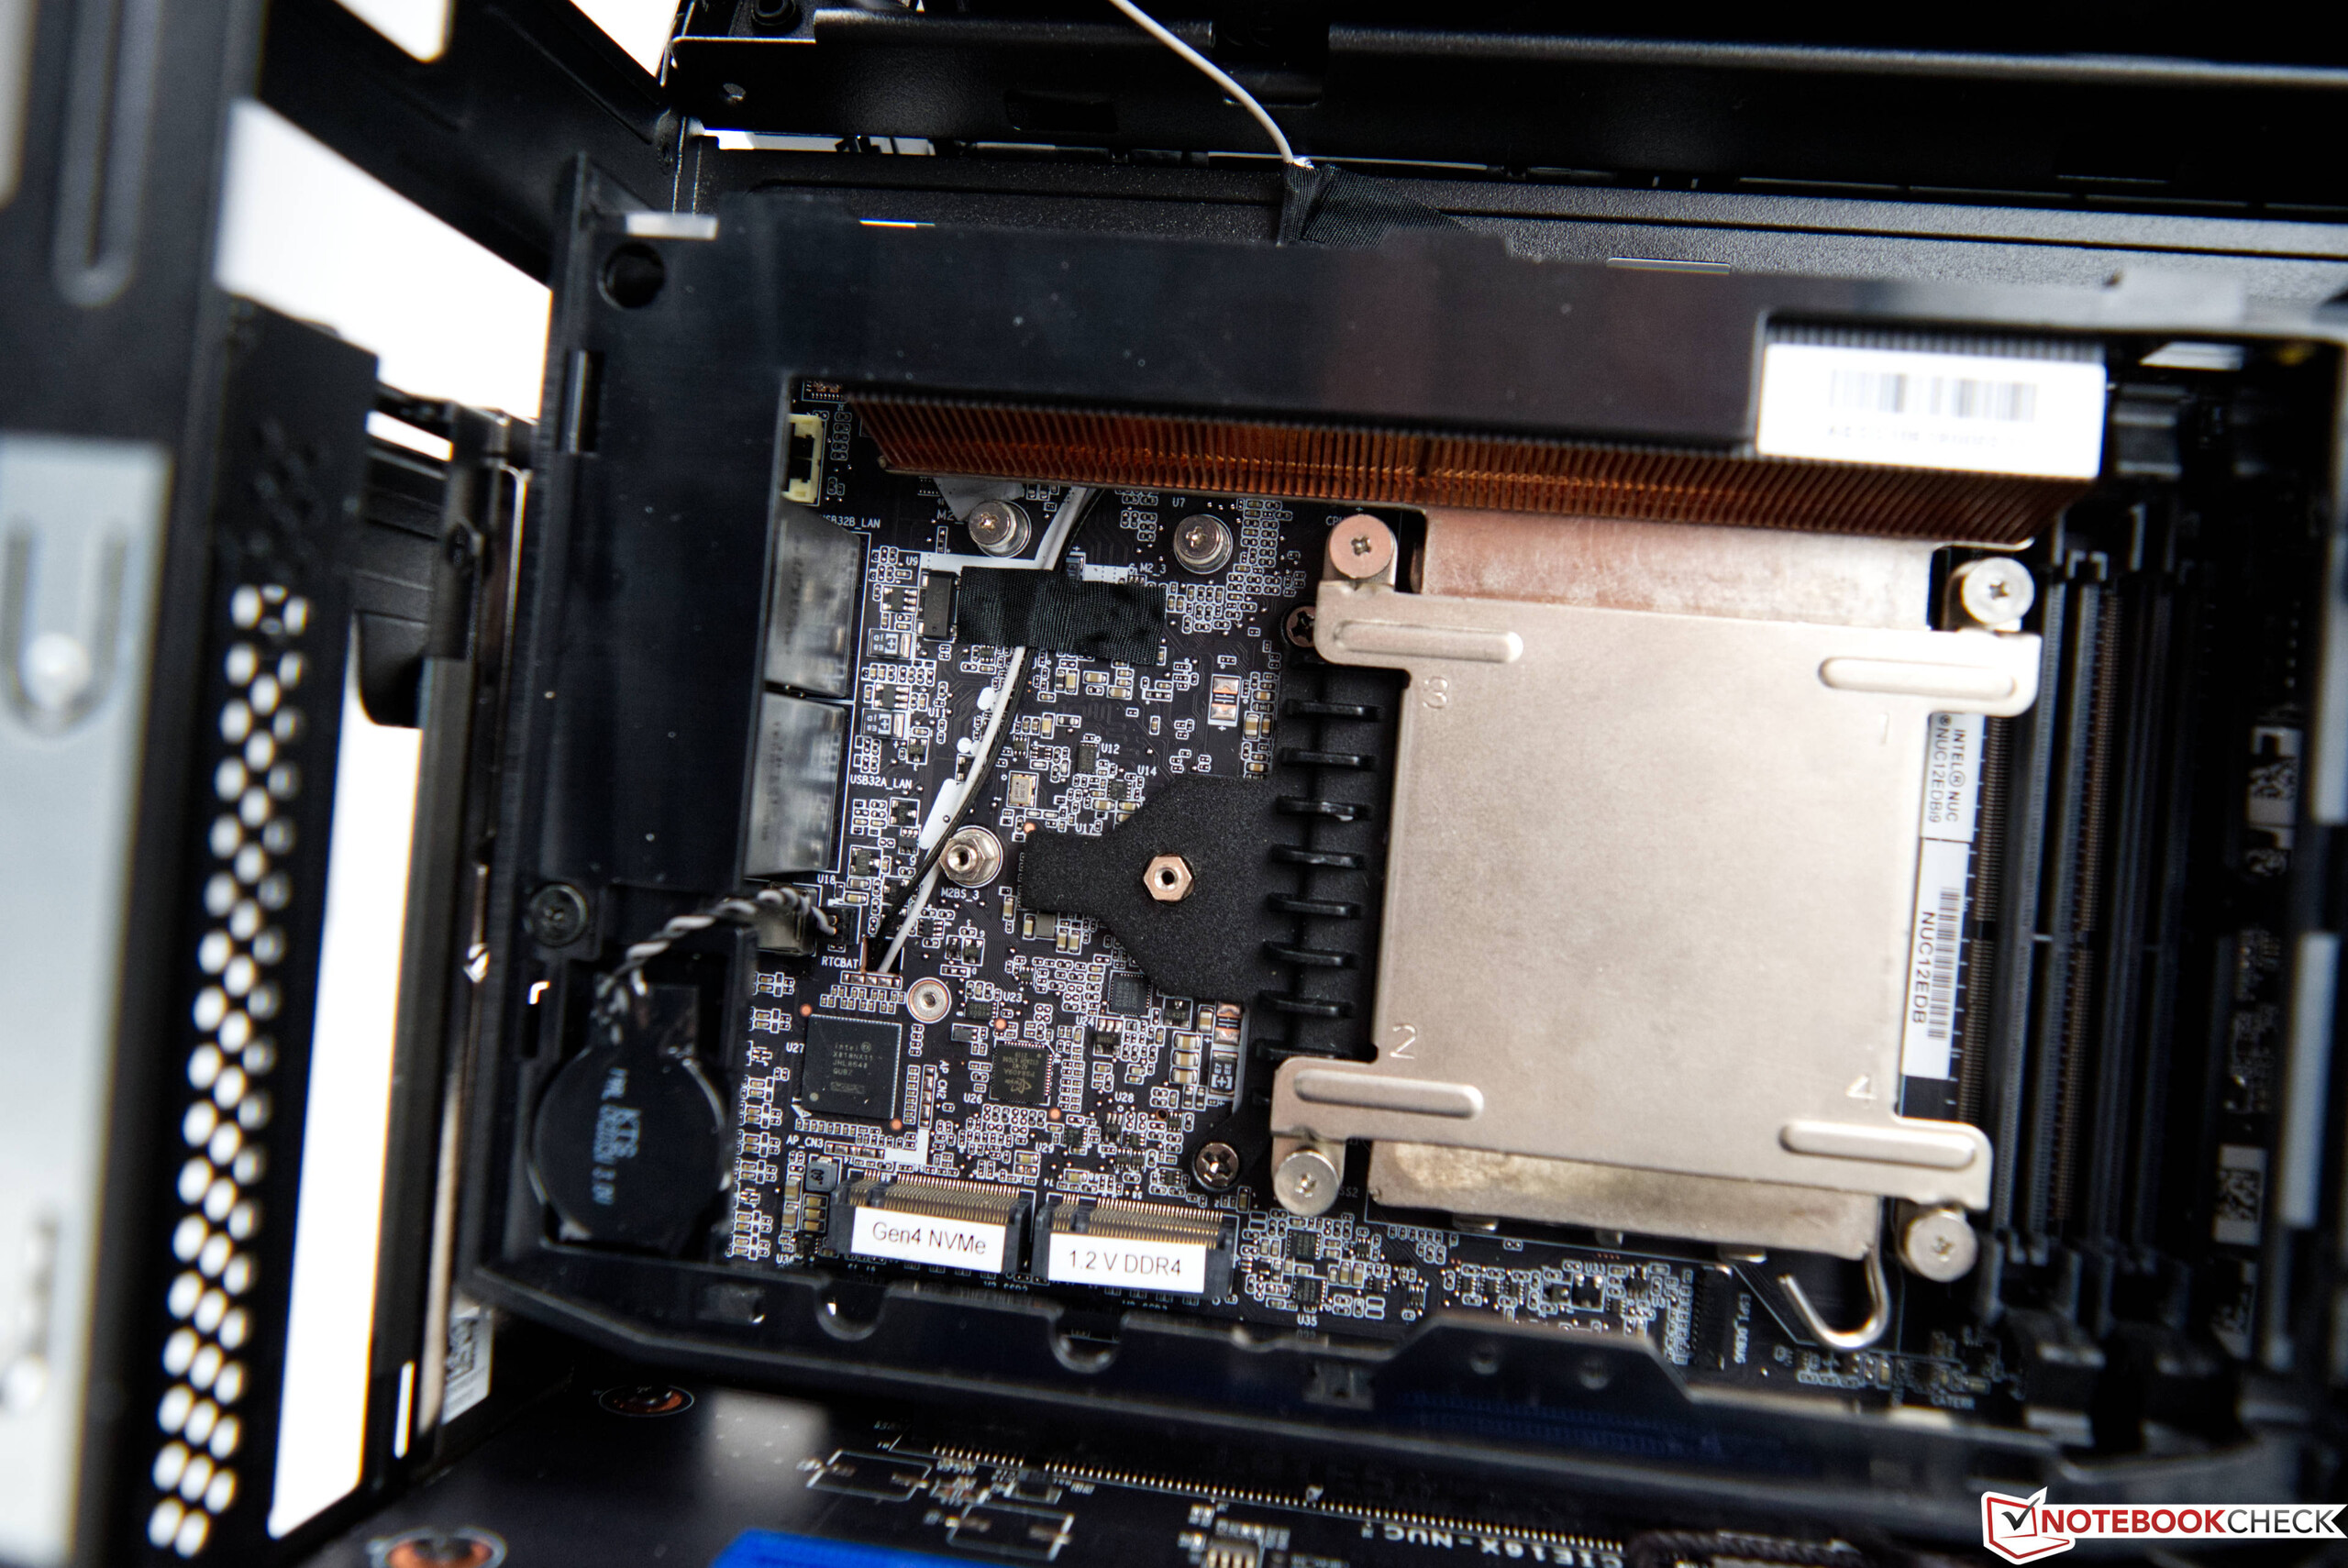
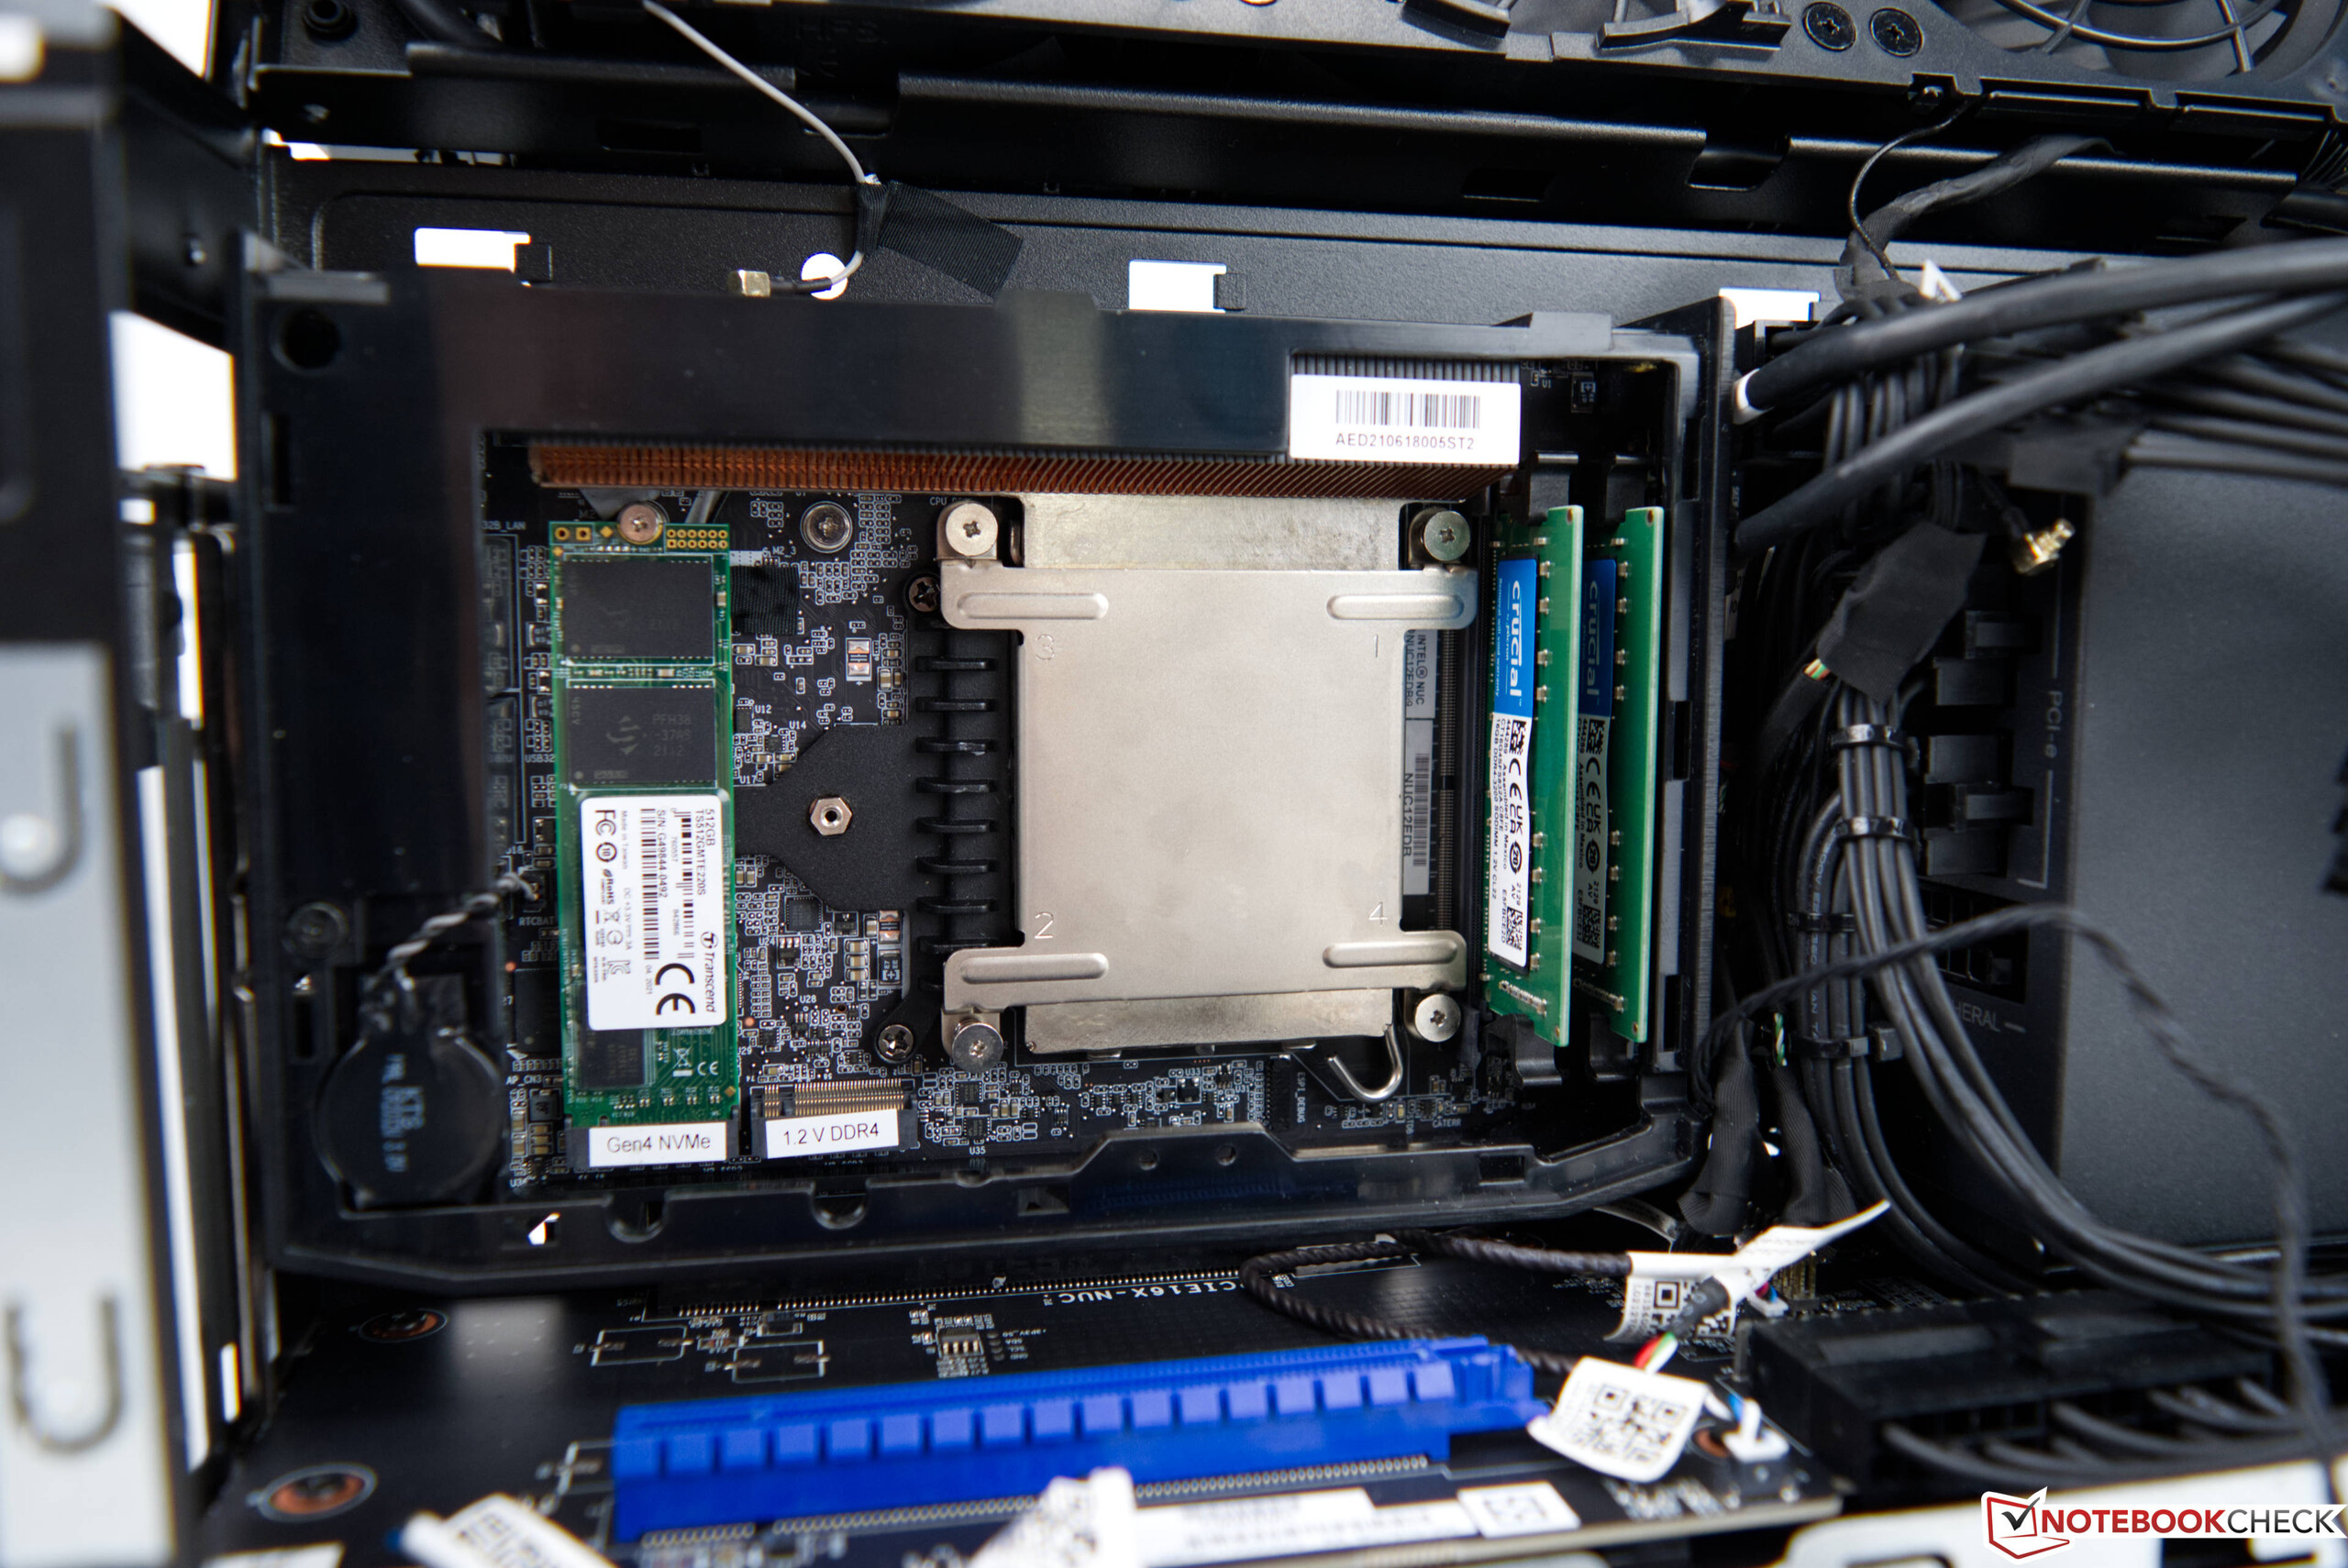
Med Intel Core i9-12900 erbjuder Intel NUC 12 Extremeen 16-kärnig SoC med 24 trådar baserad på Alder Lake S-serien. Som vi redan nämnt använder Core i9-12900 en blandning av P- och E-kärnor. Till skillnad från Intel NUC 11 Extreme Kittidigare används nu en fullskalig skrivbordsprocessor. Alla externa anslutningar fortsätter att placeras på Compute Element, som är inrymt i systemet i den kända formen av ett PCI Express-kort. På baksidan finns sex USB 3.1 Gen2 Type-A-anslutningar och två USB-C-anslutningar som stöder Thunderbolt 4. Med HDMI eller Thunderbolt kan du köra upp till tre skärmar samtidigt. Det finns 10G- och 2,5G-anslutningar för trådbundna nätverk. Dessutom kommunicerar Intel WiFi 6E AX211 med hjälp av den senaste standarden. Själva Compute Element erbjuder plats för två SO-DIMM RAM-moduler på upp till 64 GB vardera, och det finns även plats för två M.2 SSD-enheter.

WLAN-prestanda

I WLAN-testet kan Intel WiFi 6E AX211 uppnå mycket goda överföringshastigheter i 6 GHz-området i kombination med vår testrouter ASUS GT-AXE11000. I vårt test mäter vi drygt 1850 Mbit/s i genomsnitt när vi skickar eller tar emot data.

Networking
iperf3 transmit AXE11000 6GHz
Intel Dragon Canyon NUC - RTX 3060
Intel Wi-Fi 6E AX211
1851 (1799min - 1897max) MBit/s
Average of class
  (229 - 1961, n=400)
1385 MBit/s -25%
Average Intel Wi-Fi 6E AX211
  (632 - 1851, n=173)
1371 MBit/s -26%
Minisforum EliteMini TH50
MediaTek MT7921
866 (502min - 950max) MBit/s -53%
iperf3 receive AXE11000 6GHz
Intel Dragon Canyon NUC - RTX 3060
Intel Wi-Fi 6E AX211
1848 (1731min - 1888max) MBit/s
Average Intel Wi-Fi 6E AX211
  (883 - 1857, n=172)
1489 MBit/s -19%
Average of class
  (390 - 1858, n=401)
1433 MBit/s -22%
Minisforum EliteMini TH50
MediaTek MT7921
776 (482min - 881max) MBit/s -58%
iperf3 receive AX12
MSI Vector GP66 12UGS
Intel Wi-Fi 6E AX211
1462 (1366min - 1531max) MBit/s
Average Intel Wi-Fi 6E AX211
  (1178 - 1623, n=4)
1409 MBit/s
Alienware x14 i7 RTX 3060
Intel Wi-Fi 6E AX211
1371 (1221min - 1483max) MBit/s
Average of class
  (5 - 2374, n=2624)
621 MBit/s
iperf3 transmit AX12
MSI Vector GP66 12UGS
Intel Wi-Fi 6E AX211
1501 (755min - 1562max) MBit/s
Alienware x14 i7 RTX 3060
Intel Wi-Fi 6E AX211
1410 (1239min - 1603max) MBit/s
Average Intel Wi-Fi 6E AX211
  (1003 - 1501, n=4)
1320 MBit/s
Average of class
  (5.59 - 2371, n=2621)
587 MBit/s

Benchmarks för processorer

Intel Core i9-12900 är en skrivbordsmodell från den nuvarande Alder Lake S-serien. PL1-strömförbrukningen är 65 watt, vilket kan ökas upp till PL2-värdet på 202 watt.

Intel Core i9-12900 gör rättvisa åt sin klass i testet och överträffar prestandan hos följande modeller Intel Core i9-11900KBmed 15 %, om vi tittar på resultaten i alla riktmärken (prestandaklassificering). När man jämför med vanliga stationära system kan Intel Core i9-12900 i Intel NUC 12 Extreme Kit också hålla jämna steg med en AMD Ryzen 7 5800X eller Intel Core i9-11900K. Å andra sidan kanIntel Core i7-12700Kkan slå vår Dragon Canyon NUC, och vi ser ett första tecken på en något strypad prestanda på grund av det mycket lilla kylsystemet. Nackdelen håller sig dock inom ramarna, och Intel Core i7-12700K var knappt 10 % snabbare i testet

Du kan hitta ytterligare jämförelser och benchmarks i vår Jämförelsetabell för processorer.

CPU-Z
CPU-Z
CPU-Z
CPU-Z
CPU-Z
CPU-Z
XTU
XTU - riktmärke
Performance Rating - Percent
Intel Core i9-12900K, NVIDIA Titan RTX
i9-12900K, 3200 MHz
63.4 pt
Intel Core i7-12700K, NVIDIA Titan RTX
i7-12700K, 2700 MHz
59.4 pt
Intel Core i9-12900, NVIDIA GeForce RTX 3060
i9-12900, 2400 MHz
54.3 pt
AMD Ryzen 7 5800X, NVIDIA Titan RTX
R7 5800X, 3800 MHz
54.2 pt
Intel Core i9-11900K, NVIDIA Titan RTX
i9-11900K, 3500 MHz
52.4 pt
AMD Ryzen 9 3950X, NVIDIA Titan RTX
R9 3950X, 3500 MHz
51.4 pt
Intel Core i9-10900K, NVIDIA Titan RTX
i9-10900K, 3700 MHz
50.9 pt
Intel Core i9-11900KB, NVIDIA GeForce RTX 3060
i9-11900KB, 3300 MHz
48.1 pt
Intel Core i5-11600K, NVIDIA Titan RTX
i5-11600K, 3900 MHz
47.7 pt
AMD Ryzen 7 3800XT, NVIDIA Titan RTX
R7 3800XT, 3900 MHz
46.9 pt
Intel Core i9-9980HK, NVIDIA GeForce RTX 2070 (Desktop)
i9-9980HK, 2400 MHz
43.7 pt
Intel Core i5-10600K, NVIDIA Titan RTX
i5-10600K, 4100 MHz
42.2 pt
Cinebench R15
CPU Single 64Bit
Intel Core i9-12900K, NVIDIA Titan RTX
i9-12900K, 3200 MHz
286 Points +9%
Intel Core i7-12700K, NVIDIA Titan RTX
i7-12700K, 2700 MHz
272 Points +4%
AMD Ryzen 7 5800X, NVIDIA Titan RTX
R7 5800X, 3800 MHz
266 Points +2%
Intel Core i9-11900K, NVIDIA Titan RTX
i9-11900K, 3500 MHz
262 Points 0%
Intel Core i9-12900, NVIDIA GeForce RTX 3060
i9-12900, 2400 MHz
262 Points
Intel Core i9-11900KB, NVIDIA GeForce RTX 3060
i9-11900KB, 3300 MHz
247 Points -6%
Intel Core i5-11600K, NVIDIA Titan RTX
i5-11600K, 3900 MHz
242 Points -8%
Intel Core i9-10900K, NVIDIA Titan RTX
i9-10900K, 3700 MHz
224 Points -15%
AMD Ryzen 7 3800XT, NVIDIA Titan RTX
R7 3800XT, 3900 MHz
219 Points -16%
Intel Core i9-9980HK, NVIDIA GeForce RTX 2070 (Desktop)
i9-9980HK, 2400 MHz
215 Points -18%
AMD Ryzen 9 3950X, NVIDIA Titan RTX
R9 3950X, 3500 MHz
209 Points -20%
Intel Core i5-10600K, NVIDIA Titan RTX
i5-10600K, 4100 MHz
205 Points -22%
CPU Multi 64Bit
Intel Core i9-12900K, NVIDIA Titan RTX
i9-12900K, 3200 MHz
4057 Points +23%
AMD Ryzen 9 3950X, NVIDIA Titan RTX
R9 3950X, 3500 MHz
4002 Points +21%
Intel Core i7-12700K, NVIDIA Titan RTX
i7-12700K, 2700 MHz
3325 Points +1%
Intel Core i9-12900, NVIDIA GeForce RTX 3060
i9-12900, 2400 MHz
3299 Points
Intel Core i9-10900K, NVIDIA Titan RTX
i9-10900K, 3700 MHz
2620 Points -21%
AMD Ryzen 7 5800X, NVIDIA Titan RTX
R7 5800X, 3800 MHz
2616 Points -21%
Intel Core i9-11900K, NVIDIA Titan RTX
i9-11900K, 3500 MHz
2436 Points -26%
AMD Ryzen 7 3800XT, NVIDIA Titan RTX
R7 3800XT, 3900 MHz
2230 Points -32%
Intel Core i9-11900KB, NVIDIA GeForce RTX 3060
i9-11900KB, 3300 MHz
2027 Points -39%
Intel Core i5-11600K, NVIDIA Titan RTX
i5-11600K, 3900 MHz
1738 Points -47%
Intel Core i9-9980HK, NVIDIA GeForce RTX 2070 (Desktop)
i9-9980HK, 2400 MHz
1607 Points -51%
Intel Core i5-10600K, NVIDIA Titan RTX
i5-10600K, 4100 MHz
1452 Points -56%
Cinebench R20
CPU (Single Core)
Intel Core i9-12900K, NVIDIA Titan RTX
i9-12900K, 3200 MHz
766 Points +9%
Intel Core i7-12700K, NVIDIA Titan RTX
i7-12700K, 2700 MHz
731 Points +4%
Intel Core i9-12900, NVIDIA GeForce RTX 3060
i9-12900, 2400 MHz
703 Points
Intel Core i9-11900K, NVIDIA Titan RTX
i9-11900K, 3500 MHz
647 Points -8%
Intel Core i9-11900KB, NVIDIA GeForce RTX 3060
i9-11900KB, 3300 MHz
629 Points -11%
AMD Ryzen 7 5800X, NVIDIA Titan RTX
R7 5800X, 3800 MHz
625 Points -11%
Intel Core i5-11600K, NVIDIA Titan RTX
i5-11600K, 3900 MHz
595 Points -15%
AMD Ryzen 7 3800XT, NVIDIA Titan RTX
R7 3800XT, 3900 MHz
544 Points -23%
Intel Core i9-10900K, NVIDIA Titan RTX
i9-10900K, 3700 MHz
532 Points -24%
AMD Ryzen 9 3950X, NVIDIA Titan RTX
R9 3950X, 3500 MHz
520 Points -26%
Intel Core i9-9980HK, NVIDIA GeForce RTX 2070 (Desktop)
i9-9980HK, 2400 MHz
504 Points -28%
Intel Core i5-10600K, NVIDIA Titan RTX
i5-10600K, 4100 MHz
464 Points -34%
CPU (Multi Core)
Intel Core i9-12900K, NVIDIA Titan RTX
i9-12900K, 3200 MHz
10240 Points +43%
AMD Ryzen 9 3950X, NVIDIA Titan RTX
R9 3950X, 3500 MHz
9075 Points +26%
Intel Core i7-12700K, NVIDIA Titan RTX
i7-12700K, 2700 MHz
8648 Points +20%
Intel Core i9-12900, NVIDIA GeForce RTX 3060
i9-12900, 2400 MHz
7179 Points
Intel Core i9-10900K, NVIDIA Titan RTX
i9-10900K, 3700 MHz
6381 Points -11%
AMD Ryzen 7 5800X, NVIDIA Titan RTX
R7 5800X, 3800 MHz
6068 Points -15%
Intel Core i9-11900K, NVIDIA Titan RTX
i9-11900K, 3500 MHz
5997 Points -16%
AMD Ryzen 7 3800XT, NVIDIA Titan RTX
R7 3800XT, 3900 MHz
5120 Points -29%
Intel Core i9-11900KB, NVIDIA GeForce RTX 3060
i9-11900KB, 3300 MHz
4644 Points -35%
Intel Core i5-11600K, NVIDIA Titan RTX
i5-11600K, 3900 MHz
4349 Points -39%
Intel Core i5-10600K, NVIDIA Titan RTX
i5-10600K, 4100 MHz
3443 Points -52%
Intel Core i9-9980HK, NVIDIA GeForce RTX 2070 (Desktop)
i9-9980HK, 2400 MHz
3357 Points -53%
Cinebench R11.5
CPU Single 64Bit
Intel Core i9-12900K, NVIDIA Titan RTX
i9-12900K, 3200 MHz
3.49 Points +10%
Intel Core i7-12700K, NVIDIA Titan RTX
i7-12700K, 2700 MHz
3.29 Points +4%
Intel Core i9-12900, NVIDIA GeForce RTX 3060
i9-12900, 2400 MHz
3.16 Points
Intel Core i9-11900K, NVIDIA Titan RTX
i9-11900K, 3500 MHz
3.1 Points -2%
AMD Ryzen 7 5800X, NVIDIA Titan RTX
R7 5800X, 3800 MHz
3.09 Points -2%
Intel Core i5-11600K, NVIDIA Titan RTX
i5-11600K, 3900 MHz
2.87 Points -9%
Intel Core i9-11900KB, NVIDIA GeForce RTX 3060
i9-11900KB, 3300 MHz
2.84 Points -10%
Intel Core i9-10900K, NVIDIA Titan RTX
i9-10900K, 3700 MHz
2.56 Points -19%
Intel Core i9-9980HK, NVIDIA GeForce RTX 2070 (Desktop)
i9-9980HK, 2400 MHz
2.4 Points -24%
AMD Ryzen 9 3950X, NVIDIA Titan RTX
R9 3950X, 3500 MHz
2.37 Points -25%
AMD Ryzen 7 3800XT, NVIDIA Titan RTX
R7 3800XT, 3900 MHz
2.36 Points -25%
Intel Core i5-10600K, NVIDIA Titan RTX
i5-10600K, 4100 MHz
2.19 Points -31%
CPU Multi 64Bit
Intel Core i9-12900K, NVIDIA Titan RTX
i9-12900K, 3200 MHz
47.06 Points +21%
AMD Ryzen 9 3950X, NVIDIA Titan RTX
R9 3950X, 3500 MHz
43.68 Points +12%
Intel Core i9-12900, NVIDIA GeForce RTX 3060
i9-12900, 2400 MHz
38.96 Points
Intel Core i7-12700K, NVIDIA Titan RTX
i7-12700K, 2700 MHz
38.38 Points -1%
AMD Ryzen 7 5800X, NVIDIA Titan RTX
R7 5800X, 3800 MHz
29.31 Points -25%
Intel Core i9-10900K, NVIDIA Titan RTX
i9-10900K, 3700 MHz
29.03 Points -25%
Intel Core i9-11900K, NVIDIA Titan RTX
i9-11900K, 3500 MHz
26.76 Points -31%
AMD Ryzen 7 3800XT, NVIDIA Titan RTX
R7 3800XT, 3900 MHz
24.18 Points -38%
Intel Core i9-11900KB, NVIDIA GeForce RTX 3060
i9-11900KB, 3300 MHz
22.07 Points -43%
Intel Core i5-11600K, NVIDIA Titan RTX
i5-11600K, 3900 MHz
19.32 Points -50%
Intel Core i9-9980HK, NVIDIA GeForce RTX 2070 (Desktop)
i9-9980HK, 2400 MHz
18.04 Points -54%
Intel Core i5-10600K, NVIDIA Titan RTX
i5-10600K, 4100 MHz
15.76 Points -60%
Cinebench R10
Rendering Single CPUs 64Bit
Intel Core i9-12900K, NVIDIA Titan RTX
i9-12900K, 3200 MHz
16144 Points +10%
Intel Core i7-12700K, NVIDIA Titan RTX
i7-12700K, 2700 MHz
15179 Points +4%
Intel Core i9-12900, NVIDIA GeForce RTX 3060
i9-12900, 2400 MHz
14610 Points
Intel Core i9-11900K, NVIDIA Titan RTX
i9-11900K, 3500 MHz
14149 Points -3%
AMD Ryzen 7 5800X, NVIDIA Titan RTX
R7 5800X, 3800 MHz
13039 Points -11%
Intel Core i5-11600K, NVIDIA Titan RTX
i5-11600K, 3900 MHz
12957 Points -11%
Intel Core i9-11900KB, NVIDIA GeForce RTX 3060
i9-11900KB, 3300 MHz
12508 Points -14%
Intel Core i9-10900K, NVIDIA Titan RTX
i9-10900K, 3700 MHz
10625 Points -27%
AMD Ryzen 9 3950X, NVIDIA Titan RTX
R9 3950X, 3500 MHz
10580 Points -28%
AMD Ryzen 7 3800XT, NVIDIA Titan RTX
R7 3800XT, 3900 MHz
10497 Points -28%
Intel Core i9-9980HK, NVIDIA GeForce RTX 2070 (Desktop)
i9-9980HK, 2400 MHz
10359 Points -29%
Intel Core i5-10600K, NVIDIA Titan RTX
i5-10600K, 4100 MHz
9594 Points -34%
Rendering Multiple CPUs 64Bit
Intel Core i9-12900K, NVIDIA Titan RTX
i9-12900K, 3200 MHz
112749 Points +5%
Intel Core i9-12900, NVIDIA GeForce RTX 3060
i9-12900, 2400 MHz
107565 Points
Intel Core i7-12700K, NVIDIA Titan RTX
i7-12700K, 2700 MHz
102539 Points -5%
AMD Ryzen 9 3950X, NVIDIA Titan RTX
R9 3950X, 3500 MHz
86232 Points -20%
AMD Ryzen 7 5800X, NVIDIA Titan RTX
R7 5800X, 3800 MHz
83426 Points -22%
Intel Core i9-11900K, NVIDIA Titan RTX
i9-11900K, 3500 MHz
80613 Points -25%
Intel Core i9-10900K, NVIDIA Titan RTX
i9-10900K, 3700 MHz
80495 Points -25%
AMD Ryzen 7 3800XT, NVIDIA Titan RTX
R7 3800XT, 3900 MHz
68388 Points -36%
Intel Core i9-11900KB, NVIDIA GeForce RTX 3060
i9-11900KB, 3300 MHz
67183 Points -38%
Intel Core i5-11600K, NVIDIA Titan RTX
i5-11600K, 3900 MHz
64663 Points -40%
Intel Core i9-9980HK, NVIDIA GeForce RTX 2070 (Desktop)
i9-9980HK, 2400 MHz
55742 Points -48%
Intel Core i5-10600K, NVIDIA Titan RTX
i5-10600K, 4100 MHz
51816 Points -52%
Blender - v2.79 BMW27 CPU
Intel Core i9-9980HK, NVIDIA GeForce RTX 2070 (Desktop)
i9-9980HK, 2400 MHz
317.4 Seconds * -21%
Intel Core i5-10600K, NVIDIA Titan RTX
i5-10600K, 4100 MHz
302.4 Seconds * -15%
Intel Core i5-11600K, NVIDIA Titan RTX
i5-11600K, 3900 MHz
264.5 Seconds * -1%
Intel Core i9-11900KB, NVIDIA GeForce RTX 3060
i9-11900KB, 3300 MHz
262.7 Seconds * -0%
Intel Core i9-12900, NVIDIA GeForce RTX 3060
i9-12900, 2400 MHz
262.7 Seconds *
AMD Ryzen 7 3800XT, NVIDIA Titan RTX
R7 3800XT, 3900 MHz
222.7 Seconds * +15%
AMD Ryzen 7 5800X, NVIDIA Titan RTX
R7 5800X, 3800 MHz
196.8 Seconds * +25%
Intel Core i9-11900K, NVIDIA Titan RTX
i9-11900K, 3500 MHz
190.3 Seconds * +28%
Intel Core i9-10900K, NVIDIA Titan RTX
i9-10900K, 3700 MHz
167.3 Seconds * +36%
Intel Core i7-12700K, NVIDIA Titan RTX
i7-12700K, 2700 MHz
152.3 Seconds * +42%
AMD Ryzen 9 3950X, NVIDIA Titan RTX
R9 3950X, 3500 MHz
125.8 Seconds * +52%
Intel Core i9-12900K, NVIDIA Titan RTX
i9-12900K, 3200 MHz
121.1 Seconds * +54%
wPrime 2.10
32m
Intel Core i9-12900K, NVIDIA Titan RTX
i9-12900K, 3200 MHz
4.924 s * -84%
Intel Core i5-11600K, NVIDIA Titan RTX
i5-11600K, 3900 MHz
4.919 s * -84%
Intel Core i5-10600K, NVIDIA Titan RTX
i5-10600K, 4100 MHz
4.648 s * -74%
AMD Ryzen 9 3950X, NVIDIA Titan RTX
R9 3950X, 3500 MHz
4.112 s * -54%
Intel Core i9-11900K, NVIDIA Titan RTX
i9-11900K, 3500 MHz
3.982 s * -49%
Intel Core i9-9980HK, NVIDIA GeForce RTX 2070 (Desktop)
i9-9980HK, 2400 MHz
3.788 s * -42%
AMD Ryzen 7 3800XT, NVIDIA Titan RTX
R7 3800XT, 3900 MHz
3.74 s * -40%
Intel Core i9-10900K, NVIDIA Titan RTX
i9-10900K, 3700 MHz
3.582 s * -34%
Intel Core i9-11900KB, NVIDIA GeForce RTX 3060
i9-11900KB, 3300 MHz
3.416 s * -28%
AMD Ryzen 7 5800X, NVIDIA Titan RTX
R7 5800X, 3800 MHz
3.037 s * -14%
Intel Core i9-12900, NVIDIA GeForce RTX 3060
i9-12900, 2400 MHz
2.67 s *
Intel Core i7-12700K, NVIDIA Titan RTX
i7-12700K, 2700 MHz
2.659 s * -0%
1024m
Intel Core i9-12900, NVIDIA GeForce RTX 3060
i9-12900, 2400 MHz
211.8 s *
Intel Core i9-12900K, NVIDIA Titan RTX
i9-12900K, 3200 MHz
190.6 s * +10%
Intel Core i7-12700K, NVIDIA Titan RTX
i7-12700K, 2700 MHz
171.2 s * +19%
Intel Core i9-9980HK, NVIDIA GeForce RTX 2070 (Desktop)
i9-9980HK, 2400 MHz
120.2 s * +43%
Intel Core i5-10600K, NVIDIA Titan RTX
i5-10600K, 4100 MHz
113.2 s * +47%
Intel Core i5-11600K, NVIDIA Titan RTX
i5-11600K, 3900 MHz
107.6 s * +49%
Intel Core i9-11900KB, NVIDIA GeForce RTX 3060
i9-11900KB, 3300 MHz
102.2 s * +52%
AMD Ryzen 7 5800X, NVIDIA Titan RTX
R7 5800X, 3800 MHz
86.1 s * +59%
AMD Ryzen 7 3800XT, NVIDIA Titan RTX
R7 3800XT, 3900 MHz
81.4 s * +62%
Intel Core i9-11900K, NVIDIA Titan RTX
i9-11900K, 3500 MHz
77.9 s * +63%
Intel Core i9-10900K, NVIDIA Titan RTX
i9-10900K, 3700 MHz
66.3 s * +69%
AMD Ryzen 9 3950X, NVIDIA Titan RTX
R9 3950X, 3500 MHz
44.86 s * +79%
X264 HD Benchmark 4.0
Pass 1
Intel Core i9-12900K, NVIDIA Titan RTX
i9-12900K, 3200 MHz
368.5 (366min - 369max) fps +19%
Intel Core i7-12700K, NVIDIA Titan RTX
i7-12700K, 2700 MHz
349.5 (349min - 352max) fps +13%
AMD Ryzen 7 5800X, NVIDIA Titan RTX
R7 5800X, 3800 MHz
339 (338min - 341max) fps +9%
Intel Core i9-12900, NVIDIA GeForce RTX 3060
i9-12900, 2400 MHz
310 (303min - 324max) fps
Intel Core i9-11900K, NVIDIA Titan RTX
i9-11900K, 3500 MHz
309.5 (308min - 311max) fps 0%
Intel Core i5-11600K, NVIDIA Titan RTX
i5-11600K, 3900 MHz
299 (294min - 299max) fps -4%
Intel Core i9-10900K, NVIDIA Titan RTX
i9-10900K, 3700 MHz
289.5 (289min - 291max) fps -7%
Intel Core i9-11900KB, NVIDIA GeForce RTX 3060
i9-11900KB, 3300 MHz
272.5 (271min - 279max) fps -12%
AMD Ryzen 7 3800XT, NVIDIA Titan RTX
R7 3800XT, 3900 MHz
271 (270min - 273max) fps -13%
AMD Ryzen 9 3950X, NVIDIA Titan RTX
R9 3950X, 3500 MHz
265 (265min - 266max) fps -15%
Intel Core i5-10600K, NVIDIA Titan RTX
i5-10600K, 4100 MHz
251.5 (250min - 253max) fps -19%
Intel Core i9-9980HK, NVIDIA GeForce RTX 2070 (Desktop)
i9-9980HK, 2400 MHz
237.5 (236min - 239max) fps -23%
Pass 2
Intel Core i9-12900K, NVIDIA Titan RTX
i9-12900K, 3200 MHz
206 (206min - 206max) fps +40%
Intel Core i7-12700K, NVIDIA Titan RTX
i7-12700K, 2700 MHz
179 (179min - 179max) fps +21%
AMD Ryzen 9 3950X, NVIDIA Titan RTX
R9 3950X, 3500 MHz
168 (168min - 169max) fps +14%
AMD Ryzen 7 5800X, NVIDIA Titan RTX
R7 5800X, 3800 MHz
152 (151min - 152max) fps +3%
Intel Core i9-10900K, NVIDIA Titan RTX
i9-10900K, 3700 MHz
149 (149min - 149max) fps +1%
Intel Core i9-12900, NVIDIA GeForce RTX 3060
i9-12900, 2400 MHz
147.5 (134min - 173max) fps
Intel Core i9-11900K, NVIDIA Titan RTX
i9-11900K, 3500 MHz
137 (137min - 137max) fps -7%
AMD Ryzen 7 3800XT, NVIDIA Titan RTX
R7 3800XT, 3900 MHz
119 (118min - 119max) fps -19%
Intel Core i9-11900KB, NVIDIA GeForce RTX 3060
i9-11900KB, 3300 MHz
106 (101min - 108max) fps -28%
Intel Core i5-11600K, NVIDIA Titan RTX
i5-11600K, 3900 MHz
101 (101min - 101max) fps -32%
Intel Core i9-9980HK, NVIDIA GeForce RTX 2070 (Desktop)
i9-9980HK, 2400 MHz
92.8 (89.1min - 100max) fps -37%
Intel Core i5-10600K, NVIDIA Titan RTX
i5-10600K, 4100 MHz
88.2 (88min - 88.2max) fps -40%
WinRAR - Result
AMD Ryzen 7 5800X, NVIDIA Titan RTX
R7 5800X, 3800 MHz
15604 KB/s +45%
Intel Core i9-12900K, NVIDIA Titan RTX
i9-12900K, 3200 MHz
10792 KB/s 0%
Intel Core i9-12900, NVIDIA GeForce RTX 3060
i9-12900, 2400 MHz
10739 KB/s
Intel Core i7-12700K, NVIDIA Titan RTX
i7-12700K, 2700 MHz
10389 KB/s -3%
Intel Core i9-10900K, NVIDIA Titan RTX
i9-10900K, 3700 MHz
9739 KB/s -9%
Intel Core i9-11900KB, NVIDIA GeForce RTX 3060
i9-11900KB, 3300 MHz
9584 KB/s -11%
Intel Core i9-11900K, NVIDIA Titan RTX
i9-11900K, 3500 MHz
9030 KB/s -16%
Intel Core i5-11600K, NVIDIA Titan RTX
i5-11600K, 3900 MHz
7850 KB/s -27%
AMD Ryzen 7 3800XT, NVIDIA Titan RTX
R7 3800XT, 3900 MHz
7467 KB/s -30%
AMD Ryzen 9 3950X, NVIDIA Titan RTX
R9 3950X, 3500 MHz
7409 KB/s -31%
Intel Core i9-9980HK, NVIDIA GeForce RTX 2070 (Desktop)
i9-9980HK, 2400 MHz
7266 KB/s -32%
Intel Core i5-10600K, NVIDIA Titan RTX
i5-10600K, 4100 MHz
6536 KB/s -39%
TrueCrypt
AES Mean 100MB
Intel Core i9-12900K, NVIDIA Titan RTX
i9-12900K, 3200 MHz
18.5 GB/s +8%
Intel Core i9-12900, NVIDIA GeForce RTX 3060
i9-12900, 2400 MHz
17.2 GB/s
Intel Core i7-12700K, NVIDIA Titan RTX
i7-12700K, 2700 MHz
15.7 GB/s -9%
AMD Ryzen 7 5800X, NVIDIA Titan RTX
R7 5800X, 3800 MHz
15 GB/s -13%
Intel Core i9-10900K, NVIDIA Titan RTX
i9-10900K, 3700 MHz
14.6 GB/s -15%
Intel Core i9-11900K, NVIDIA Titan RTX
i9-11900K, 3500 MHz
13 GB/s -24%
Intel Core i9-11900KB, NVIDIA GeForce RTX 3060
i9-11900KB, 3300 MHz
11.6 GB/s -33%
AMD Ryzen 7 3800XT, NVIDIA Titan RTX
R7 3800XT, 3900 MHz
11.4 GB/s -34%
AMD Ryzen 9 3950X, NVIDIA Titan RTX
R9 3950X, 3500 MHz
10.8 GB/s -37%
Intel Core i9-9980HK, NVIDIA GeForce RTX 2070 (Desktop)
i9-9980HK, 2400 MHz
10.1 GB/s -41%
Intel Core i5-11600K, NVIDIA Titan RTX
i5-11600K, 3900 MHz
9.7 GB/s -44%
Intel Core i5-10600K, NVIDIA Titan RTX
i5-10600K, 4100 MHz
8 GB/s -53%
Twofish Mean 100MB
Intel Core i9-12900K, NVIDIA Titan RTX
i9-12900K, 3200 MHz
3.7 GB/s +9%
AMD Ryzen 9 3950X, NVIDIA Titan RTX
R9 3950X, 3500 MHz
3.6 GB/s +6%
Intel Core i9-12900, NVIDIA GeForce RTX 3060
i9-12900, 2400 MHz
3.4 GB/s
Intel Core i7-12700K, NVIDIA Titan RTX
i7-12700K, 2700 MHz
2.8 GB/s -18%
Intel Core i9-10900K, NVIDIA Titan RTX
i9-10900K, 3700 MHz
2.6 GB/s -24%
AMD Ryzen 7 3800XT, NVIDIA Titan RTX
R7 3800XT, 3900 MHz
2 GB/s -41%
AMD Ryzen 7 5800X, NVIDIA Titan RTX
R7 5800X, 3800 MHz
2 GB/s -41%
Intel Core i9-11900K, NVIDIA Titan RTX
i9-11900K, 3500 MHz
1.9 GB/s -44%
Intel Core i9-9980HK, NVIDIA GeForce RTX 2070 (Desktop)
i9-9980HK, 2400 MHz
1.7 GB/s -50%
Intel Core i9-11900KB, NVIDIA GeForce RTX 3060
i9-11900KB, 3300 MHz
1.7 GB/s -50%
Intel Core i5-11600K, NVIDIA Titan RTX
i5-11600K, 3900 MHz
1.5 GB/s -56%
Intel Core i5-10600K, NVIDIA Titan RTX
i5-10600K, 4100 MHz
1.4 GB/s -59%
Serpent Mean 100MB
AMD Ryzen 9 3950X, NVIDIA Titan RTX
R9 3950X, 3500 MHz
2.3 GB/s +21%
Intel Core i9-12900K, NVIDIA Titan RTX
i9-12900K, 3200 MHz
1.9 GB/s 0%
Intel Core i9-12900, NVIDIA GeForce RTX 3060
i9-12900, 2400 MHz
1.9 GB/s
Intel Core i7-12700K, NVIDIA Titan RTX
i7-12700K, 2700 MHz
1.6 GB/s -16%
Intel Core i9-10900K, NVIDIA Titan RTX
i9-10900K, 3700 MHz
1.5 GB/s -21%
AMD Ryzen 7 5800X, NVIDIA Titan RTX
R7 5800X, 3800 MHz
1.3 GB/s -32%
AMD Ryzen 7 3800XT, NVIDIA Titan RTX
R7 3800XT, 3900 MHz
1.2 GB/s -37%
Intel Core i9-11900K, NVIDIA Titan RTX
i9-11900K, 3500 MHz
1.2 GB/s -37%
Intel Core i9-11900KB, NVIDIA GeForce RTX 3060
i9-11900KB, 3300 MHz
1.1 GB/s -42%
Intel Core i9-9980HK, NVIDIA GeForce RTX 2070 (Desktop)
i9-9980HK, 2400 MHz
1 GB/s -47%
Intel Core i5-11600K, NVIDIA Titan RTX
i5-11600K, 3900 MHz
0.9 GB/s -53%
Intel Core i5-10600K, NVIDIA Titan RTX
i5-10600K, 4100 MHz
0.82 GB/s -57%
Geekbench 5.5
Multi-Core
Intel Core i9-12900K, NVIDIA Titan RTX
i9-12900K, 3200 MHz
17854 Points +100%
Intel Core i7-12700K, NVIDIA Titan RTX
i7-12700K, 2700 MHz
15557 Points +74%
AMD Ryzen 9 3950X, NVIDIA Titan RTX
R9 3950X, 3500 MHz
12363 Points +39%
Intel Core i9-10900K, NVIDIA Titan RTX
i9-10900K, 3700 MHz
11414 Points +28%
AMD Ryzen 7 5800X, NVIDIA Titan RTX
R7 5800X, 3800 MHz
11354 Points +27%
Intel Core i9-11900K, NVIDIA Titan RTX
i9-11900K, 3500 MHz
11035 Points +24%
AMD Ryzen 7 3800XT, NVIDIA Titan RTX
R7 3800XT, 3900 MHz
8948 Points 0%
Intel Core i9-11900KB, NVIDIA GeForce RTX 3060
i9-11900KB, 3300 MHz
8924 Points 0%
Intel Core i9-12900, NVIDIA GeForce RTX 3060
i9-12900, 2400 MHz
8924 Points
Intel Core i5-11600K, NVIDIA Titan RTX
i5-11600K, 3900 MHz
8523 Points -4%
Intel Core i9-9980HK, NVIDIA GeForce RTX 2070 (Desktop)
i9-9980HK, 2400 MHz
7568 Points -15%
Intel Core i5-10600K, NVIDIA Titan RTX
i5-10600K, 4100 MHz
7248 Points -19%
Single-Core
Intel Core i9-12900K, NVIDIA Titan RTX
i9-12900K, 3200 MHz
2042 Points +23%
Intel Core i7-12700K, NVIDIA Titan RTX
i7-12700K, 2700 MHz
1890 Points +14%
Intel Core i9-11900K, NVIDIA Titan RTX
i9-11900K, 3500 MHz
1885 Points +14%
Intel Core i5-11600K, NVIDIA Titan RTX
i5-11600K, 3900 MHz
1752 Points +6%
AMD Ryzen 7 5800X, NVIDIA Titan RTX
R7 5800X, 3800 MHz
1665 Points +1%
Intel Core i9-11900KB, NVIDIA GeForce RTX 3060
i9-11900KB, 3300 MHz
1656 Points 0%
Intel Core i9-12900, NVIDIA GeForce RTX 3060
i9-12900, 2400 MHz
1656 Points
Intel Core i9-10900K, NVIDIA Titan RTX
i9-10900K, 3700 MHz
1449 Points -12%
Intel Core i9-9980HK, NVIDIA GeForce RTX 2070 (Desktop)
i9-9980HK, 2400 MHz
1378 Points -17%
AMD Ryzen 7 3800XT, NVIDIA Titan RTX
R7 3800XT, 3900 MHz
1353 Points -18%
AMD Ryzen 9 3950X, NVIDIA Titan RTX
R9 3950X, 3500 MHz
1306 Points -21%
Intel Core i5-10600K, NVIDIA Titan RTX
i5-10600K, 4100 MHz
1286 Points -22%
Geekbench 5.0
5.0 Multi-Core
Intel Core i9-12900K, NVIDIA Titan RTX
i9-12900K, 3200 MHz
17959 Points +103%
Intel Core i7-12700K, NVIDIA Titan RTX
i7-12700K, 2700 MHz
15440 Points +75%
AMD Ryzen 9 3950X, NVIDIA Titan RTX
R9 3950X, 3500 MHz
12976 Points +47%
Intel Core i9-10900K, NVIDIA Titan RTX
i9-10900K, 3700 MHz
11407 Points +29%
AMD Ryzen 7 5800X, NVIDIA Titan RTX
R7 5800X, 3800 MHz
11246 Points +27%
Intel Core i9-11900K, NVIDIA Titan RTX
i9-11900K, 3500 MHz
11008 Points +24%
AMD Ryzen 7 3800XT, NVIDIA Titan RTX
R7 3800XT, 3900 MHz
9163 Points +4%
Intel Core i9-11900KB, NVIDIA GeForce RTX 3060
i9-11900KB, 3300 MHz
8845 Points 0%
Intel Core i9-12900, NVIDIA GeForce RTX 3060
i9-12900, 2400 MHz
8845 Points
Intel Core i5-11600K, NVIDIA Titan RTX
i5-11600K, 3900 MHz
8542 Points -3%
Intel Core i9-9980HK, NVIDIA GeForce RTX 2070 (Desktop)
i9-9980HK, 2400 MHz
7540 Points -15%
Intel Core i5-10600K, NVIDIA Titan RTX
i5-10600K, 4100 MHz
7237 Points -18%
5.0 Single-Core
Intel Core i9-12900K, NVIDIA Titan RTX
i9-12900K, 3200 MHz
1968 Points +20%
Intel Core i9-11900K, NVIDIA Titan RTX
i9-11900K, 3500 MHz
1863 Points +14%
Intel Core i7-12700K, NVIDIA Titan RTX
i7-12700K, 2700 MHz
1835 Points +12%
Intel Core i5-11600K, NVIDIA Titan RTX
i5-11600K, 3900 MHz
1731 Points +6%
AMD Ryzen 7 5800X, NVIDIA Titan RTX
R7 5800X, 3800 MHz
1673 Points +2%
Intel Core i9-11900KB, NVIDIA GeForce RTX 3060
i9-11900KB, 3300 MHz
1638 Points 0%
Intel Core i9-12900, NVIDIA GeForce RTX 3060
i9-12900, 2400 MHz
1638 Points
Intel Core i9-10900K, NVIDIA Titan RTX
i9-10900K, 3700 MHz
1440 Points -12%
AMD Ryzen 7 3800XT, NVIDIA Titan RTX
R7 3800XT, 3900 MHz
1360 Points -17%
Intel Core i9-9980HK, NVIDIA GeForce RTX 2070 (Desktop)
i9-9980HK, 2400 MHz
1355 Points -17%
AMD Ryzen 9 3950X, NVIDIA Titan RTX
R9 3950X, 3500 MHz
1315 Points -20%
Intel Core i5-10600K, NVIDIA Titan RTX
i5-10600K, 4100 MHz
1281 Points -22%
Geekbench 4.4
64 Bit Single-Core Score
Intel Core i9-12900K, NVIDIA Titan RTX
i9-12900K, 3200 MHz
8665 Points +24%
Intel Core i7-12700K, NVIDIA Titan RTX
i7-12700K, 2700 MHz
8133 Points +16%
Intel Core i9-11900K, NVIDIA Titan RTX
i9-11900K, 3500 MHz
7976 Points +14%
Intel Core i5-11600K, NVIDIA Titan RTX
i5-11600K, 3900 MHz
7438 Points +6%
AMD Ryzen 7 5800X, NVIDIA Titan RTX
R7 5800X, 3800 MHz
7333 Points +5%
Intel Core i9-11900KB, NVIDIA GeForce RTX 3060
i9-11900KB, 3300 MHz
6991 Points 0%
Intel Core i9-12900, NVIDIA GeForce RTX 3060
i9-12900, 2400 MHz
6991 Points
Intel Core i9-10900K, NVIDIA Titan RTX
i9-10900K, 3700 MHz
6348 Points -9%
Intel Core i9-9980HK, NVIDIA GeForce RTX 2070 (Desktop)
i9-9980HK, 2400 MHz
5969 Points -15%
AMD Ryzen 7 3800XT, NVIDIA Titan RTX
R7 3800XT, 3900 MHz
5830 Points -17%
Intel Core i5-10600K, NVIDIA Titan RTX
i5-10600K, 4100 MHz
5821 Points -17%
AMD Ryzen 9 3950X, NVIDIA Titan RTX
R9 3950X, 3500 MHz
5749 Points -18%
64 Bit Multi-Core Score
Intel Core i9-12900K, NVIDIA Titan RTX
i9-12900K, 3200 MHz
63583 Points +75%
Intel Core i7-12700K, NVIDIA Titan RTX
i7-12700K, 2700 MHz
55786 Points +54%
AMD Ryzen 9 3950X, NVIDIA Titan RTX
R9 3950X, 3500 MHz
48962 Points +35%
AMD Ryzen 7 5800X, NVIDIA Titan RTX
R7 5800X, 3800 MHz
44131 Points +22%
Intel Core i9-10900K, NVIDIA Titan RTX
i9-10900K, 3700 MHz
43058 Points +19%
Intel Core i9-11900K, NVIDIA Titan RTX
i9-11900K, 3500 MHz
42329 Points +17%
Intel Core i9-11900KB, NVIDIA GeForce RTX 3060
i9-11900KB, 3300 MHz
36310 Points 0%
Intel Core i9-12900, NVIDIA GeForce RTX 3060
i9-12900, 2400 MHz
36310 Points
AMD Ryzen 7 3800XT, NVIDIA Titan RTX
R7 3800XT, 3900 MHz
35526 Points -2%
Intel Core i5-11600K, NVIDIA Titan RTX
i5-11600K, 3900 MHz
33266 Points -8%
Intel Core i9-9980HK, NVIDIA GeForce RTX 2070 (Desktop)
i9-9980HK, 2400 MHz
29385 Points -19%
Intel Core i5-10600K, NVIDIA Titan RTX
i5-10600K, 4100 MHz
28391 Points -22%
3DMark 11 - 1280x720 Performance Physics
Intel Core i9-12900K, NVIDIA Titan RTX
i9-12900K, 3200 MHz
28211 Points +16%
Intel Core i7-12700K, NVIDIA Titan RTX
i7-12700K, 2700 MHz
26765 Points +10%
Intel Core i9-12900, NVIDIA GeForce RTX 3060
i9-12900, 2400 MHz
24314 Points
AMD Ryzen 7 5800X, NVIDIA Titan RTX
R7 5800X, 3800 MHz
23381 Points -4%
Intel Core i9-10900K, NVIDIA Titan RTX
i9-10900K, 3700 MHz
22140 Points -9%
Intel Core i9-11900K, NVIDIA Titan RTX
i9-11900K, 3500 MHz
21175 Points -13%
AMD Ryzen 9 3950X, NVIDIA Titan RTX
R9 3950X, 3500 MHz
21016 Points -14%
AMD Ryzen 7 3800XT, NVIDIA Titan RTX
R7 3800XT, 3900 MHz
18905 Points -22%
Intel Core i9-11900KB, NVIDIA GeForce RTX 3060
i9-11900KB, 3300 MHz
17803 Points -27%
Intel Core i5-11600K, NVIDIA Titan RTX
i5-11600K, 3900 MHz
17381 Points -29%
Intel Core i9-9980HK, NVIDIA GeForce RTX 2070 (Desktop)
i9-9980HK, 2400 MHz
16422 Points -32%
Intel Core i5-10600K, NVIDIA Titan RTX
i5-10600K, 4100 MHz
15961 Points -34%
7-Zip 18.03
7z b 4
AMD Ryzen 9 3950X, NVIDIA Titan RTX
R9 3950X, 3500 MHz
99467 MIPS +98%
Intel Core i9-12900K, NVIDIA Titan RTX
i9-12900K, 3200 MHz
97671 MIPS +95%
Intel Core i7-12700K, NVIDIA Titan RTX
i7-12700K, 2700 MHz
81369 MIPS +62%
AMD Ryzen 7 5800X, NVIDIA Titan RTX
R7 5800X, 3800 MHz
74306 MIPS +48%
Intel Core i9-10900K, NVIDIA Titan RTX
i9-10900K, 3700 MHz
70968 MIPS +42%
Intel Core i9-11900K, NVIDIA Titan RTX
i9-11900K, 3500 MHz
62746 MIPS +25%
AMD Ryzen 7 3800XT, NVIDIA Titan RTX
R7 3800XT, 3900 MHz
59247 MIPS +18%
Intel Core i9-11900KB, NVIDIA GeForce RTX 3060
i9-11900KB, 3300 MHz
50152 MIPS 0%
Intel Core i9-12900, NVIDIA GeForce RTX 3060
i9-12900, 2400 MHz
50152 MIPS
Intel Core i5-11600K, NVIDIA Titan RTX
i5-11600K, 3900 MHz
45322 MIPS -10%
Intel Core i9-9980HK, NVIDIA GeForce RTX 2070 (Desktop)
i9-9980HK, 2400 MHz
44081 MIPS -12%
Intel Core i5-10600K, NVIDIA Titan RTX
i5-10600K, 4100 MHz
40379 MIPS -19%
7z b 4 -mmt1
AMD Ryzen 7 5800X, NVIDIA Titan RTX
R7 5800X, 3800 MHz
6970 MIPS +17%
Intel Core i9-11900K, NVIDIA Titan RTX
i9-11900K, 3500 MHz
6652 MIPS +11%
Intel Core i9-12900K, NVIDIA Titan RTX
i9-12900K, 3200 MHz
6571 MIPS +10%
Intel Core i5-11600K, NVIDIA Titan RTX
i5-11600K, 3900 MHz
6136 MIPS +3%
Intel Core i7-12700K, NVIDIA Titan RTX
i7-12700K, 2700 MHz
6117 MIPS +2%
Intel Core i9-11900KB, NVIDIA GeForce RTX 3060
i9-11900KB, 3300 MHz
5979 MIPS 0%
Intel Core i9-12900, NVIDIA GeForce RTX 3060
i9-12900, 2400 MHz
5979 MIPS
Intel Core i9-10900K, NVIDIA Titan RTX
i9-10900K, 3700 MHz
5954 MIPS 0%
Intel Core i9-9980HK, NVIDIA GeForce RTX 2070 (Desktop)
i9-9980HK, 2400 MHz
5642 MIPS -6%
AMD Ryzen 7 3800XT, NVIDIA Titan RTX
R7 3800XT, 3900 MHz
5516 MIPS -8%
AMD Ryzen 9 3950X, NVIDIA Titan RTX
R9 3950X, 3500 MHz
5340 MIPS -11%
Intel Core i5-10600K, NVIDIA Titan RTX
i5-10600K, 4100 MHz
5289 MIPS -12%
HWBOT x265 Benchmark v2.2 - 4k Preset
Intel Core i9-12900K, NVIDIA Titan RTX
i9-12900K, 3200 MHz
30 fps +108%
Intel Core i7-12700K, NVIDIA Titan RTX
i7-12700K, 2700 MHz
26.1 fps +81%
Intel Core i9-10900K, NVIDIA Titan RTX
i9-10900K, 3700 MHz
21 fps +46%
AMD Ryzen 7 5800X, NVIDIA Titan RTX
R7 5800X, 3800 MHz
20.8 fps +44%
Intel Core i9-11900K, NVIDIA Titan RTX
i9-11900K, 3500 MHz
19.8 fps +38%
AMD Ryzen 7 3800XT, NVIDIA Titan RTX
R7 3800XT, 3900 MHz
16.1 fps +12%
AMD Ryzen 9 3950X, NVIDIA Titan RTX
R9 3950X, 3500 MHz
15.8 fps +10%
Intel Core i5-11600K, NVIDIA Titan RTX
i5-11600K, 3900 MHz
14.7 fps +2%
Intel Core i9-11900KB, NVIDIA GeForce RTX 3060
i9-11900KB, 3300 MHz
14.4 fps 0%
Intel Core i9-12900, NVIDIA GeForce RTX 3060
i9-12900, 2400 MHz
14.4 fps
Intel Core i5-10600K, NVIDIA Titan RTX
i5-10600K, 4100 MHz
12.2 fps -15%
Intel Core i9-9980HK, NVIDIA GeForce RTX 2070 (Desktop)
i9-9980HK, 2400 MHz
11.4 fps -21%
R Benchmark 2.5 - Overall mean
Intel Core i5-10600K, NVIDIA Titan RTX
i5-10600K, 4100 MHz
0.593 sec * -11%
Intel Core i9-9980HK, NVIDIA GeForce RTX 2070 (Desktop)
i9-9980HK, 2400 MHz
0.541 sec * -1%
Intel Core i9-11900KB, NVIDIA GeForce RTX 3060
i9-11900KB, 3300 MHz
0.535 sec * -0%
Intel Core i9-12900, NVIDIA GeForce RTX 3060
i9-12900, 2400 MHz
0.535 sec *
Intel Core i9-10900K, NVIDIA Titan RTX
i9-10900K, 3700 MHz
0.528 sec * +1%
AMD Ryzen 9 3950X, NVIDIA Titan RTX
R9 3950X, 3500 MHz
0.524 sec * +2%
AMD Ryzen 7 3800XT, NVIDIA Titan RTX
R7 3800XT, 3900 MHz
0.512 sec * +4%
Intel Core i5-11600K, NVIDIA Titan RTX
i5-11600K, 3900 MHz
0.506 sec * +5%
Intel Core i9-11900K, NVIDIA Titan RTX
i9-11900K, 3500 MHz
0.4733 sec * +12%
AMD Ryzen 7 5800X, NVIDIA Titan RTX
R7 5800X, 3800 MHz
0.4509 sec * +16%
Intel Core i7-12700K, NVIDIA Titan RTX
i7-12700K, 2700 MHz
0.423 sec * +21%
Intel Core i9-12900K, NVIDIA Titan RTX
i9-12900K, 3200 MHz
0.4216 sec * +21%
LibreOffice - 20 Documents To PDF
Intel Core i9-10900K, NVIDIA Titan RTX
i9-10900K, 3700 MHz
76 s * -69%
Intel Core i9-11900K, NVIDIA Titan RTX
i9-11900K, 3500 MHz
72.5 s * -61%
AMD Ryzen 9 3950X, NVIDIA Titan RTX
R9 3950X, 3500 MHz
53.6 s * -19%
Intel Core i5-10600K, NVIDIA Titan RTX
i5-10600K, 4100 MHz
46.06 s * -3%
Intel Core i9-9980HK, NVIDIA GeForce RTX 2070 (Desktop)
i9-9980HK, 2400 MHz
45.23 s * -1%
Intel Core i9-11900KB, NVIDIA GeForce RTX 3060
i9-11900KB, 3300 MHz
44.9 s * -0%
Intel Core i9-12900, NVIDIA GeForce RTX 3060
i9-12900, 2400 MHz
44.9 s *
AMD Ryzen 7 3800XT, NVIDIA Titan RTX
R7 3800XT, 3900 MHz
44.78 s * -0%
AMD Ryzen 7 5800X, NVIDIA Titan RTX
R7 5800X, 3800 MHz
43.31 s * +4%
Intel Core i9-12900K, NVIDIA Titan RTX
i9-12900K, 3200 MHz
40.6 s * +10%
Intel Core i7-12700K, NVIDIA Titan RTX
i7-12700K, 2700 MHz
39.8 s * +11%
Intel Core i5-11600K, NVIDIA Titan RTX
i5-11600K, 3900 MHz
39.7 s * +12%
WebXPRT 3 - Overall
Intel Core i9-12900K, NVIDIA Titan RTX
i9-12900K, 3200 MHz
320 Points +19%
Intel Core i7-12700K, NVIDIA Titan RTX
i7-12700K, 2700 MHz
306 Points +14%
AMD Ryzen 7 5800X, NVIDIA Titan RTX
R7 5800X, 3800 MHz
296 Points +10%
Intel Core i5-11600K, NVIDIA Titan RTX
i5-11600K, 3900 MHz
280 Points +4%
Intel Core i9-11900KB, NVIDIA GeForce RTX 3060
i9-11900KB, 3300 MHz
269 Points 0%
Intel Core i9-12900, NVIDIA GeForce RTX 3060
i9-12900, 2400 MHz
269 Points
Intel Core i9-10900K, NVIDIA Titan RTX
i9-10900K, 3700 MHz
255 Points -5%
AMD Ryzen 7 3800XT, NVIDIA Titan RTX
R7 3800XT, 3900 MHz
249 Points -7%
AMD Ryzen 9 3950X, NVIDIA Titan RTX
R9 3950X, 3500 MHz
239 Points -11%
Intel Core i5-10600K, NVIDIA Titan RTX
i5-10600K, 4100 MHz
239 Points -11%
Intel Core i9-9980HK, NVIDIA GeForce RTX 2070 (Desktop)
i9-9980HK, 2400 MHz
233 Points -13%
Intel Core i9-11900K, NVIDIA Titan RTX
i9-11900K, 3500 MHz
217 Points -19%
Mozilla Kraken 1.1 - Total
Intel Core i5-10600K, NVIDIA Titan RTX
i5-10600K, 4100 MHz
760 ms * -26%
Intel Core i9-9980HK, NVIDIA GeForce RTX 2070 (Desktop)
i9-9980HK, 2400 MHz
754 ms * -25%
Intel Core i9-10900K, NVIDIA Titan RTX
i9-10900K, 3700 MHz
709 ms * -18%
AMD Ryzen 9 3950X, NVIDIA Titan RTX
R9 3950X, 3500 MHz
706 ms * -17%
AMD Ryzen 7 3800XT, NVIDIA Titan RTX
R7 3800XT, 3900 MHz
683 ms * -13%
Intel Core i9-11900KB, NVIDIA GeForce RTX 3060
i9-11900KB, 3300 MHz
602 ms * -0%
Intel Core i9-12900, NVIDIA GeForce RTX 3060
i9-12900, 2400 MHz
602 ms *
Intel Core i5-11600K, NVIDIA Titan RTX
i5-11600K, 3900 MHz
587 ms * +2%
AMD Ryzen 7 5800X, NVIDIA Titan RTX
R7 5800X, 3800 MHz
558 ms * +7%
Intel Core i9-11900K, NVIDIA Titan RTX
i9-11900K, 3500 MHz
544 ms * +10%
Intel Core i7-12700K, NVIDIA Titan RTX
i7-12700K, 2700 MHz
496 ms * +18%
Intel Core i9-12900K, NVIDIA Titan RTX
i9-12900K, 3200 MHz
481 ms * +20%
3DMark
3840x2160 Fire Strike Ultra Physics
Intel Core i9-12900K, NVIDIA Titan RTX
i9-12900K, 3200 MHz
39462 Points +4%
Intel Core i9-12900, NVIDIA GeForce RTX 3060
i9-12900, 2400 MHz
37967 Points
Intel Core i7-12700K, NVIDIA Titan RTX
i7-12700K, 2700 MHz
37324 Points -2%
AMD Ryzen 9 3950X, NVIDIA Titan RTX
R9 3950X, 3500 MHz
31881 Points -16%
AMD Ryzen 7 5800X, NVIDIA Titan RTX
R7 5800X, 3800 MHz
31095 Points -18%
Intel Core i9-10900K, NVIDIA Titan RTX
i9-10900K, 3700 MHz
29374 Points -23%
Intel Core i9-11900K, NVIDIA Titan RTX
i9-11900K, 3500 MHz
27685 Points -27%
AMD Ryzen 7 3800XT, NVIDIA Titan RTX
R7 3800XT, 3900 MHz
25286 Points -33%
Intel Core i9-11900KB, NVIDIA GeForce RTX 3060
i9-11900KB, 3300 MHz
23921 Points -37%
Intel Core i5-11600K, NVIDIA Titan RTX
i5-11600K, 3900 MHz
23190 Points -39%
Intel Core i9-9980HK, NVIDIA GeForce RTX 2070 (Desktop)
i9-9980HK, 2400 MHz
21864 Points -42%
Intel Core i5-10600K, NVIDIA Titan RTX
i5-10600K, 4100 MHz
19942 Points -47%
1920x1080 Fire Strike Physics
Intel Core i9-12900K, NVIDIA Titan RTX
i9-12900K, 3200 MHz
39112 Points +11%
Intel Core i7-12700K, NVIDIA Titan RTX
i7-12700K, 2700 MHz
37079 Points +5%
Intel Core i9-12900, NVIDIA GeForce RTX 3060
i9-12900, 2400 MHz
35153 Points
AMD Ryzen 9 3950X, NVIDIA Titan RTX
R9 3950X, 3500 MHz
32004 Points -9%
AMD Ryzen 7 5800X, NVIDIA Titan RTX
R7 5800X, 3800 MHz
30938 Points -12%
Intel Core i9-10900K, NVIDIA Titan RTX
i9-10900K, 3700 MHz
29805 Points -15%
Intel Core i9-11900K, NVIDIA Titan RTX
i9-11900K, 3500 MHz
28927 Points -18%
AMD Ryzen 7 3800XT, NVIDIA Titan RTX
R7 3800XT, 3900 MHz
25132 Points -29%
Intel Core i9-11900KB, NVIDIA GeForce RTX 3060
i9-11900KB, 3300 MHz
24327 Points -31%
Intel Core i5-11600K, NVIDIA Titan RTX
i5-11600K, 3900 MHz
22631 Points -36%
Intel Core i9-9980HK, NVIDIA GeForce RTX 2070 (Desktop)
i9-9980HK, 2400 MHz
21706 Points -38%
Intel Core i5-10600K, NVIDIA Titan RTX
i5-10600K, 4100 MHz
20040 Points -43%
2560x1440 Time Spy CPU
Intel Core i9-12900K, NVIDIA Titan RTX
i9-12900K, 3200 MHz
18431 Points +22%
Intel Core i7-12700K, NVIDIA Titan RTX
i7-12700K, 2700 MHz
17185 Points +14%
Intel Core i9-12900, NVIDIA GeForce RTX 3060
i9-12900, 2400 MHz
15095 Points
Intel Core i9-10900K, NVIDIA Titan RTX
i9-10900K, 3700 MHz
14326 Points -5%
Intel Core i9-11900K, NVIDIA Titan RTX
i9-11900K, 3500 MHz
13433 Points -11%
AMD Ryzen 9 3950X, NVIDIA Titan RTX
R9 3950X, 3500 MHz
12404 Points -18%
AMD Ryzen 7 5800X, NVIDIA Titan RTX
R7 5800X, 3800 MHz
11599 Points -23%
AMD Ryzen 7 3800XT, NVIDIA Titan RTX
R7 3800XT, 3900 MHz
10302 Points -32%
Intel Core i9-11900KB, NVIDIA GeForce RTX 3060
i9-11900KB, 3300 MHz
10035 Points -34%
Intel Core i5-11600K, NVIDIA Titan RTX
i5-11600K, 3900 MHz
9482 Points -37%
Intel Core i9-9980HK, NVIDIA GeForce RTX 2070 (Desktop)
i9-9980HK, 2400 MHz
9417 Points -38%
Intel Core i5-10600K, NVIDIA Titan RTX
i5-10600K, 4100 MHz
8290 Points -45%

* ... smaller is better

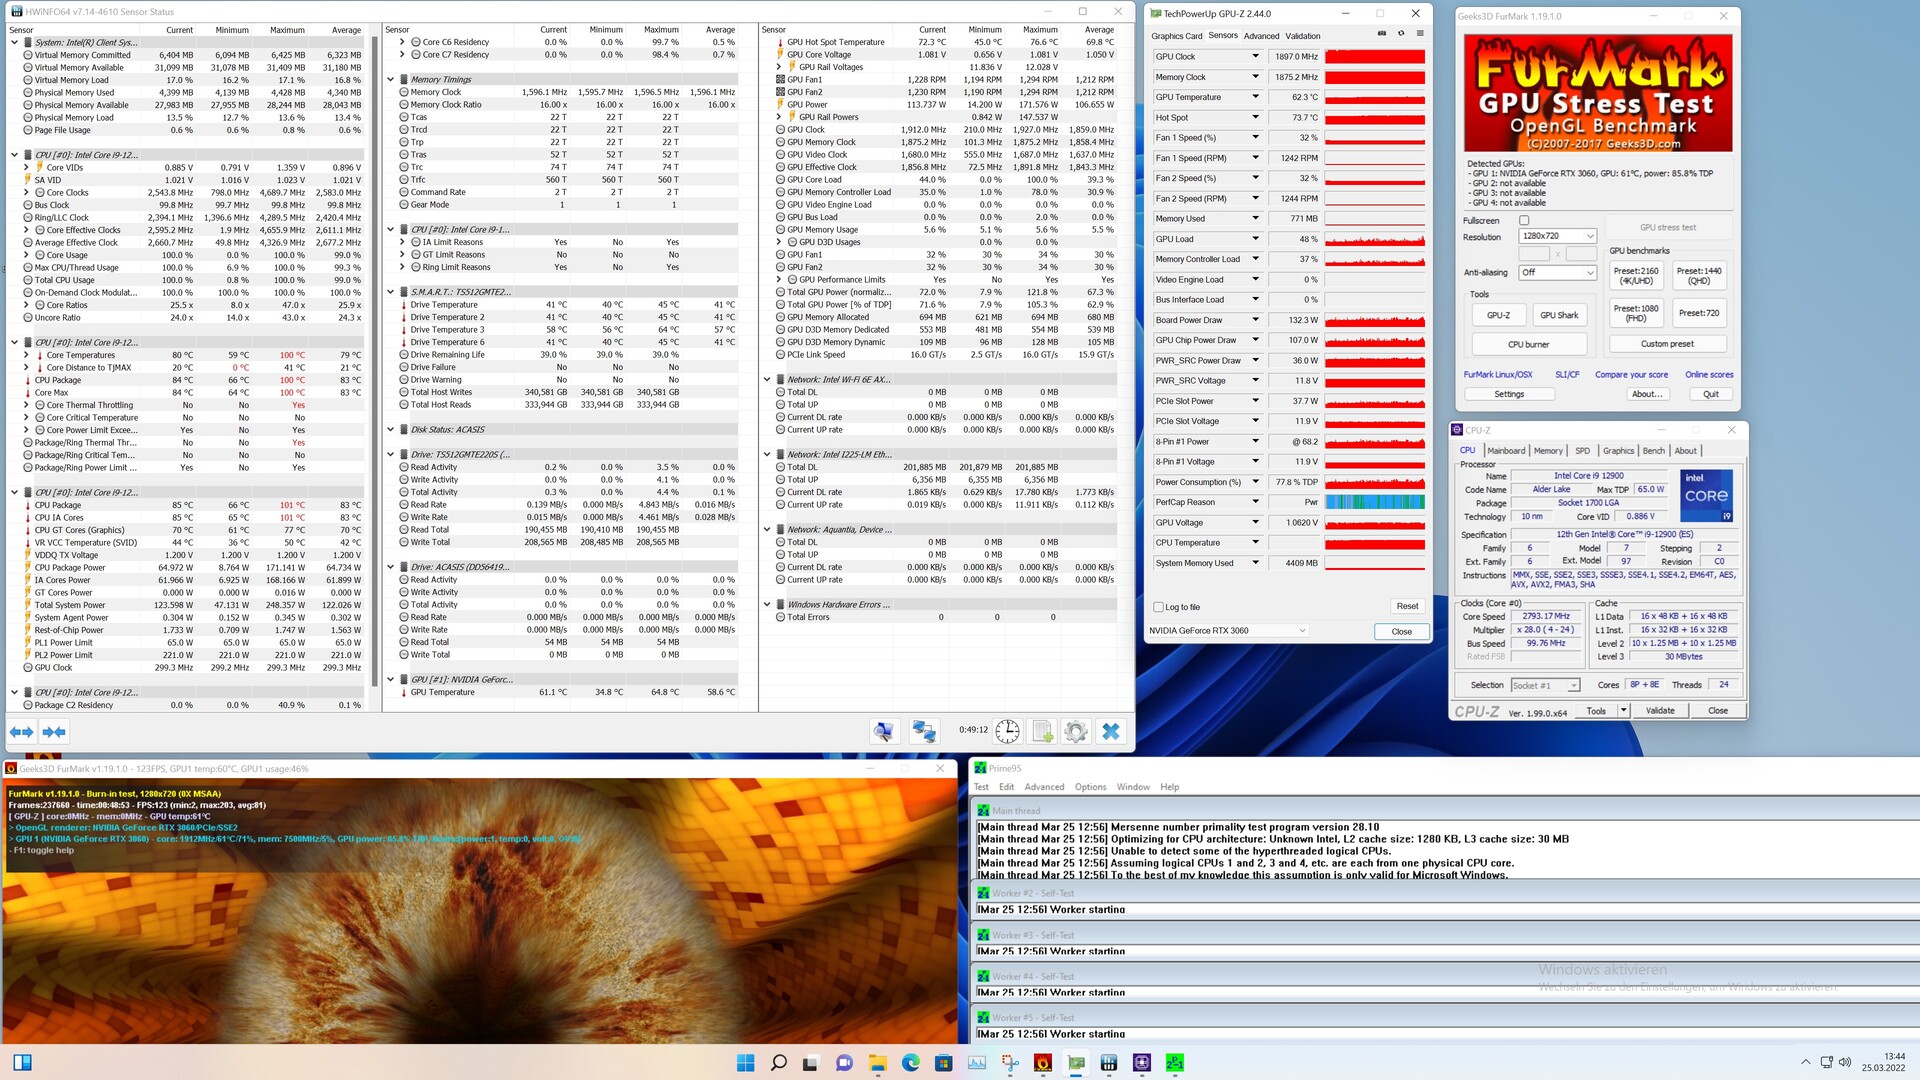
Intel NUC 12 Extreme Kit i Cinebench R15 Multi loop

I belastningstestet med Cinebench R15 Mult-slingan ser vi en betydande prestandaförlust efter den första körningen, innan den fortsätter att plana ut vid 2 592 poäng. Jämfört med de två föregångarna finns det dock fortfarande en tydlig prestandafördel även vid full belastning.

017034051068085010201190136015301700187020402210238025502720289030603230Tooltip
Intel Dragon Canyon NUC - RTX 3060 Intel Core i9-12900, Intel Core i9-12900: Ø2592 (2433.39-3346.44)
Intel Ghost Canyon NUC (RTX 2070) Intel Core i9-9980HK, Intel Core i9-9980HK: Ø1463 (1410.79-1593.44)
Intel Beast Canyon NUC Intel Core i9-11900KB, Intel Core i9-11900KB: Ø1800 (1776.75-1859.25)

Prestanda för tillämpningen

I de tillämpade benchmarks visar sig den rena prestandafördelen jämfört med den föregående modellen vara betydligt lägre än förväntat. Om man tittar på detta subjektivt har dock både Beast Canyon NUC vid den tidpunkten och även Dragon Canyon NUC nu en mycket hög driftshastighet och lämnar ett mycket gott intryck i den dagliga driften. Om du installerar en snabb SSD är systemet redo att användas redan efter några sekunder. Vi stötte inte på några långa väntetider i vår testkonfiguration. Men om man jämför med nuvarande avancerade system kommer de ändå att överträffa Intel NUC 12 Extreme Kit. GPU:n som används har en stor inverkan här. Samtidigt är vår testenhet fortfarande 14 % snabbare än ett system baserat på en AMD Ryzen 9 5900X med identisk GPU

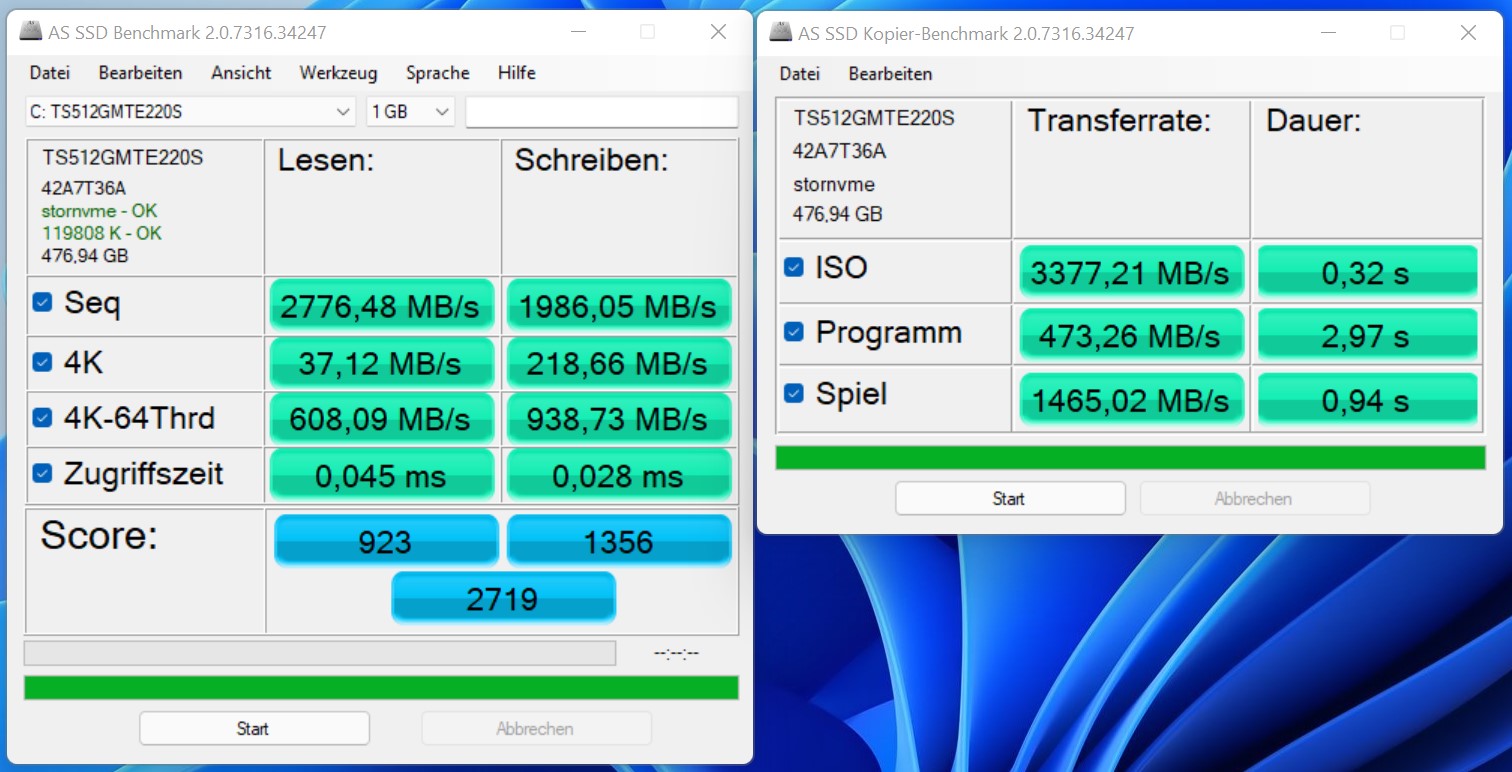
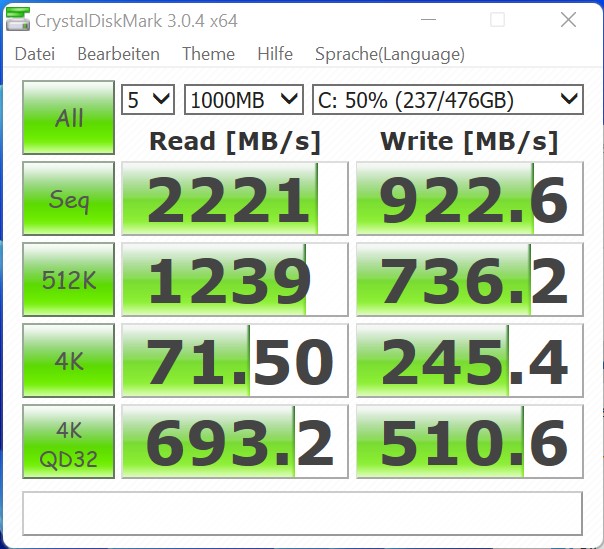
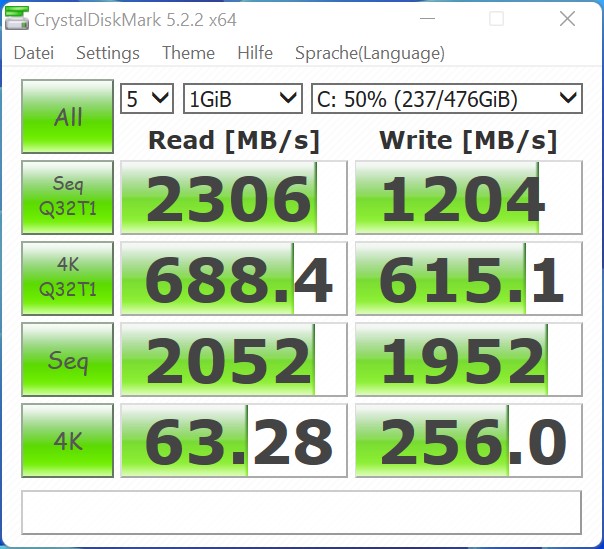
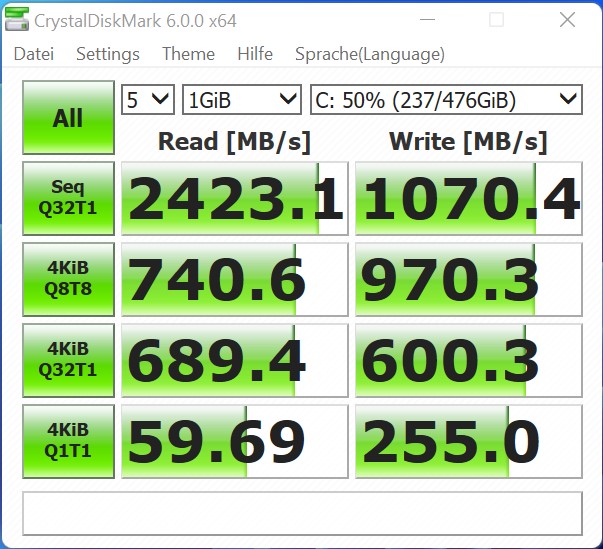
Vi utrustade barebone-systemet med en 512 GB NVMe SSD. I vårt test levererade modellen från Transcend en solid prestanda. Du kan sätta in totalt två M.2-2280 SSD-enheter i Compute Element.

AS SSD
AS SSD
CDM 3
CDM 3
CDM 5
CDM 5
CDM 6
CDM 6
Performance Rating - Percent
Intel Core i7-12700K, Intel Core i7-12700K
NVIDIA Titan RTX
98.4 pt
Intel Core i9-12900K, Intel Core i9-12900K
NVIDIA Titan RTX
98.2 pt
Intel Core i9-11900K, Intel Core i9-11900K
NVIDIA Titan RTX
93.1 pt
Intel Core i5-11600K, Intel Core i5-11600K
NVIDIA Titan RTX
91.5 pt
Intel Core i9-10900K, Intel Core i9-10900K
NVIDIA Titan RTX
89.9 pt
Intel Core i5-10600K, Intel Core i5-10600K
NVIDIA Titan RTX
87.5 pt
AMD Ryzen 9 3950X, AMD Ryzen 9 3950X
NVIDIA Titan RTX
86.2 pt
Corsair One i160, Intel Core i9-9900K
NVIDIA GeForce RTX 2080 Ti (Desktop)
62 pt
Intel Dragon Canyon NUC - RTX 3060, Intel Core i9-12900
NVIDIA GeForce RTX 3060
47 pt
Intel Beast Canyon NUC, Intel Core i9-11900KB
NVIDIA GeForce RTX 3060
44.4 pt
Intel Ghost Canyon NUC (RTX 2070), Intel Core i9-9980HK
NVIDIA GeForce RTX 2070 (Desktop)
44.1 pt
Inno3D GeForce RTX 3060 Twin X2, AMD Ryzen 9 5900X -1!
NVIDIA GeForce RTX 3060
41.3 pt
PCMark 10 - Score
Intel Core i9-12900K, Intel Core i9-12900K
NVIDIA Titan RTX
8604 Points +6%
Intel Core i7-12700K, Intel Core i7-12700K
NVIDIA Titan RTX
8430 Points +4%
Intel Dragon Canyon NUC - RTX 3060, Intel Core i9-12900
NVIDIA GeForce RTX 3060
8083 Points
AMD Ryzen 9 3950X, AMD Ryzen 9 3950X
NVIDIA Titan RTX
7869 Points -3%
Intel Core i9-11900K, Intel Core i9-11900K
NVIDIA Titan RTX
7745 Points -4%
Intel Core i5-11600K, Intel Core i5-11600K
NVIDIA Titan RTX
7740 Points -4%
Intel Core i9-10900K, Intel Core i9-10900K
NVIDIA Titan RTX
7641 Points -5%
Corsair One i160, Intel Core i9-9900K
NVIDIA GeForce RTX 2080 Ti (Desktop)
7329 Points -9%
Intel Beast Canyon NUC, Intel Core i9-11900KB
NVIDIA GeForce RTX 3060
7281 Points -10%
Intel Core i5-10600K, Intel Core i5-10600K
NVIDIA Titan RTX
7279 Points -10%
Intel Ghost Canyon NUC (RTX 2070), Intel Core i9-9980HK
NVIDIA GeForce RTX 2070 (Desktop)
6939 Points -14%
SPECviewperf 12
1900x1060 Solidworks (sw-03)
Intel Core i9-11900K, Intel Core i9-11900K
NVIDIA Titan RTX
182 fps +148%
Intel Core i9-12900K, Intel Core i9-12900K
NVIDIA Titan RTX
174 fps +137%
Intel Core i9-10900K, Intel Core i9-10900K
NVIDIA Titan RTX
172.2 fps +135%
Intel Core i5-11600K, Intel Core i5-11600K
NVIDIA Titan RTX
171 fps +133%
Intel Core i7-12700K, Intel Core i7-12700K
NVIDIA Titan RTX
167 fps +128%
Intel Core i5-10600K, Intel Core i5-10600K
NVIDIA Titan RTX
158.2 fps +116%
AMD Ryzen 9 3950X, AMD Ryzen 9 3950X
NVIDIA Titan RTX
157.6 fps +115%
Corsair One i160, Intel Core i9-9900K
NVIDIA GeForce RTX 2080 Ti (Desktop)
83.7 fps +14%
Intel Dragon Canyon NUC - RTX 3060, Intel Core i9-12900
NVIDIA GeForce RTX 3060
73.3 fps
Intel Beast Canyon NUC, Intel Core i9-11900KB
NVIDIA GeForce RTX 3060
71.6 fps -2%
Intel Ghost Canyon NUC (RTX 2070), Intel Core i9-9980HK
NVIDIA GeForce RTX 2070 (Desktop)
59.2 fps -19%
Inno3D GeForce RTX 3060 Twin X2, AMD Ryzen 9 5900X
NVIDIA GeForce RTX 3060
56.1 fps -23%
1900x1060 Siemens NX (snx-02)
Intel Core i7-12700K, Intel Core i7-12700K
NVIDIA Titan RTX
289 fps +2840%
Intel Core i9-12900K, Intel Core i9-12900K
NVIDIA Titan RTX
287 fps +2820%
Intel Core i9-10900K, Intel Core i9-10900K
NVIDIA Titan RTX
263.3 fps +2579%
Intel Core i5-10600K, Intel Core i5-10600K
NVIDIA Titan RTX
259.1 fps +2536%
AMD Ryzen 9 3950X, AMD Ryzen 9 3950X
NVIDIA Titan RTX
254.8 fps +2492%
Intel Core i5-11600K, Intel Core i5-11600K
NVIDIA Titan RTX
251 fps +2453%
Intel Core i9-11900K, Intel Core i9-11900K
NVIDIA Titan RTX
245 fps +2392%
Corsair One i160, Intel Core i9-9900K
NVIDIA GeForce RTX 2080 Ti (Desktop)
12.72 fps +29%
Intel Dragon Canyon NUC - RTX 3060, Intel Core i9-12900
NVIDIA GeForce RTX 3060
9.83 fps
Intel Ghost Canyon NUC (RTX 2070), Intel Core i9-9980HK
NVIDIA GeForce RTX 2070 (Desktop)
9.08 fps -8%
Inno3D GeForce RTX 3060 Twin X2, AMD Ryzen 9 5900X
NVIDIA GeForce RTX 3060
8.98 fps -9%
Intel Beast Canyon NUC, Intel Core i9-11900KB
NVIDIA GeForce RTX 3060
8.75 fps -11%
1900x1060 Showcase (showcase-01)
Intel Core i9-11900K, Intel Core i9-11900K
NVIDIA Titan RTX
203 fps +74%
Intel Core i5-11600K, Intel Core i5-11600K
NVIDIA Titan RTX
202 fps +73%
Intel Core i9-12900K, Intel Core i9-12900K
NVIDIA Titan RTX
200 fps +71%
Intel Core i7-12700K, Intel Core i7-12700K
NVIDIA Titan RTX
200 fps +71%
Intel Core i5-10600K, Intel Core i5-10600K
NVIDIA Titan RTX
196.1 fps +68%
Intel Core i9-10900K, Intel Core i9-10900K
NVIDIA Titan RTX
192.4 fps +64%
AMD Ryzen 9 3950X, AMD Ryzen 9 3950X
NVIDIA Titan RTX
188.3 fps +61%
Corsair One i160, Intel Core i9-9900K
NVIDIA GeForce RTX 2080 Ti (Desktop)
182.3 fps +56%
Intel Ghost Canyon NUC (RTX 2070), Intel Core i9-9980HK
NVIDIA GeForce RTX 2070 (Desktop)
118.5 fps +1%
Intel Dragon Canyon NUC - RTX 3060, Intel Core i9-12900
NVIDIA GeForce RTX 3060
117 fps
Inno3D GeForce RTX 3060 Twin X2, AMD Ryzen 9 5900X
NVIDIA GeForce RTX 3060
114 fps -3%
Intel Beast Canyon NUC, Intel Core i9-11900KB
NVIDIA GeForce RTX 3060
113 fps -3%
1900x1060 Medical (medical-01)
Intel Core i9-12900K, Intel Core i9-12900K
NVIDIA Titan RTX
108 fps +120%
Intel Core i7-12700K, Intel Core i7-12700K
NVIDIA Titan RTX
106 fps +115%
Intel Core i5-10600K, Intel Core i5-10600K
NVIDIA Titan RTX
94.6 fps +92%
Intel Core i9-10900K, Intel Core i9-10900K
NVIDIA Titan RTX
94.5 fps +92%
Intel Core i5-11600K, Intel Core i5-11600K
NVIDIA Titan RTX
88.7 fps +80%
AMD Ryzen 9 3950X, AMD Ryzen 9 3950X
NVIDIA Titan RTX
88.1 fps +79%
Intel Core i9-11900K, Intel Core i9-11900K
NVIDIA Titan RTX
87.8 fps +78%
Corsair One i160, Intel Core i9-9900K
NVIDIA GeForce RTX 2080 Ti (Desktop)
56.6 fps +15%
Intel Dragon Canyon NUC - RTX 3060, Intel Core i9-12900
NVIDIA GeForce RTX 3060
49.2 fps
Intel Beast Canyon NUC, Intel Core i9-11900KB
NVIDIA GeForce RTX 3060
40.9 fps -17%
Intel Ghost Canyon NUC (RTX 2070), Intel Core i9-9980HK
NVIDIA GeForce RTX 2070 (Desktop)
40.14 fps -18%
Inno3D GeForce RTX 3060 Twin X2, AMD Ryzen 9 5900X
NVIDIA GeForce RTX 3060
36.5 fps -26%
1900x1060 Maya (maya-04)
Intel Core i9-12900K, Intel Core i9-12900K
NVIDIA Titan RTX
211 fps +8%
Intel Core i7-12700K, Intel Core i7-12700K
NVIDIA Titan RTX
204 fps +4%
Intel Core i9-11900K, Intel Core i9-11900K
NVIDIA Titan RTX
199 fps +2%
Intel Dragon Canyon NUC - RTX 3060, Intel Core i9-12900
NVIDIA GeForce RTX 3060
196 fps
Intel Beast Canyon NUC, Intel Core i9-11900KB
NVIDIA GeForce RTX 3060
191 fps -3%
Corsair One i160, Intel Core i9-9900K
NVIDIA GeForce RTX 2080 Ti (Desktop)
190.9 fps -3%
Intel Core i9-10900K, Intel Core i9-10900K
NVIDIA Titan RTX
188.7 fps -4%
Intel Core i5-11600K, Intel Core i5-11600K
NVIDIA Titan RTX
186 fps -5%
Inno3D GeForce RTX 3060 Twin X2, AMD Ryzen 9 5900X
NVIDIA GeForce RTX 3060
173 fps -12%
AMD Ryzen 9 3950X, AMD Ryzen 9 3950X
NVIDIA Titan RTX
172.2 fps -12%
Intel Ghost Canyon NUC (RTX 2070), Intel Core i9-9980HK
NVIDIA GeForce RTX 2070 (Desktop)
171 fps -13%
Intel Core i5-10600K, Intel Core i5-10600K
NVIDIA Titan RTX
169.4 fps -14%
1900x1060 Energy (energy-01)
Intel Core i9-12900K, Intel Core i9-12900K
NVIDIA Titan RTX
30.1 fps +184%
Intel Core i7-12700K, Intel Core i7-12700K
NVIDIA Titan RTX
29.9 fps +182%
Intel Core i5-10600K, Intel Core i5-10600K
NVIDIA Titan RTX
28.77 fps +171%
Intel Core i9-10900K, Intel Core i9-10900K
NVIDIA Titan RTX
28.72 fps +171%
Intel Core i5-11600K, Intel Core i5-11600K
NVIDIA Titan RTX
28.3 fps +167%
Intel Core i9-11900K, Intel Core i9-11900K
NVIDIA Titan RTX
28.2 fps +166%
AMD Ryzen 9 3950X, AMD Ryzen 9 3950X
NVIDIA Titan RTX
28.18 fps +166%
Corsair One i160, Intel Core i9-9900K
NVIDIA GeForce RTX 2080 Ti (Desktop)
16.72 fps +58%
Intel Ghost Canyon NUC (RTX 2070), Intel Core i9-9980HK
NVIDIA GeForce RTX 2070 (Desktop)
11.49 fps +8%
Intel Dragon Canyon NUC - RTX 3060, Intel Core i9-12900
NVIDIA GeForce RTX 3060
10.6 fps
Intel Beast Canyon NUC, Intel Core i9-11900KB
NVIDIA GeForce RTX 3060
10 fps -6%
Inno3D GeForce RTX 3060 Twin X2, AMD Ryzen 9 5900X
NVIDIA GeForce RTX 3060
9.89 fps -7%
1900x1060 Creo (creo-01)
Intel Core i9-12900K, Intel Core i9-12900K
NVIDIA Titan RTX
187 fps +229%
Intel Core i7-12700K, Intel Core i7-12700K
NVIDIA Titan RTX
182 fps +220%
Intel Core i9-11900K, Intel Core i9-11900K
NVIDIA Titan RTX
173 fps +204%
Intel Core i5-11600K, Intel Core i5-11600K
NVIDIA Titan RTX
164 fps +188%
Intel Core i9-10900K, Intel Core i9-10900K
NVIDIA Titan RTX
157.2 fps +176%
Intel Core i5-10600K, Intel Core i5-10600K
NVIDIA Titan RTX
142.7 fps +151%
AMD Ryzen 9 3950X, AMD Ryzen 9 3950X
NVIDIA Titan RTX
134.8 fps +137%
Corsair One i160, Intel Core i9-9900K
NVIDIA GeForce RTX 2080 Ti (Desktop)
72.2 fps +27%
Intel Dragon Canyon NUC - RTX 3060, Intel Core i9-12900
NVIDIA GeForce RTX 3060
56.9 fps
Inno3D GeForce RTX 3060 Twin X2, AMD Ryzen 9 5900X
NVIDIA GeForce RTX 3060
52.4 fps -8%
Intel Ghost Canyon NUC (RTX 2070), Intel Core i9-9980HK
NVIDIA GeForce RTX 2070 (Desktop)
52.2 fps -8%
Intel Beast Canyon NUC, Intel Core i9-11900KB
NVIDIA GeForce RTX 3060
49.4 fps -13%
1900x1060 Catia (catia-04)
Intel Core i9-12900K, Intel Core i9-12900K
NVIDIA Titan RTX
290 fps +274%
Intel Core i7-12700K, Intel Core i7-12700K
NVIDIA Titan RTX
285 fps +268%
Intel Core i9-11900K, Intel Core i9-11900K
NVIDIA Titan RTX
269 fps +247%
Intel Core i5-11600K, Intel Core i5-11600K
NVIDIA Titan RTX
251 fps +224%
Intel Core i9-10900K, Intel Core i9-10900K
NVIDIA Titan RTX
225.2 fps +191%
AMD Ryzen 9 3950X, AMD Ryzen 9 3950X
NVIDIA Titan RTX
218.4 fps +182%
Intel Core i5-10600K, Intel Core i5-10600K
NVIDIA Titan RTX
215.5 fps +178%
Corsair One i160, Intel Core i9-9900K
NVIDIA GeForce RTX 2080 Ti (Desktop)
120.8 fps +56%
Intel Ghost Canyon NUC (RTX 2070), Intel Core i9-9980HK
NVIDIA GeForce RTX 2070 (Desktop)
78.3 fps +1%
Intel Dragon Canyon NUC - RTX 3060, Intel Core i9-12900
NVIDIA GeForce RTX 3060
77.5 fps
Intel Beast Canyon NUC, Intel Core i9-11900KB
NVIDIA GeForce RTX 3060
77 fps -1%
Inno3D GeForce RTX 3060 Twin X2, AMD Ryzen 9 5900X
NVIDIA GeForce RTX 3060
73.9 fps -5%
1900x1060 3ds Max (3dsmax-05)
Intel Core i7-12700K, Intel Core i7-12700K
NVIDIA Titan RTX
302 fps +41%
Intel Core i9-10900K, Intel Core i9-10900K
NVIDIA Titan RTX
297.4 fps +39%
Intel Core i5-10600K, Intel Core i5-10600K
NVIDIA Titan RTX
296.9 fps +39%
Intel Core i9-11900K, Intel Core i9-11900K
NVIDIA Titan RTX
289 fps +35%
Intel Core i5-11600K, Intel Core i5-11600K
NVIDIA Titan RTX
288 fps +35%
AMD Ryzen 9 3950X, AMD Ryzen 9 3950X
NVIDIA Titan RTX
274.5 fps +28%
Corsair One i160, Intel Core i9-9900K
NVIDIA GeForce RTX 2080 Ti (Desktop)
271.8 fps +27%
Intel Core i9-12900K, Intel Core i9-12900K
NVIDIA Titan RTX
262 fps +22%
Inno3D GeForce RTX 3060 Twin X2, AMD Ryzen 9 5900X
NVIDIA GeForce RTX 3060
217 fps +1%
Intel Dragon Canyon NUC - RTX 3060, Intel Core i9-12900
NVIDIA GeForce RTX 3060
214 fps
Intel Beast Canyon NUC, Intel Core i9-11900KB
NVIDIA GeForce RTX 3060
201 fps -6%
Intel Ghost Canyon NUC (RTX 2070), Intel Core i9-9980HK
NVIDIA GeForce RTX 2070 (Desktop)
180.8 fps -16%
SPECviewperf 13
Solidworks (sw-04)
Intel Core i9-12900K, Intel Core i9-12900K
NVIDIA Titan RTX
199 fps +86%
Intel Core i9-11900K, Intel Core i9-11900K
NVIDIA Titan RTX
198 fps +85%
Intel Core i7-12700K, Intel Core i7-12700K
NVIDIA Titan RTX
193 fps +80%
Intel Core i5-11600K, Intel Core i5-11600K
NVIDIA Titan RTX
185 fps +73%
Intel Core i9-10900K, Intel Core i9-10900K
NVIDIA Titan RTX
166.2 fps +55%
Intel Core i5-10600K, Intel Core i5-10600K
NVIDIA Titan RTX
153.9 fps +44%
AMD Ryzen 9 3950X, AMD Ryzen 9 3950X
NVIDIA Titan RTX
153.2 fps +43%
Corsair One i160, Intel Core i9-9900K
NVIDIA GeForce RTX 2080 Ti (Desktop)
116.3 fps +9%
Intel Dragon Canyon NUC - RTX 3060, Intel Core i9-12900
NVIDIA GeForce RTX 3060
107 fps
Intel Beast Canyon NUC, Intel Core i9-11900KB
NVIDIA GeForce RTX 3060
104 fps -3%
Intel Ghost Canyon NUC (RTX 2070), Intel Core i9-9980HK
NVIDIA GeForce RTX 2070 (Desktop)
85.4 fps -20%
Inno3D GeForce RTX 3060 Twin X2, AMD Ryzen 9 5900X
NVIDIA GeForce RTX 3060
84.9 fps -21%
Siemens NX (snx-03)
Intel Core i9-12900K, Intel Core i9-12900K
NVIDIA Titan RTX
516 fps +2815%
Intel Core i7-12700K, Intel Core i7-12700K
NVIDIA Titan RTX
513 fps +2798%
Intel Core i9-10900K, Intel Core i9-10900K
NVIDIA Titan RTX
472.9 fps +2572%
Intel Core i5-10600K, Intel Core i5-10600K
NVIDIA Titan RTX
469.1 fps +2550%
AMD Ryzen 9 3950X, AMD Ryzen 9 3950X
NVIDIA Titan RTX
460 fps +2499%
Intel Core i5-11600K, Intel Core i5-11600K
NVIDIA Titan RTX
453 fps +2459%
Intel Core i9-11900K, Intel Core i9-11900K
NVIDIA Titan RTX
450 fps +2442%
Corsair One i160, Intel Core i9-9900K
NVIDIA GeForce RTX 2080 Ti (Desktop)
23.03 fps +30%
Intel Dragon Canyon NUC - RTX 3060, Intel Core i9-12900
NVIDIA GeForce RTX 3060
17.7 fps
Intel Ghost Canyon NUC (RTX 2070), Intel Core i9-9980HK
NVIDIA GeForce RTX 2070 (Desktop)
16.33 fps -8%
Inno3D GeForce RTX 3060 Twin X2, AMD Ryzen 9 5900X
NVIDIA GeForce RTX 3060
16.2 fps -8%
Intel Beast Canyon NUC, Intel Core i9-11900KB
NVIDIA GeForce RTX 3060
15.8 fps -11%
Showcase (showcase-02)
Intel Core i9-12900K, Intel Core i9-12900K
NVIDIA Titan RTX
199 fps +70%
Intel Core i7-12700K, Intel Core i7-12700K
NVIDIA Titan RTX
199 fps +70%
Intel Core i5-10600K, Intel Core i5-10600K
NVIDIA Titan RTX
195.1 fps +67%
Intel Core i9-10900K, Intel Core i9-10900K
NVIDIA Titan RTX
194.1 fps +66%
Intel Core i9-11900K, Intel Core i9-11900K
NVIDIA Titan RTX
194 fps +66%
Intel Core i5-11600K, Intel Core i5-11600K
NVIDIA Titan RTX
193 fps +65%
AMD Ryzen 9 3950X, AMD Ryzen 9 3950X
NVIDIA Titan RTX
186.8 fps +60%
Corsair One i160, Intel Core i9-9900K
NVIDIA GeForce RTX 2080 Ti (Desktop)
182.6 fps +56%
Intel Ghost Canyon NUC (RTX 2070), Intel Core i9-9980HK
NVIDIA GeForce RTX 2070 (Desktop)
118.5 fps +1%
Intel Dragon Canyon NUC - RTX 3060, Intel Core i9-12900
NVIDIA GeForce RTX 3060
117 fps
Inno3D GeForce RTX 3060 Twin X2, AMD Ryzen 9 5900X
NVIDIA GeForce RTX 3060
115 fps -2%
Intel Beast Canyon NUC, Intel Core i9-11900KB
NVIDIA GeForce RTX 3060
113 fps -3%
Medical (medical-02)
Intel Core i7-12700K, Intel Core i7-12700K
NVIDIA Titan RTX
93.7 fps +68%
Intel Core i9-12900K, Intel Core i9-12900K
NVIDIA Titan RTX
93.6 fps +68%
AMD Ryzen 9 3950X, AMD Ryzen 9 3950X
NVIDIA Titan RTX
90.3 fps +62%
Intel Core i9-11900K, Intel Core i9-11900K
NVIDIA Titan RTX
90 fps +62%
Intel Core i5-11600K, Intel Core i5-11600K
NVIDIA Titan RTX
90 fps +62%
Intel Core i5-10600K, Intel Core i5-10600K
NVIDIA Titan RTX
89.7 fps +61%
Intel Core i9-10900K, Intel Core i9-10900K
NVIDIA Titan RTX
88.7 fps +59%
Corsair One i160, Intel Core i9-9900K
NVIDIA GeForce RTX 2080 Ti (Desktop)
85 fps +53%
Intel Ghost Canyon NUC (RTX 2070), Intel Core i9-9980HK
NVIDIA GeForce RTX 2070 (Desktop)
56.4 fps +1%
Intel Dragon Canyon NUC - RTX 3060, Intel Core i9-12900
NVIDIA GeForce RTX 3060
55.7 fps
Inno3D GeForce RTX 3060 Twin X2, AMD Ryzen 9 5900X
NVIDIA GeForce RTX 3060
55 fps -1%
Intel Beast Canyon NUC, Intel Core i9-11900KB
NVIDIA GeForce RTX 3060
54.4 fps -2%
Maya (maya-05)
Intel Core i9-12900K, Intel Core i9-12900K
NVIDIA Titan RTX
505 fps +80%
Intel Core i7-12700K, Intel Core i7-12700K
NVIDIA Titan RTX
500 fps +78%
Intel Core i9-11900K, Intel Core i9-11900K
NVIDIA Titan RTX
454 fps +62%
Intel Core i5-11600K, Intel Core i5-11600K
NVIDIA Titan RTX
449 fps +60%
Intel Core i9-10900K, Intel Core i9-10900K
NVIDIA Titan RTX
405.9 fps +44%
Corsair One i160, Intel Core i9-9900K
NVIDIA GeForce RTX 2080 Ti (Desktop)
402 fps +43%
AMD Ryzen 9 3950X, AMD Ryzen 9 3950X
NVIDIA Titan RTX
394.9 fps +41%
Intel Core i5-10600K, Intel Core i5-10600K
NVIDIA Titan RTX
387.5 fps +38%
Intel Ghost Canyon NUC (RTX 2070), Intel Core i9-9980HK
NVIDIA GeForce RTX 2070 (Desktop)
281 fps 0%
Intel Dragon Canyon NUC - RTX 3060, Intel Core i9-12900
NVIDIA GeForce RTX 3060
281 fps
Intel Beast Canyon NUC, Intel Core i9-11900KB
NVIDIA GeForce RTX 3060
262 fps -7%
Inno3D GeForce RTX 3060 Twin X2, AMD Ryzen 9 5900X
NVIDIA GeForce RTX 3060
261 fps -7%
Energy (energy-02)
Intel Core i5-11600K, Intel Core i5-11600K
NVIDIA Titan RTX
53.9 fps +293%
Intel Core i9-11900K, Intel Core i9-11900K
NVIDIA Titan RTX
53.7 fps +292%
Intel Core i5-10600K, Intel Core i5-10600K
NVIDIA Titan RTX
53.3 fps +289%
Intel Core i9-10900K, Intel Core i9-10900K
NVIDIA Titan RTX
53.2 fps +288%
Intel Core i9-12900K, Intel Core i9-12900K
NVIDIA Titan RTX
52.7 fps +285%
Intel Core i7-12700K, Intel Core i7-12700K
NVIDIA Titan RTX
52.6 fps +284%
AMD Ryzen 9 3950X, AMD Ryzen 9 3950X
NVIDIA Titan RTX
52.4 fps +282%
Corsair One i160, Intel Core i9-9900K
NVIDIA GeForce RTX 2080 Ti (Desktop)
31.93 fps +133%
Intel Ghost Canyon NUC (RTX 2070), Intel Core i9-9980HK
NVIDIA GeForce RTX 2070 (Desktop)
21.83 fps +59%
Intel Beast Canyon NUC, Intel Core i9-11900KB
NVIDIA GeForce RTX 3060
13.7 fps 0%
Intel Dragon Canyon NUC - RTX 3060, Intel Core i9-12900
NVIDIA GeForce RTX 3060
13.7 fps
Inno3D GeForce RTX 3060 Twin X2, AMD Ryzen 9 5900X
NVIDIA GeForce RTX 3060
13.6 fps -1%
Creo (creo-02)
Intel Core i9-12900K, Intel Core i9-12900K
NVIDIA Titan RTX
389 fps +104%
Intel Core i7-12700K, Intel Core i7-12700K
NVIDIA Titan RTX
388 fps +103%
Intel Core i9-11900K, Intel Core i9-11900K
NVIDIA Titan RTX
355 fps +86%
Intel Core i5-11600K, Intel Core i5-11600K
NVIDIA Titan RTX
354 fps +85%
Intel Core i9-10900K, Intel Core i9-10900K
NVIDIA Titan RTX
336.3 fps +76%
Intel Core i5-10600K, Intel Core i5-10600K
NVIDIA Titan RTX
331.7 fps +74%
AMD Ryzen 9 3950X, AMD Ryzen 9 3950X
NVIDIA Titan RTX
328.8 fps +72%
Corsair One i160, Intel Core i9-9900K
NVIDIA GeForce RTX 2080 Ti (Desktop)
286.1 fps +50%
Intel Dragon Canyon NUC - RTX 3060, Intel Core i9-12900
NVIDIA GeForce RTX 3060
191 fps
Intel Ghost Canyon NUC (RTX 2070), Intel Core i9-9980HK
NVIDIA GeForce RTX 2070 (Desktop)
183.8 fps -4%
Inno3D GeForce RTX 3060 Twin X2, AMD Ryzen 9 5900X
NVIDIA GeForce RTX 3060
181 fps -5%
Intel Beast Canyon NUC, Intel Core i9-11900KB
NVIDIA GeForce RTX 3060
172 fps -10%
Catia (catia-05)
Intel Core i9-12900K, Intel Core i9-12900K
NVIDIA Titan RTX
467 fps +336%
Intel Core i7-12700K, Intel Core i7-12700K
NVIDIA Titan RTX
459 fps +329%
Intel Core i9-11900K, Intel Core i9-11900K
NVIDIA Titan RTX
415 fps +288%
Intel Core i5-11600K, Intel Core i5-11600K
NVIDIA Titan RTX
397 fps +271%
Intel Core i9-10900K, Intel Core i9-10900K
NVIDIA Titan RTX
362.1 fps +238%
AMD Ryzen 9 3950X, AMD Ryzen 9 3950X
NVIDIA Titan RTX
355.2 fps +232%
Intel Core i5-10600K, Intel Core i5-10600K
NVIDIA Titan RTX
341.7 fps +219%
Corsair One i160, Intel Core i9-9900K
NVIDIA GeForce RTX 2080 Ti (Desktop)
177.3 fps +66%
Intel Ghost Canyon NUC (RTX 2070), Intel Core i9-9980HK
NVIDIA GeForce RTX 2070 (Desktop)
113.7 fps +6%
Inno3D GeForce RTX 3060 Twin X2, AMD Ryzen 9 5900X
NVIDIA GeForce RTX 3060
109 fps +2%
Intel Dragon Canyon NUC - RTX 3060, Intel Core i9-12900
NVIDIA GeForce RTX 3060
107 fps
Intel Beast Canyon NUC, Intel Core i9-11900KB
NVIDIA GeForce RTX 3060
104 fps -3%
3ds Max (3dsmax-06)
Intel Core i7-12700K, Intel Core i7-12700K
NVIDIA Titan RTX
303 fps +46%
Intel Core i5-10600K, Intel Core i5-10600K
NVIDIA Titan RTX
294.4 fps +42%
Intel Core i9-10900K, Intel Core i9-10900K
NVIDIA Titan RTX
292.5 fps +41%
Intel Core i5-11600K, Intel Core i5-11600K
NVIDIA Titan RTX
288 fps +39%
Intel Core i9-11900K, Intel Core i9-11900K
NVIDIA Titan RTX
287 fps +39%
AMD Ryzen 9 3950X, AMD Ryzen 9 3950X
NVIDIA Titan RTX
274.5 fps +33%
Corsair One i160, Intel Core i9-9900K
NVIDIA GeForce RTX 2080 Ti (Desktop)
265.9 fps +28%
Intel Core i9-12900K, Intel Core i9-12900K
NVIDIA Titan RTX
265 fps +28%
Inno3D GeForce RTX 3060 Twin X2, AMD Ryzen 9 5900X
NVIDIA GeForce RTX 3060
215 fps +4%
Intel Dragon Canyon NUC - RTX 3060, Intel Core i9-12900
NVIDIA GeForce RTX 3060
207 fps
Intel Beast Canyon NUC, Intel Core i9-11900KB
NVIDIA GeForce RTX 3060
202 fps -2%
Intel Ghost Canyon NUC (RTX 2070), Intel Core i9-9980HK
NVIDIA GeForce RTX 2070 (Desktop)
178.6 fps -14%

3D och spelprestanda

Eftersom Intel Core i9-12900 endast erbjuder en enkel iGPU med Intel UHD Graphics 770 är 3D-prestandan för krävande videospel helt enkelt inte där. Du kan dock installera ett dedikerat grafikkort i höljet, vilket förvandlar NUC till en mycket kompakt speldator. Eftersom vi redan har testatBeast Canyon NUCmed ett Nvidia GeForce RTX 3060 vid det tillfället bestämde vi oss för att även använda en modell av RTX 3060 för Dragon Canyon NUC. I kombination med Alder Lake-processorn ökar prestandan med cirka 4 % i speldrift. Detta resultat motiverar inte en uppgradering, så det bör endast vara relevant vid ett nyinköp

Samarbetet med Nvidia GeForce RTX 3060från INNO 3D fungerar mycket bra. Alla aktuella spel kan utan problem avnjutas med tillräcklig bildfrekvens i 1440-upplösningen. Ibland kan man till och med spela många spel i 2160p. Men eftersom ökande upplösning och högre detaljnivåer berör mer GPU-gränserna är CPU:ns prestanda endast sekundär, vilket förklarar den låga prestandatillväxten jämfört med Beast Canyon NUC

Du kan hitta ytterligare jämförelser och benchmarks i vår GPU-jämförelsetabell.

De som vill utrusta sin Dragon Canyon NUC med ett dedikerat grafikkort bör i förväg ta reda på GPU:ns exakta dimensioner. Grafikkortet får inte ha en kylningskonstruktion som tar upp mer än två platser, och du bör också notera den maximala längden på 30,5 cm (12 tum).

Performance Rating - Percent
Zotac Magnus One (ECM73070C)
NVIDIA GeForce RTX 3070, i7-10700, Phison 512GB PA6620060U
88.8 pt
Inno3D GeForce RTX 3060 Twin X2
NVIDIA GeForce RTX 3060, R9 5900X, Corsair MP600
88.1 pt
Intel Dragon Canyon NUC - RTX 3060
NVIDIA GeForce RTX 3060, i9-12900, Transcend M.2 SSD 2200S TS512GMTE220S
87.7 pt
Intel Beast Canyon NUC
NVIDIA GeForce RTX 3060, i9-11900KB, Sabrent Rocket 4.0 500GB
84.4 pt
Intel Ghost Canyon NUC (RTX 2070)
GeForce RTX 2070 (Desktop), i9-9980HK, Kingston KC2500 1 TB SKC2500M81000G
75.9 pt
Borderlands 3
1280x720 Very Low Overall Quality (DX11)
Intel Dragon Canyon NUC - RTX 3060
NVIDIA GeForce RTX 3060, i9-12900, Transcend M.2 SSD 2200S TS512GMTE220S
185 fps
Inno3D GeForce RTX 3060 Twin X2
NVIDIA GeForce RTX 3060, R9 5900X, Corsair MP600
172 fps -7%
Intel Beast Canyon NUC
NVIDIA GeForce RTX 3060, i9-11900KB, Sabrent Rocket 4.0 500GB
156 fps -16%
Intel Ghost Canyon NUC (RTX 2070)
GeForce RTX 2070 (Desktop), i9-9980HK, Kingston KC2500 1 TB SKC2500M81000G
152 fps -18%
Zotac Magnus One (ECM73070C)
NVIDIA GeForce RTX 3070, i7-10700, Phison 512GB PA6620060U
149 fps -19%
1920x1080 Badass Overall Quality (DX11)
Intel Beast Canyon NUC
NVIDIA GeForce RTX 3060, i9-11900KB, Sabrent Rocket 4.0 500GB
100 fps +18%
Zotac Magnus One (ECM73070C)
NVIDIA GeForce RTX 3070, i7-10700, Phison 512GB PA6620060U
98.8 fps +17%
Intel Dragon Canyon NUC - RTX 3060
NVIDIA GeForce RTX 3060, i9-12900, Transcend M.2 SSD 2200S TS512GMTE220S
84.7 fps
Inno3D GeForce RTX 3060 Twin X2
NVIDIA GeForce RTX 3060, R9 5900X, Corsair MP600
78.5 fps -7%
Intel Ghost Canyon NUC (RTX 2070)
GeForce RTX 2070 (Desktop), i9-9980HK, Kingston KC2500 1 TB SKC2500M81000G
70.9 fps -16%
Metro Exodus
1280x720 Low Quality AF:4x
Intel Dragon Canyon NUC - RTX 3060
NVIDIA GeForce RTX 3060, i9-12900, Transcend M.2 SSD 2200S TS512GMTE220S
207 (93.55min - 336.7max) fps
Inno3D GeForce RTX 3060 Twin X2
NVIDIA GeForce RTX 3060, R9 5900X, Corsair MP600
202 (94.16min - 331.35max) fps -2%
Intel Beast Canyon NUC
NVIDIA GeForce RTX 3060, i9-11900KB, Sabrent Rocket 4.0 500GB
198 (96.07min - 323.73max) fps -4%
Intel Ghost Canyon NUC (RTX 2070)
GeForce RTX 2070 (Desktop), i9-9980HK, Kingston KC2500 1 TB SKC2500M81000G
181 (100.48min - 268.67max) fps -13%
Zotac Magnus One (ECM73070C)
NVIDIA GeForce RTX 3070, i7-10700, Phison 512GB PA6620060U
166 (92.98min - 251.64max) fps -20%
1920x1080 Ultra Quality AF:16x
Zotac Magnus One (ECM73070C)
NVIDIA GeForce RTX 3070, i7-10700, Phison 512GB PA6620060U
93.1 (45.73min - 151.06max) fps +43%
Intel Dragon Canyon NUC - RTX 3060
NVIDIA GeForce RTX 3060, i9-12900, Transcend M.2 SSD 2200S TS512GMTE220S
65.3 (34.71min - 117.86max) fps
Intel Ghost Canyon NUC (RTX 2070)
GeForce RTX 2070 (Desktop), i9-9980HK, Kingston KC2500 1 TB SKC2500M81000G
60.9 (33.61min - 92.62max) fps -7%
Intel Beast Canyon NUC
NVIDIA GeForce RTX 3060, i9-11900KB, Sabrent Rocket 4.0 500GB
59.8 (30.99min - 119.9max) fps -8%
Inno3D GeForce RTX 3060 Twin X2
NVIDIA GeForce RTX 3060, R9 5900X, Corsair MP600
55.1 (32.45min - 87.42max) fps -16%
Far Cry New Dawn
1280x720 Low Preset
Inno3D GeForce RTX 3060 Twin X2
NVIDIA GeForce RTX 3060, R9 5900X, Corsair MP600
163 (117min - 259max) fps +1%
Intel Dragon Canyon NUC - RTX 3060
NVIDIA GeForce RTX 3060, i9-12900, Transcend M.2 SSD 2200S TS512GMTE220S
161 (119min - 232max) fps
Intel Beast Canyon NUC
NVIDIA GeForce RTX 3060, i9-11900KB, Sabrent Rocket 4.0 500GB
144 (82min - 218max) fps -11%
Intel Ghost Canyon NUC (RTX 2070)
GeForce RTX 2070 (Desktop), i9-9980HK, Kingston KC2500 1 TB SKC2500M81000G
128 (92min - 190max) fps -20%
Zotac Magnus One (ECM73070C)
NVIDIA GeForce RTX 3070, i7-10700, Phison 512GB PA6620060U
126 (96min - 186max) fps -22%
1920x1080 Ultra Preset
Intel Dragon Canyon NUC - RTX 3060
NVIDIA GeForce RTX 3060, i9-12900, Transcend M.2 SSD 2200S TS512GMTE220S
113 (86min - 148max) fps
Inno3D GeForce RTX 3060 Twin X2
NVIDIA GeForce RTX 3060, R9 5900X, Corsair MP600
112 (83min - 146max) fps -1%
Intel Beast Canyon NUC
NVIDIA GeForce RTX 3060, i9-11900KB, Sabrent Rocket 4.0 500GB
102 (72min - 145max) fps -10%
Zotac Magnus One (ECM73070C)
NVIDIA GeForce RTX 3070, i7-10700, Phison 512GB PA6620060U
95 (66min - 149max) fps -16%
Intel Ghost Canyon NUC (RTX 2070)
GeForce RTX 2070 (Desktop), i9-9980HK, Kingston KC2500 1 TB SKC2500M81000G
79 (61min - 99max) fps -30%
Far Cry 5
1280x720 Low Preset AA:T
Inno3D GeForce RTX 3060 Twin X2
NVIDIA GeForce RTX 3060, R9 5900X, Corsair MP600
196 (146min - 267max) fps +2%
Intel Dragon Canyon NUC - RTX 3060
NVIDIA GeForce RTX 3060, i9-12900, Transcend M.2 SSD 2200S TS512GMTE220S
193 (135min - 251max) fps
Intel Beast Canyon NUC
NVIDIA GeForce RTX 3060, i9-11900KB, Sabrent Rocket 4.0 500GB
170 (105min - 231max) fps -12%
Zotac Magnus One (ECM73070C)
NVIDIA GeForce RTX 3070, i7-10700, Phison 512GB PA6620060U
150 (118min - 203max) fps -22%
Intel Ghost Canyon NUC (RTX 2070)
GeForce RTX 2070 (Desktop), i9-9980HK, Kingston KC2500 1 TB SKC2500M81000G
147 (119min - 193max) fps -24%
1920x1080 Ultra Preset AA:T
Inno3D GeForce RTX 3060 Twin X2
NVIDIA GeForce RTX 3060, R9 5900X, Corsair MP600
132 (109min - 150max) fps 0%
Intel Dragon Canyon NUC - RTX 3060
NVIDIA GeForce RTX 3060, i9-12900, Transcend M.2 SSD 2200S TS512GMTE220S
132 (114min - 150max) fps
Intel Beast Canyon NUC
NVIDIA GeForce RTX 3060, i9-11900KB, Sabrent Rocket 4.0 500GB
122 (93min - 151max) fps -8%
Zotac Magnus One (ECM73070C)
NVIDIA GeForce RTX 3070, i7-10700, Phison 512GB PA6620060U
117 (89min - 155max) fps -11%
Intel Ghost Canyon NUC (RTX 2070)
GeForce RTX 2070 (Desktop), i9-9980HK, Kingston KC2500 1 TB SKC2500M81000G
86 (68min - 111max) fps -35%
X-Plane 11.11
1280x720 low (fps_test=1)
Inno3D GeForce RTX 3060 Twin X2
NVIDIA GeForce RTX 3060, R9 5900X, Corsair MP600
160 fps +6%
Intel Beast Canyon NUC
NVIDIA GeForce RTX 3060, i9-11900KB, Sabrent Rocket 4.0 500GB
151 fps 0%
Intel Dragon Canyon NUC - RTX 3060
NVIDIA GeForce RTX 3060, i9-12900, Transcend M.2 SSD 2200S TS512GMTE220S
151 fps
Intel Ghost Canyon NUC (RTX 2070)
GeForce RTX 2070 (Desktop), i9-9980HK, Kingston KC2500 1 TB SKC2500M81000G
127 fps -16%
Zotac Magnus One (ECM73070C)
NVIDIA GeForce RTX 3070, i7-10700, Phison 512GB PA6620060U
124 fps -18%
1920x1080 high (fps_test=3)
Inno3D GeForce RTX 3060 Twin X2
NVIDIA GeForce RTX 3060, R9 5900X, Corsair MP600
112 fps +7%
Intel Beast Canyon NUC
NVIDIA GeForce RTX 3060, i9-11900KB, Sabrent Rocket 4.0 500GB
105 fps 0%
Intel Dragon Canyon NUC - RTX 3060
NVIDIA GeForce RTX 3060, i9-12900, Transcend M.2 SSD 2200S TS512GMTE220S
105 fps
Intel Ghost Canyon NUC (RTX 2070)
GeForce RTX 2070 (Desktop), i9-9980HK, Kingston KC2500 1 TB SKC2500M81000G
92.7 fps -12%
Zotac Magnus One (ECM73070C)
NVIDIA GeForce RTX 3070, i7-10700, Phison 512GB PA6620060U
91 fps -13%
Final Fantasy XV Benchmark
1280x720 Lite Quality
Inno3D GeForce RTX 3060 Twin X2
NVIDIA GeForce RTX 3060, R9 5900X, Corsair MP600
210 fps +7%
Intel Beast Canyon NUC
NVIDIA GeForce RTX 3060, i9-11900KB, Sabrent Rocket 4.0 500GB
196 fps 0%
Intel Dragon Canyon NUC - RTX 3060
NVIDIA GeForce RTX 3060, i9-12900, Transcend M.2 SSD 2200S TS512GMTE220S
196 fps
Intel Ghost Canyon NUC (RTX 2070)
GeForce RTX 2070 (Desktop), i9-9980HK, Kingston KC2500 1 TB SKC2500M81000G
193 (94min - 237max) fps -2%
Zotac Magnus One (ECM73070C)
NVIDIA GeForce RTX 3070, i7-10700, Phison 512GB PA6620060U
167 fps -15%
1920x1080 High Quality
Zotac Magnus One (ECM73070C)
NVIDIA GeForce RTX 3070, i7-10700, Phison 512GB PA6620060U
112 fps +26%
Intel Ghost Canyon NUC (RTX 2070)
GeForce RTX 2070 (Desktop), i9-9980HK, Kingston KC2500 1 TB SKC2500M81000G
90.6 (56min - 138max) fps +2%
Inno3D GeForce RTX 3060 Twin X2
NVIDIA GeForce RTX 3060, R9 5900X, Corsair MP600
88.6 fps 0%
Intel Beast Canyon NUC
NVIDIA GeForce RTX 3060, i9-11900KB, Sabrent Rocket 4.0 500GB
88.6 fps 0%
Intel Dragon Canyon NUC - RTX 3060
NVIDIA GeForce RTX 3060, i9-12900, Transcend M.2 SSD 2200S TS512GMTE220S
88.6 fps
Dota 2 Reborn
1280x720 min (0/3) fastest
Inno3D GeForce RTX 3060 Twin X2
NVIDIA GeForce RTX 3060, R9 5900X, Corsair MP600
202.1 (165min) fps +13%
Intel Beast Canyon NUC
NVIDIA GeForce RTX 3060, i9-11900KB, Sabrent Rocket 4.0 500GB
178.3 (153.2min) fps 0%
Intel Dragon Canyon NUC - RTX 3060
NVIDIA GeForce RTX 3060, i9-12900, Transcend M.2 SSD 2200S TS512GMTE220S
178.3 (153.2min) fps
Zotac Magnus One (ECM73070C)
NVIDIA GeForce RTX 3070, i7-10700, Phison 512GB PA6620060U
164.2 (143.5min) fps -8%
Intel Ghost Canyon NUC (RTX 2070)
GeForce RTX 2070 (Desktop), i9-9980HK, Kingston KC2500 1 TB SKC2500M81000G
155.6 (135.2min) fps -13%
1920x1080 ultra (3/3) best looking
Inno3D GeForce RTX 3060 Twin X2
NVIDIA GeForce RTX 3060, R9 5900X, Corsair MP600
159.7 (126.4min) fps +9%
Intel Beast Canyon NUC
NVIDIA GeForce RTX 3060, i9-11900KB, Sabrent Rocket 4.0 500GB
147.1 (126min) fps 0%
Intel Dragon Canyon NUC - RTX 3060
NVIDIA GeForce RTX 3060, i9-12900, Transcend M.2 SSD 2200S TS512GMTE220S
147.1 (126min) fps
Intel Ghost Canyon NUC (RTX 2070)
GeForce RTX 2070 (Desktop), i9-9980HK, Kingston KC2500 1 TB SKC2500M81000G
130.3 (114.9min) fps -11%
Zotac Magnus One (ECM73070C)
NVIDIA GeForce RTX 3070, i7-10700, Phison 512GB PA6620060U
129.7 (113.4min) fps -12%
3DMark
Fire Strike Extreme Graphics
Zotac Magnus One (ECM73070C)
NVIDIA GeForce RTX 3070, i7-10700, Phison 512GB PA6620060U
15597 Points +52%
Inno3D GeForce RTX 3060 Twin X2
NVIDIA GeForce RTX 3060, R9 5900X, Corsair MP600
10330 Points +1%
Intel Dragon Canyon NUC - RTX 3060
NVIDIA GeForce RTX 3060, i9-12900, Transcend M.2 SSD 2200S TS512GMTE220S
10244 Points
Intel Beast Canyon NUC
NVIDIA GeForce RTX 3060, i9-11900KB, Sabrent Rocket 4.0 500GB
10181 Points -1%
Intel Ghost Canyon NUC (RTX 2070)
GeForce RTX 2070 (Desktop), i9-9980HK, Kingston KC2500 1 TB SKC2500M81000G
9979 Points -3%
1920x1080 Fire Strike Graphics
Zotac Magnus One (ECM73070C)
NVIDIA GeForce RTX 3070, i7-10700, Phison 512GB PA6620060U
30090 Points +37%
Intel Dragon Canyon NUC - RTX 3060
NVIDIA GeForce RTX 3060, i9-12900, Transcend M.2 SSD 2200S TS512GMTE220S
21984 Points
Inno3D GeForce RTX 3060 Twin X2
NVIDIA GeForce RTX 3060, R9 5900X, Corsair MP600
21847 Points -1%
Intel Beast Canyon NUC
NVIDIA GeForce RTX 3060, i9-11900KB, Sabrent Rocket 4.0 500GB
21379 Points -3%
Intel Ghost Canyon NUC (RTX 2070)
GeForce RTX 2070 (Desktop), i9-9980HK, Kingston KC2500 1 TB SKC2500M81000G
20775 Points -5%
2560x1440 Time Spy Graphics
Zotac Magnus One (ECM73070C)
NVIDIA GeForce RTX 3070, i7-10700, Phison 512GB PA6620060U
12668 Points +48%
Intel Ghost Canyon NUC (RTX 2070)
GeForce RTX 2070 (Desktop), i9-9980HK, Kingston KC2500 1 TB SKC2500M81000G
8631 Points +1%
Intel Dragon Canyon NUC - RTX 3060
NVIDIA GeForce RTX 3060, i9-12900, Transcend M.2 SSD 2200S TS512GMTE220S
8578 Points
Inno3D GeForce RTX 3060 Twin X2
NVIDIA GeForce RTX 3060, R9 5900X, Corsair MP600
8559 Points 0%
Intel Beast Canyon NUC
NVIDIA GeForce RTX 3060, i9-11900KB, Sabrent Rocket 4.0 500GB
8525 Points -1%
3DMark 11
1280x720 Performance GPU
Zotac Magnus One (ECM73070C)
NVIDIA GeForce RTX 3070, i7-10700, Phison 512GB PA6620060U
40950 Points +40%
Intel Dragon Canyon NUC - RTX 3060
NVIDIA GeForce RTX 3060, i9-12900, Transcend M.2 SSD 2200S TS512GMTE220S
29172 Points
Intel Beast Canyon NUC
NVIDIA GeForce RTX 3060, i9-11900KB, Sabrent Rocket 4.0 500GB
28939 Points -1%
Intel Ghost Canyon NUC (RTX 2070)
GeForce RTX 2070 (Desktop), i9-9980HK, Kingston KC2500 1 TB SKC2500M81000G
28828 Points -1%
Inno3D GeForce RTX 3060 Twin X2
NVIDIA GeForce RTX 3060, R9 5900X, Corsair MP600
28072 Points -4%
1280x720 Performance
Zotac Magnus One (ECM73070C)
NVIDIA GeForce RTX 3070, i7-10700, Phison 512GB PA6620060U
29057 Points +5%
Intel Dragon Canyon NUC - RTX 3060
NVIDIA GeForce RTX 3060, i9-12900, Transcend M.2 SSD 2200S TS512GMTE220S
27726 Points
Inno3D GeForce RTX 3060 Twin X2
NVIDIA GeForce RTX 3060, R9 5900X, Corsair MP600
26986 Points -3%
Intel Beast Canyon NUC
NVIDIA GeForce RTX 3060, i9-11900KB, Sabrent Rocket 4.0 500GB
25149 Points -9%
Intel Ghost Canyon NUC (RTX 2070)
GeForce RTX 2070 (Desktop), i9-9980HK, Kingston KC2500 1 TB SKC2500M81000G
24131 Points -13%

Intel NUC 12 Dragon Canyon + Nvidia GeForce RTX 3060

låg med. hög ultraQHD4K
GTA V (2015) 186 181 177 104 81.4 82.3
The Witcher 3 (2015) 462 305 178 91.3 62.5
Dota 2 Reborn (2015) 178.3 161.7 155.6 147.1 116.1
Final Fantasy XV Benchmark (2018) 196 123 88.6 64.8 38
X-Plane 11.11 (2018) 151 133 105 88.5
Far Cry 5 (2018) 193 153 139 132 94 48
Strange Brigade (2018) 491 230 180 154 116 66.8
Far Cry New Dawn (2019) 161 132 126 113 92 51
Metro Exodus (2019) 207 113 83.7 65.3 51.7 32.2
Borderlands 3 (2019) 185 148 104 84.7 60.3 33.3
F1 2020 (2020) 355 259 208 142 106 60.2
F1 2021 (2021) 419 261 206 96.9 72 40.9
Far Cry 6 (2021) 167 129 110 96 70.5 39.3

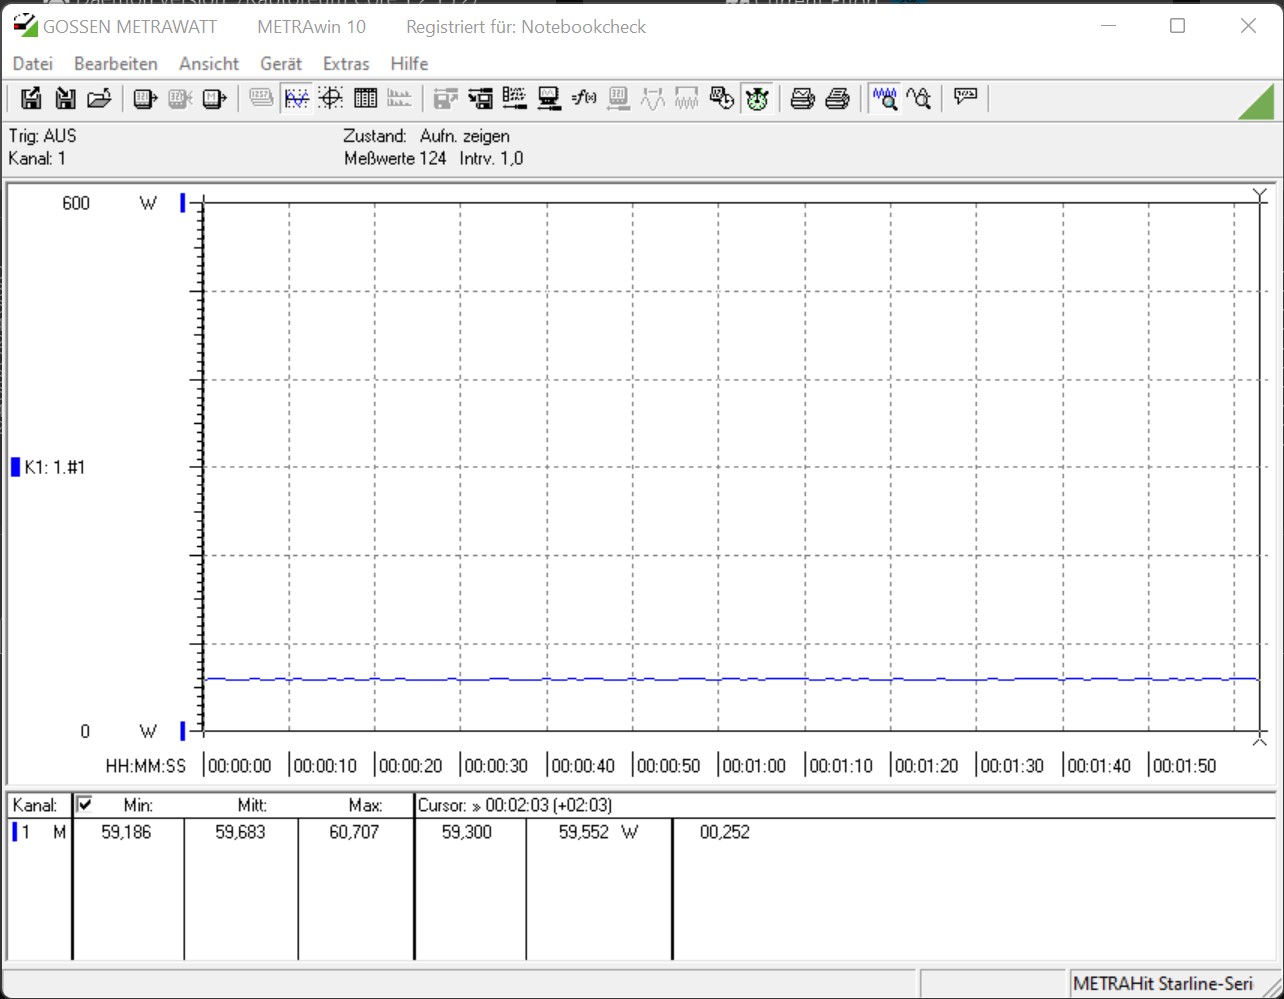
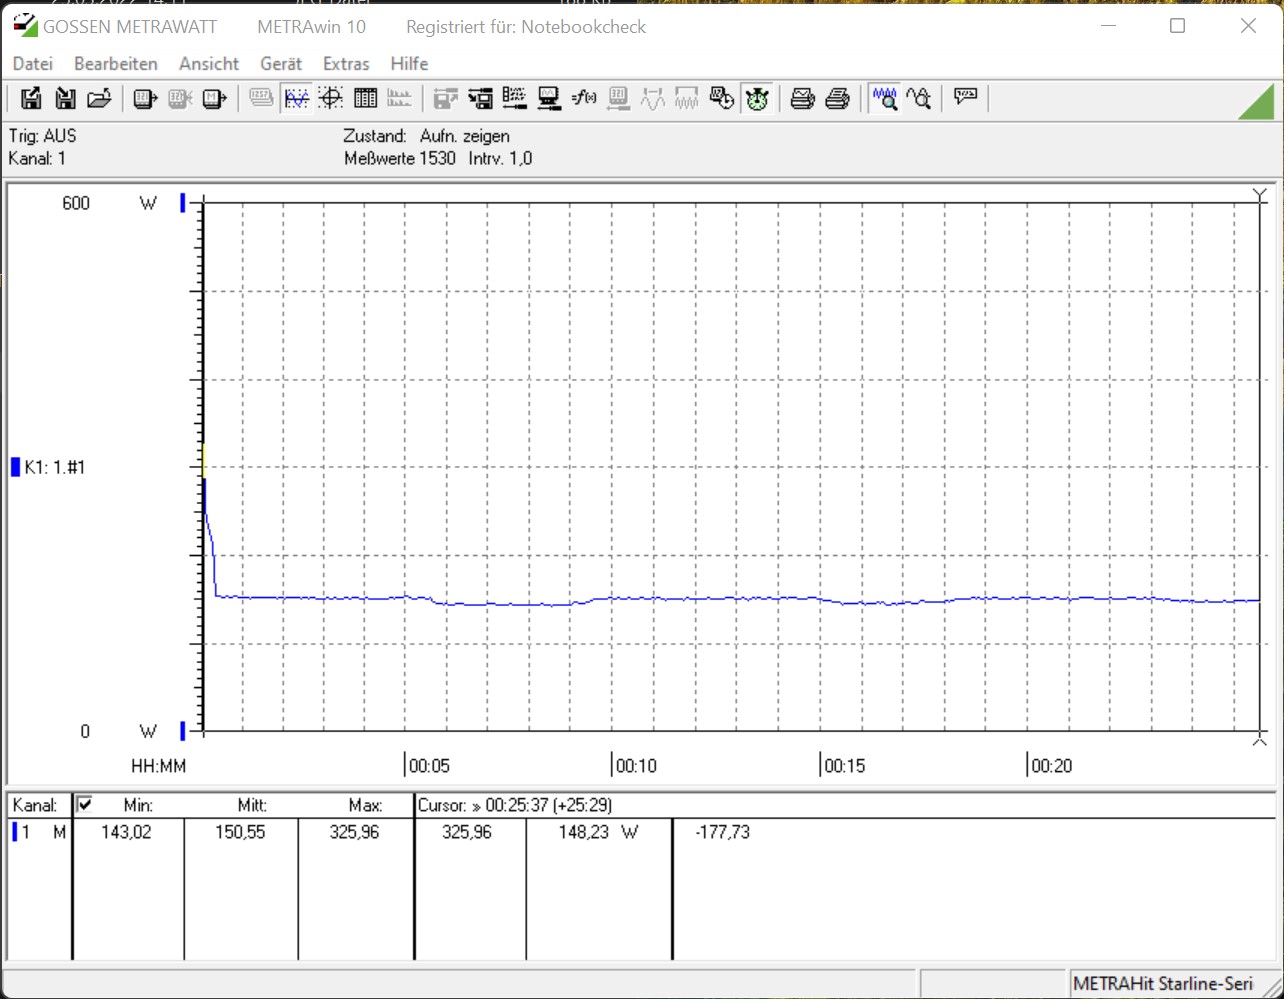
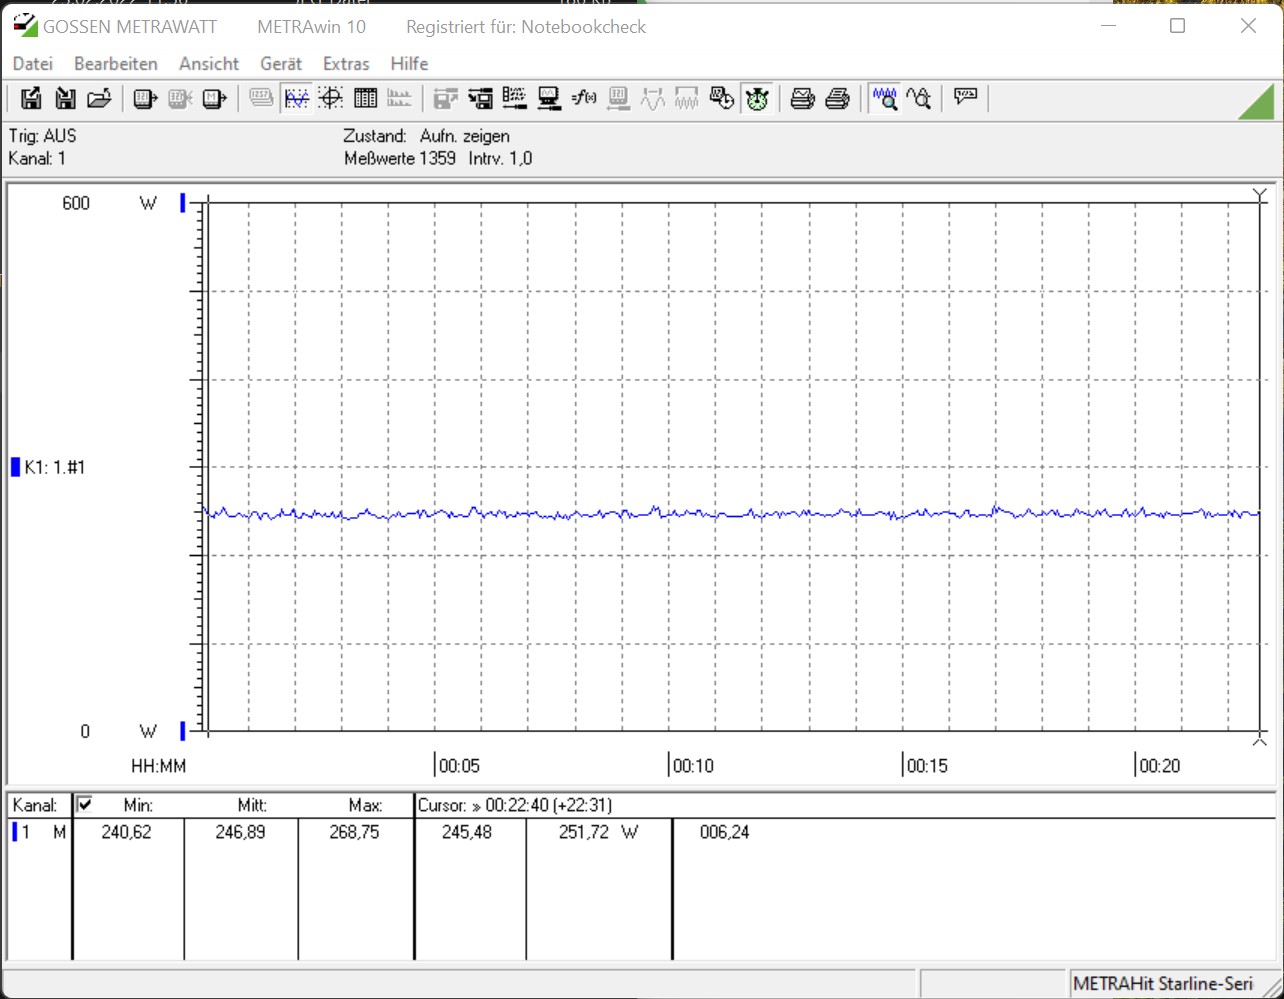
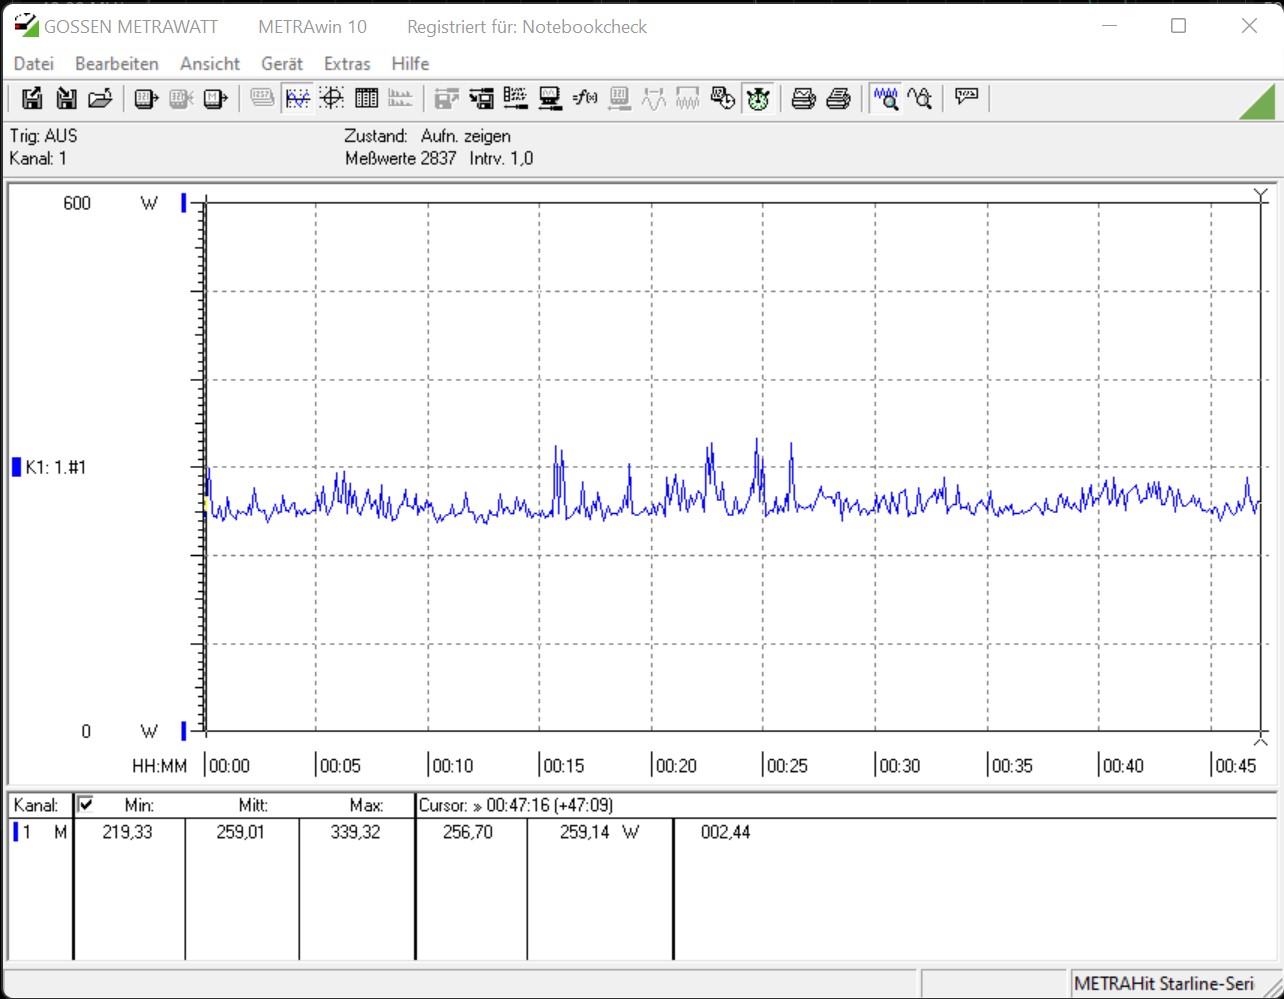
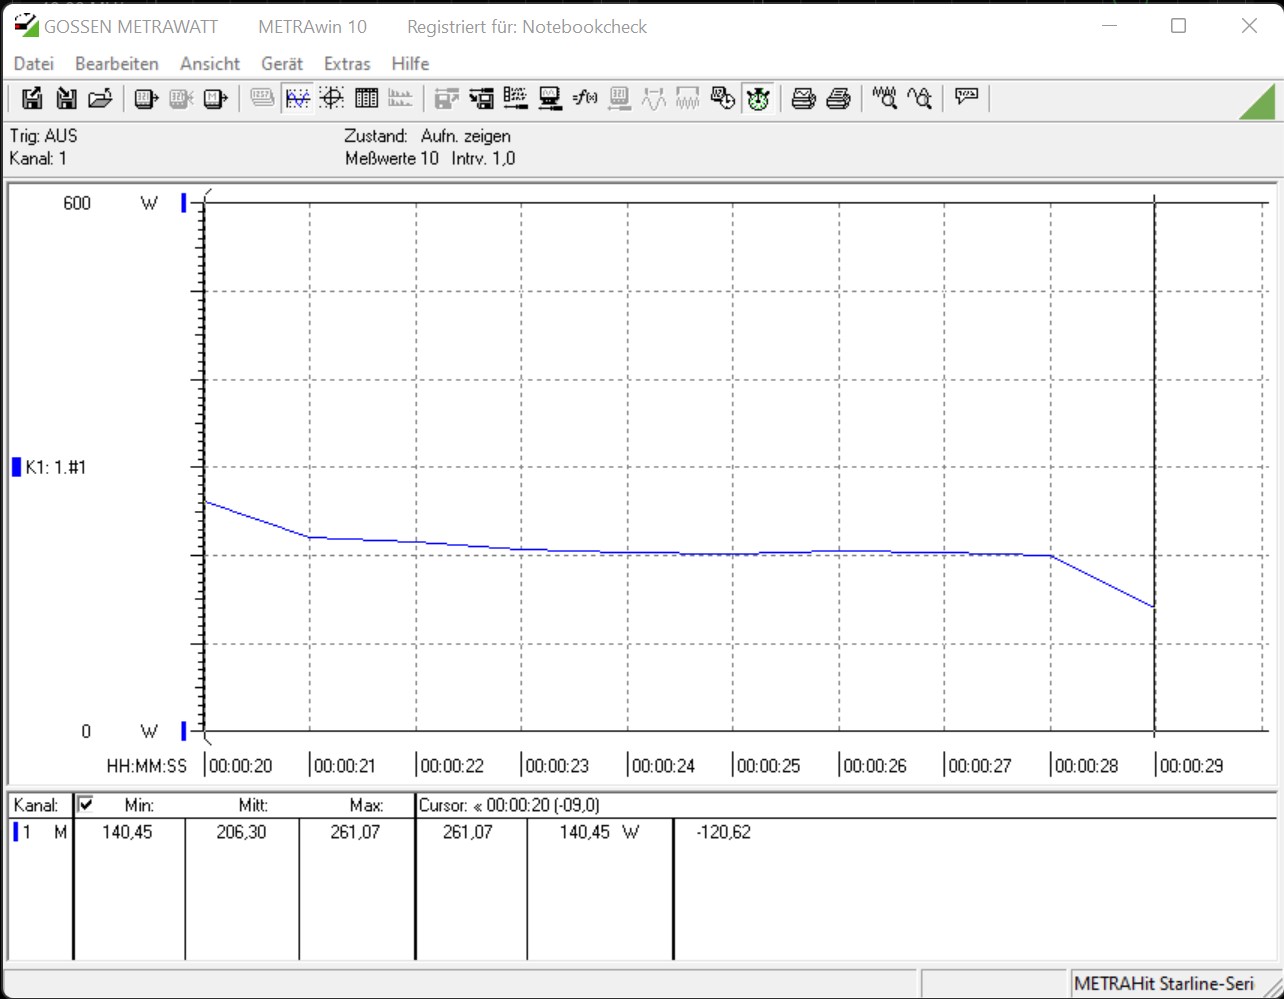
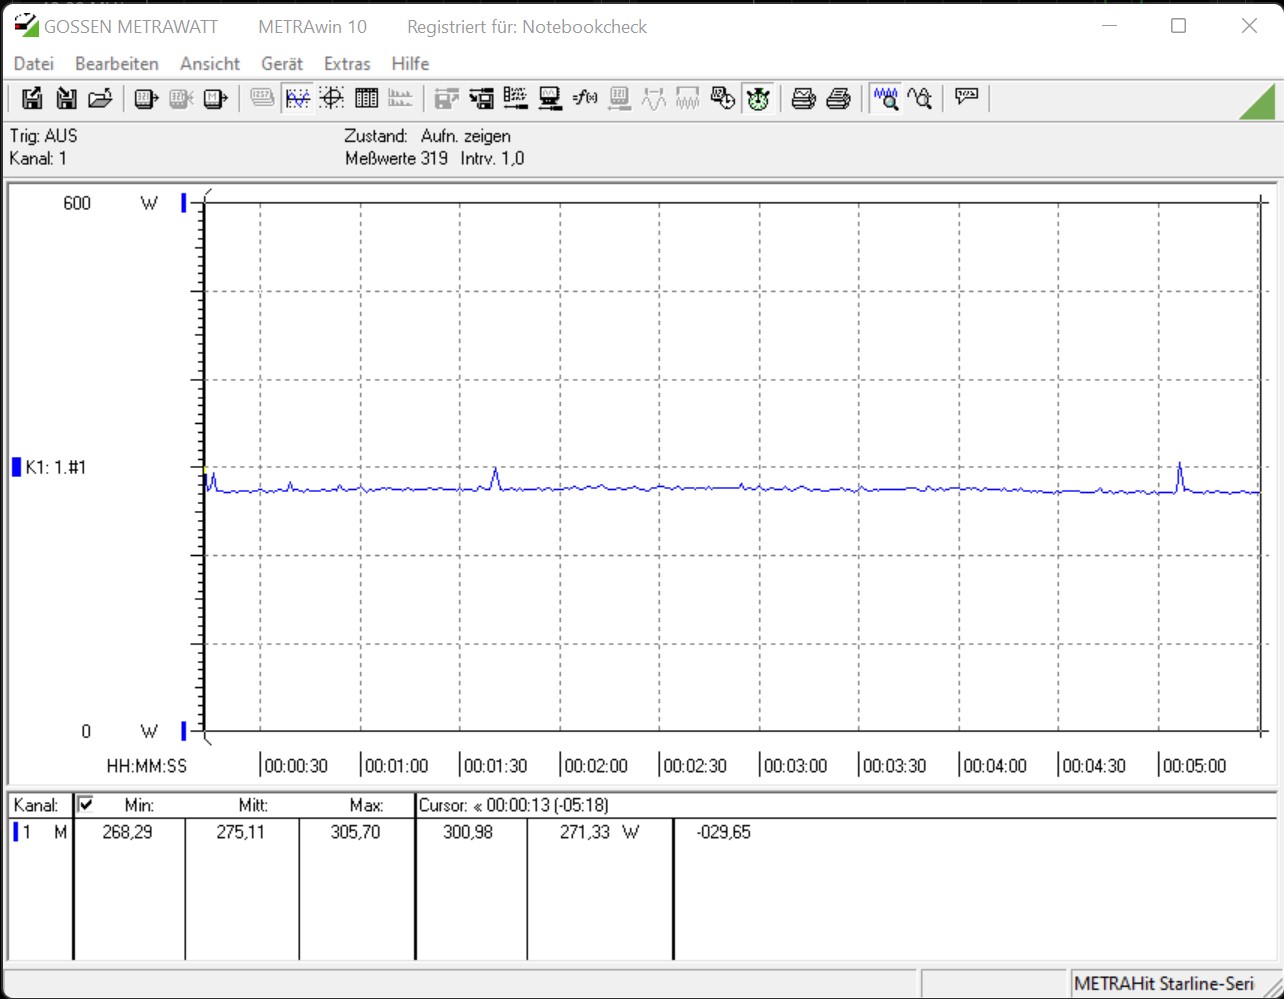
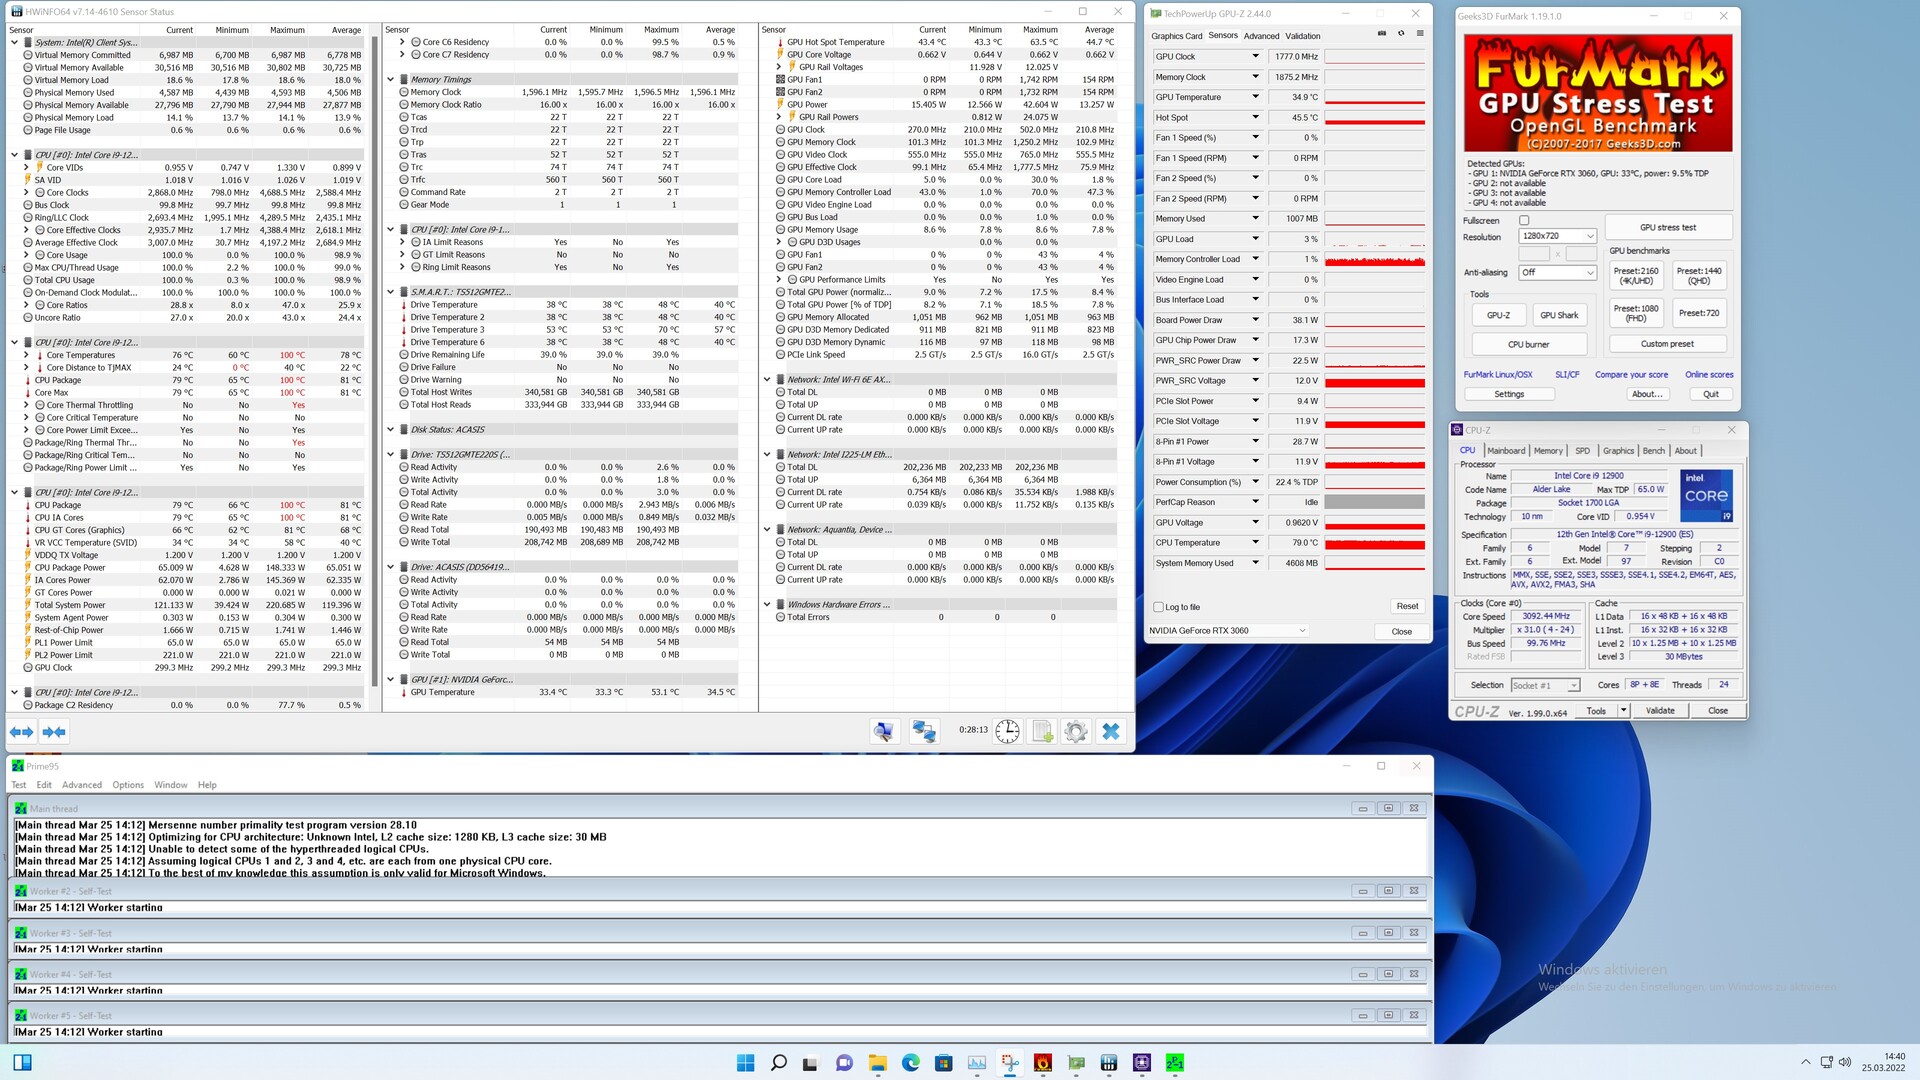
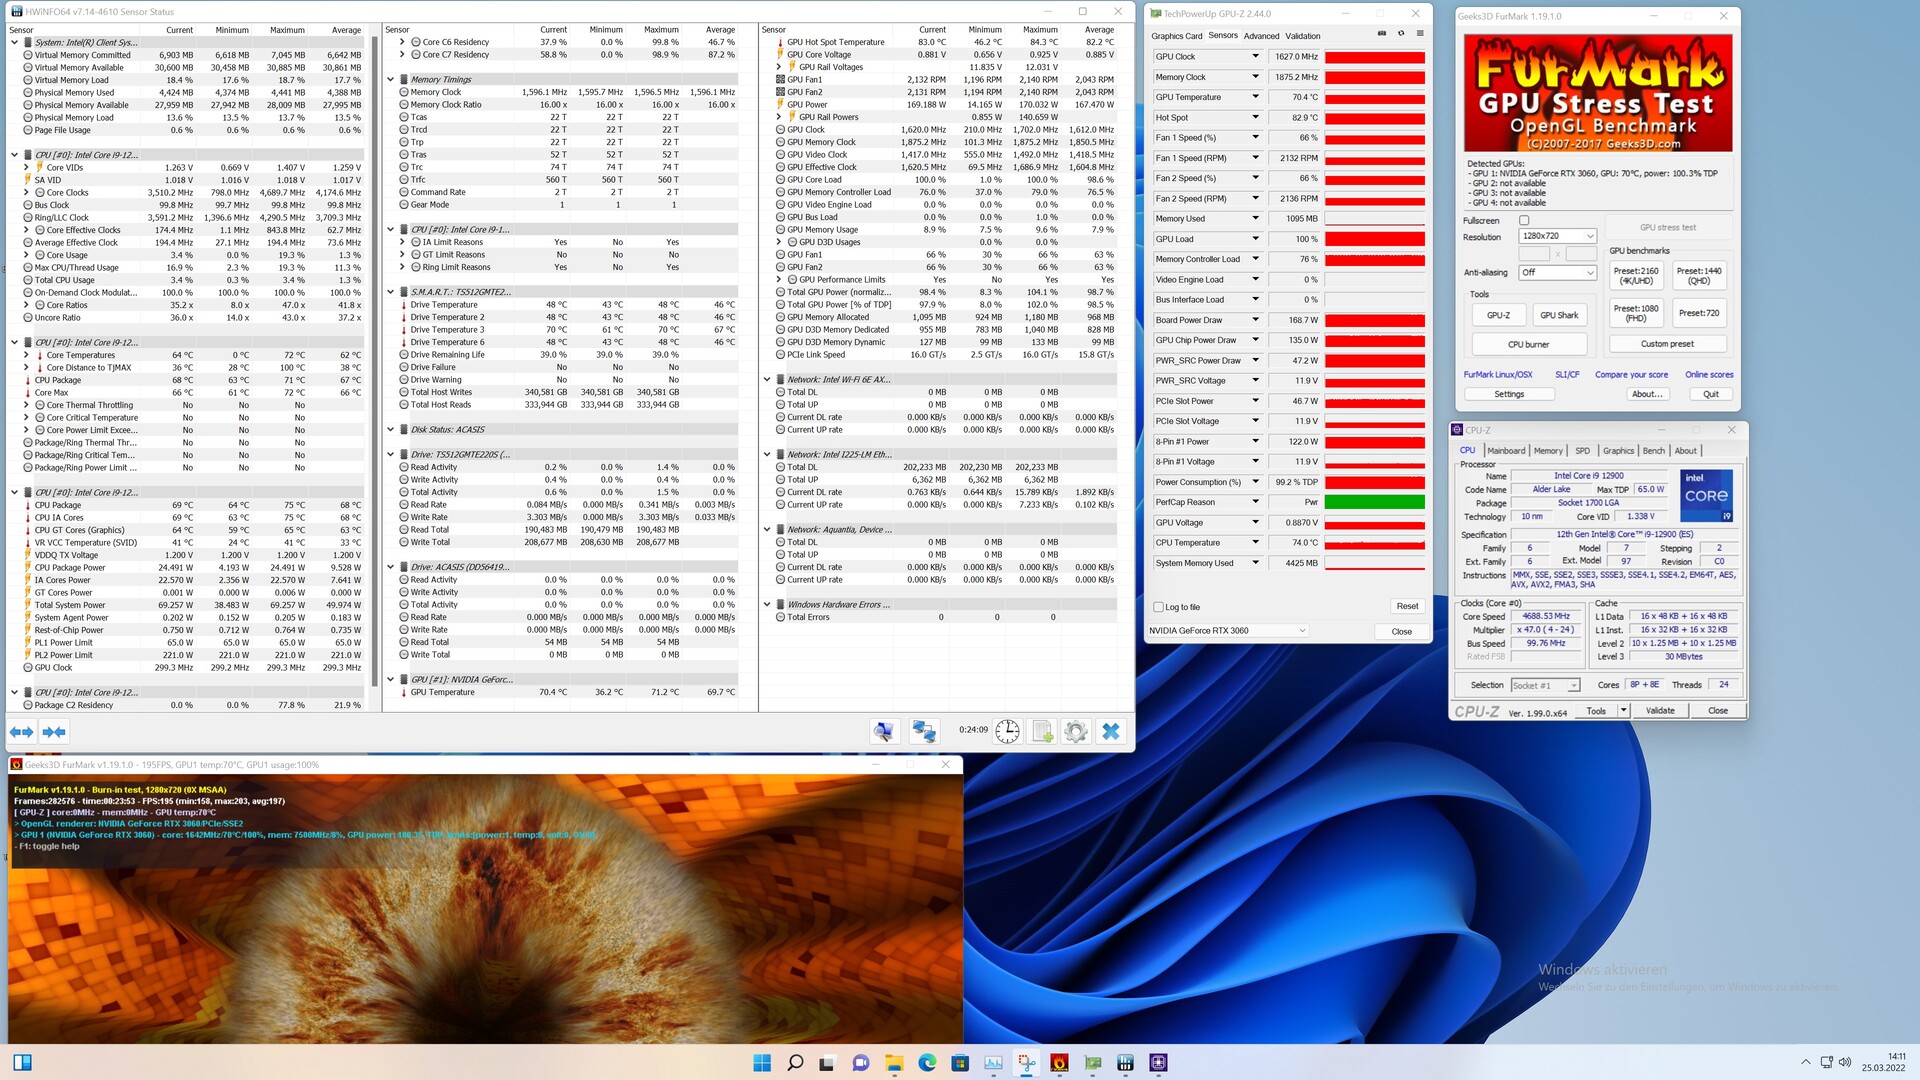
Effektförbrukning, värmeutveckling och buller för Intel NUC 12 Dragon Canyon

Intel NUC 12 Dragon Canyon under stresstestet

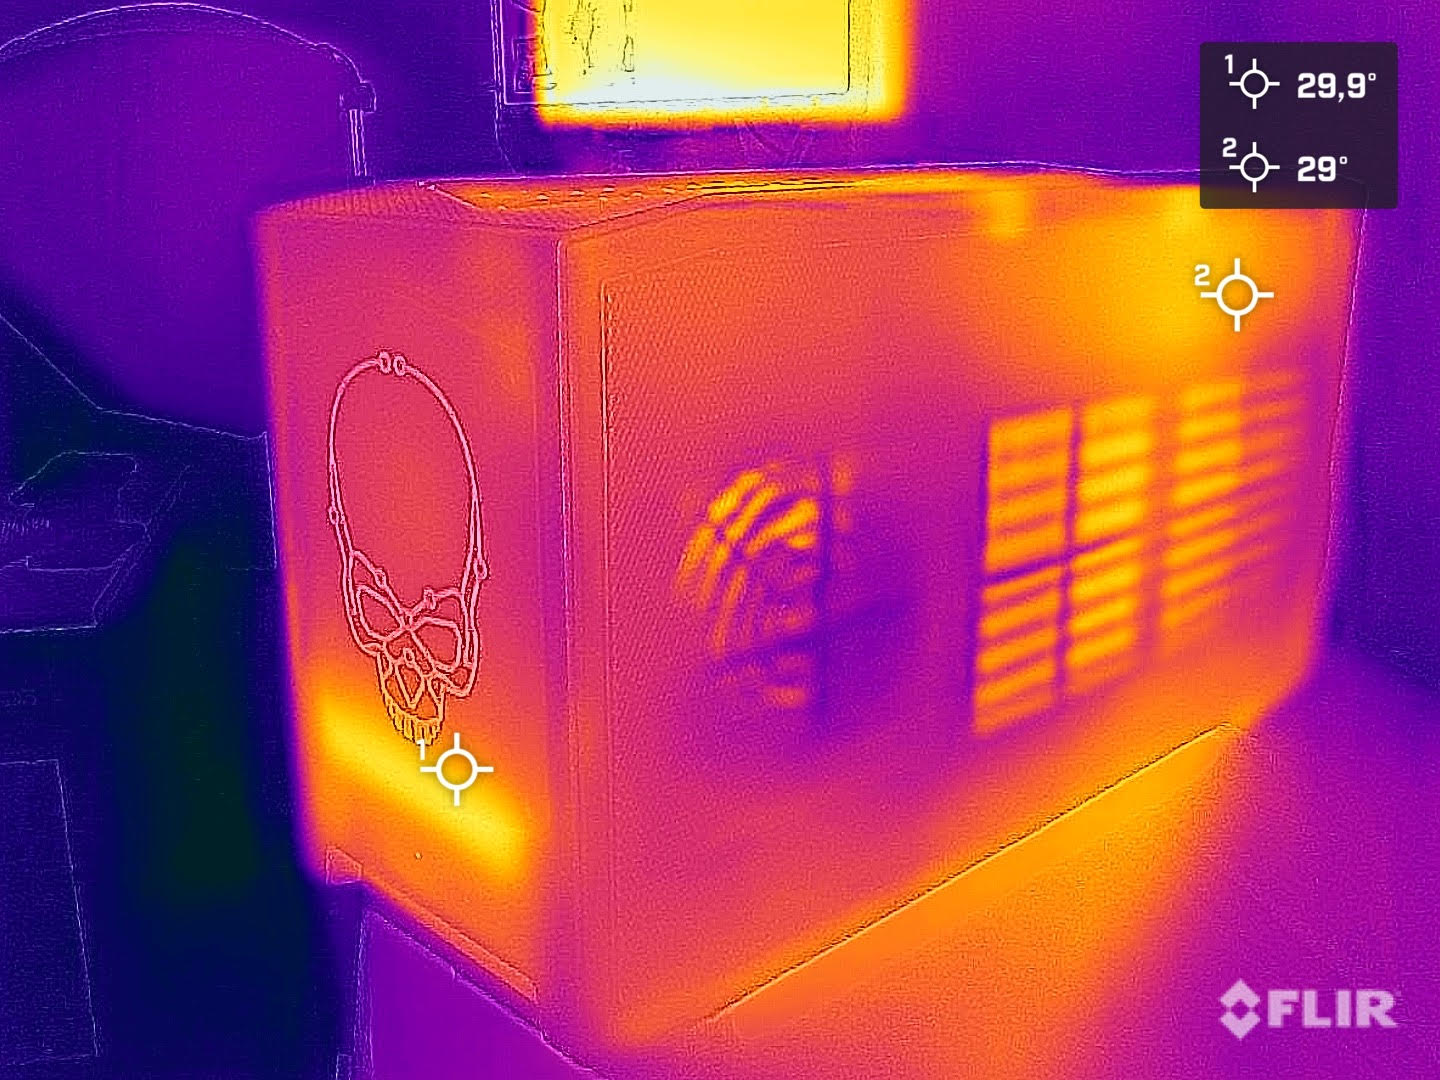
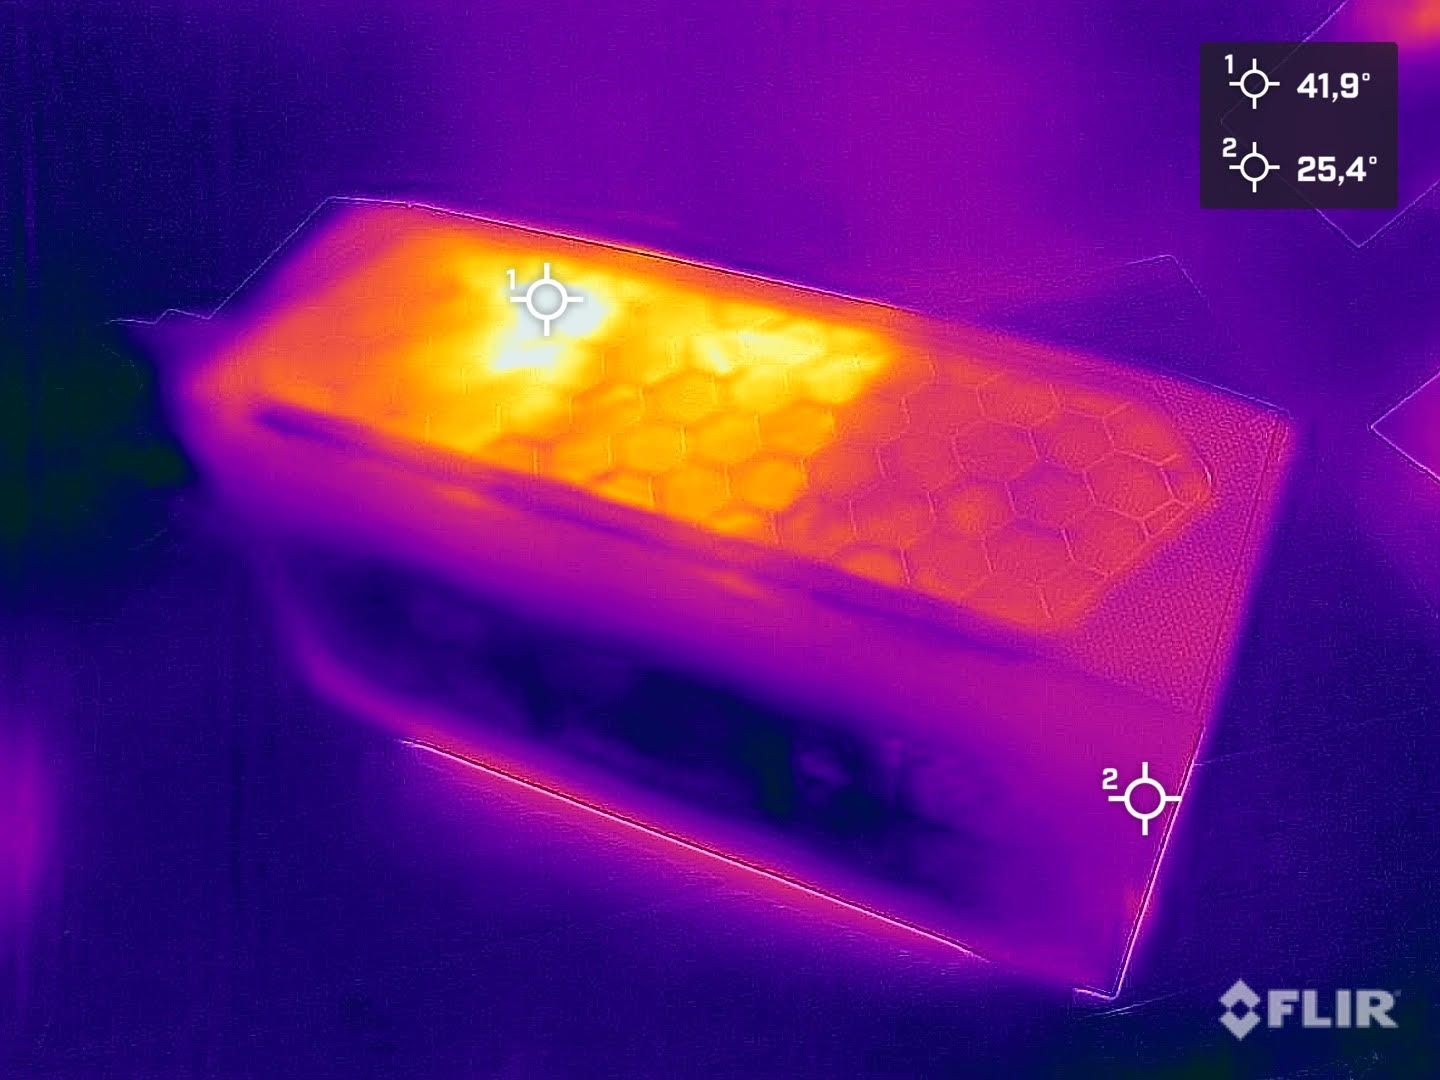
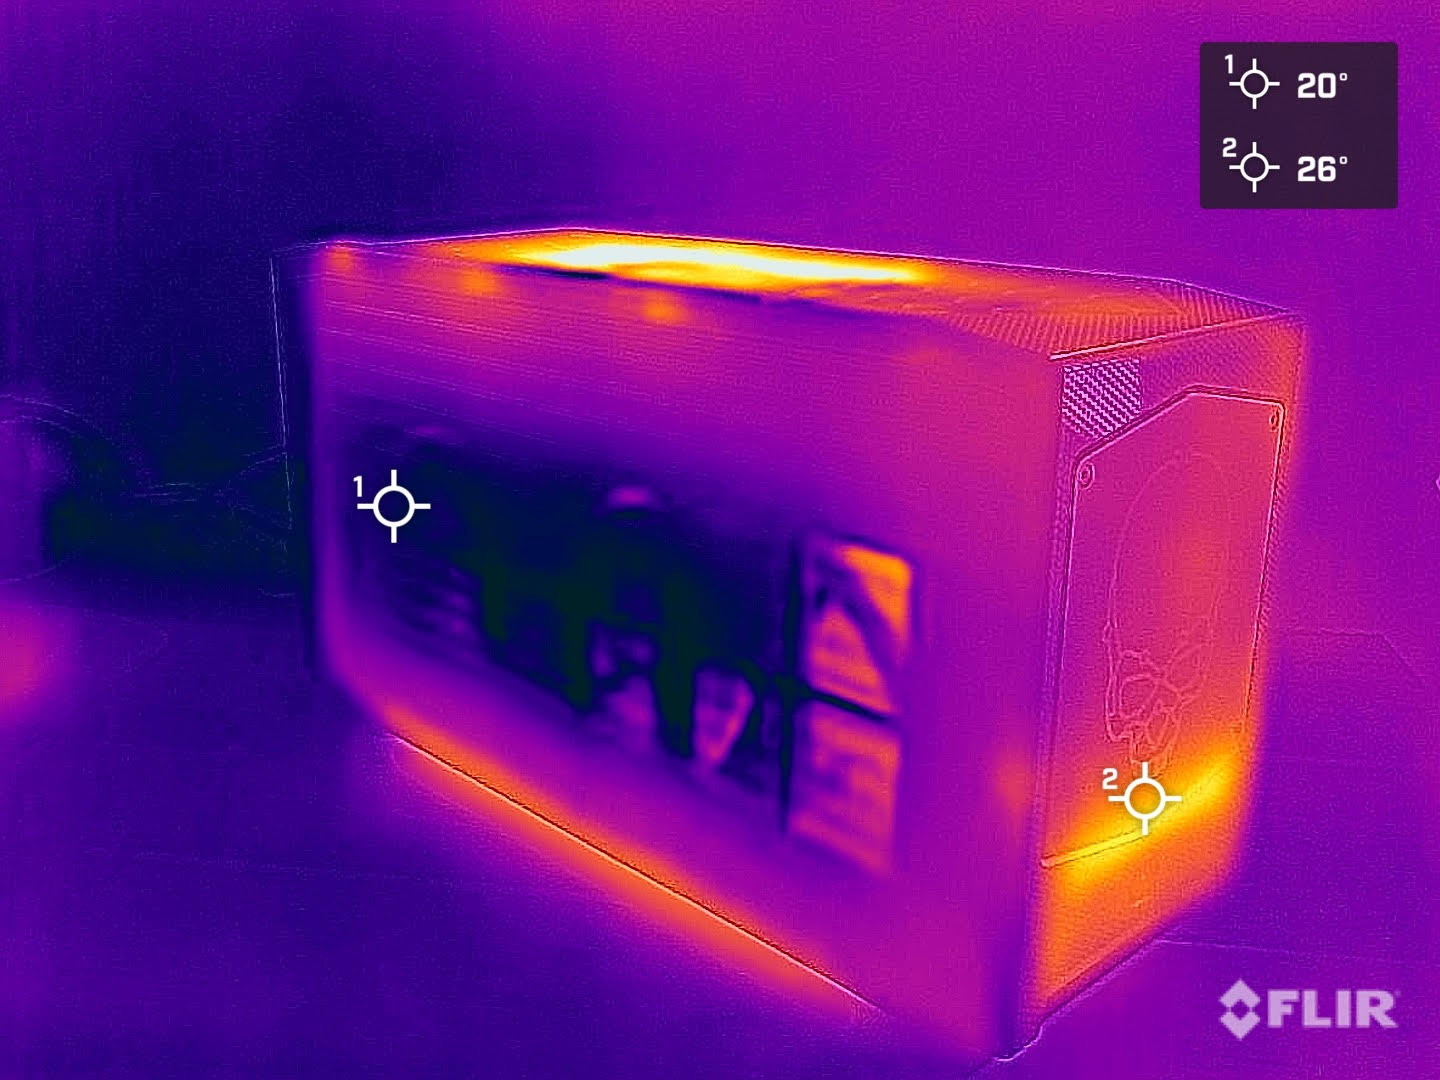
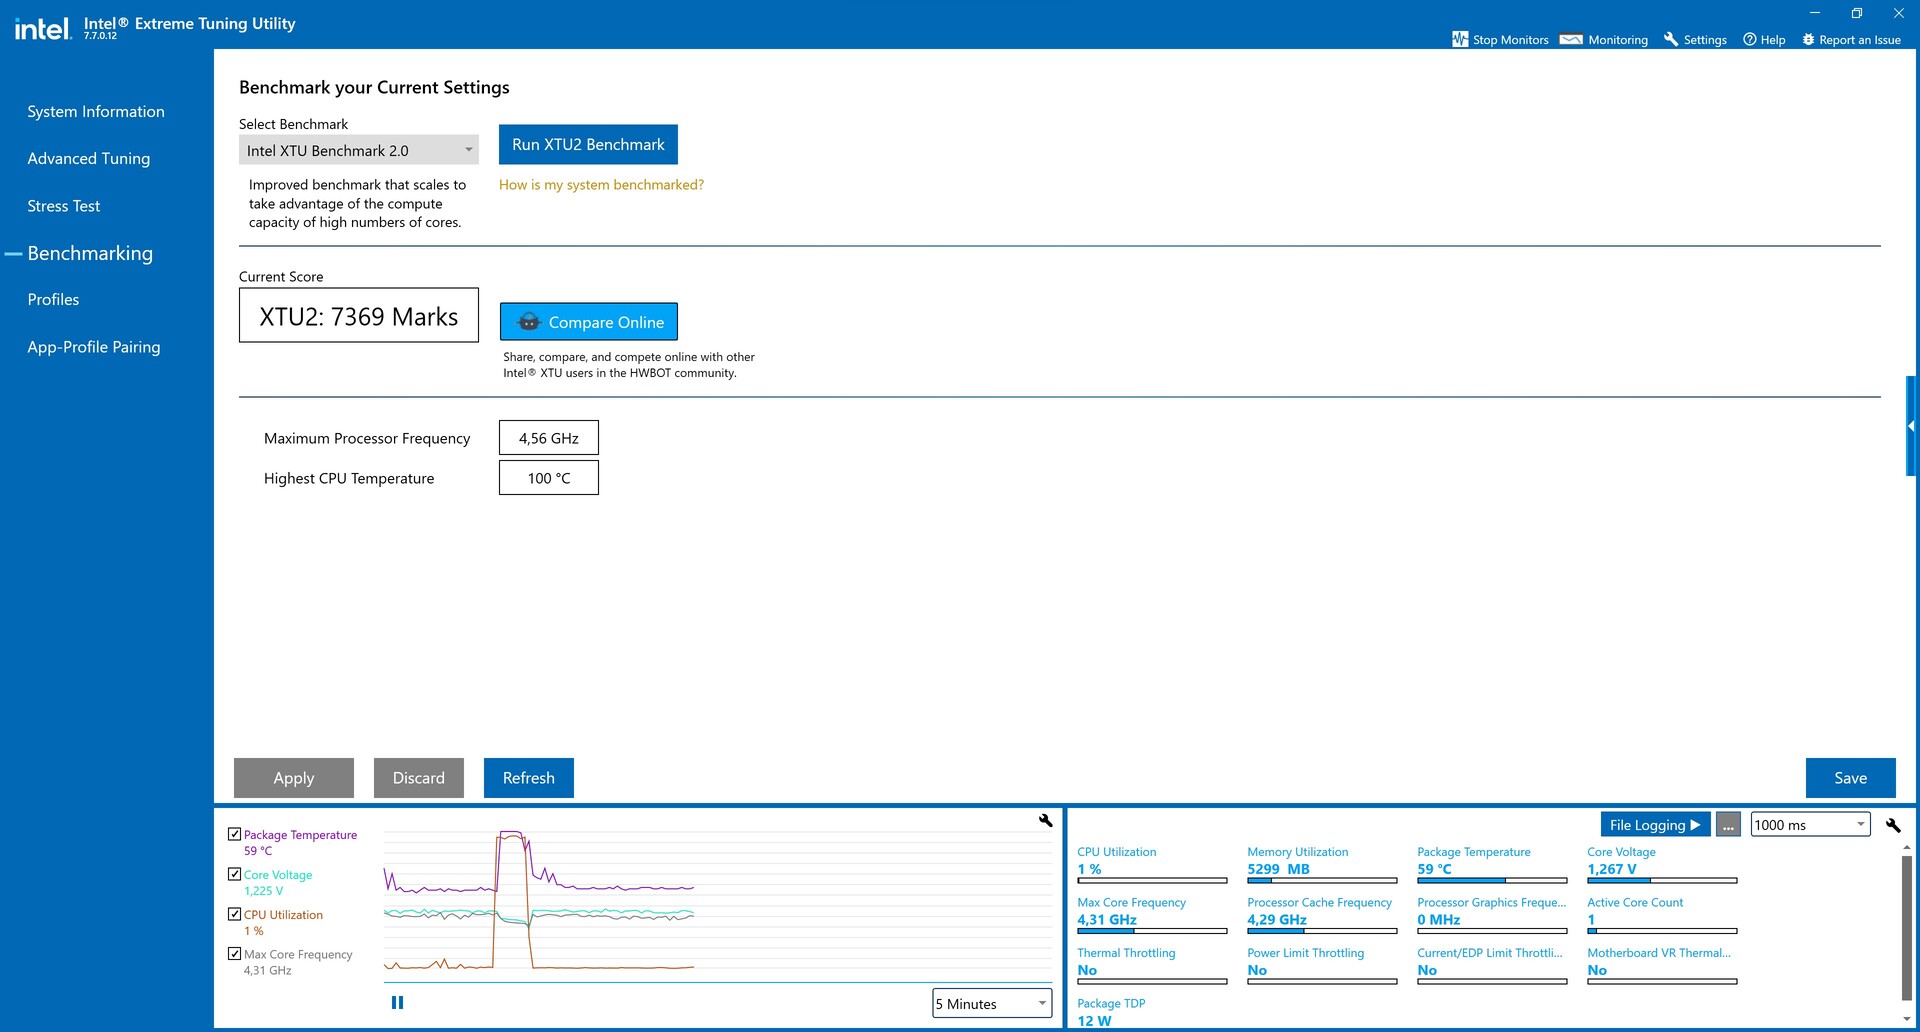
I Intel NUC 12 Extreme Kit ger Intel Core i9-12900 en betydligt högre strömförbrukning jämfört med Intel NUC 11 Extreme Kit. På grund av den högre TDP för Intel Core i9-12900 jämfört med Intel Core i9-12900 Intel Core i9-11900KBvar detta redan väntat. I jämförelse med de två andra Alder Lake-systemen som vi också listat här, visar sig dock strömförbrukningen för Intel Dragon Canyon NUC vara betydligt lägre. Orsaken till detta kan lätt hittas, eftersom den relativt lilla kylaggregaten snabbt når sina gränser med Intel Core i9-12900 under belastning, så att processorns prestanda måste strypas. Under belastning nåstemperaturgränsen på 100 °C (212°F) nästan alltid snabbt. I stresstestet med Prime95 nås temperaturgränsen redan efter några sekunder. Intel Core i9-12900 körs dock fortfarande med nästan 2,6 GHz i genomsnitt, vilket fortfarande är något mer än den grundläggande klockfrekvensen (2,4 GHz). Vi bör också nämna att temperaturgränsen endast nås mycket kortvarigt. Över hela testet ligger medeltemperaturen på 78°C, vilket är ett rimligt värde överlag. Vi ser också en liknande bild vid samtidig belastning av CPU och GPU

Den kompakta byggnaden medför en stor nackdel. Intel Beast Canyon NUC kunde redan under belastning höras tydligt. Intel gör ett något bättre jobb med Dragon Canyon NUC, även om även den fortfarande är tydligt hörbar med 45,1 dB(A) under full belastning. Men under tomgångsdrift eller under låg belastning förblir systemet tyst för det mesta. Vi hör bara fläktarnas varv från tid till annan, men på grund av den låga frekvensen är fläktljudet relativt behagligt.

Ljudnivå

Låg belastning
30.2 / 30.4 / 30.8 dB(A)
Hög belastning
/ 45.1 dB(A)
  red to green bar
 
 
30 dB
tyst
40 dB(A)
hörbar
50 dB(A)
högt ljud
 
min: dark, med: mid, max: light   Earthworks M23R, Arta (15 cm avstånd)   environment noise: 30.2 dB(A)
Power Consumption
1920x1080 The Witcher 3 ultra (external Monitor)
Intel Core i9-12900K
NVIDIA Titan RTX, i9-12900K, Intel Optane 905P 480GB 2.5 (Idle: 70.5 W)
463 (439min - 490max) Watt * -68%
AMD Ryzen 9 3950X
NVIDIA Titan RTX, R9 3950X, Intel Optane 905P 480GB 2.5 (Idle: 95 W)
423.6 (400min - 442max) Watt * -54%
Intel Core i7-12700K
NVIDIA Titan RTX, i7-12700K, Intel Optane 905P 480GB 2.5 (Idle: 81 W)
419.7 (402min - 454max) Watt * -53%
Intel Core i9-10900K
NVIDIA Titan RTX, i9-10900K, WDC PC SN720 SDAQNTW-512G (Idle: 52.3 W)
396.2 (380min - 475max) Watt * -44%
Intel Core i5-10600K
NVIDIA Titan RTX, i5-10600K (Idle: 52.2 W)
386.9 (380min - 404max) Watt * -41%
Corsair One i160
GeForce RTX 2080 Ti (Desktop), i9-9900K, Samsung PM961 NVMe MZVLW512HMJP (Idle: 51.5 W)
359 (348min - 374max) Watt * -31%
Intel Dragon Canyon NUC - RTX 3060
NVIDIA GeForce RTX 3060, i9-12900, Transcend M.2 SSD 2200S TS512GMTE220S
275 (270min, 270P1 - 306max) Watt *
Intel Ghost Canyon NUC (RTX 2070)
GeForce RTX 2070 (Desktop), i9-9980HK, Kingston KC2500 1 TB SKC2500M81000G (Idle: 33.1 W)
237.1 (227min - 263max) Watt * +14%
Intel Beast Canyon NUC
NVIDIA GeForce RTX 3060, i9-11900KB, Sabrent Rocket 4.0 500GB (Idle: 32 W)
229.9 (219min - 254max) Watt * +16%
Prime95 V2810 Stress (external Monitor)
Intel Core i7-12700K
NVIDIA Titan RTX, i7-12700K, Intel Optane 905P 480GB 2.5 (Idle: 81 W)
281 (250min - 366max) Watt * -86%
Intel Core i9-12900K
NVIDIA Titan RTX, i9-12900K, Intel Optane 905P 480GB 2.5 (Idle: 70.5 W)
279.6 (261min - 357max) Watt * -85%
Intel Core i9-10900K
NVIDIA Titan RTX, i9-10900K, WDC PC SN720 SDAQNTW-512G (Idle: 52.3 W)
275.7 (254min - 385max) Watt * -83%
Intel Core i5-10600K
NVIDIA Titan RTX, i5-10600K (Idle: 52.2 W)
204.4 (191min - 261max) Watt * -35%
AMD Ryzen 9 3950X
NVIDIA Titan RTX, R9 3950X, Intel Optane 905P 480GB 2.5 (Idle: 95 W)
198.8 (185min - 240max) Watt * -32%
Intel Dragon Canyon NUC - RTX 3060
NVIDIA GeForce RTX 3060, i9-12900, Transcend M.2 SSD 2200S TS512GMTE220S
151 (143min, 144P1 - 326max) Watt *
Intel Beast Canyon NUC
NVIDIA GeForce RTX 3060, i9-11900KB, Sabrent Rocket 4.0 500GB (Idle: 34 W)
112.9 (108min - 135max) Watt * +25%
Intel Ghost Canyon NUC (RTX 2070)
GeForce RTX 2070 (Desktop), i9-9980HK, Kingston KC2500 1 TB SKC2500M81000G (Idle: 33.1 W)
109.4 (107min - 151max) Watt * +28%
Cinebench R15 Multi (external Monitor)
Intel Core i9-12900K
NVIDIA Titan RTX, i9-12900K, Intel Optane 905P 480GB 2.5 (Idle: 70.5 W)
324.4 Watt * -57%
Intel Core i7-12700K
NVIDIA Titan RTX, i7-12700K, Intel Optane 905P 480GB 2.5 (Idle: 81 W)
278.2 (151min - 298max) Watt * -35%
Intel Core i9-10900K
NVIDIA Titan RTX, i9-10900K, WDC PC SN720 SDAQNTW-512G (Idle: 52.3 W)
268.5 (265min - 270max) Watt * -30%
AMD Ryzen 9 3950X
NVIDIA Titan RTX, R9 3950X, Intel Optane 905P 480GB 2.5 (Idle: 95 W)
219.5 (218min - 225max) Watt * -7%
Intel Dragon Canyon NUC - RTX 3060
NVIDIA GeForce RTX 3060, i9-12900, Transcend M.2 SSD 2200S TS512GMTE220S
206 (140min, 145P1 - 261max) Watt *
Intel Core i5-10600K
NVIDIA Titan RTX, i5-10600K (Idle: 52.2 W)
172.5 (170min - 176max) Watt * +16%
Intel Beast Canyon NUC
NVIDIA GeForce RTX 3060, i9-11900KB, Sabrent Rocket 4.0 500GB (Idle: 32 W)
123.9 (73min - 147max) Watt * +40%
Temperatures - CPU Temperature Prime95
Intel Dragon Canyon NUC - RTX 3060
NVIDIA GeForce RTX 3060, i9-12900, Transcend M.2 SSD 2200S TS512GMTE220S
100 °C
Intel Core i9-10900K
NVIDIA Titan RTX, i9-10900K, WDC PC SN720 SDAQNTW-512G
88 °C -12%
AMD Ryzen 9 3950X
NVIDIA Titan RTX, R9 3950X, Intel Optane 905P 480GB 2.5
83.8 °C -16%
Intel Core i5-10600K
NVIDIA Titan RTX, i5-10600K
70 °C -30%

* ... smaller is better

Intel NUC 12 Extreme Kit Dragon Canyon - strömförbrukning i vila
Intel NUC 12 Extreme Kit Dragon Canyon - strömförbrukning Prime95
Intel NUC 12 Extreme Kit Dragon Canyon - strömförbrukning FurMark
Intel NUC 12 Extreme Kit Dragon Canyon - strömförbrukning Prime95 och FurMark
Intel NUC 12 Extreme Kit Dragon Canyon - strömförbrukning Cinebench R15 nT
Intel NUC 12 Extreme Kit Dragon Canyon - strömförbrukning Witcher 3 (Ultra förinställd)
Intel NUC 12 Extreme Kit Dragon Canyon - Stresstest Prime95 solo
Intel NUC 12 Extreme Kit Dragon Canyon - Stresstest FurMark solo
Intel NUC 12 Extreme Kit Dragon Canyon - Stresstest Prime95 och FurMark

För

+ robust och kompakt hölje
+ Core i9 med 16 kärnor och 24 trådar
+ socklad processor
+ hög systemprestanda
+ 650 W nätaggregat med SFX-formfaktor
+ många anslutningsalternativ
+ 2x Thunderbolt 4
+ UHS-II SD-kortläsare
+ Wi-Fi 6E
+ 10Gbe LAN

Emot

- klart hörbar under belastning
- kylenheten når snabbt sina gränser
- begränsad kompatibilitet med expansionskort

Slutsats - En kompakt arbetshäst

Test av Intel Dragon Canyon NUC - NUC12DCMi9. Testapparat tillhandahållen av Intel Tyskland.

Intel NUC 12 Dragon Canyon är en liten uppgradering av Intel NUC 11 Extreme Kit alias Beast Canyon. I och med den nya Alder Lake-processorn utför Intel ett visst produktunderhåll, och pensionerar den äldre Tiger Lake -processorn. Dessutom finns det för första gången en socketed CPU i Compute Element, vilket gör det möjligt att använda olika processorer. När det gäller ren prestanda är det som Intel Core i9-12900 kan leverera något bättre än Intel Core i9-11900KB. Samtidigt erbjuder den kompakta byggnaden endast begränsat utrymme för lämplig kylning. Under belastning stöter det mycket snabbt på sina gränser med en otrappad Intel Core i9-12900, vilket upprepade gånger får den att nå temperaturgränsen.

Vid denna tidpunkt är inköpspriset för barebone-systemet 1450 euro (~1585 dollar). Om du inkluderar resten av komponenterna som RAM, SSD och GPU är Intel NUC 12 Dragon Canyon inte mycket dyrare än andra kompletta system. Detta lägger ansvaret för valet på kunden. Om du gillar designen på Intel NUC 12 Dragon Canyon kan du välja den utan några invändningar. De många olika anslutningarna gör den framtidssäker och deras antal är också tillräckligt. Det finns till och med en snabb SD-kortläsare som stöder UHS-II-standarden.

Med Intel NUC 12 Extreme Kit alias Dragon Canyon höjer Intel återigen ribban i fråga om prestanda för sina kompakta enheter.

Slutligen behöver vi fortfarande svara på den fråga vi ställde i början. Att döma enbart av utseendet skulle vi snarare betrakta Intel NUC 12 Dragon Canyon som en produkt i spelsegmentet. Tack vare prestandan hos Alder Lake-processorn och iGPU:n är systemet även lämpligt som en högklassig kontorsdator. Samtidigt har du också möjlighet att sätta in ett professionellt grafikkort, vilket förvandlar systemet till en fullfjädrad arbetsstation. Du kan då också enkelt använda den lilla Intel NUC Dragon Canyon för lite bild- och videobearbetning

Alternativet till Intel NUC 12 Extreme Kit Dragon Canyon skulle vara att bygga ett system själv, vilket förmodligen skulle kosta ungefär lika mycket. Med denZotac Magnus Onefinns det också ett bra alternativ om du vill ha en mycket kompakt speldator.

Please share our article, every link counts!
> Bärbara datorer, laptops - tester och nyheter > Tester > Recension av Intel NUC 12 Dragon Canyon med Intel Core i9-12900
Sebastian Bade, 2022-04- 6 (Update: 2022-04-11)