Minisforum BD770i recension: Mini-ITX-moderkortet med AMD Ryzen 7 7745HX som grund för små speldatorer
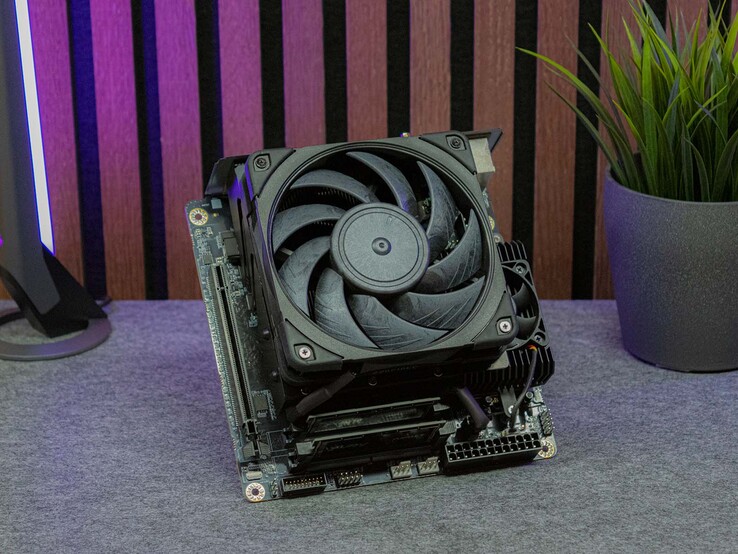
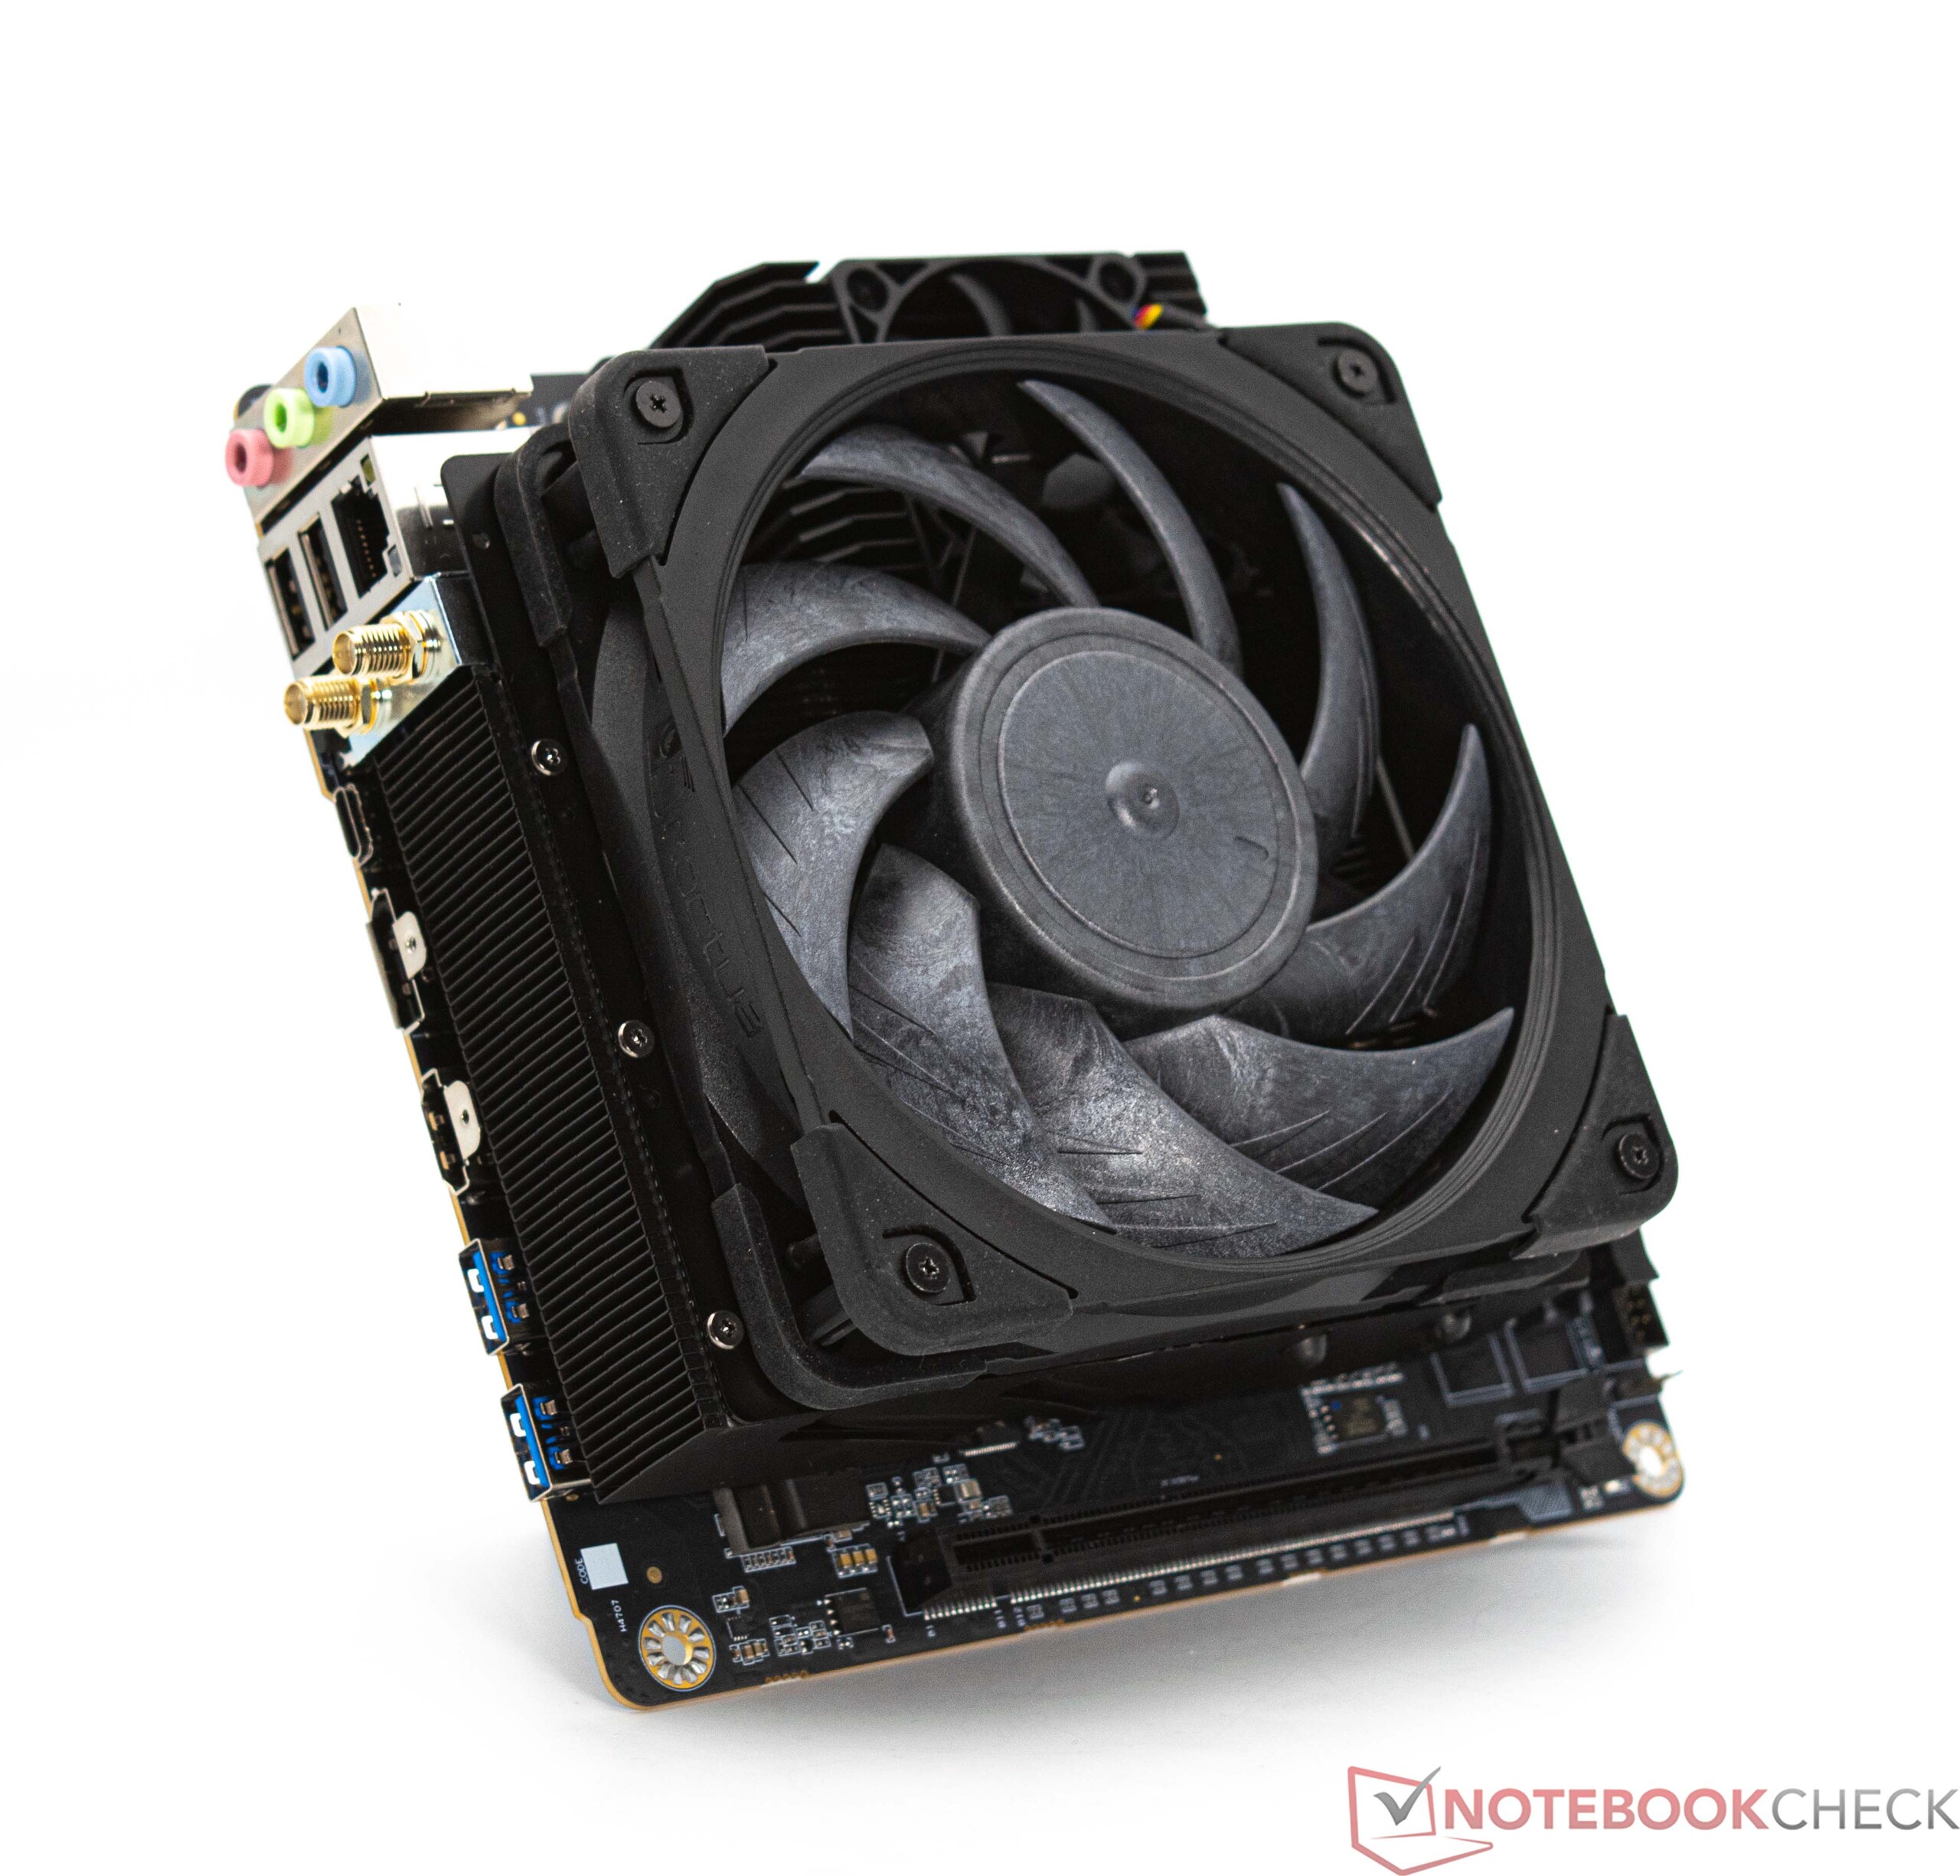
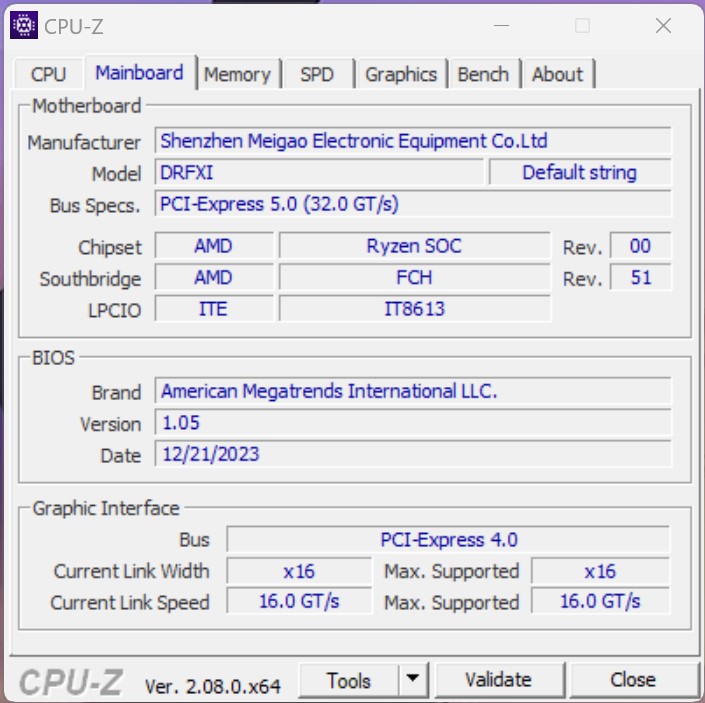
Minisforum, som är kända för sina Mini-PC, tar ett nytt steg med Minisforum BD770i genom att erbjuda ett moderkort med lödd CPU. Med ITX-standarden som formfaktor är detta moderkort kompatibelt med de flesta PC-chassin. Med tanke på dess kompakthet kommer det sannolikt att hitta applikationer i mycket små Mini-ITX-höljen.
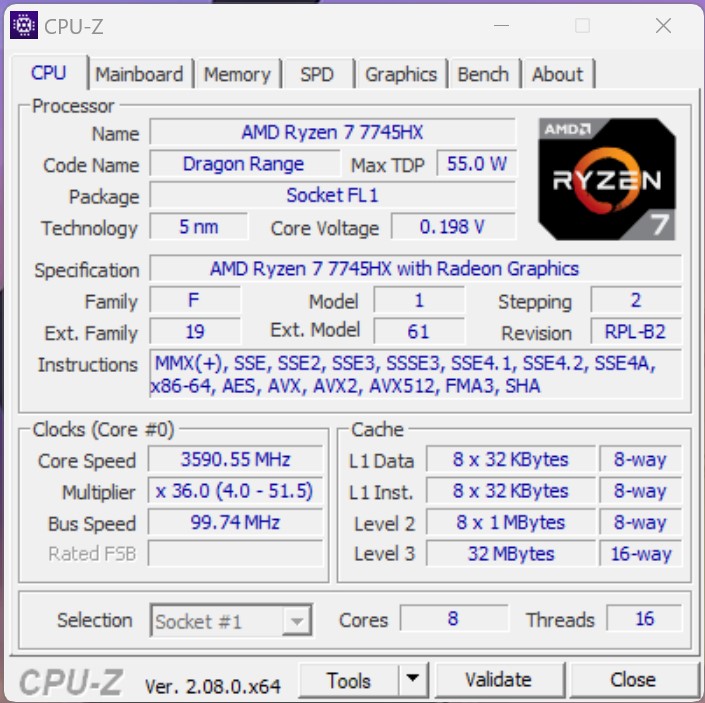
BD770i drivs av en
AMD Ryzen 7 7745HX processor med åtta Zen4-kärnor. Denna SoC förväntas leverera gott om prestanda för att hantera komplexa uppgifter. Vi undersökte spelprestandan tillsammans med en Nvidia GeForce RTX 4090eftersom grafikkortet kan arbeta med högsta prestanda tack vare den fulla PCIe x16-platsen. Minisforum erbjuder för närvarande fem olika moderkort, vart och ett utrustat med en processor från notebook-sektorn. I följande översikt har vi sammanställt information om dessa enheter och lyft fram deras viktigaste specifikationer.Minisforum-huvudpaneler i jämförelse
| Namn | BD790i | BD770i | AR900i | AR650i | AD650i |
| CPU | AMD Ryzen 9 7945HX | AMD Ryzen 7 7745HX | Intel Core i9-13900HX Processor | Intel Core i7-13650HX | Intel Core i7-13650HX Processor |
| Kärnor / trådar | 16 / 32 | 8/ 16 | 24 / 32 | 14 / 20 | 14 / 20 |
| GPU | AMD Radeon 610M | AMD Radeon 610M | Intel UHD Graphics | Intel UHD Graphics | Intel UHD Graphics |
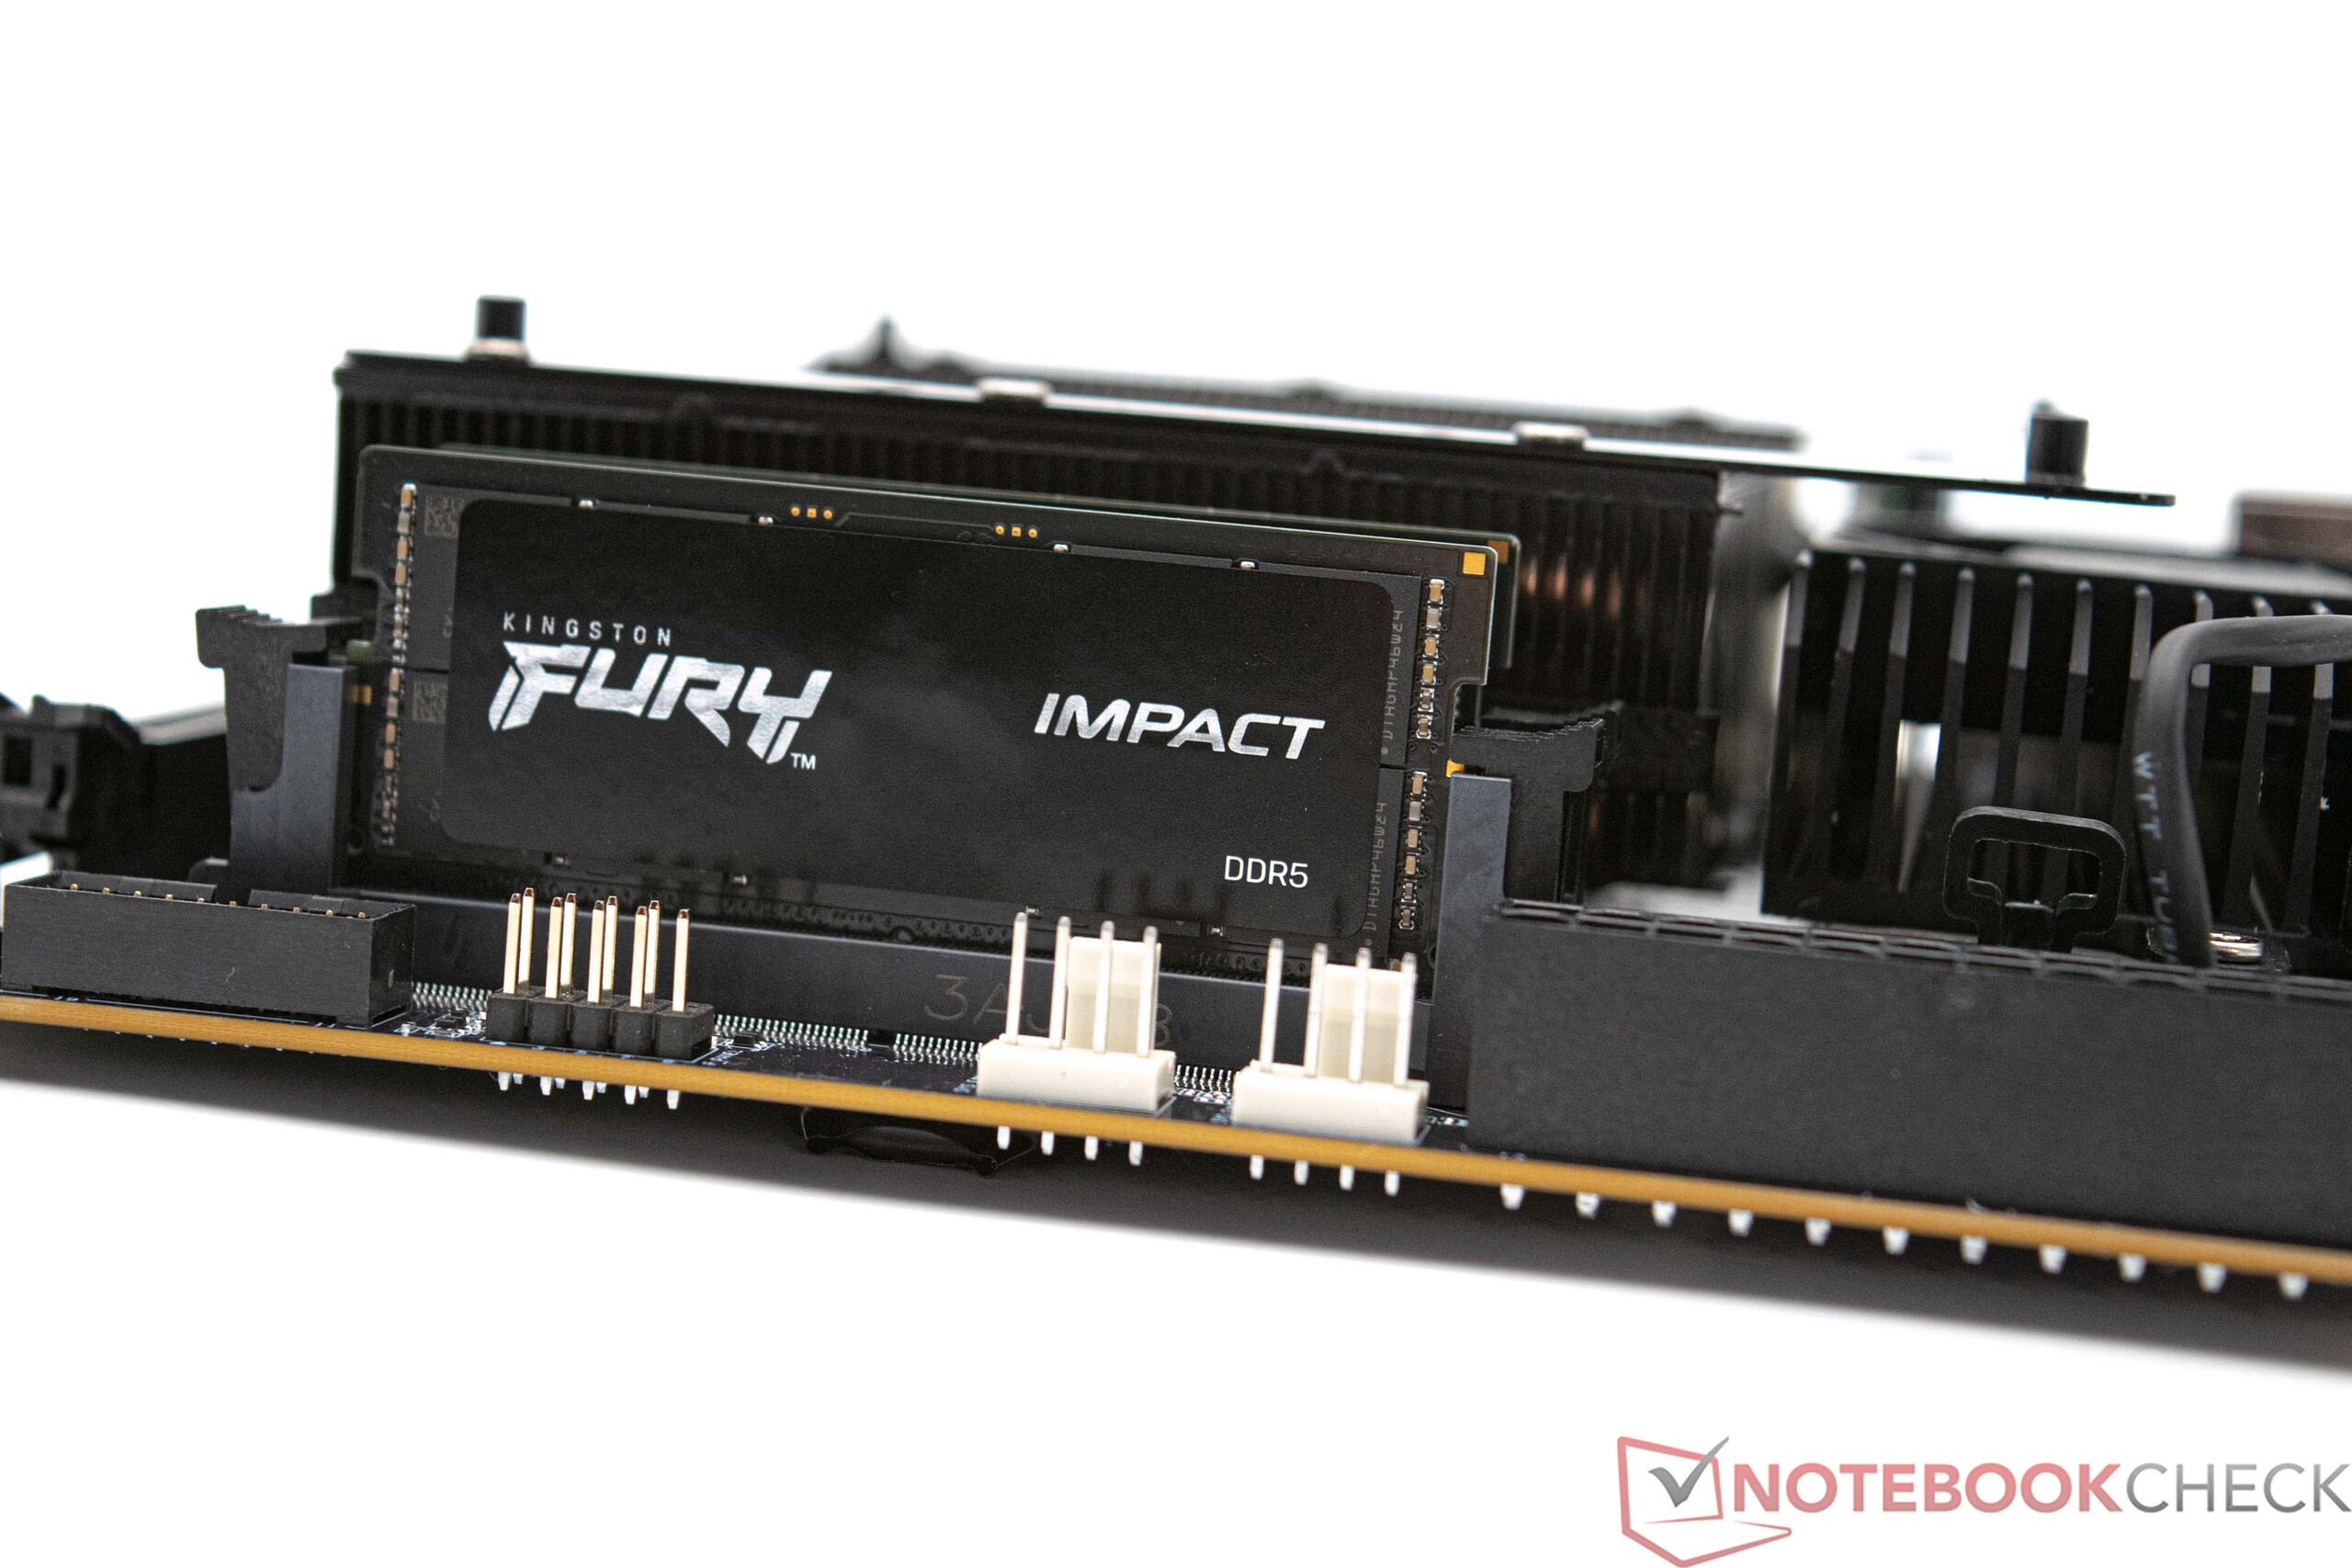
| Minnestyper | DDR5-5200 SODIMM | DDR5-5200 SODIMM | DDR5-5600 SODIMM | DDR5-5600 SODIMM | DDR5-5600 SODIMM |
| Max minnesstorlek | 96GB | 64GB | 64 GB | 64 GB | 64 GB |
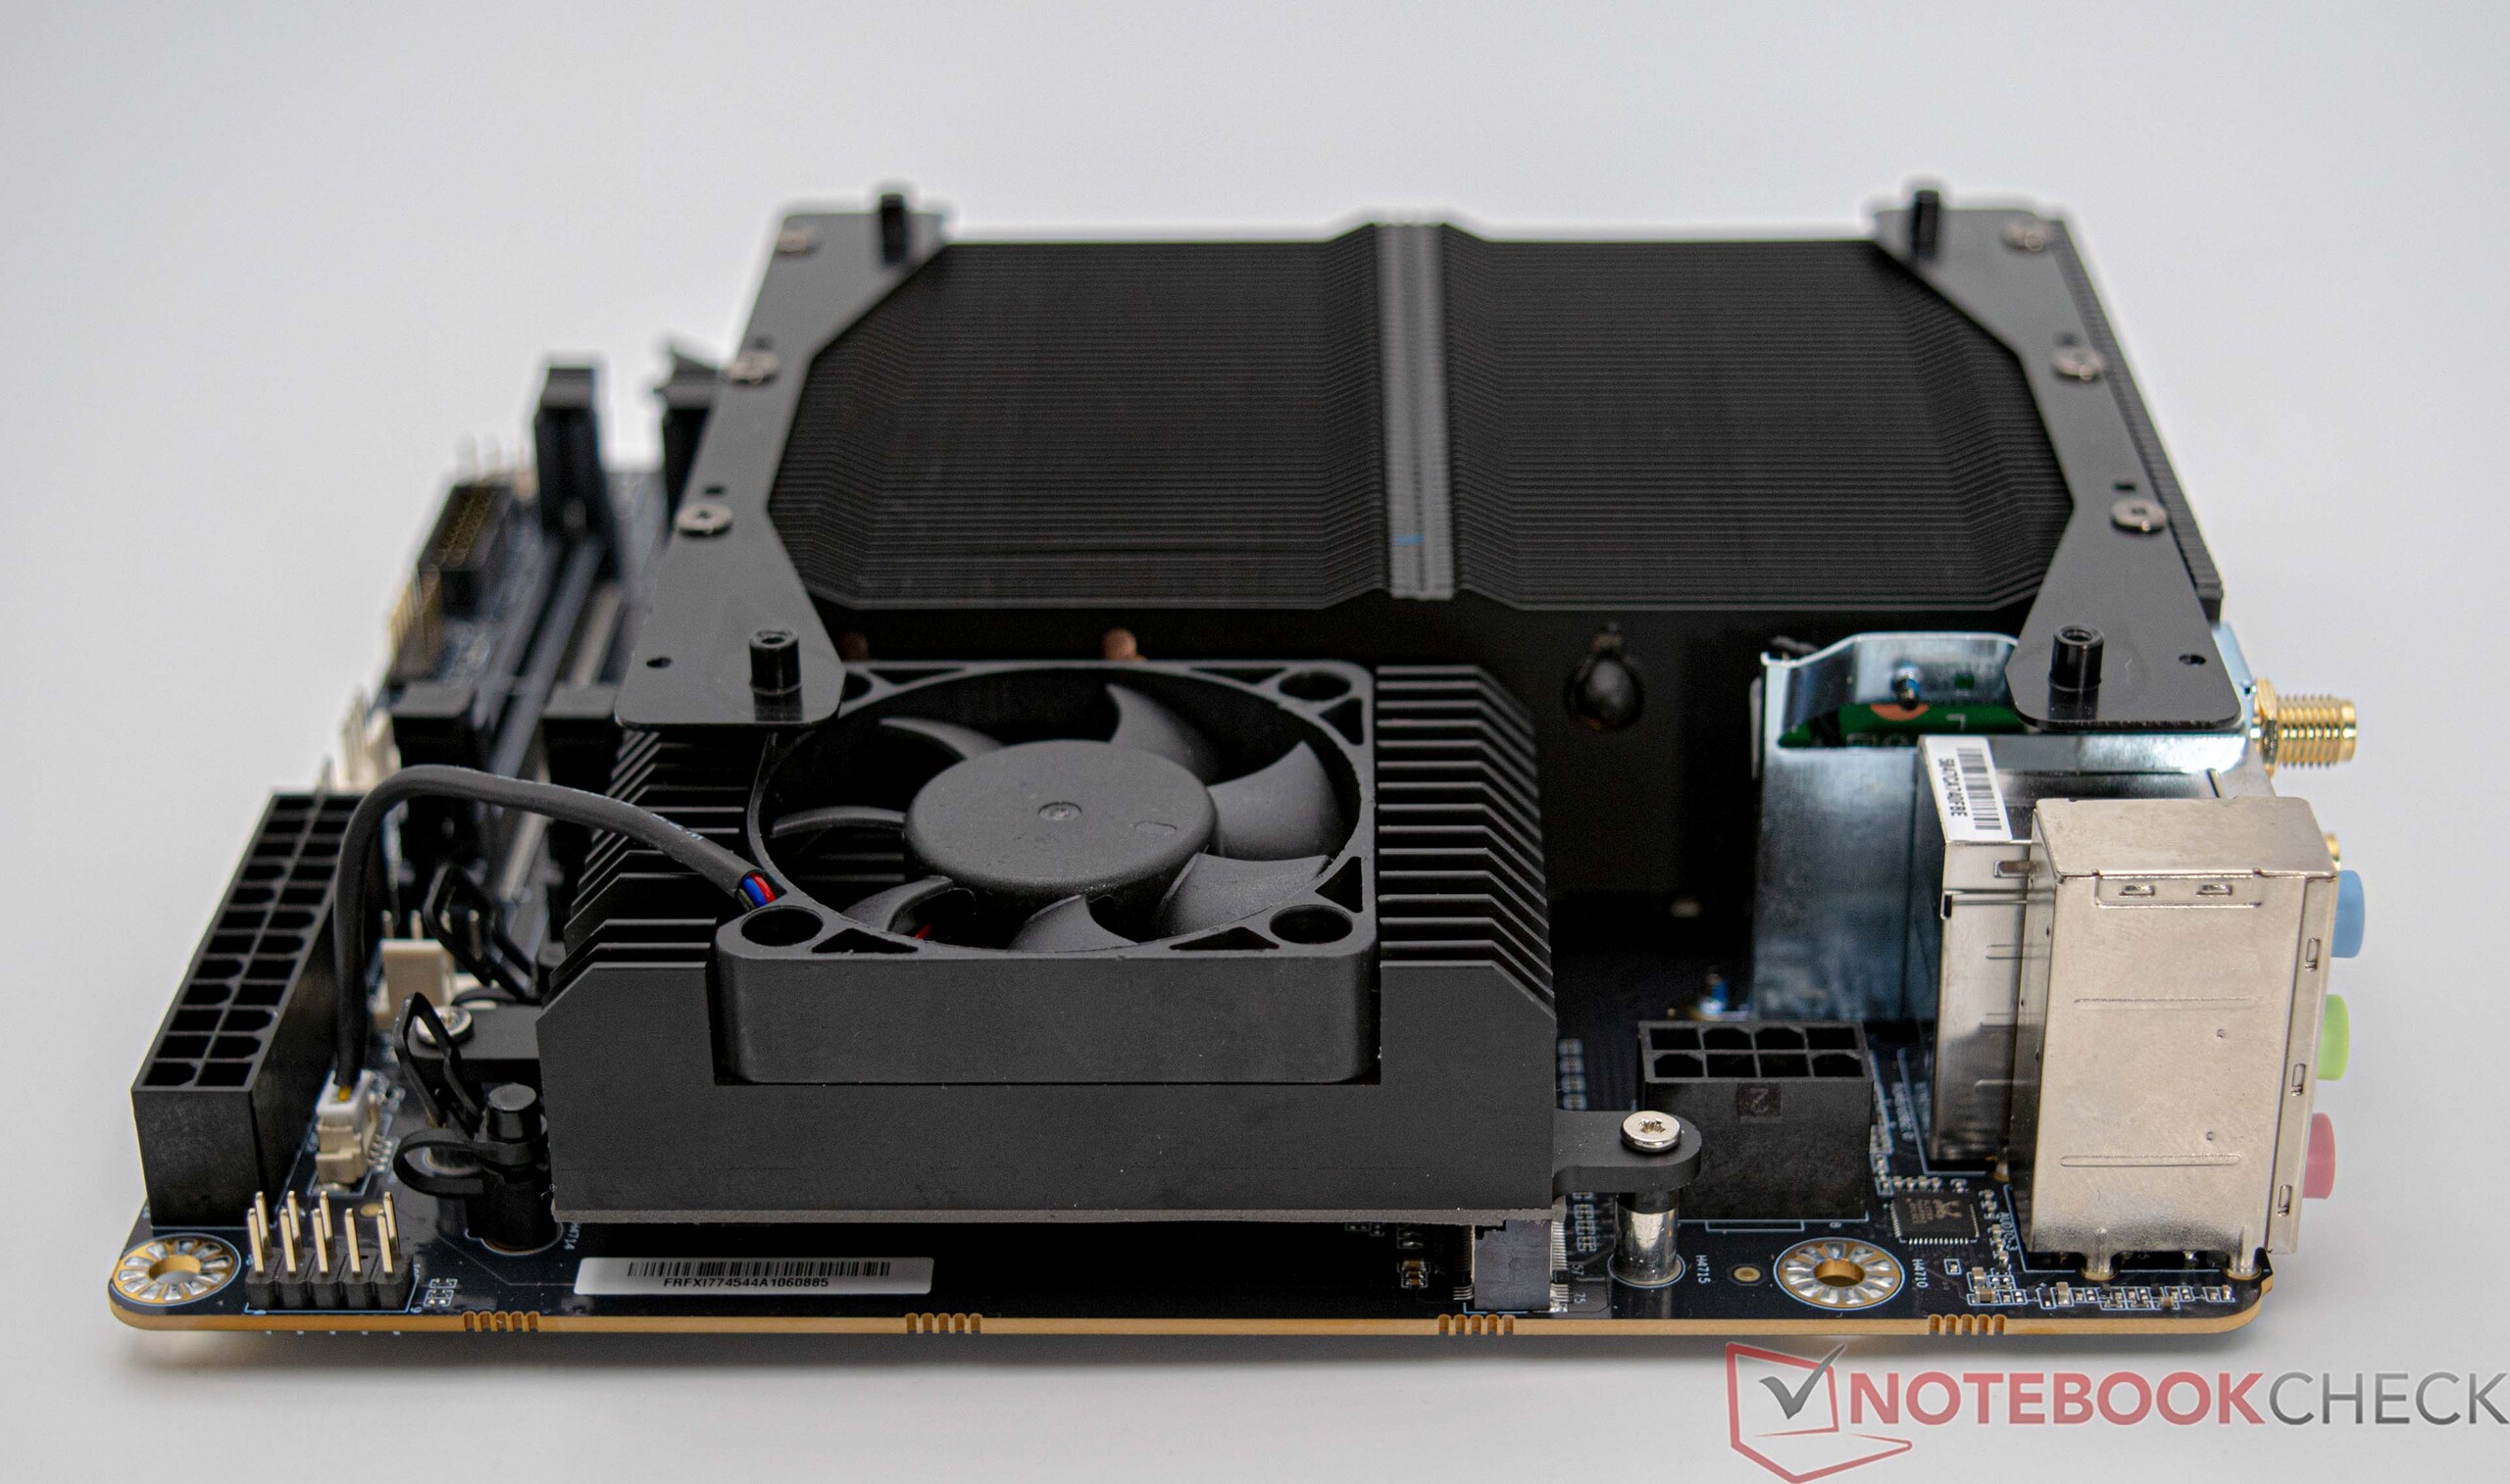
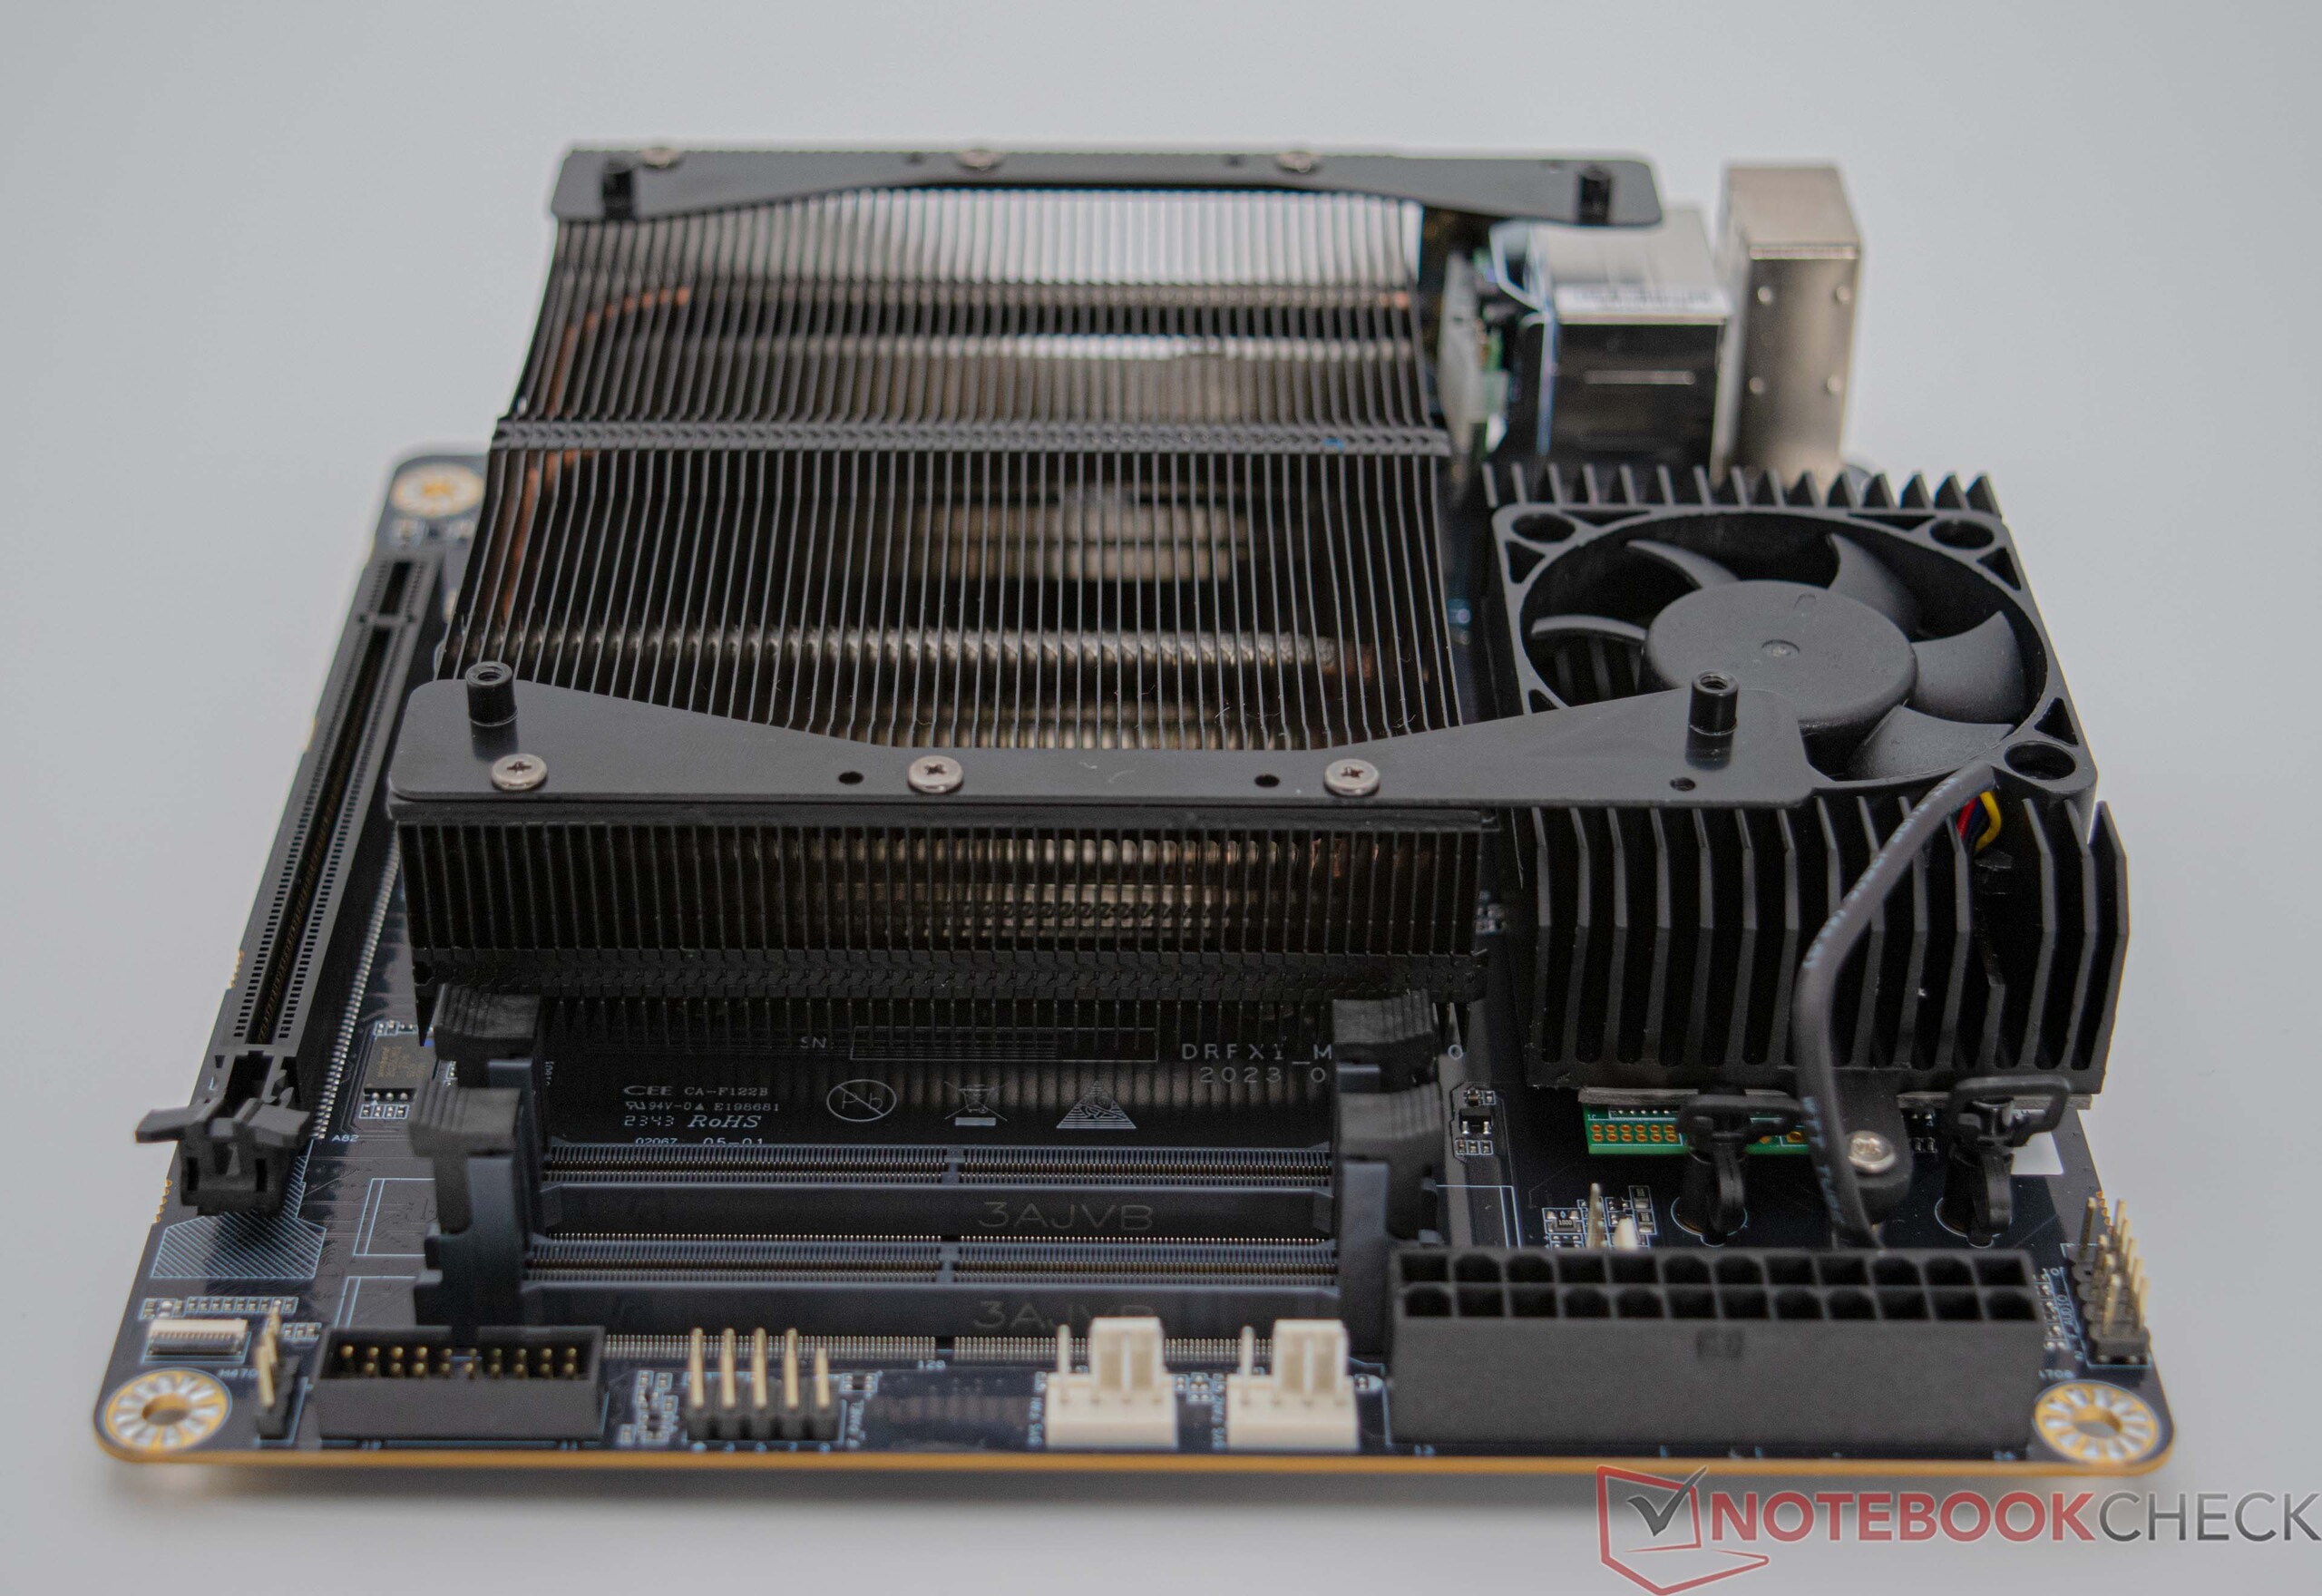
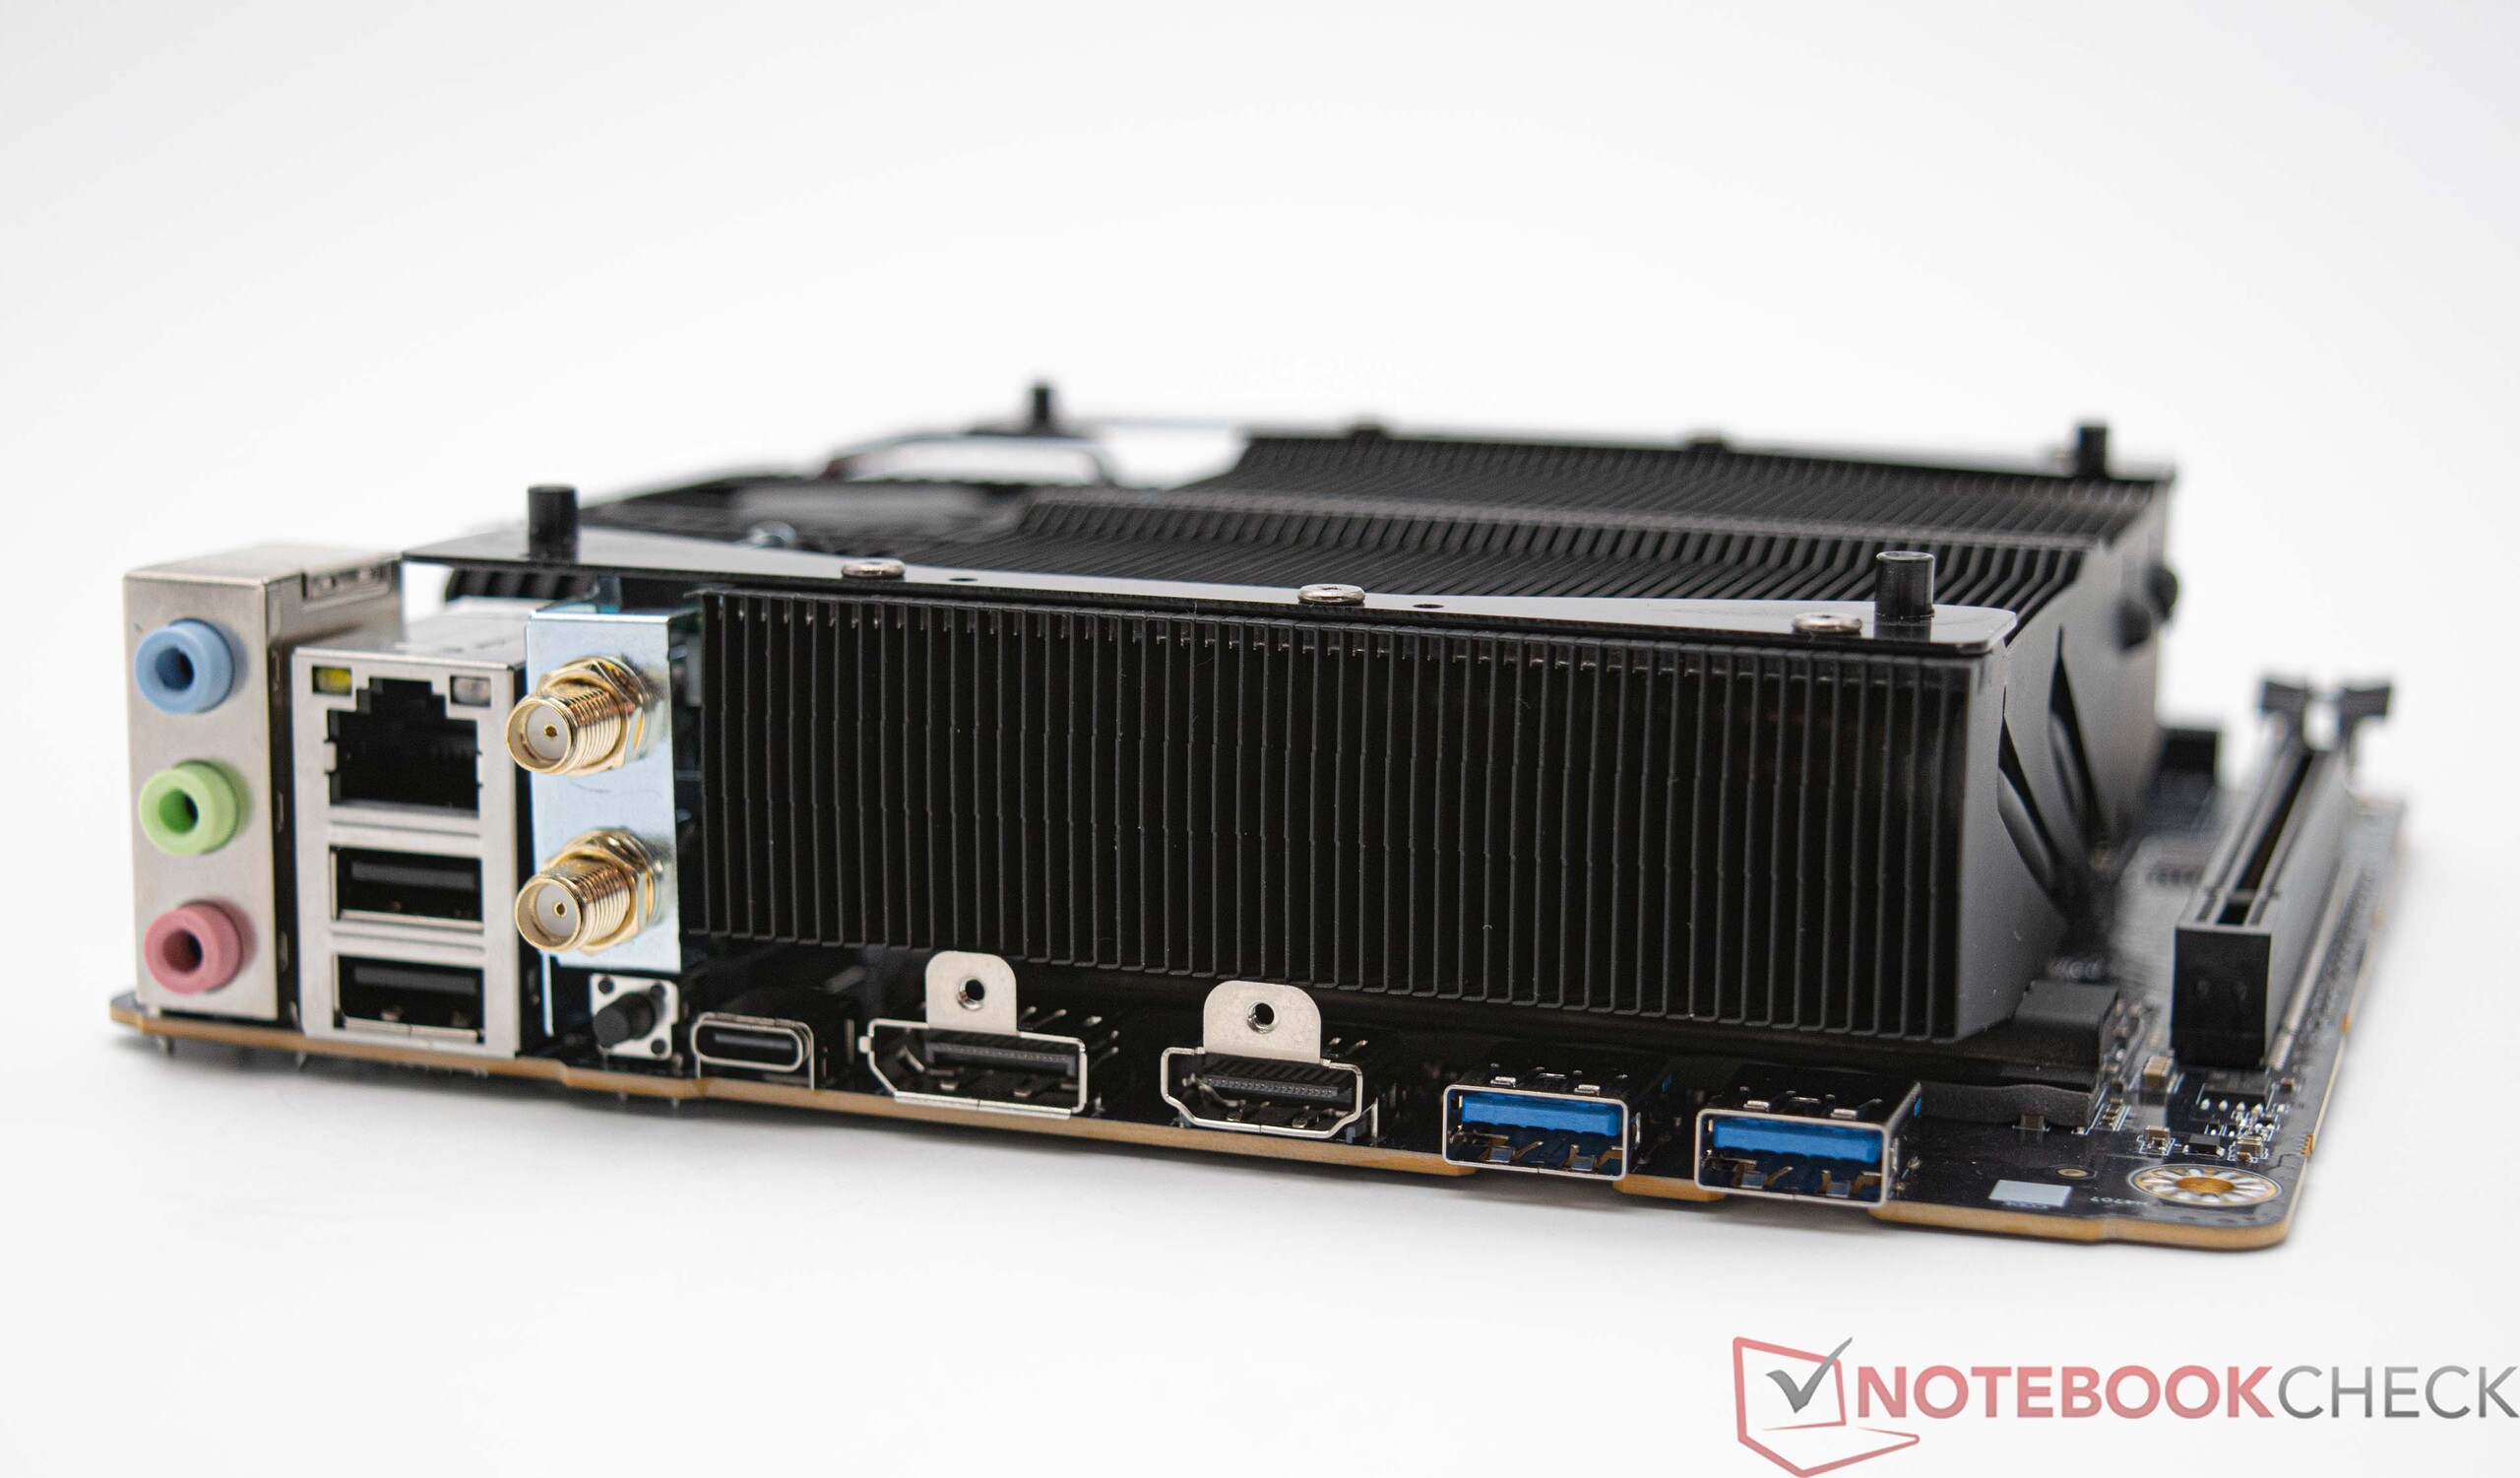
Minisforum BD770i och testsystemet i detalj


Fall och testuppställning
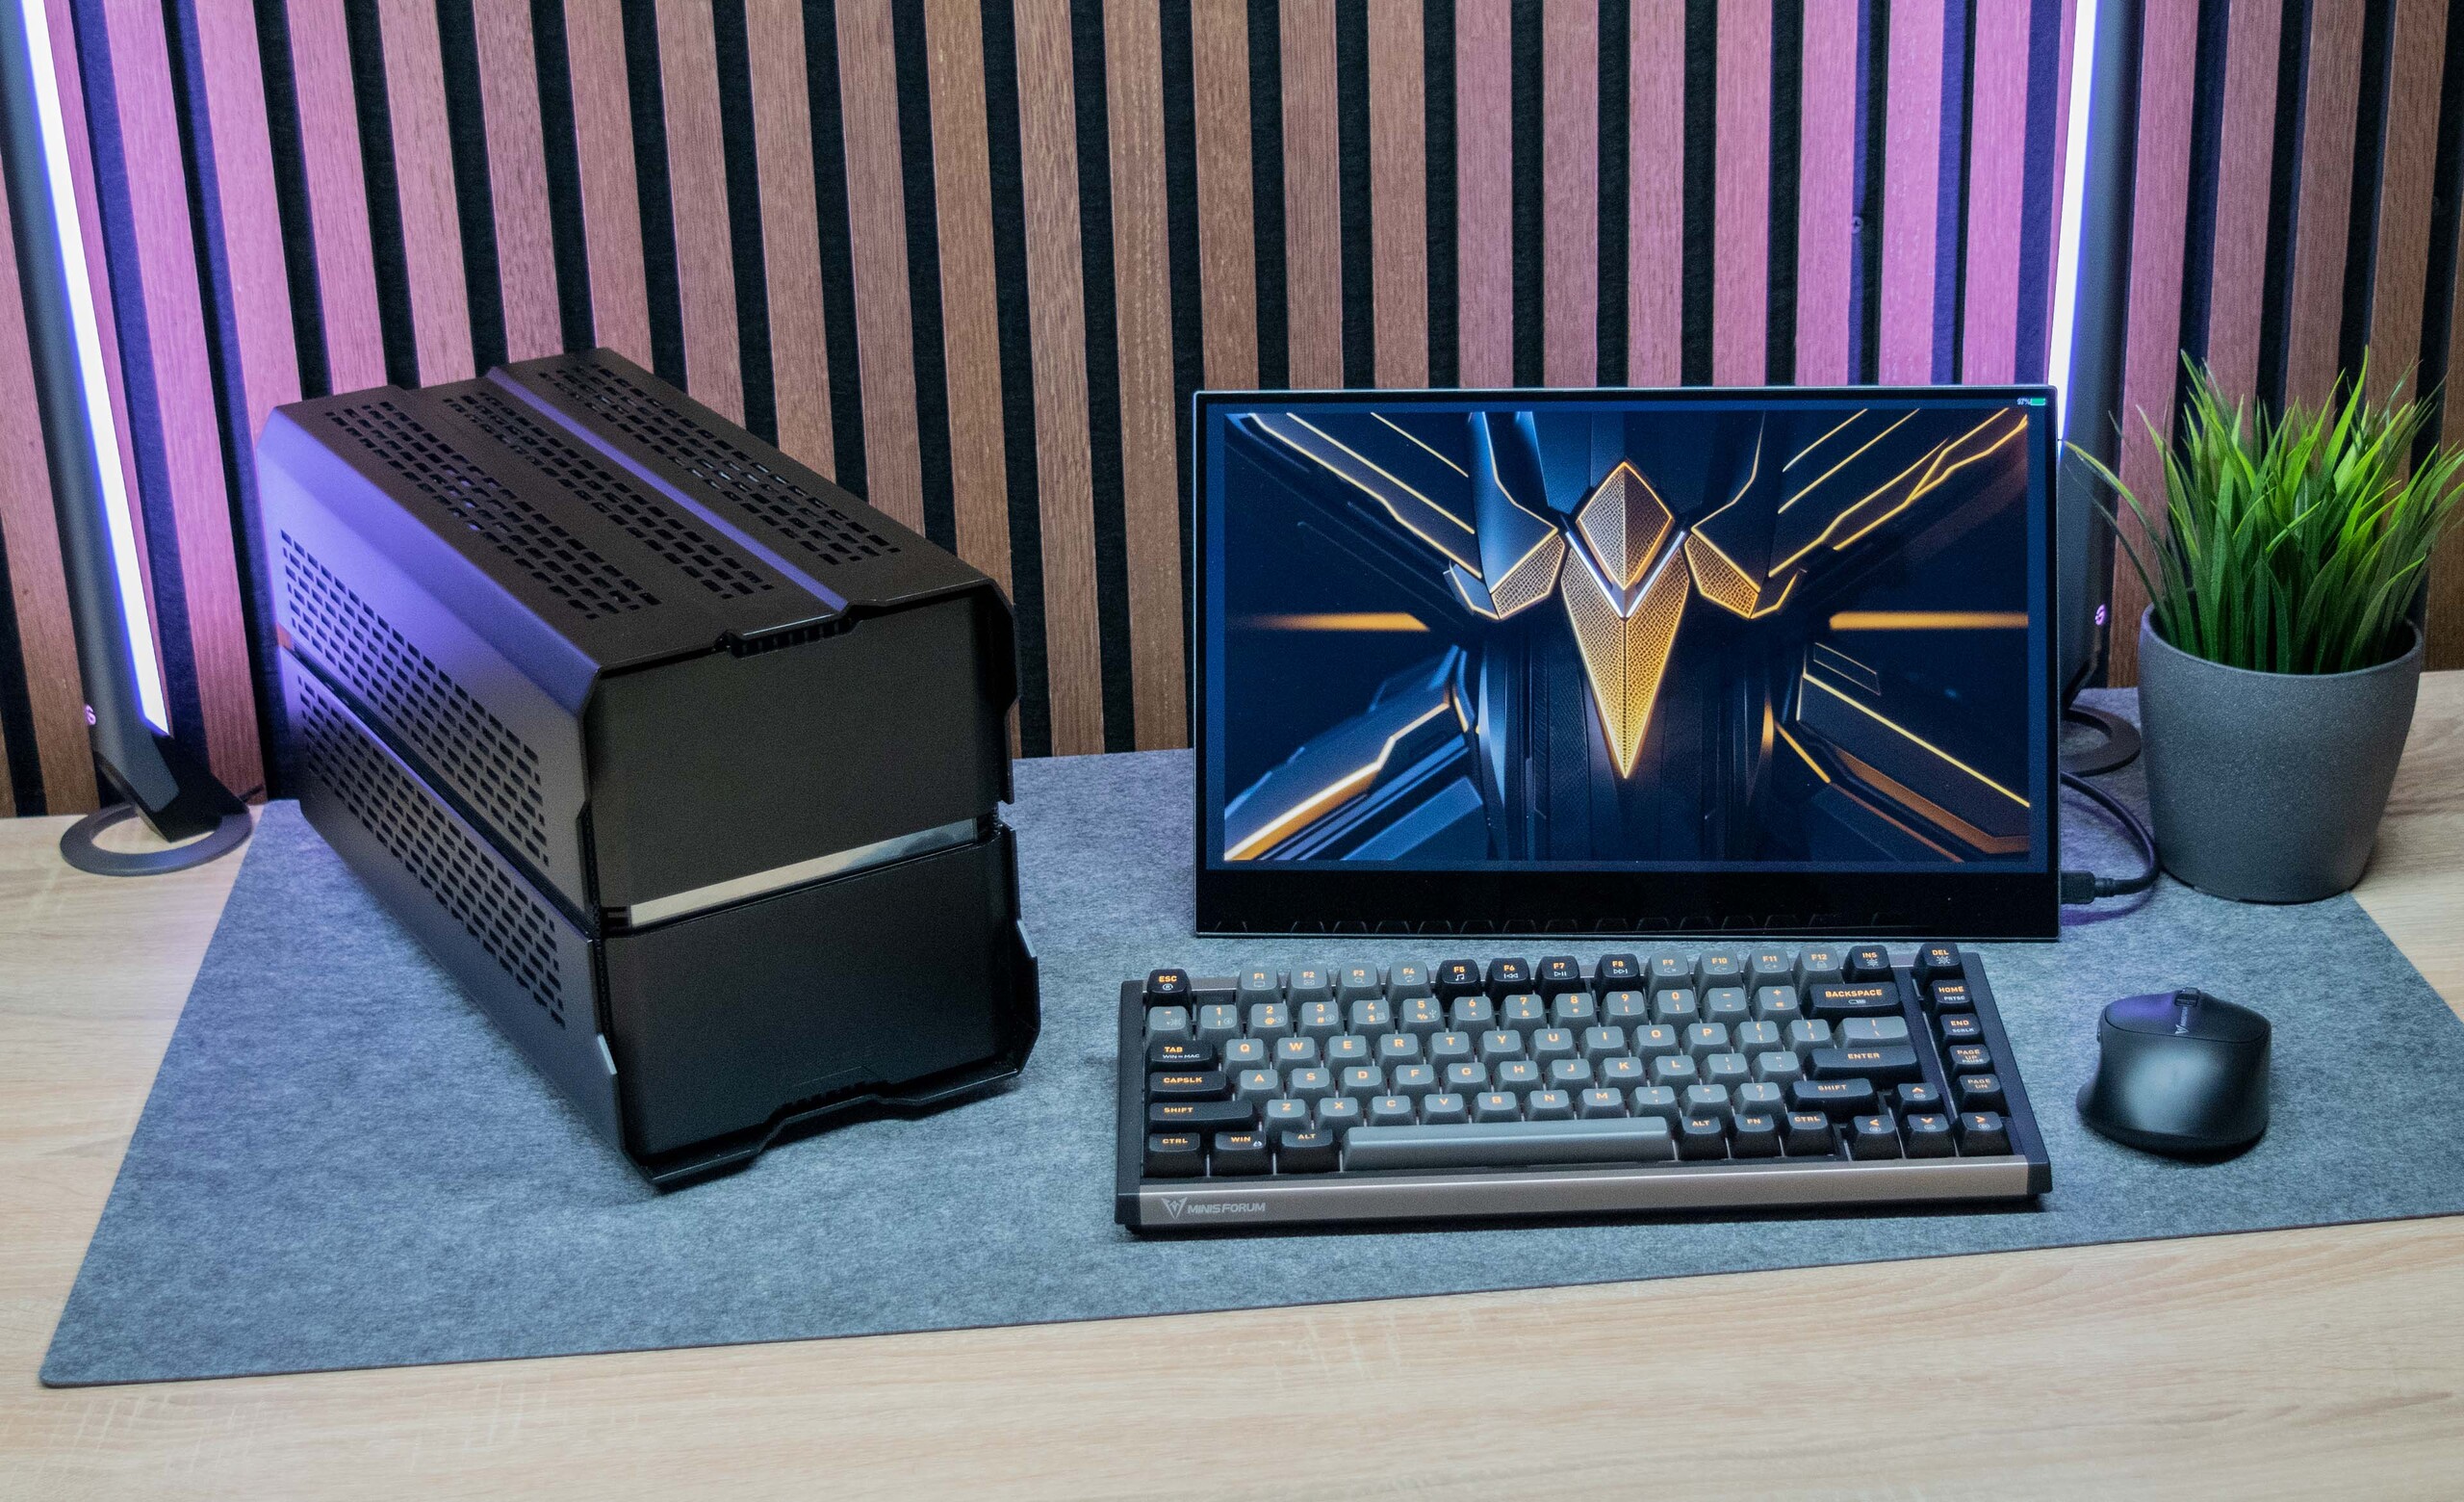
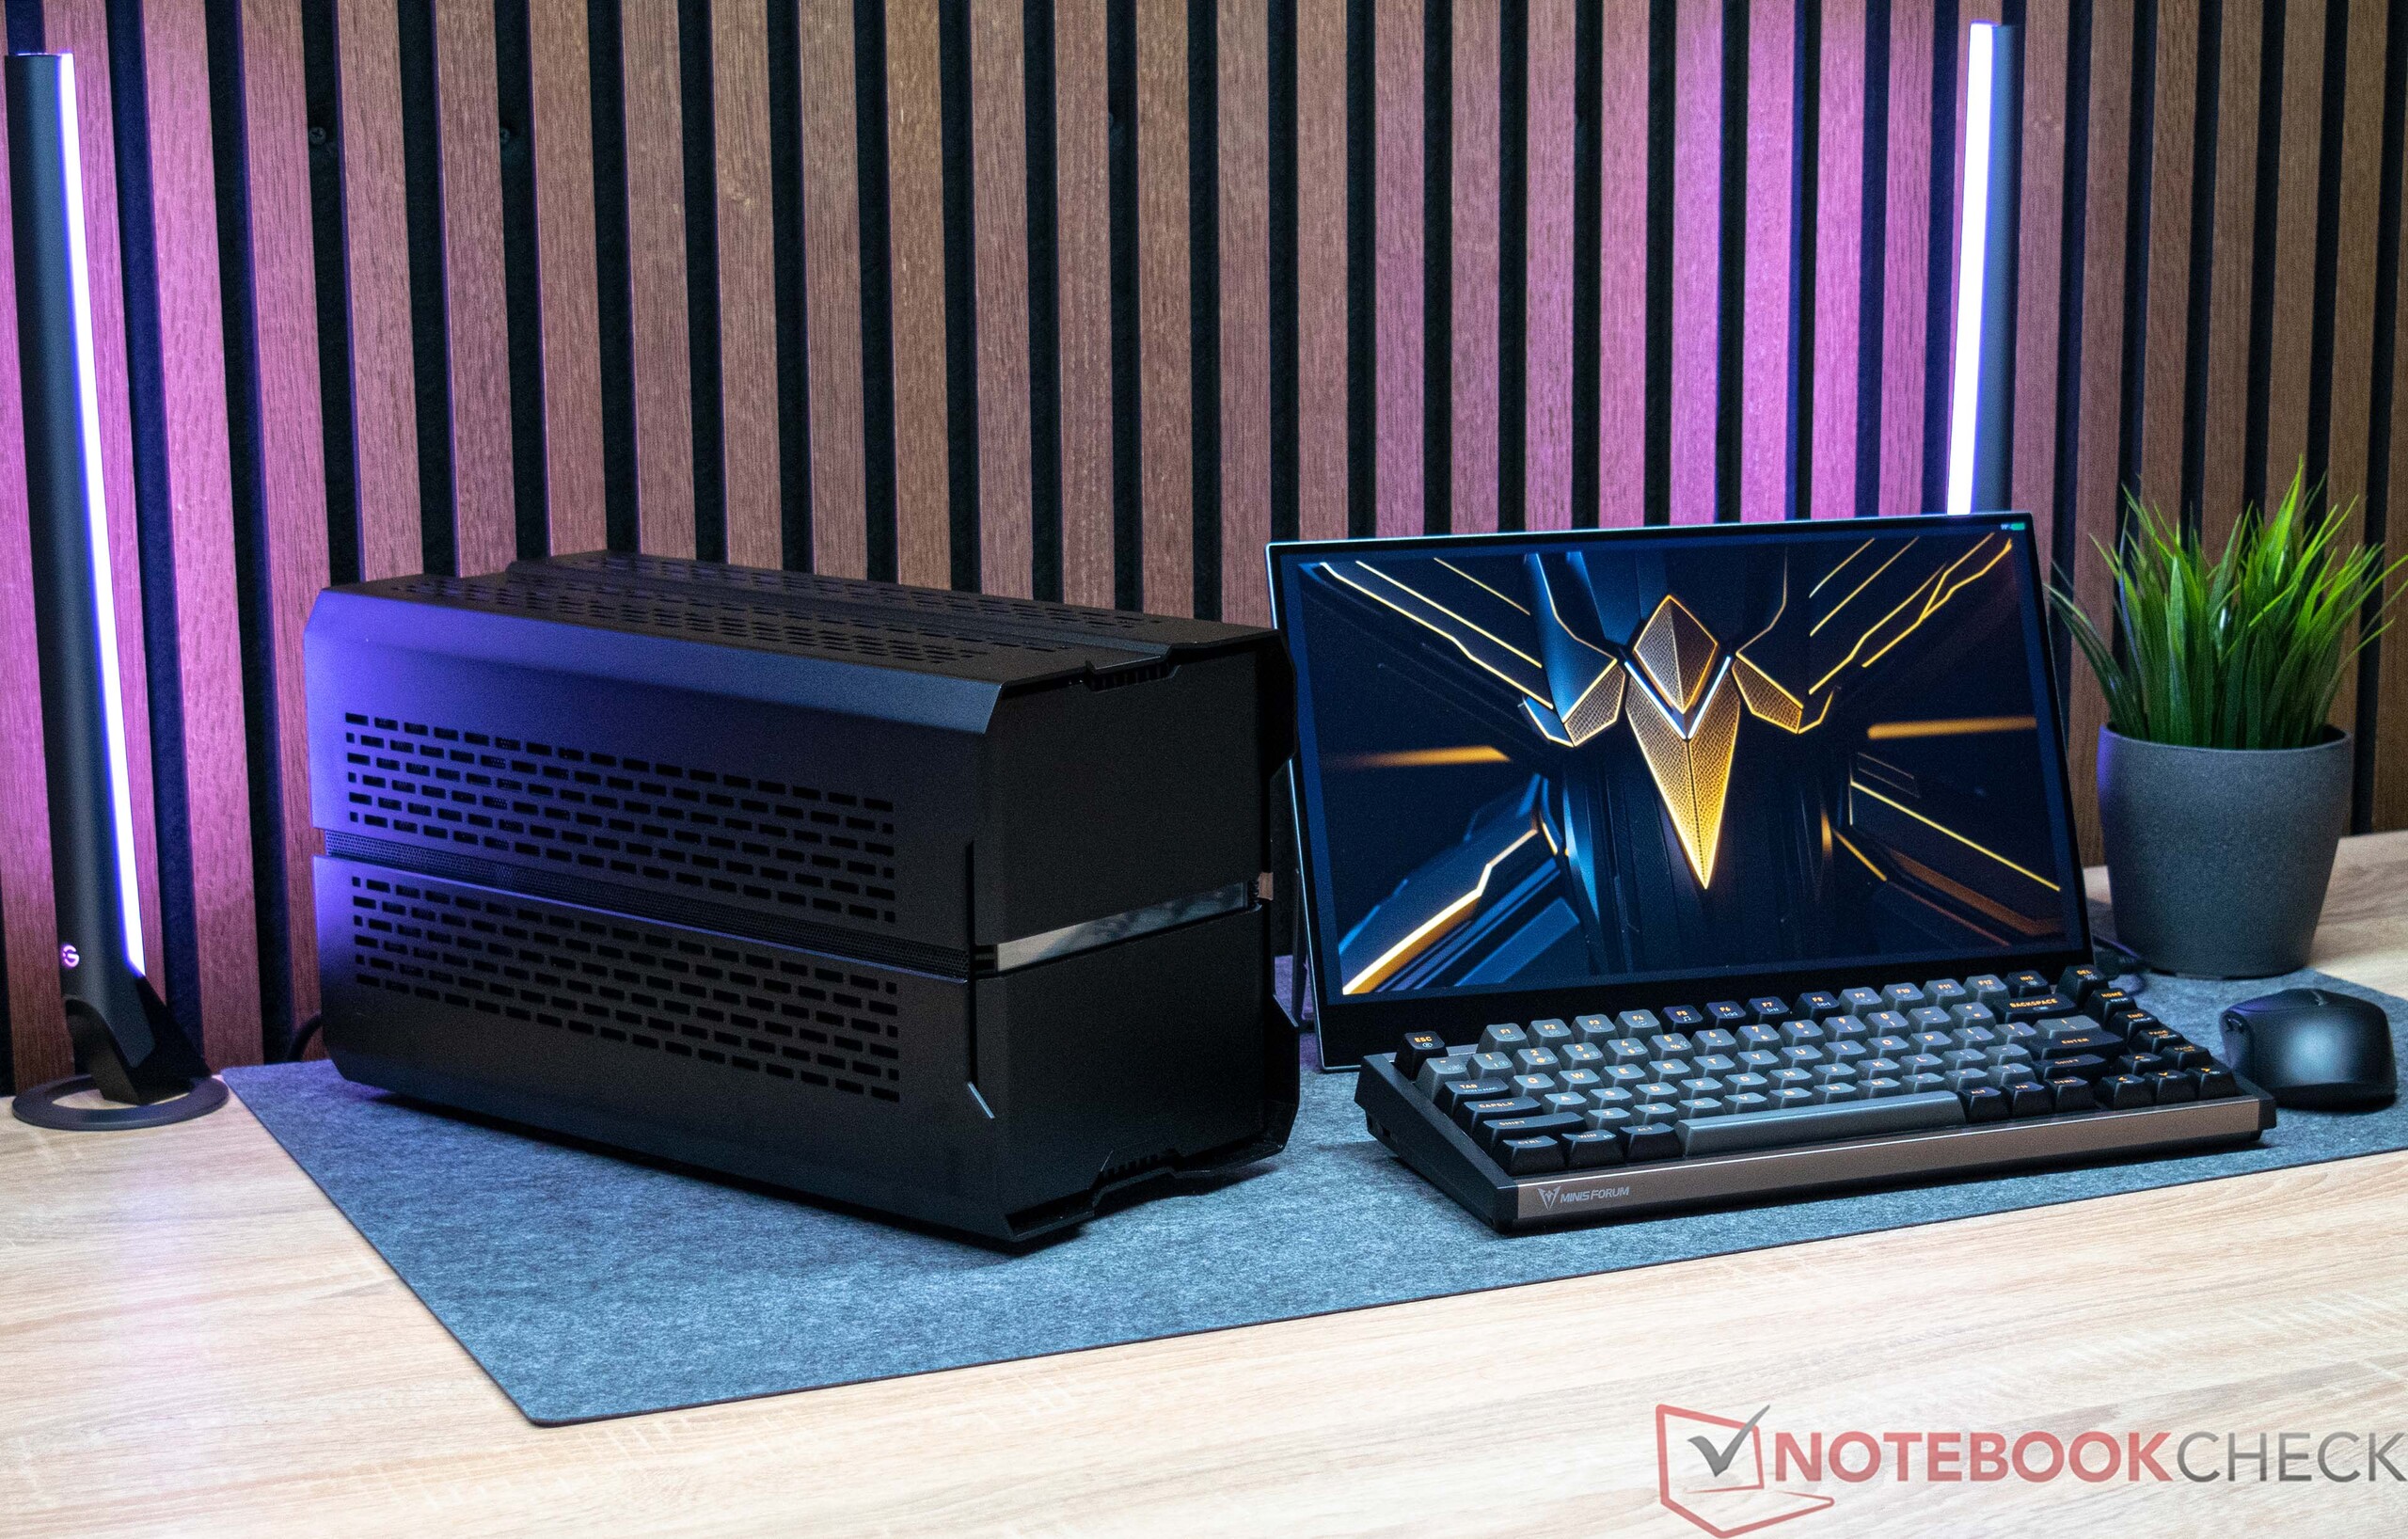
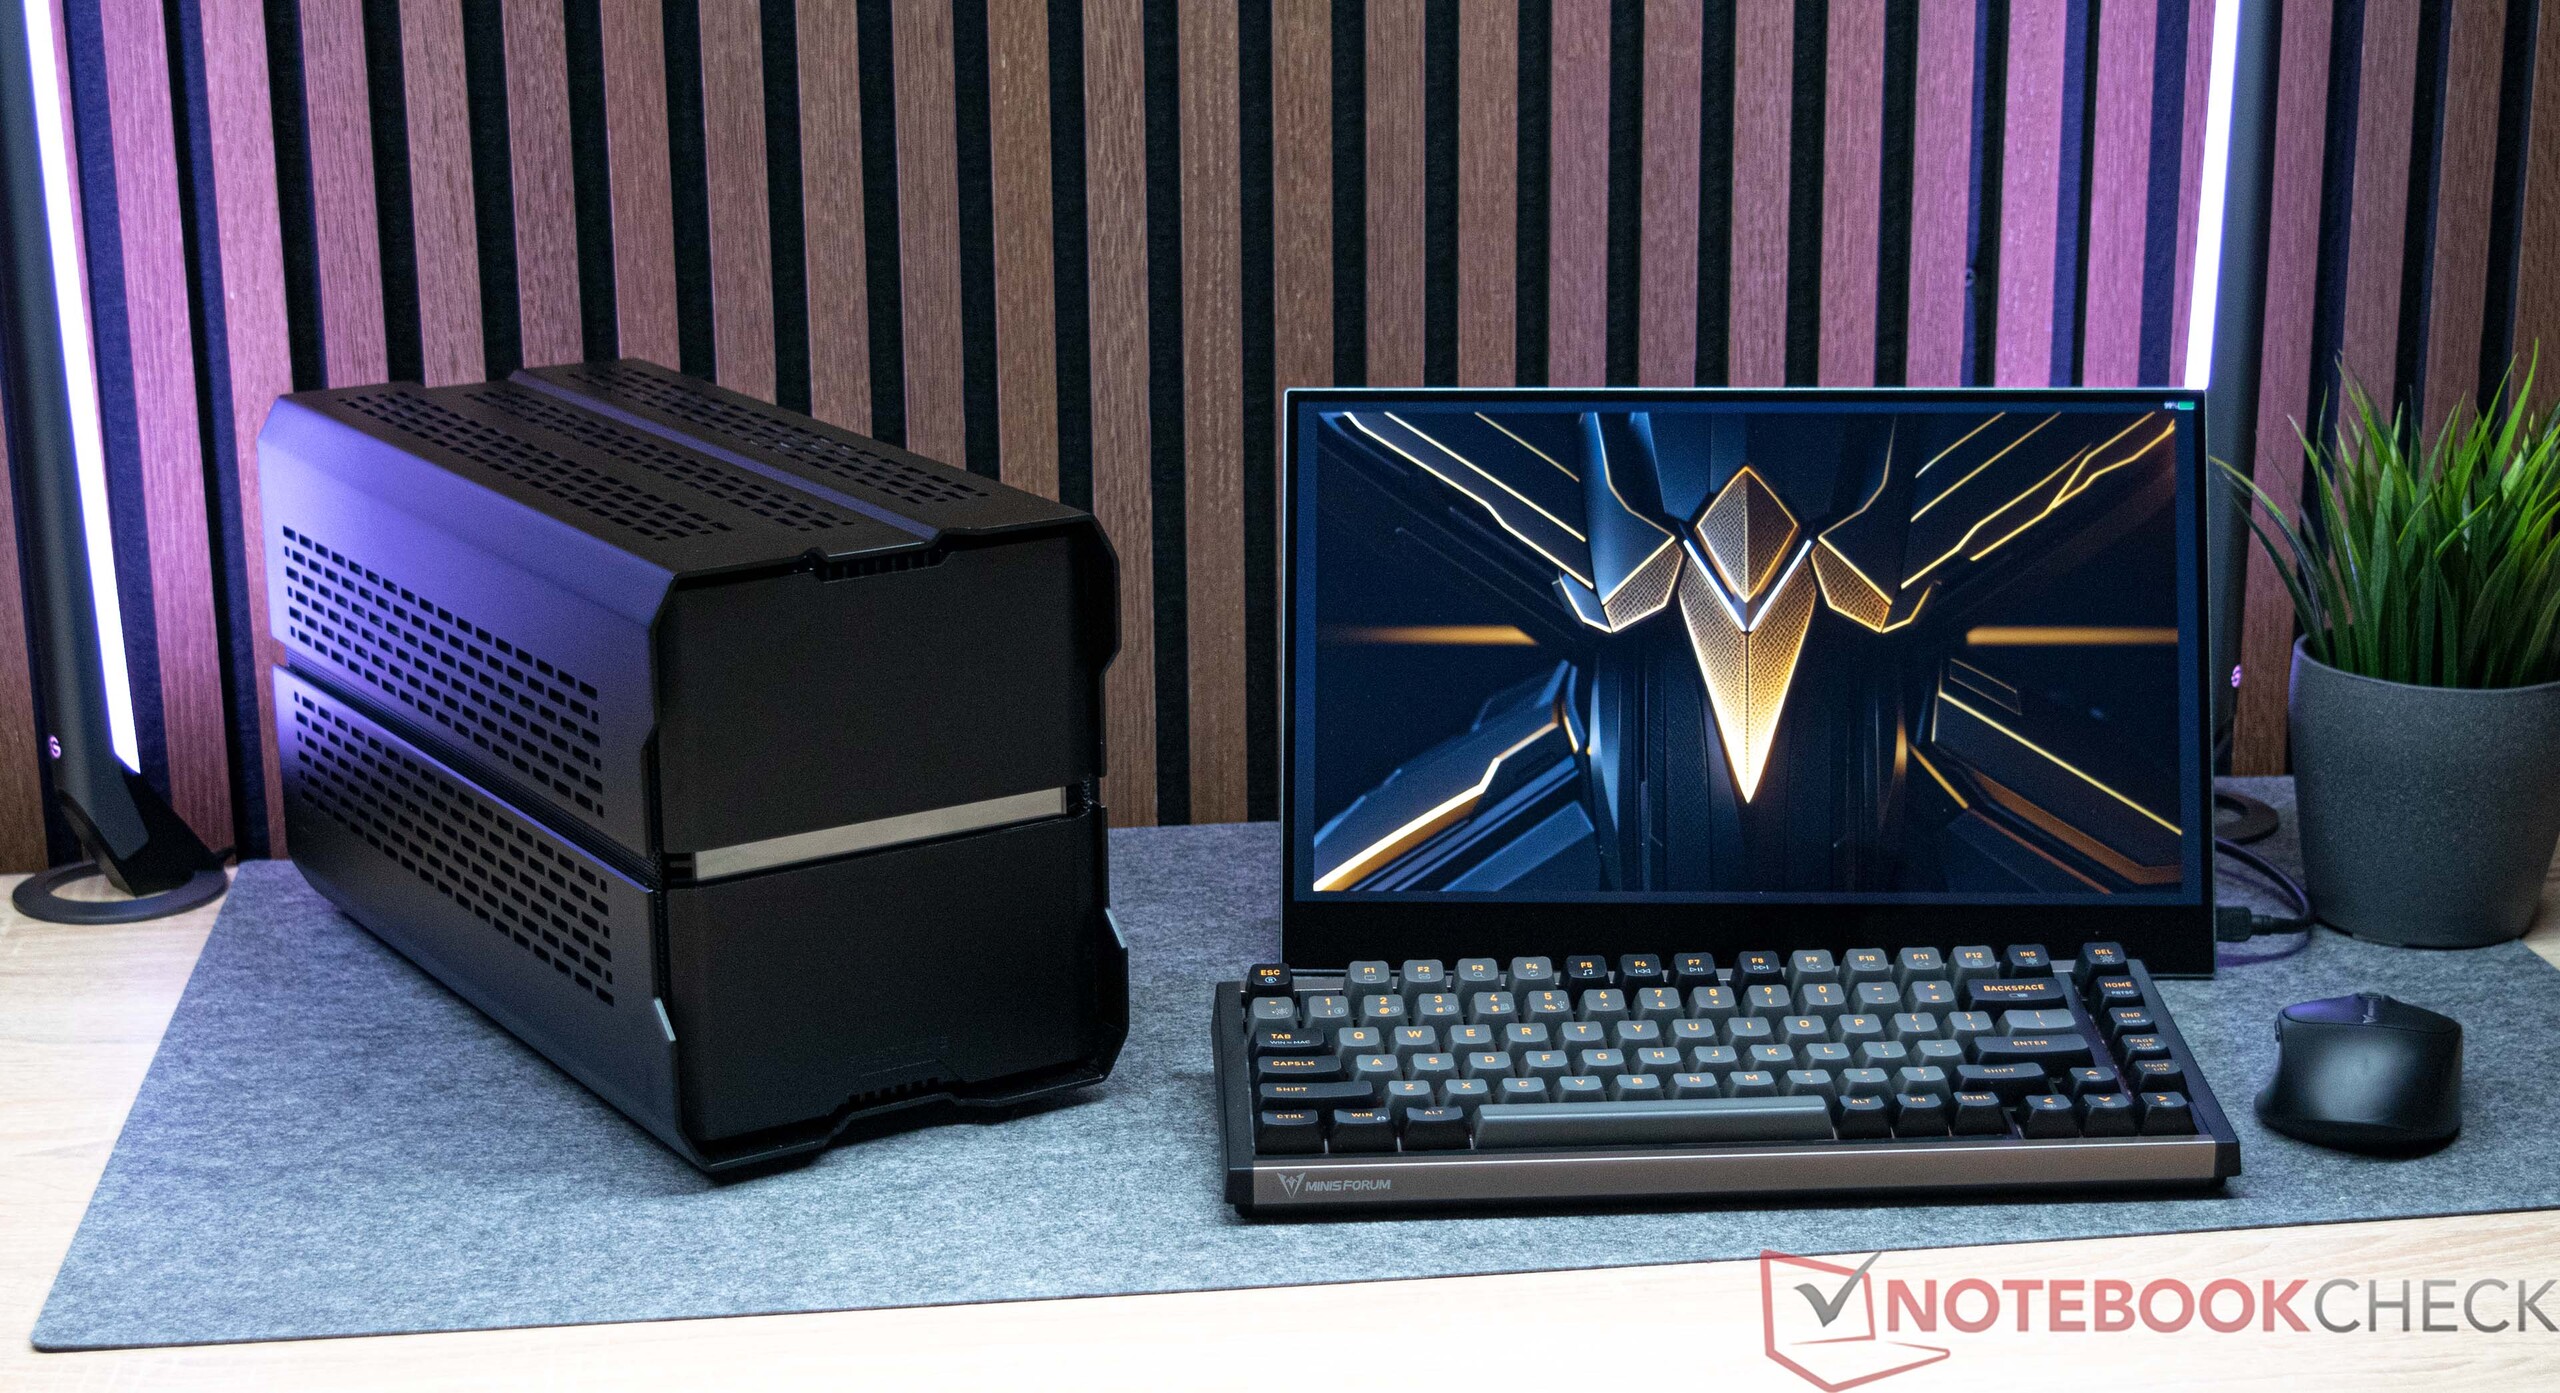
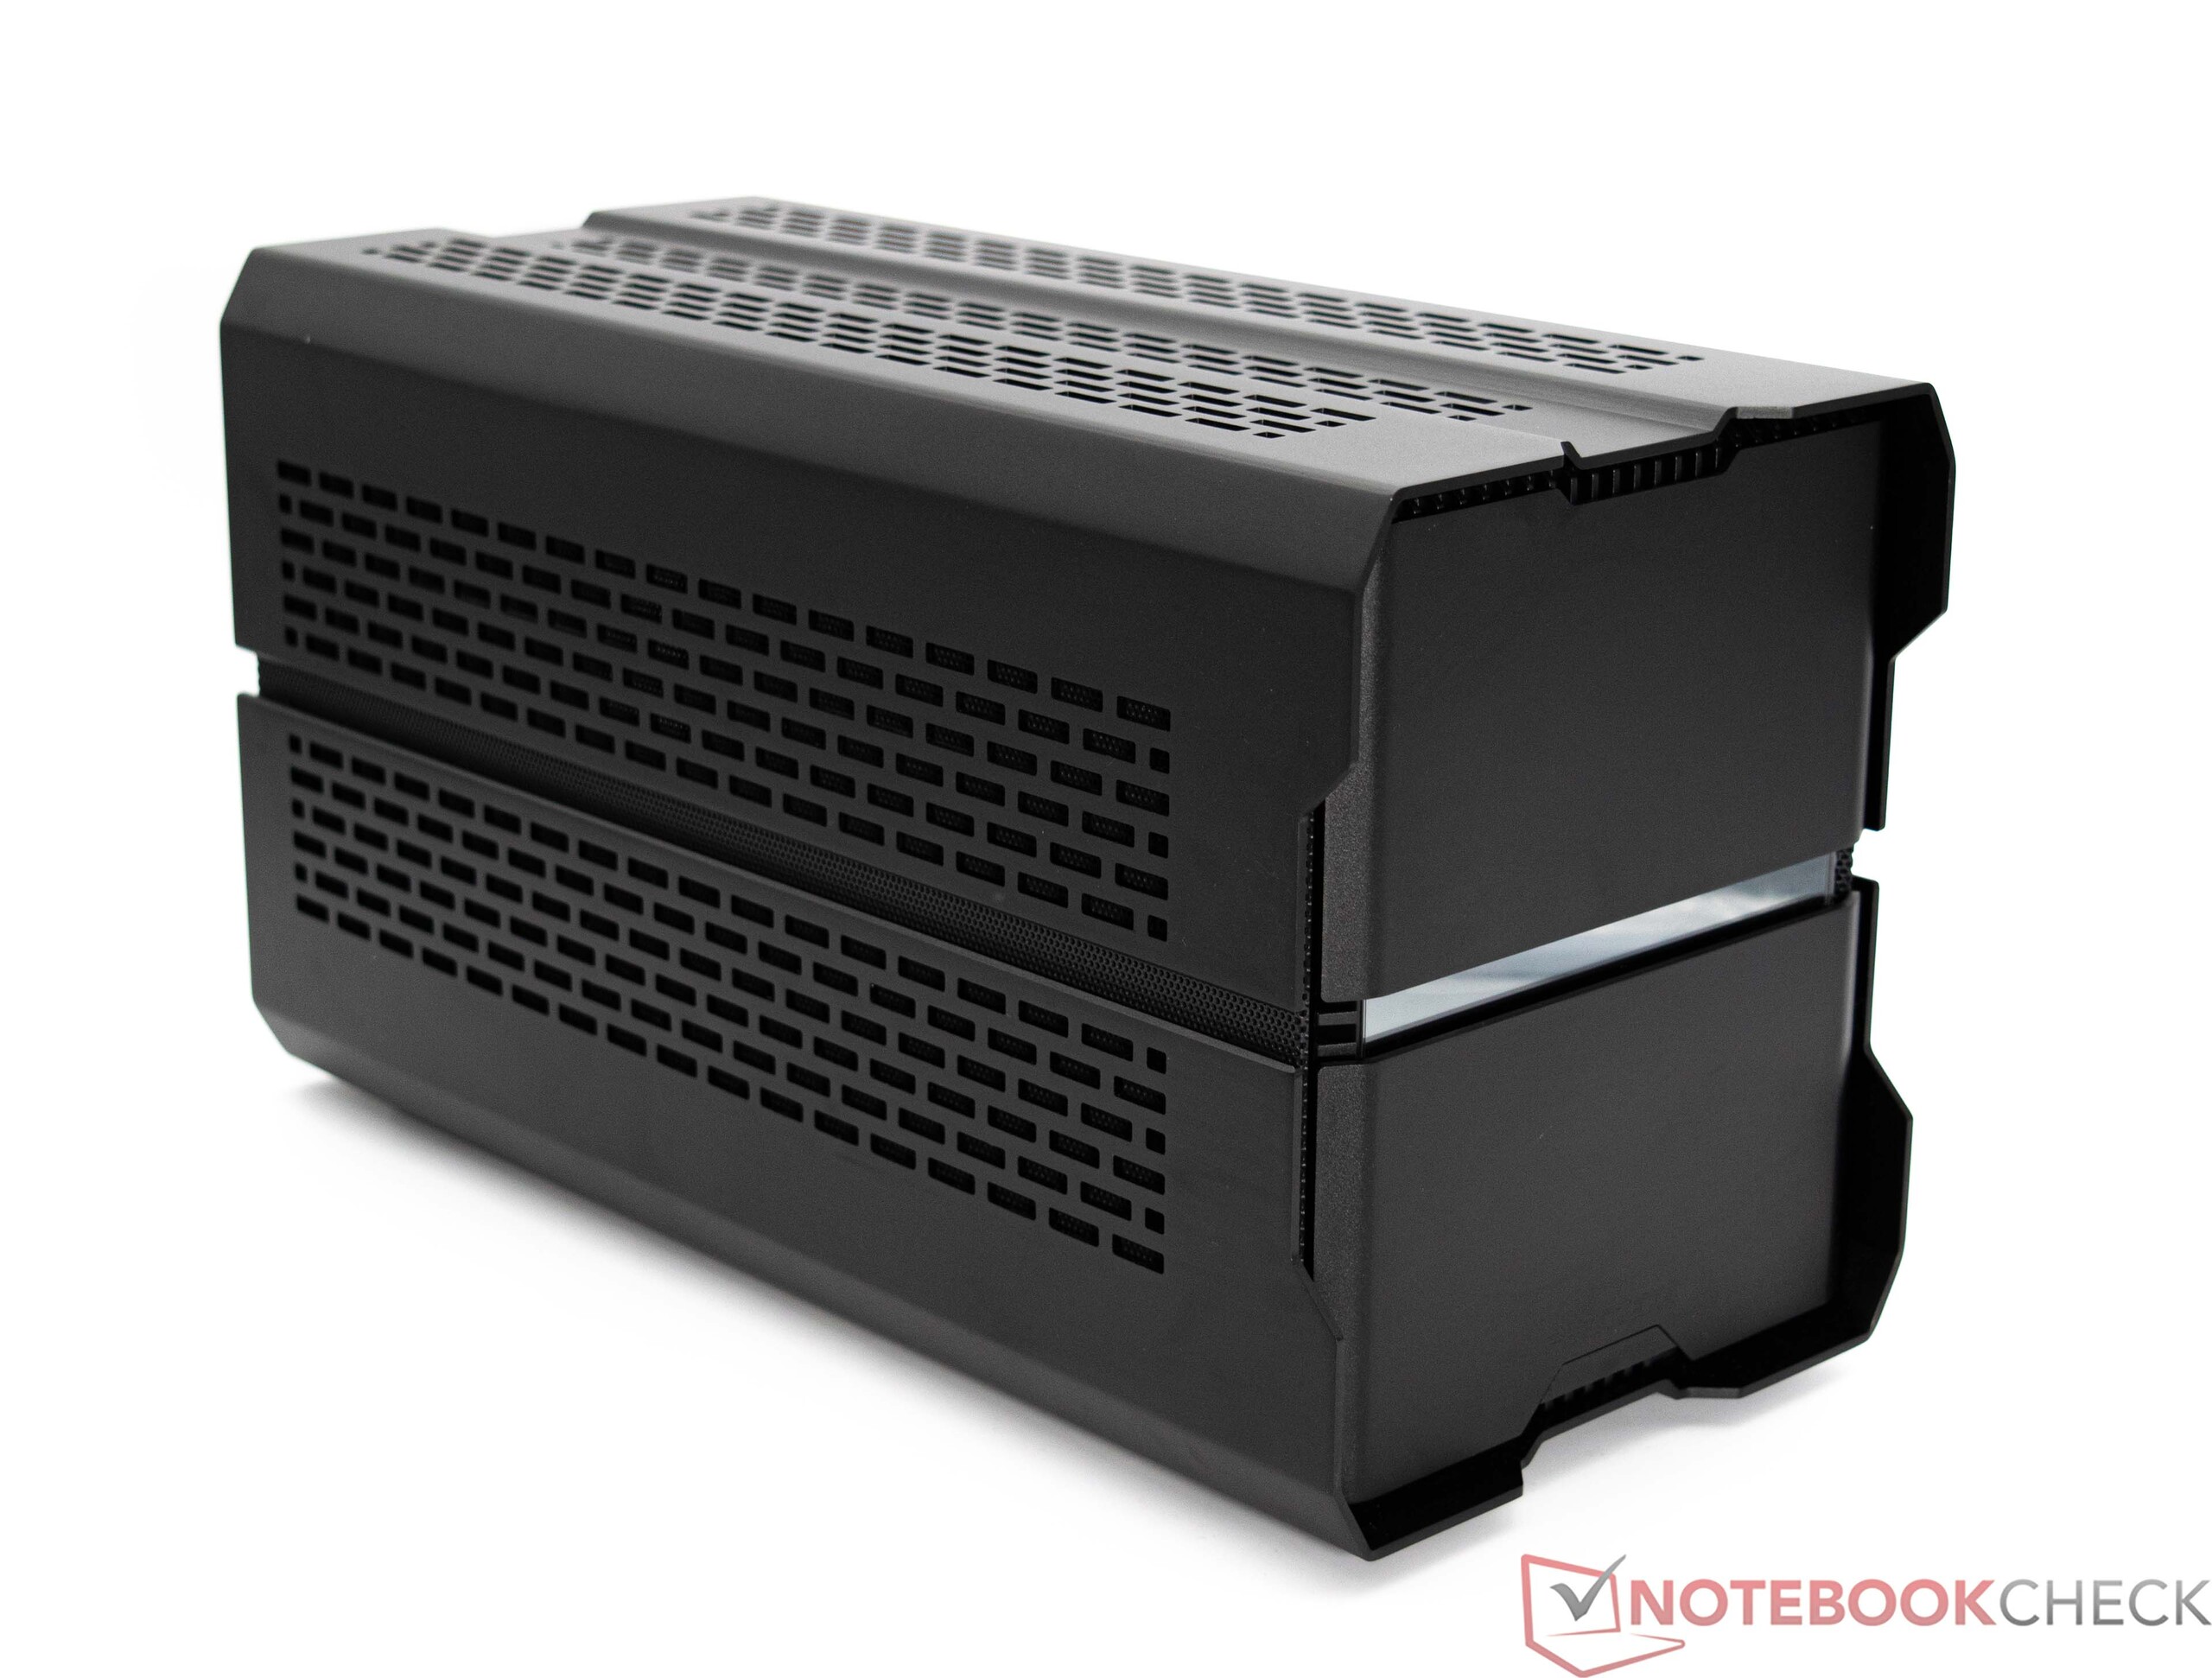
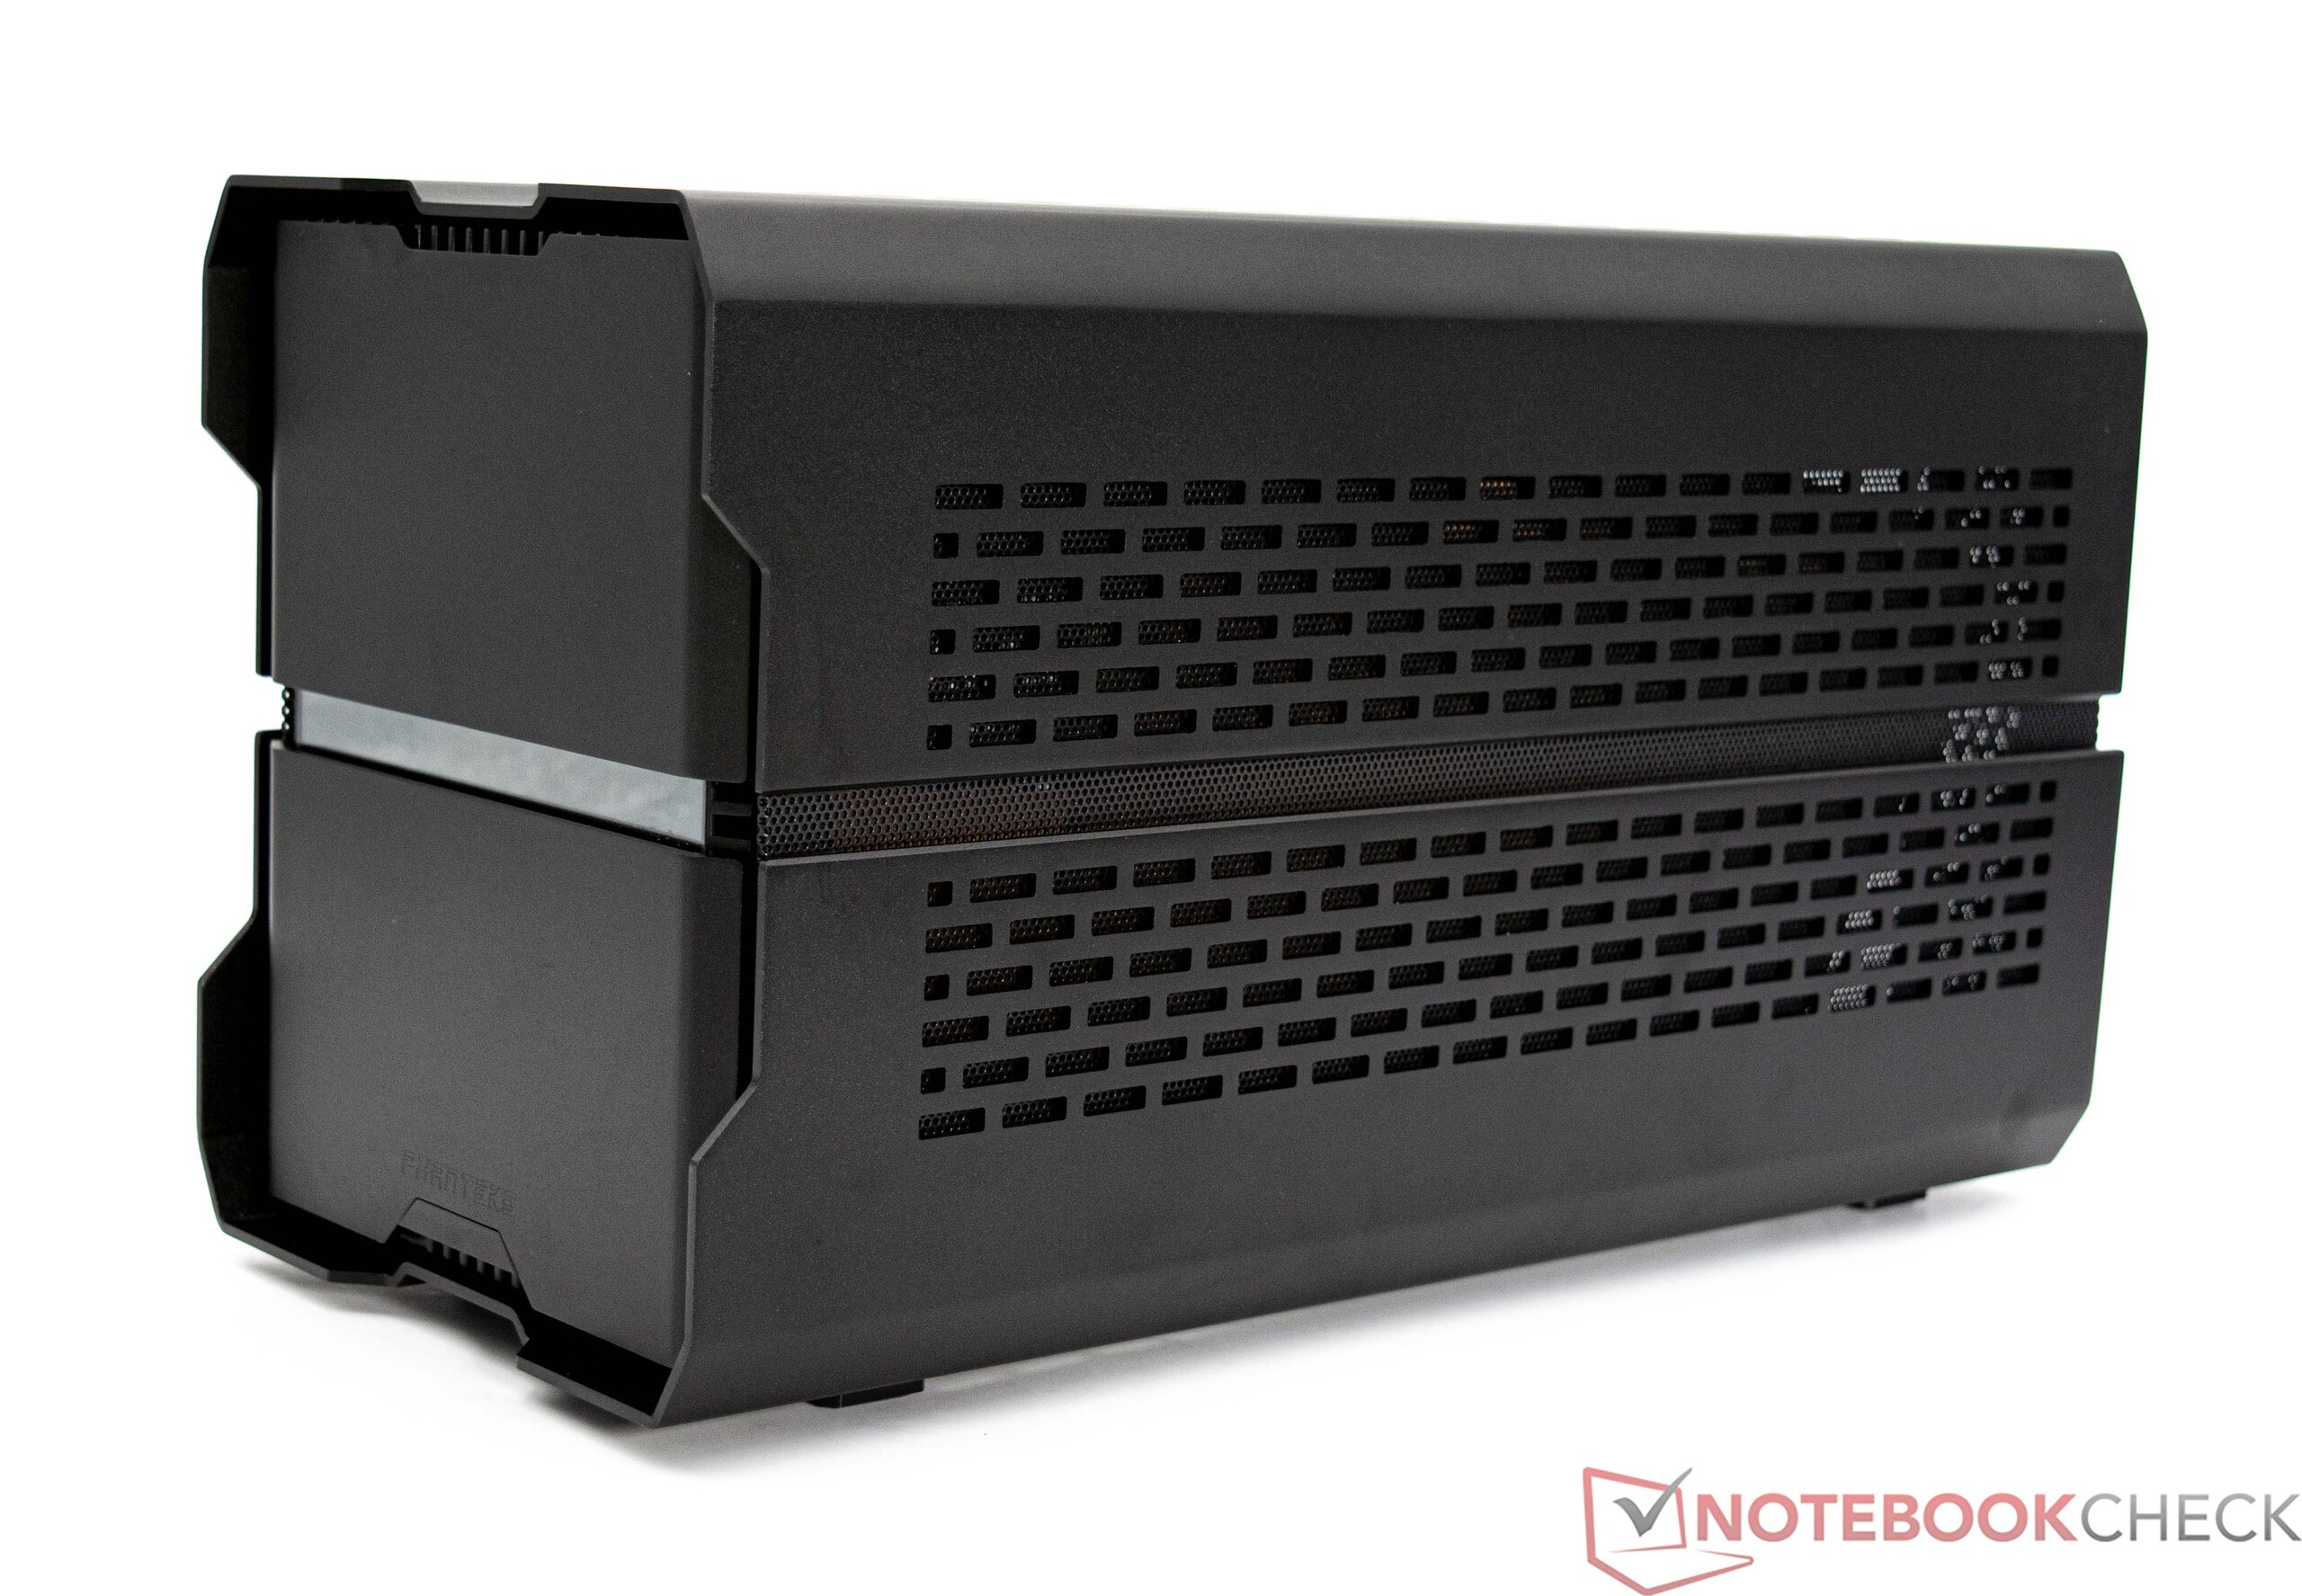
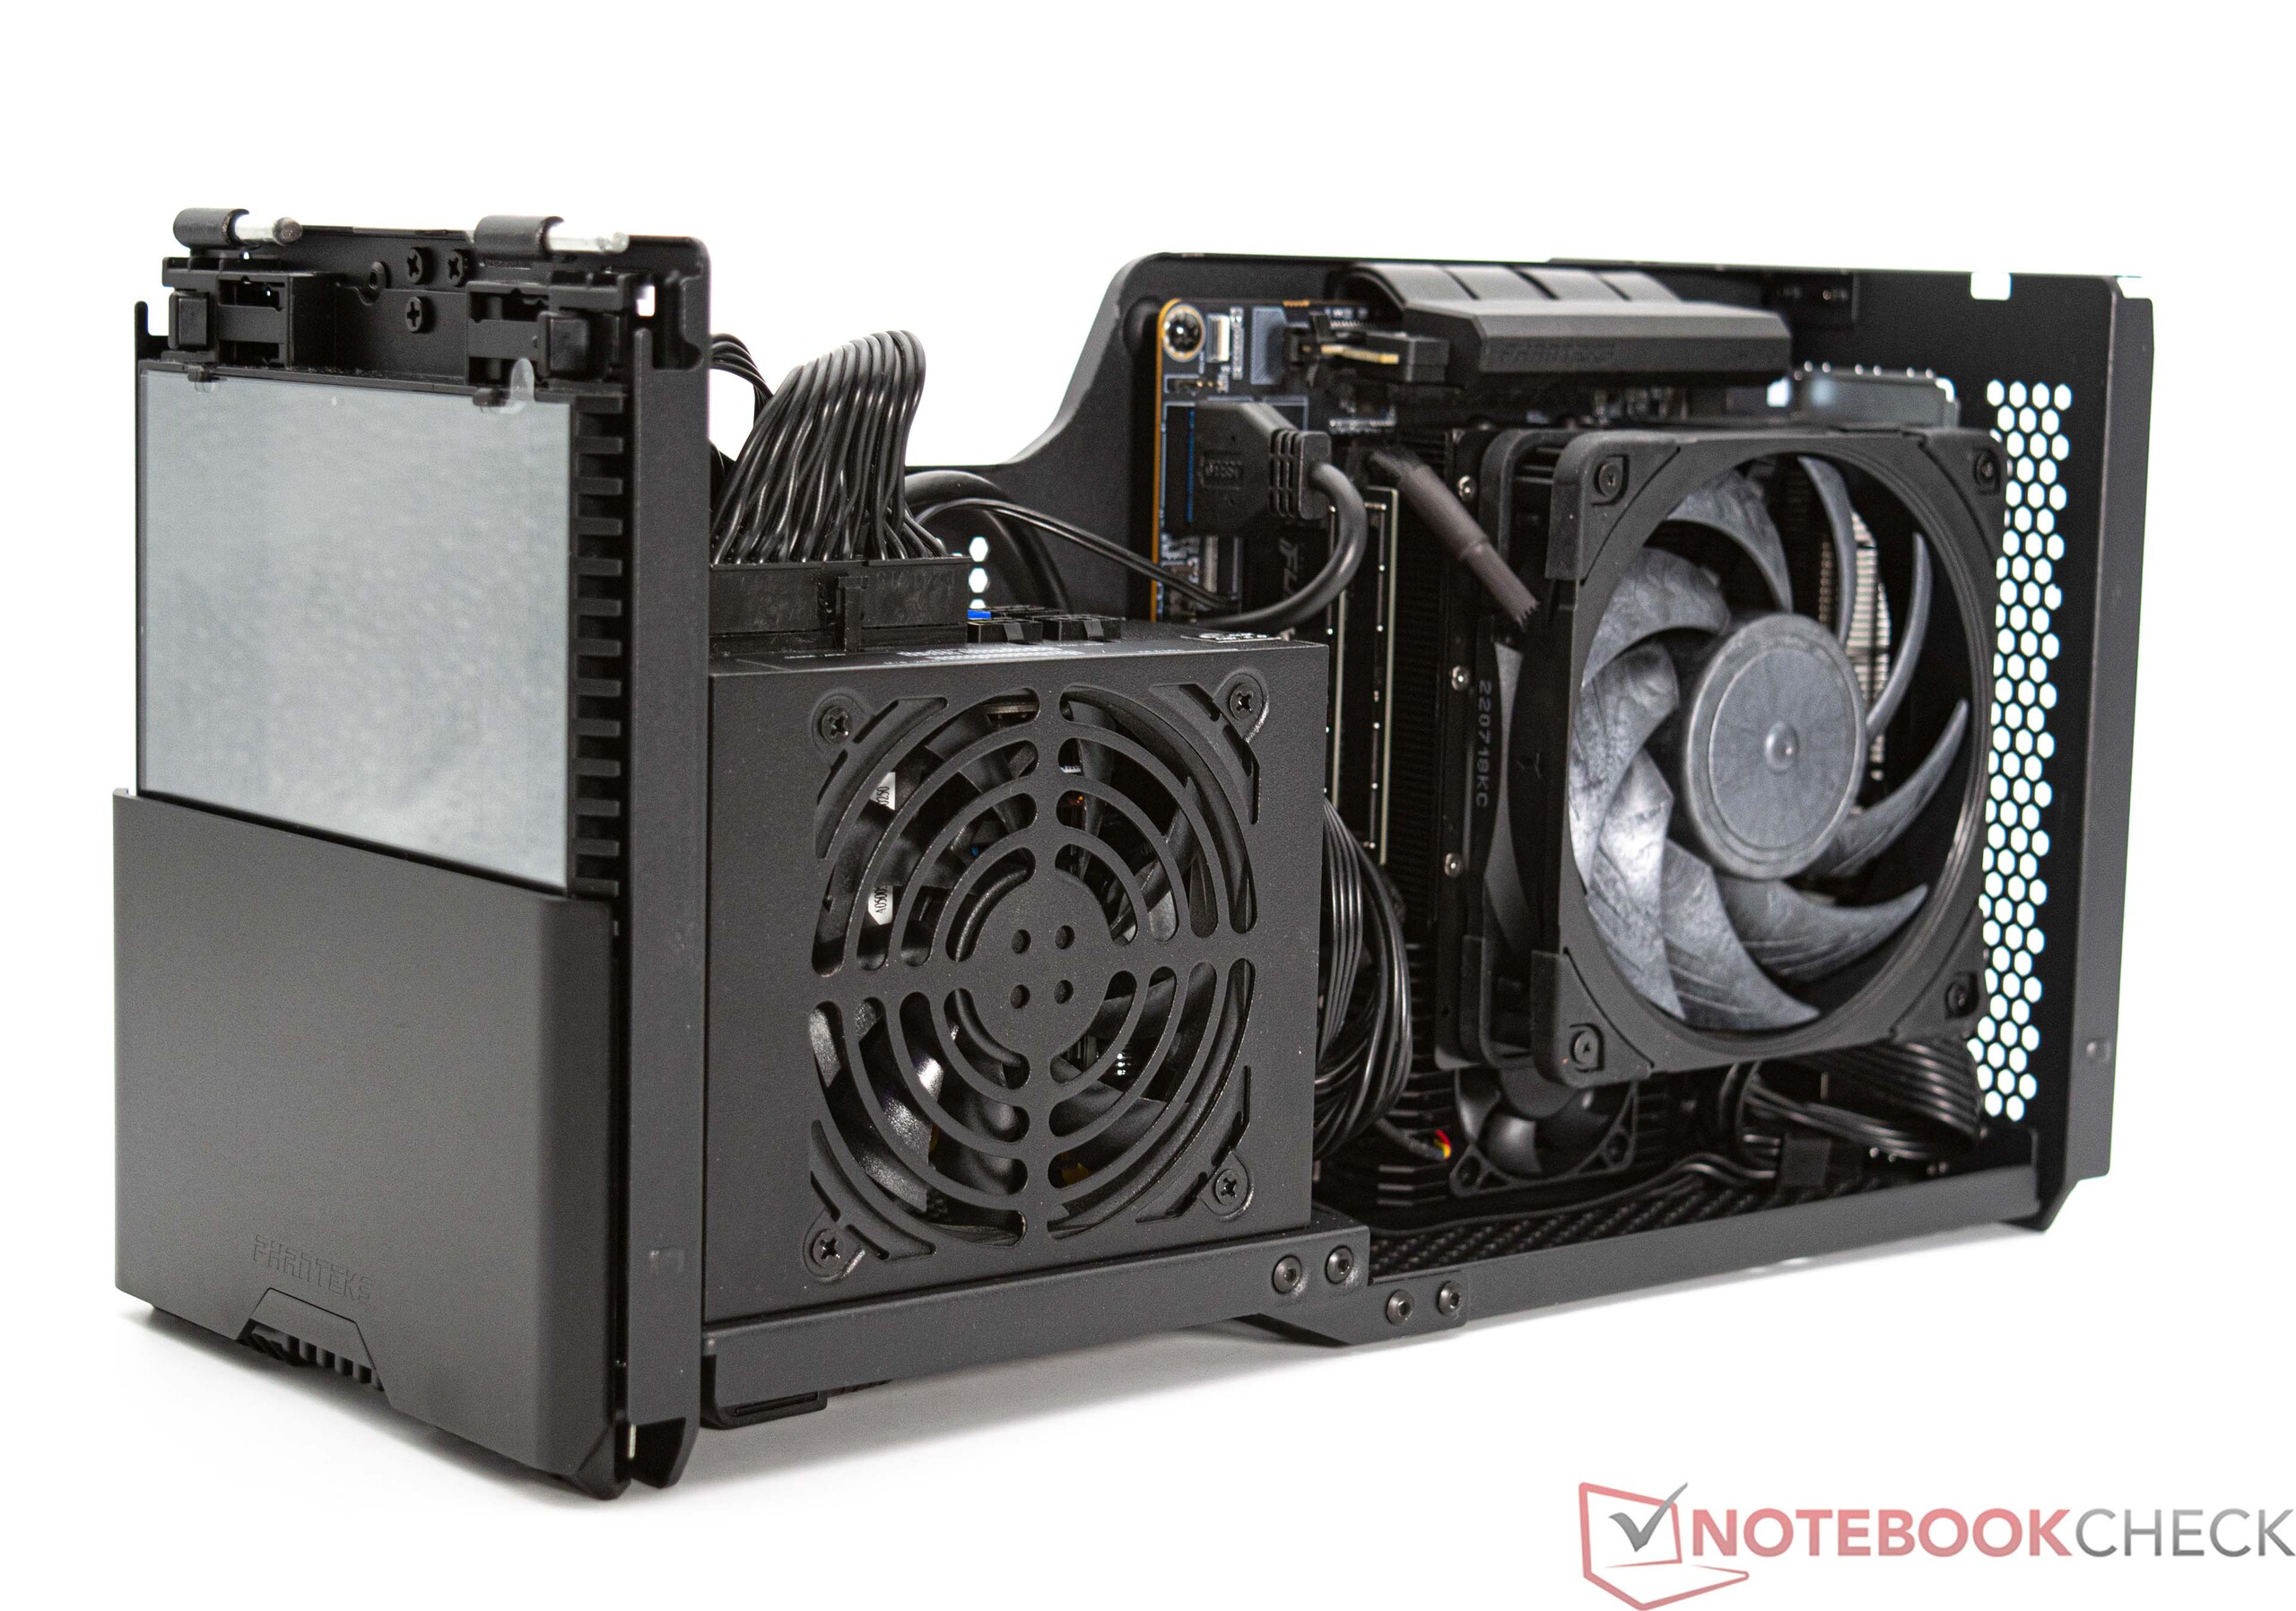
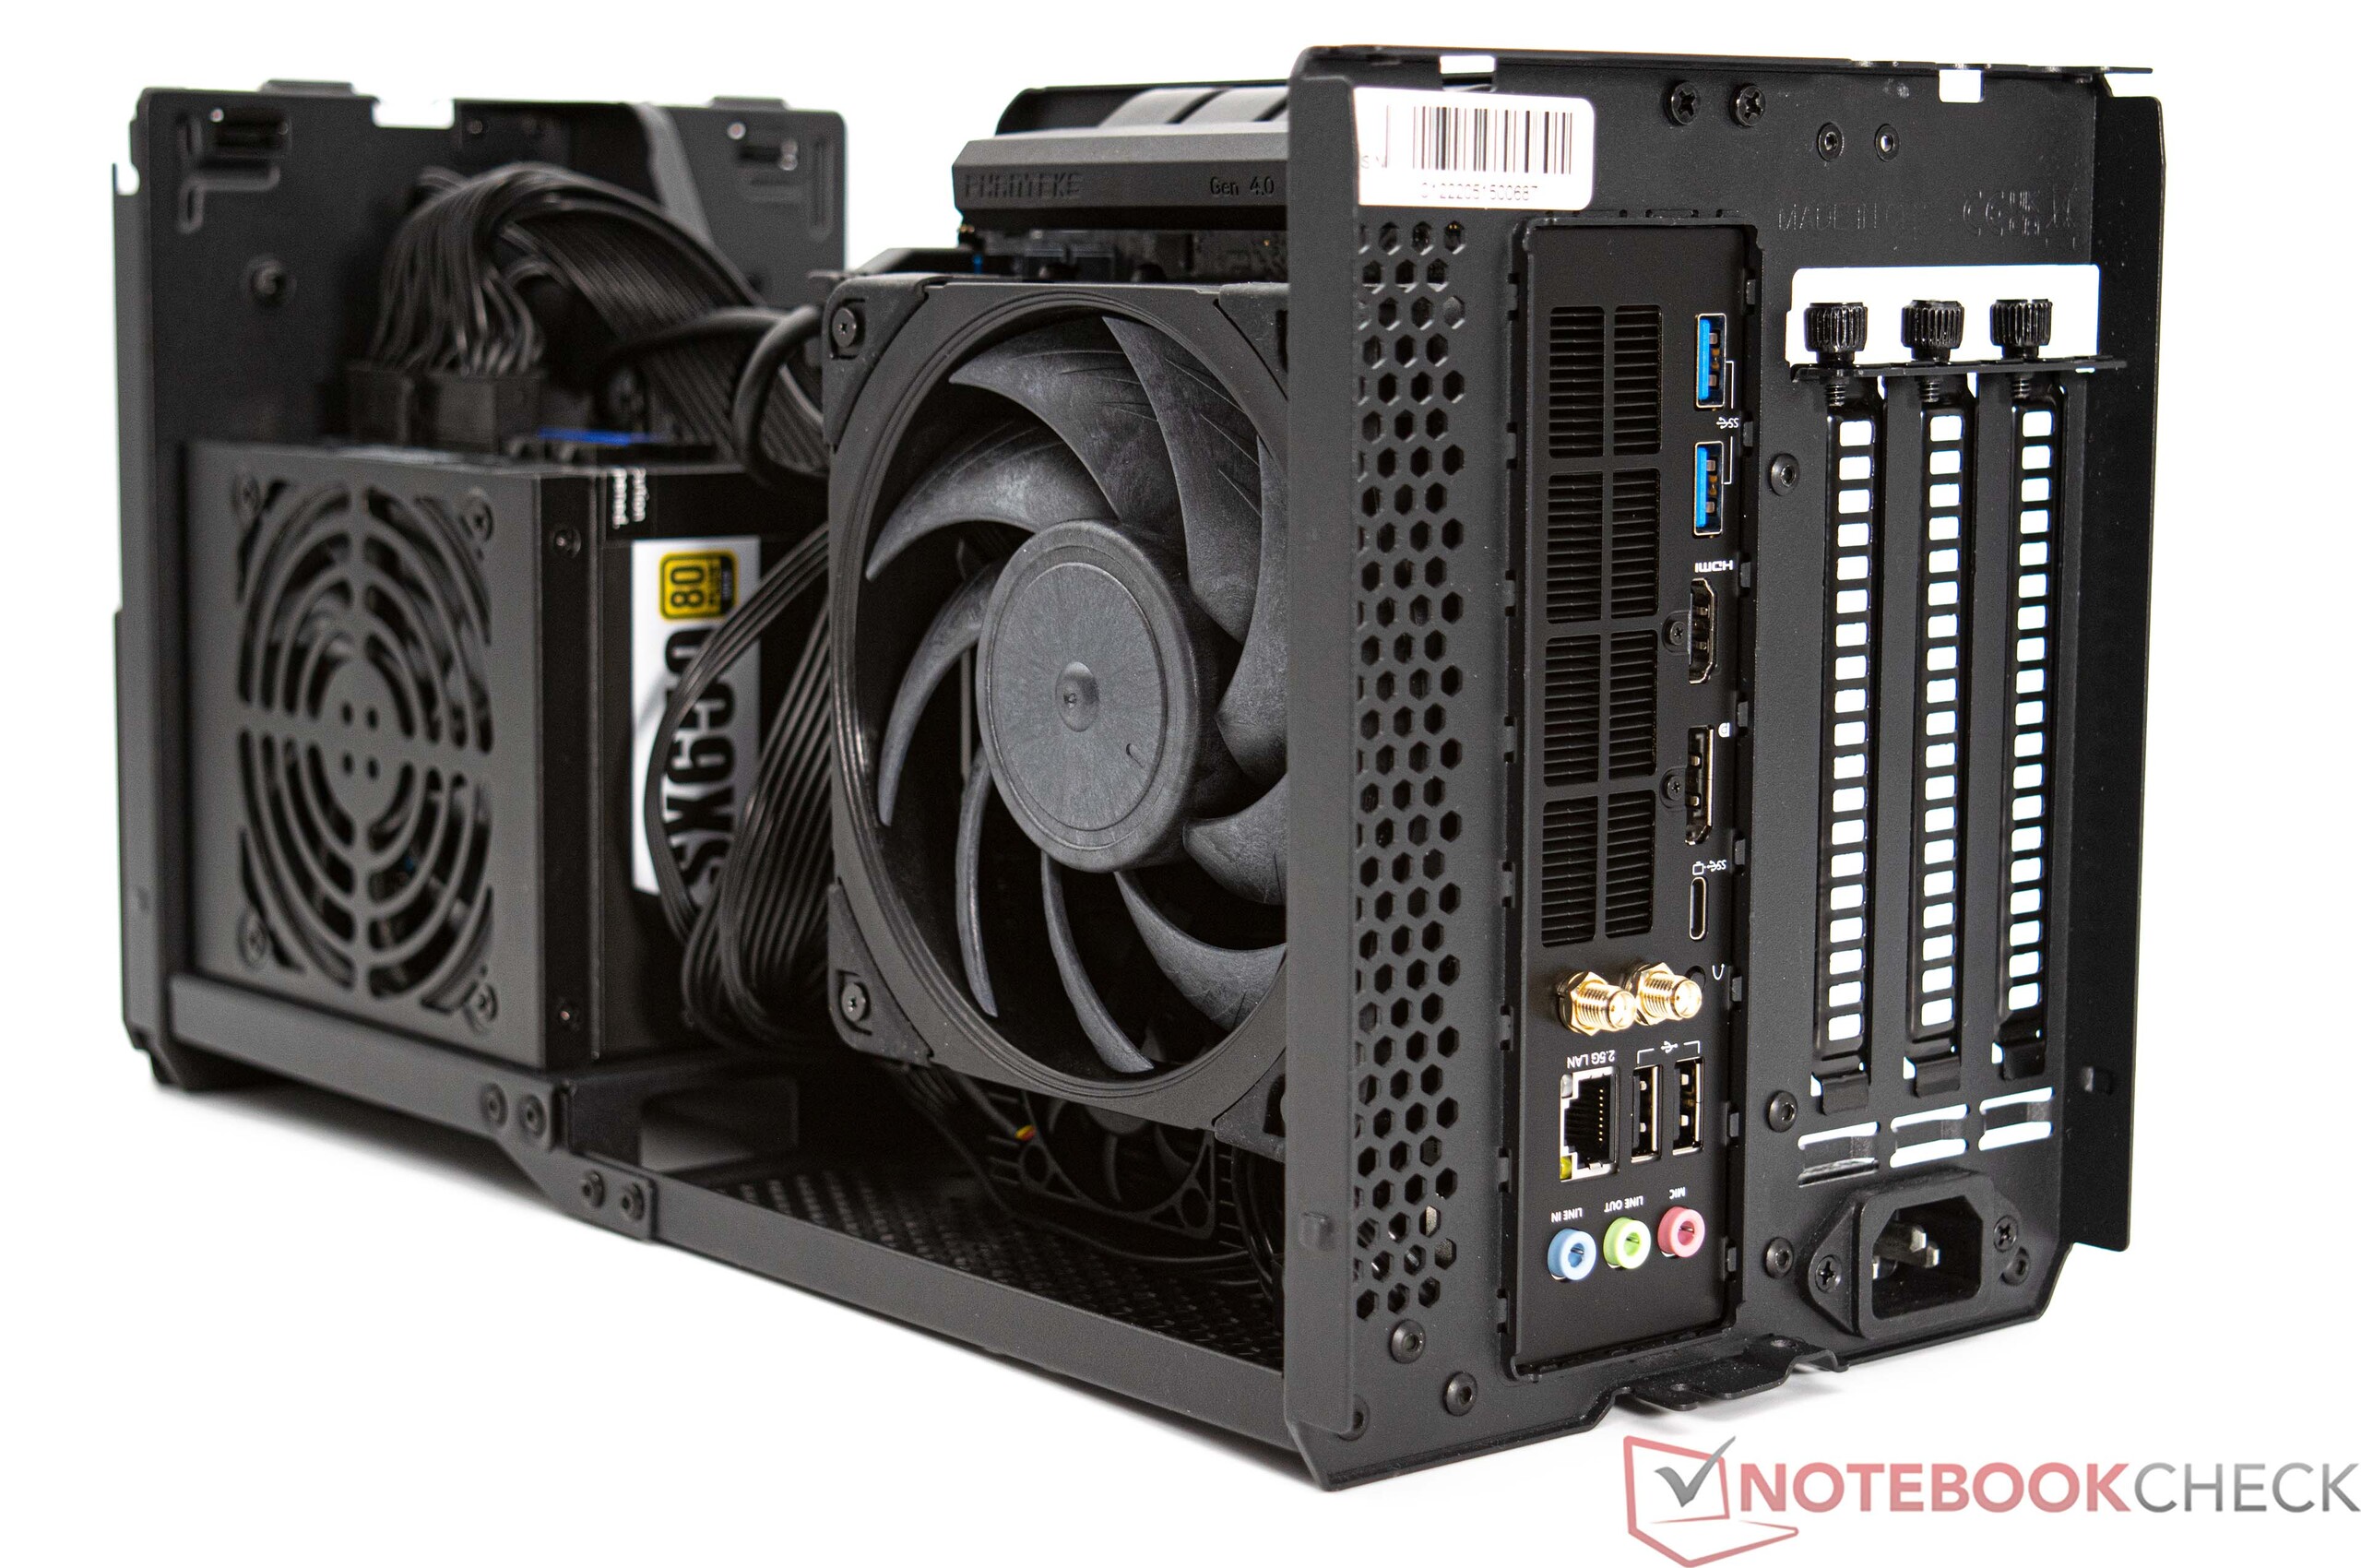
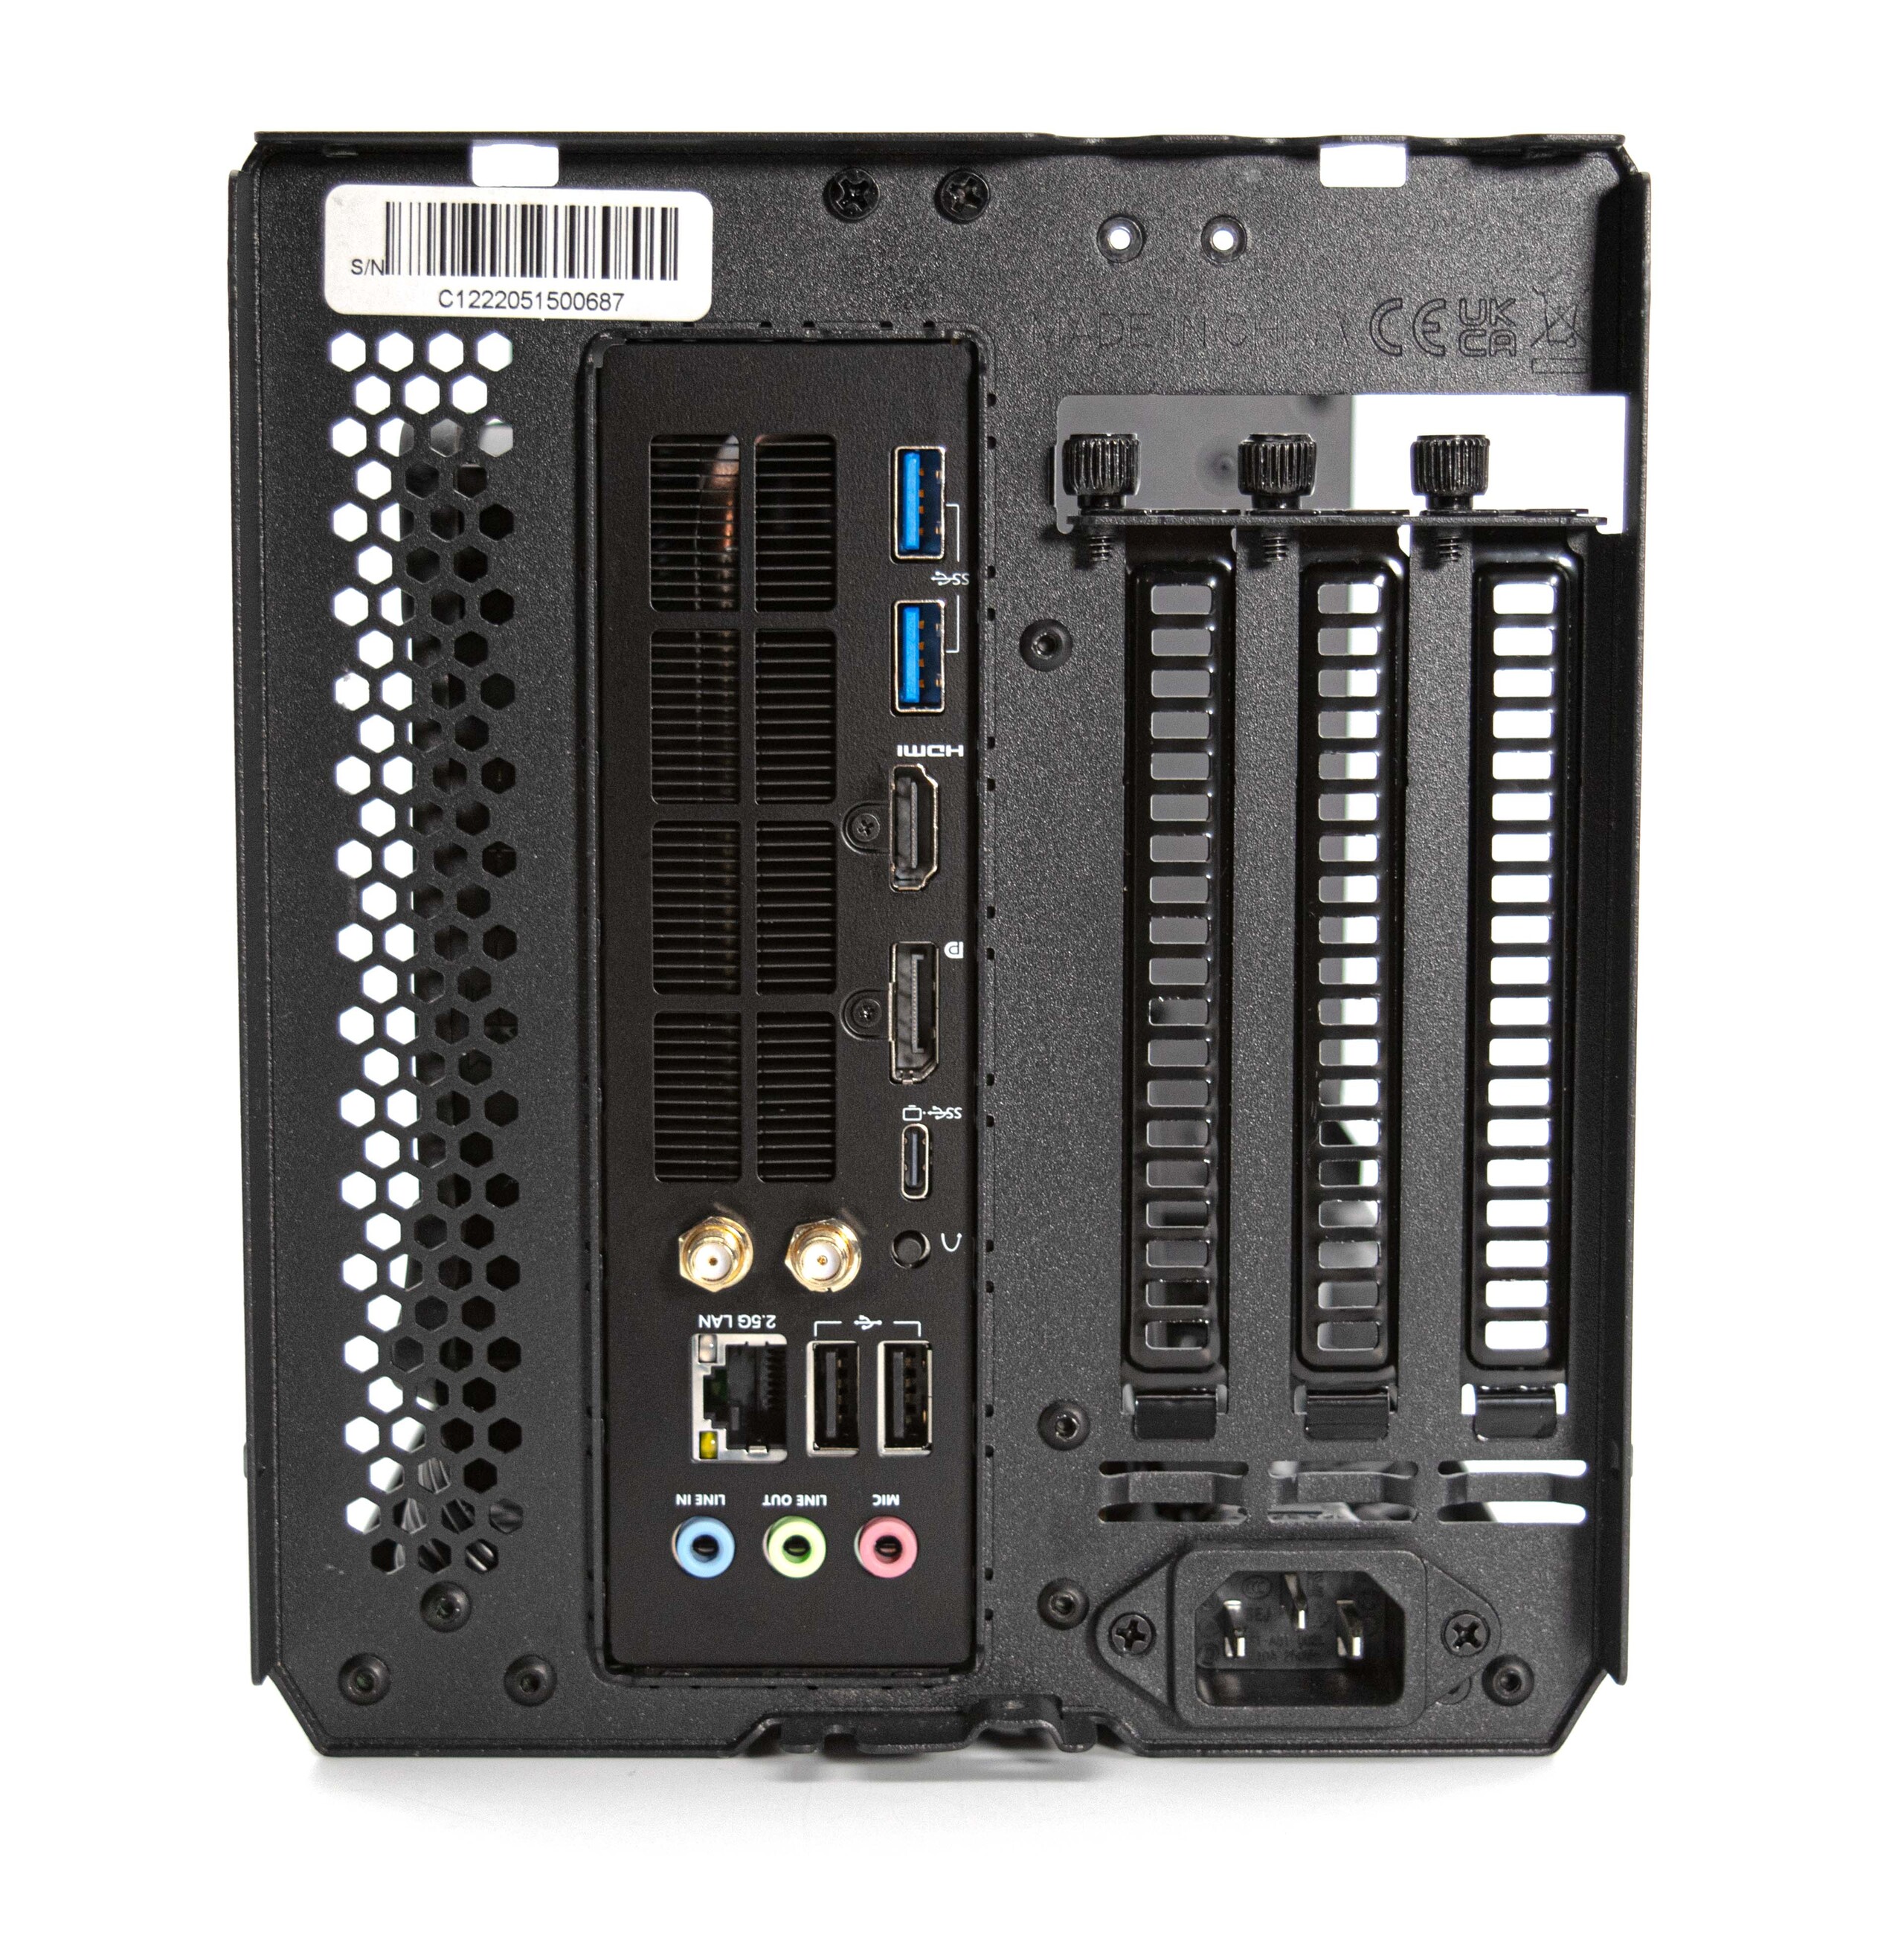
För att säkerställa testets äkthet valde vi att köra alla tester utan ett dedikerat grafikkort. Vi använde Phanteks Enthoo Evolv Shift XT-chassit, valt för sin kompakta design, för att ge en solid grund.
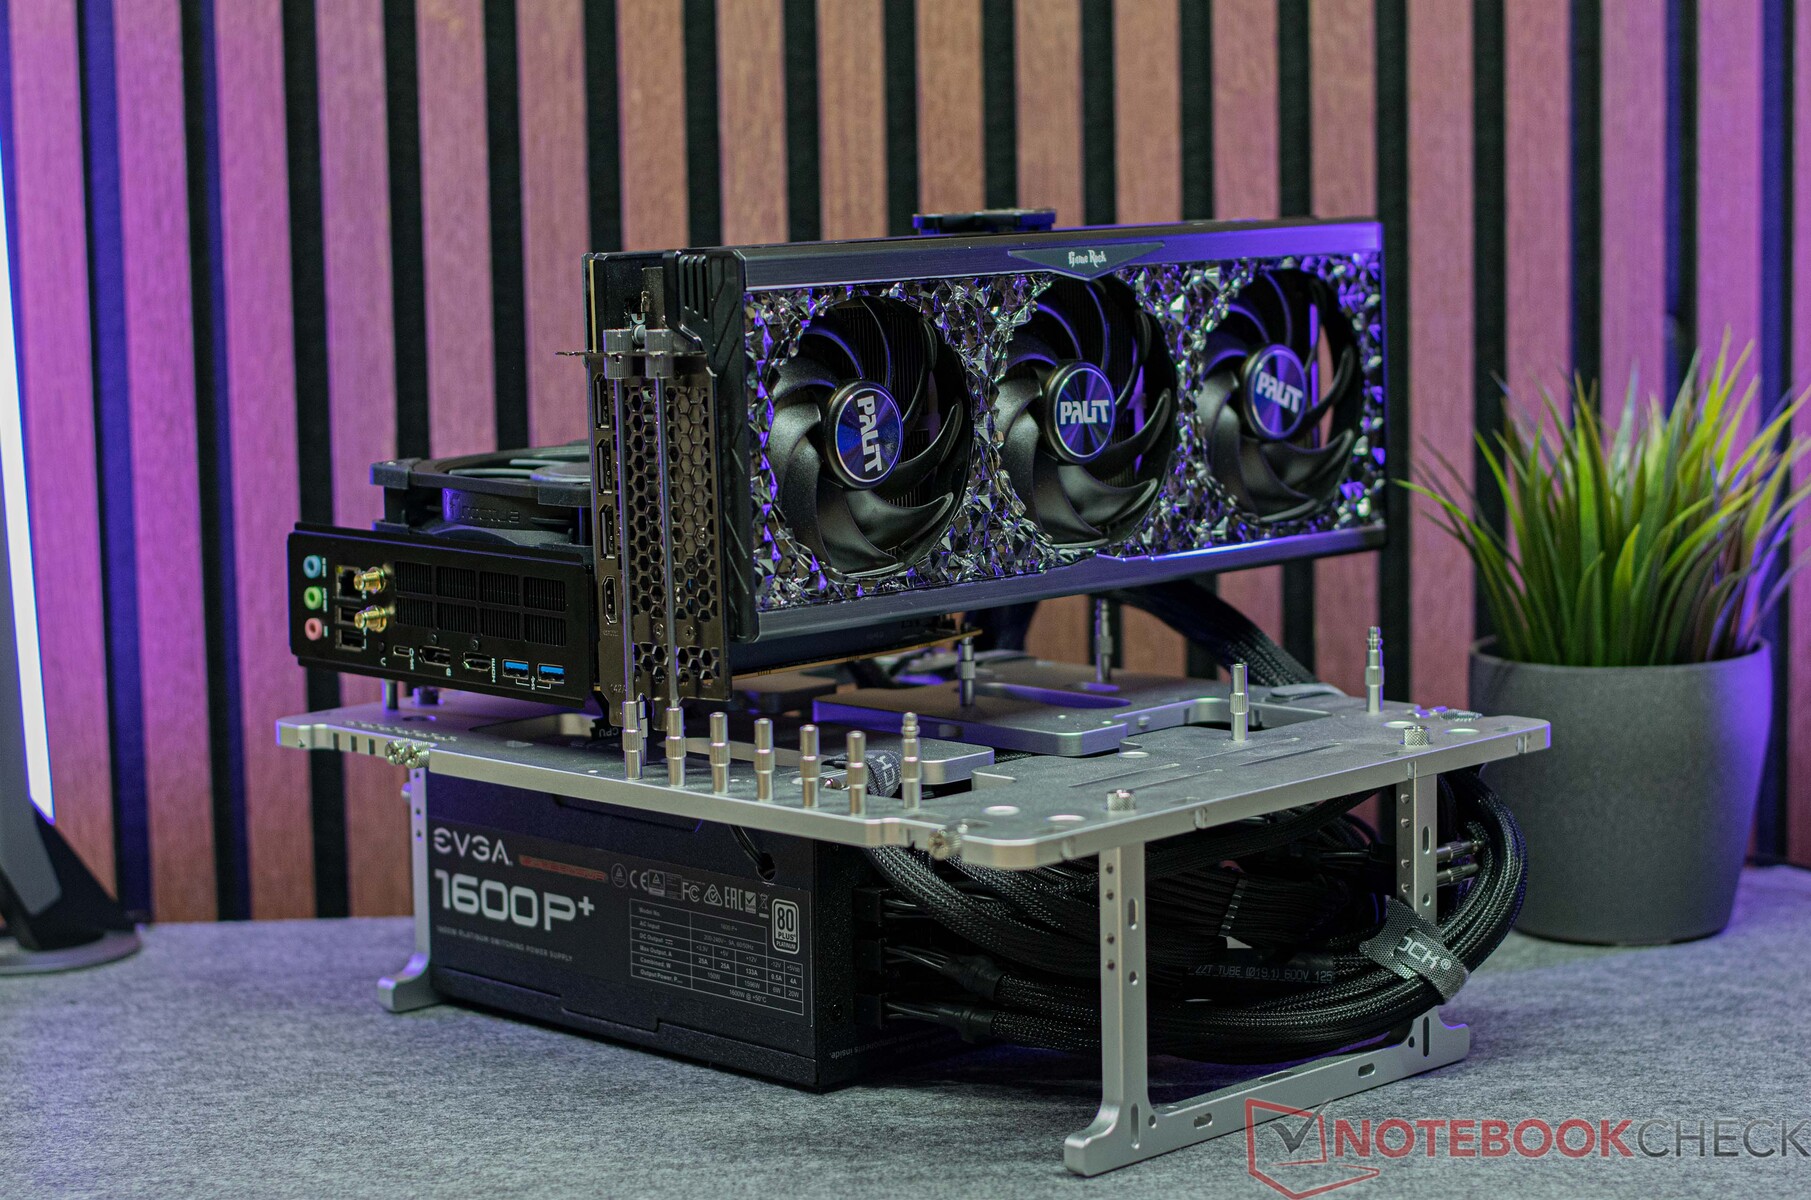
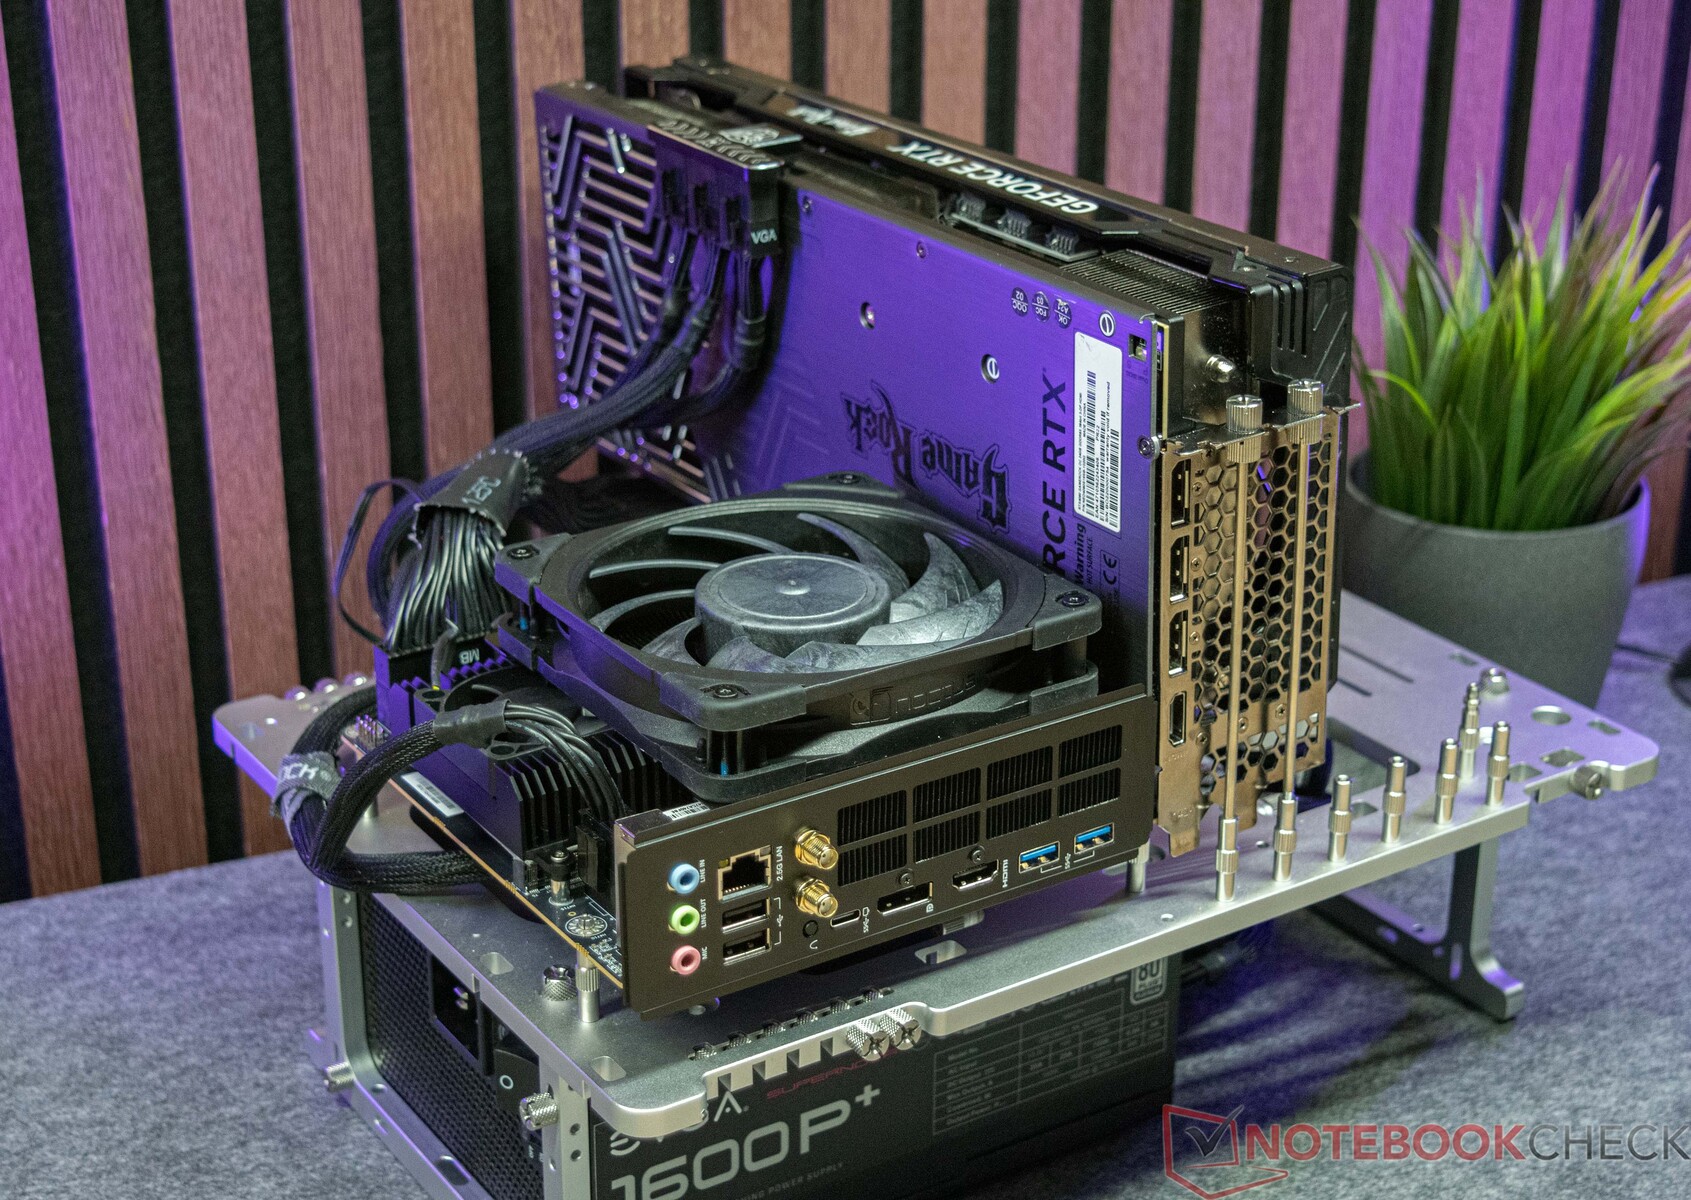
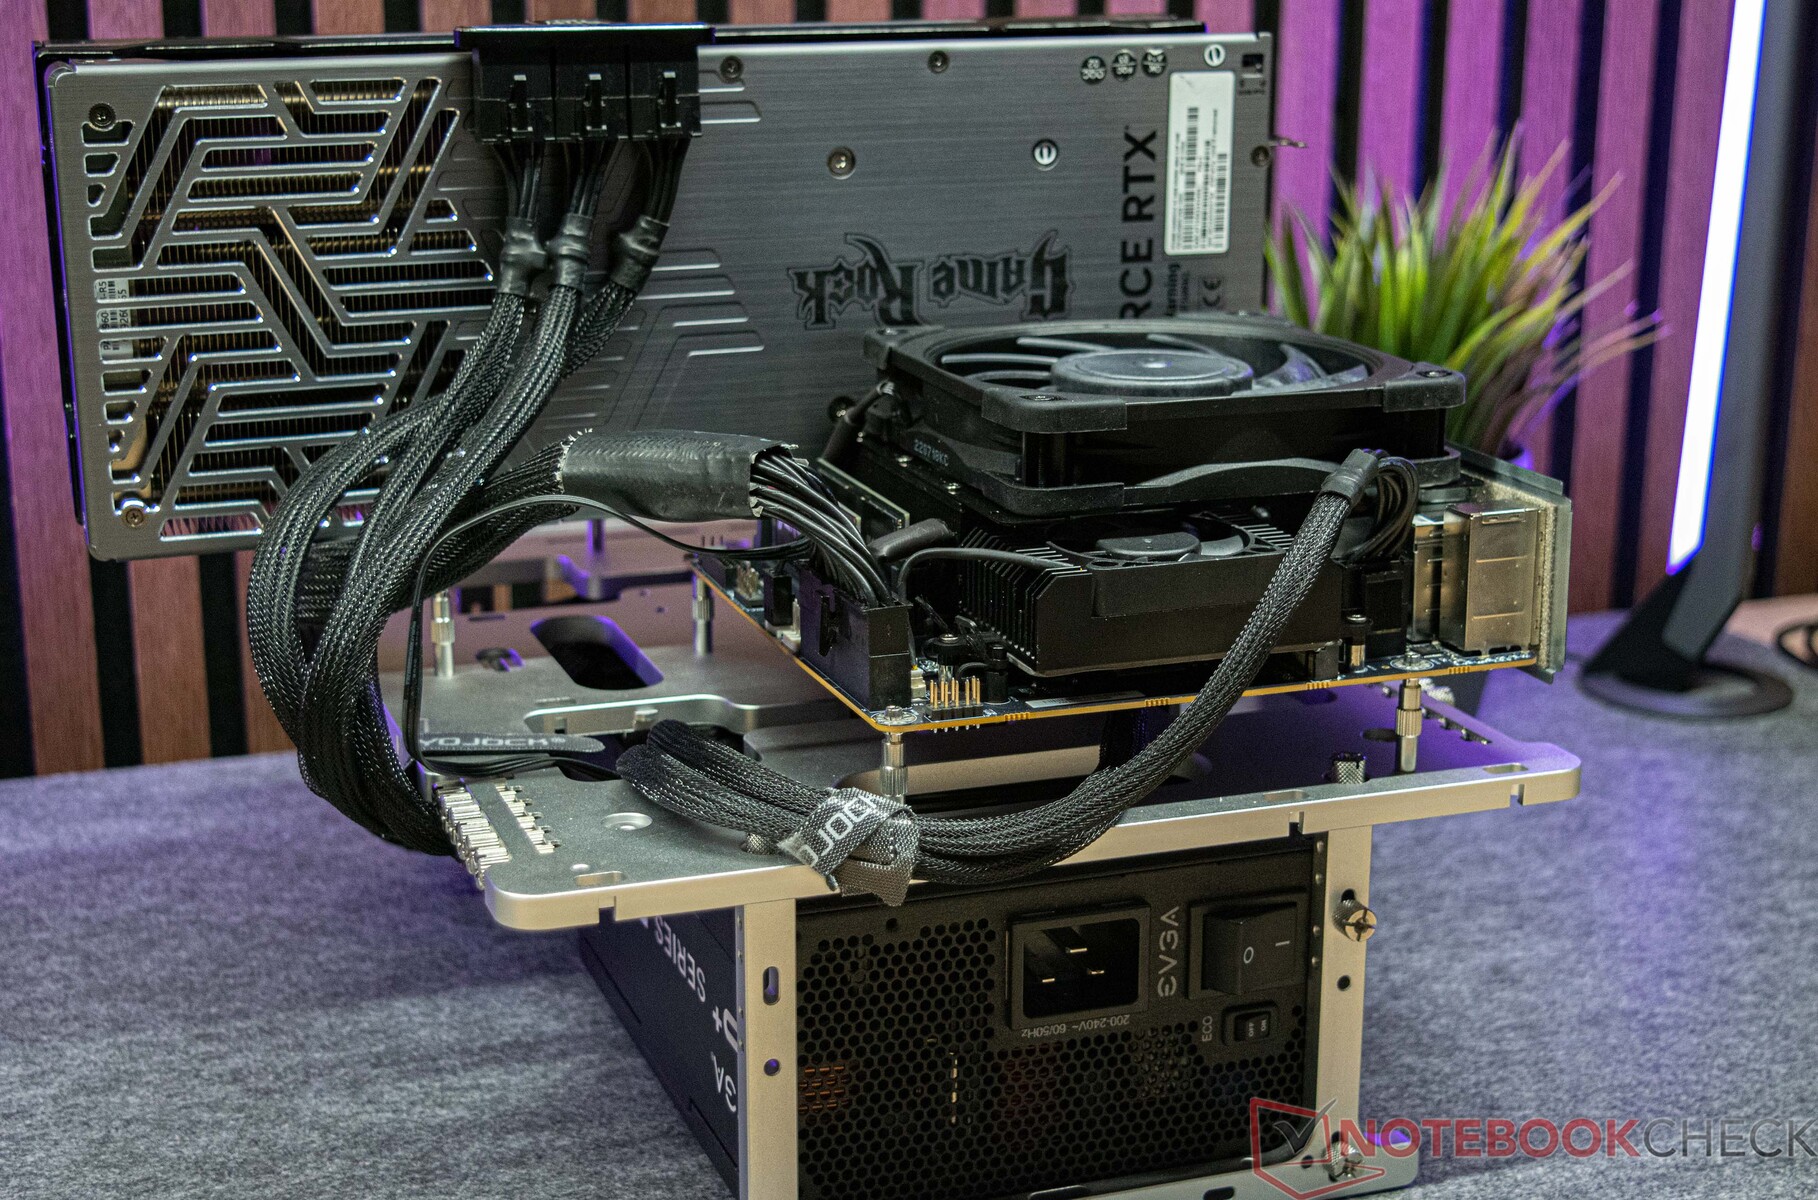
För prestandajämförelsen med ett dedikerat grafikkort utvärderade vi dessutom Minisforum BD770i tillsammans med Palit GeForce RTX 4090 GameRock OC i en öppen installation. Storleken på grafikkortet förhindrade dess installation i Phanteks Enthoo Evolv Shift XT. Fodralet rymmer grafikkort med en längd som inte överstiger 32,4 centimeter.
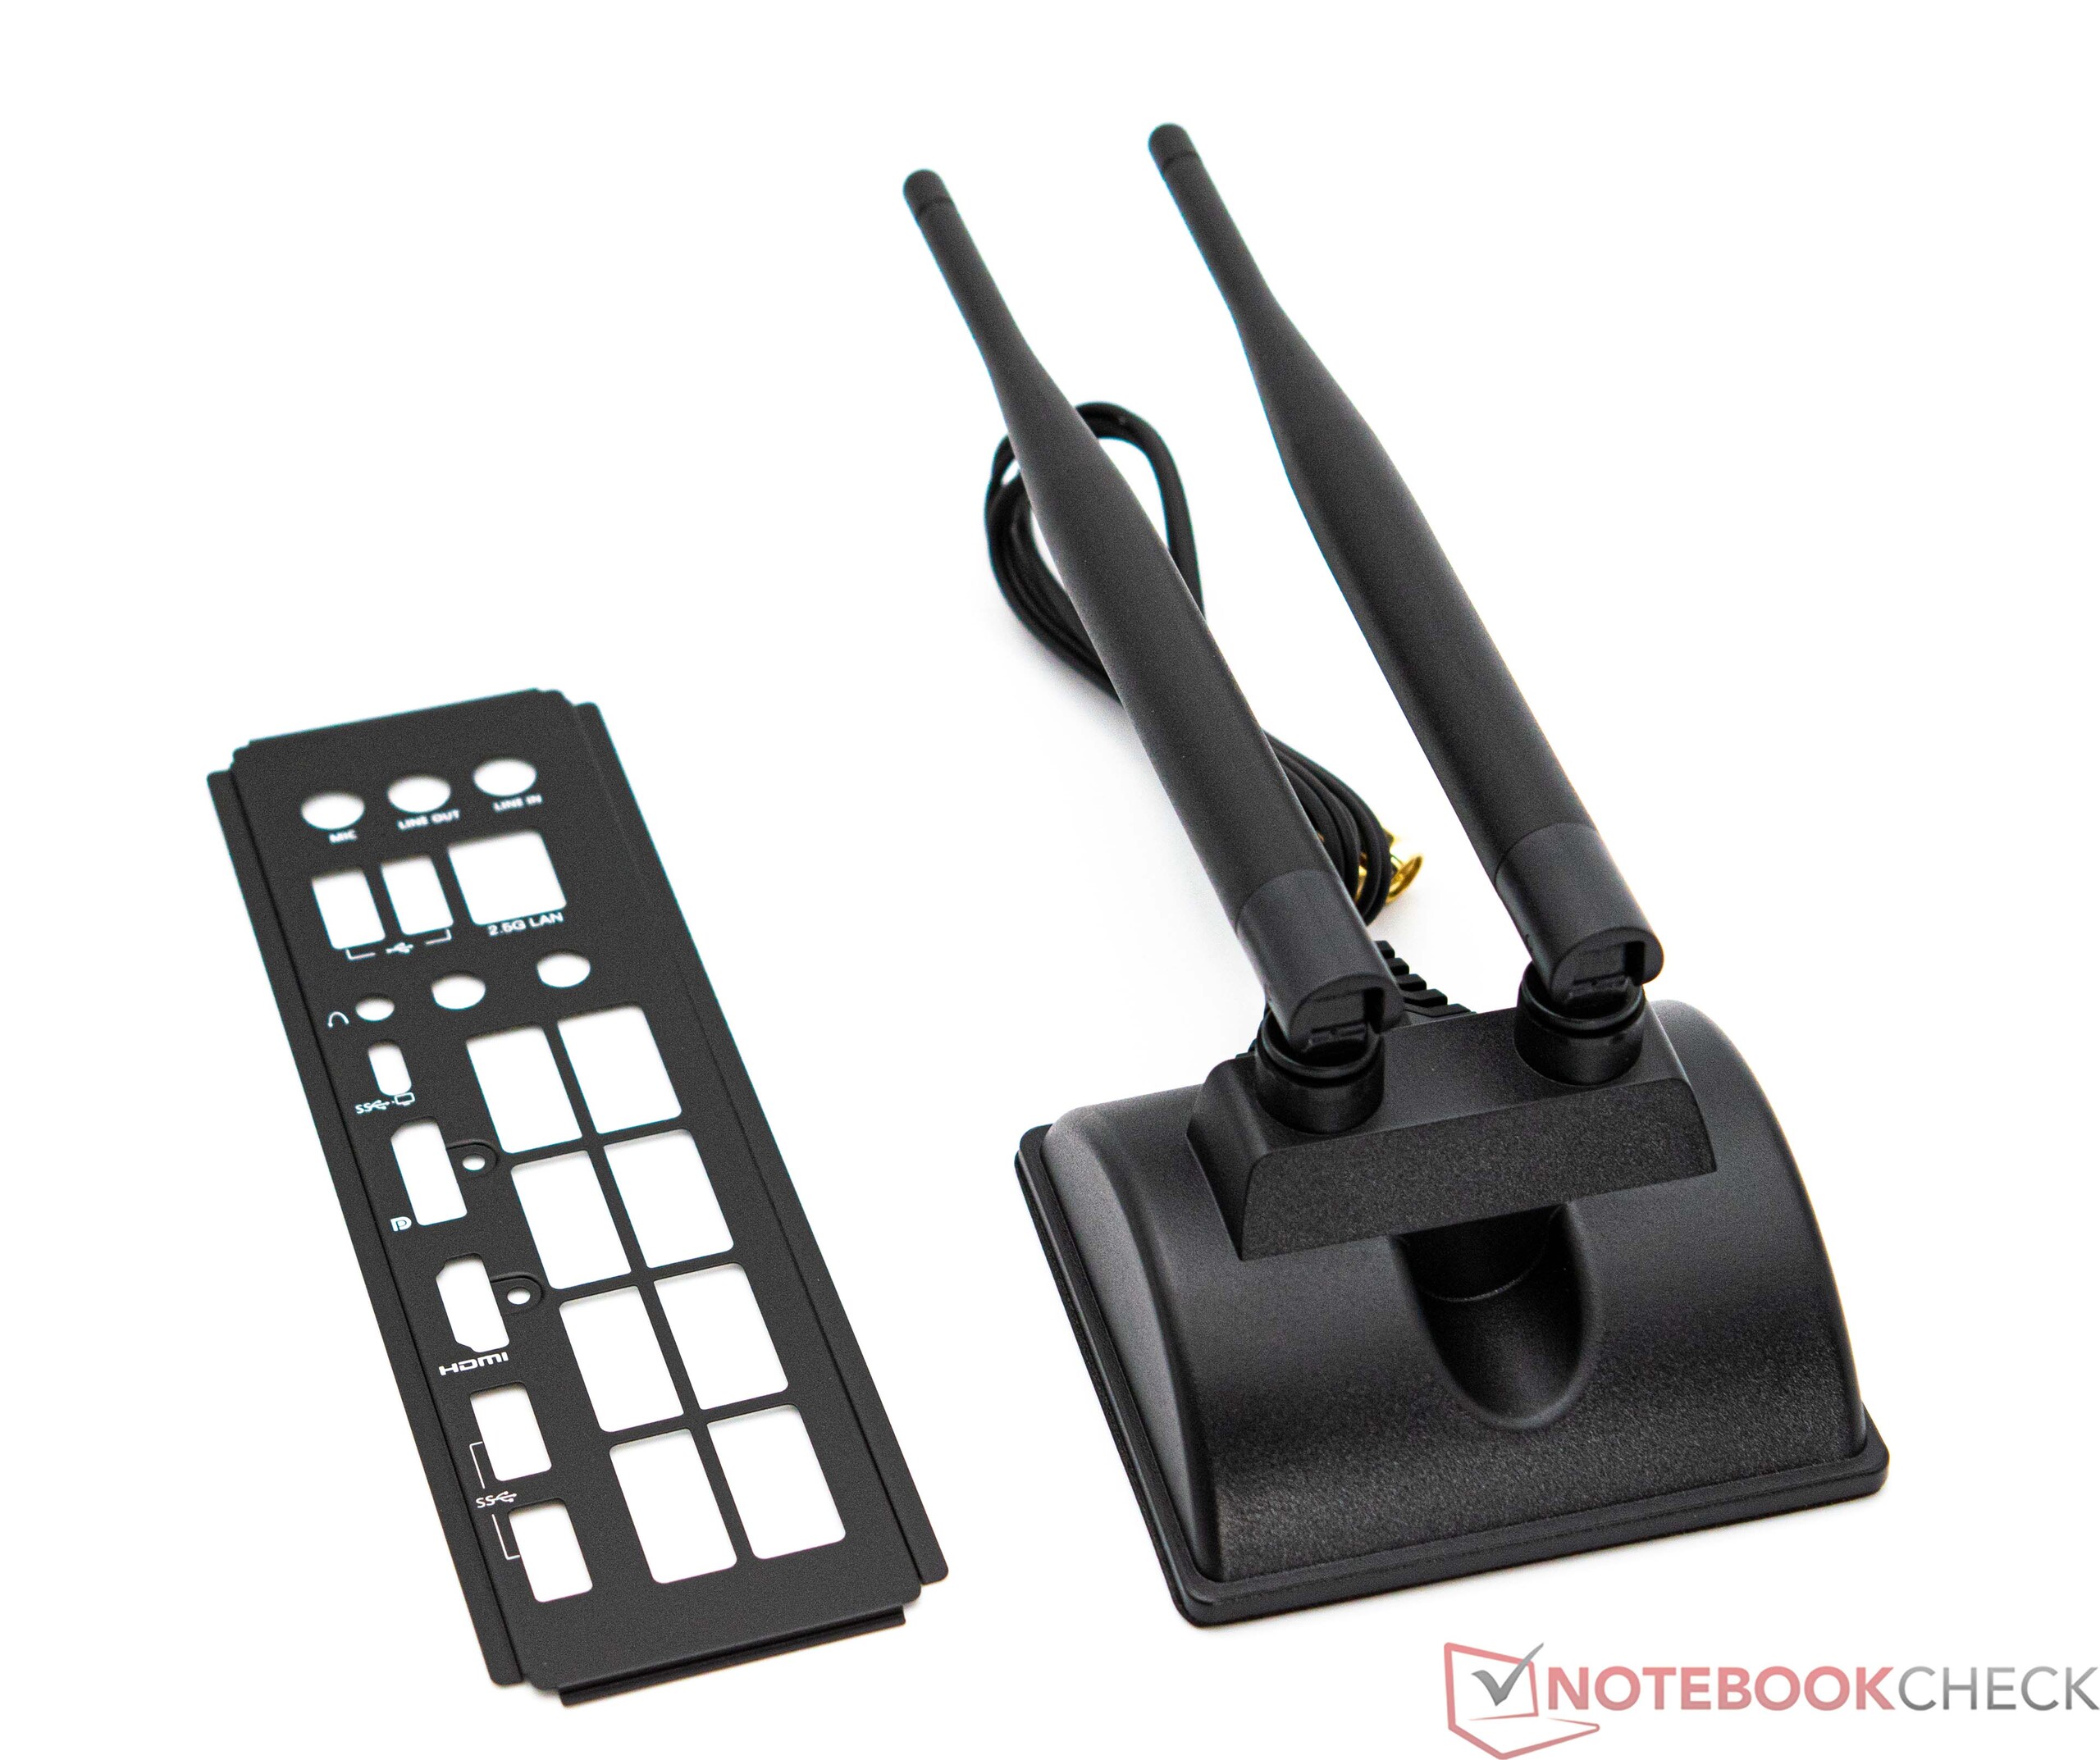
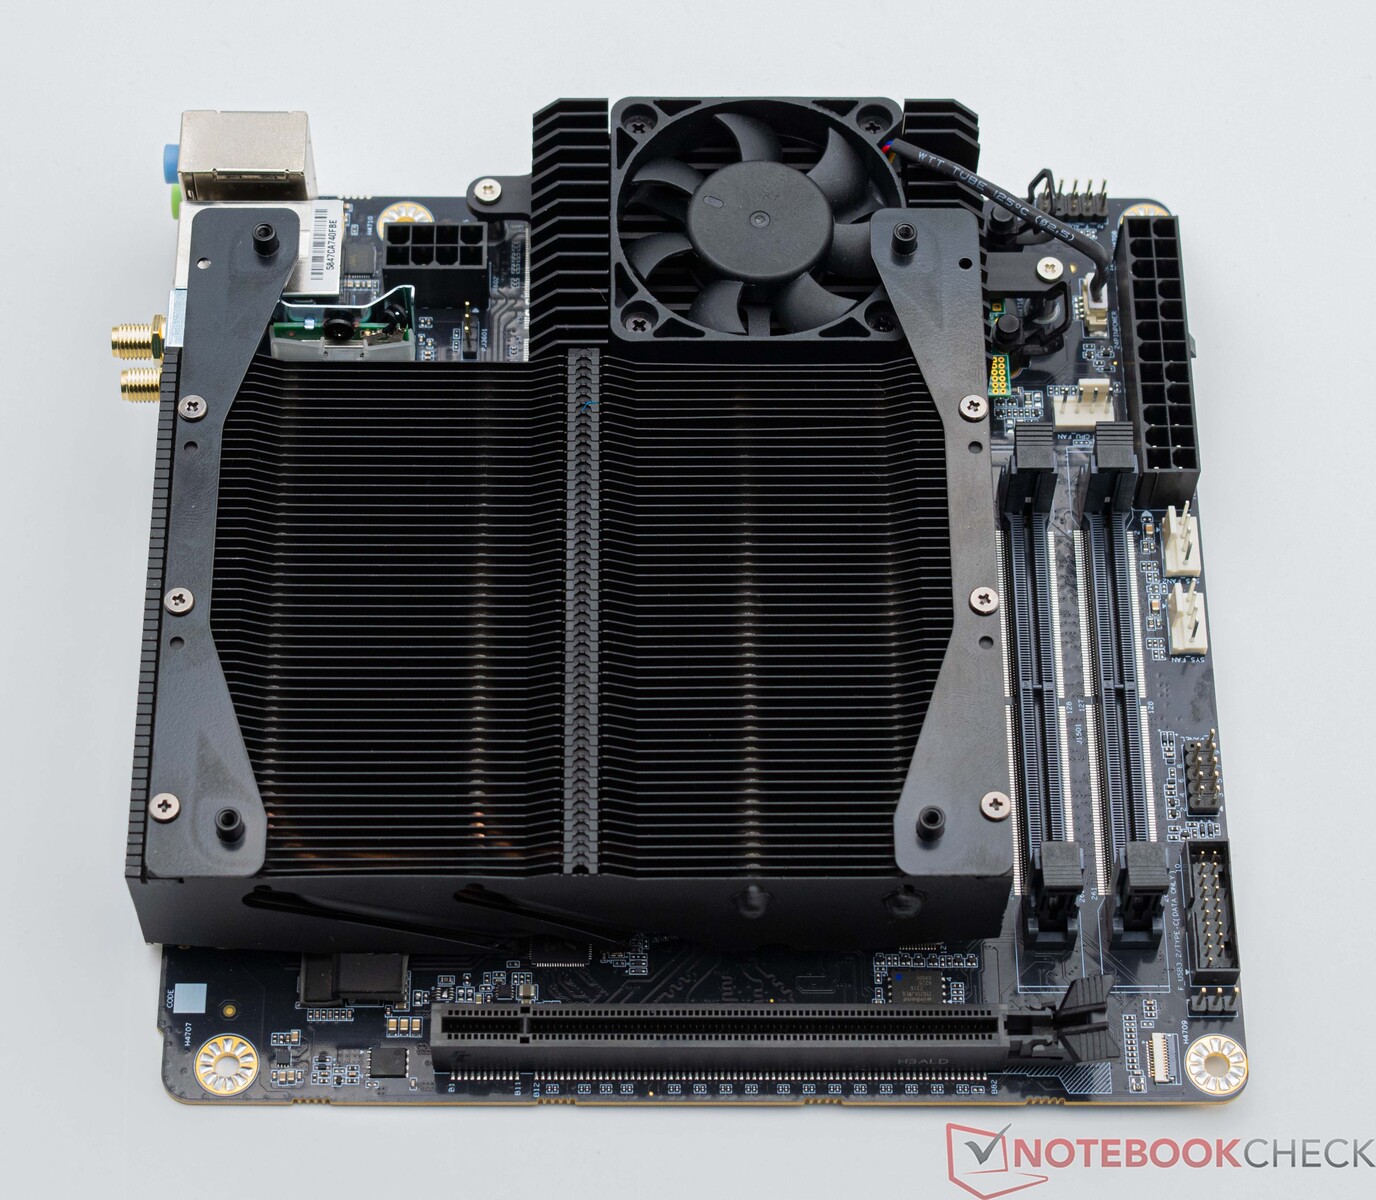
Omfattning av leveransen
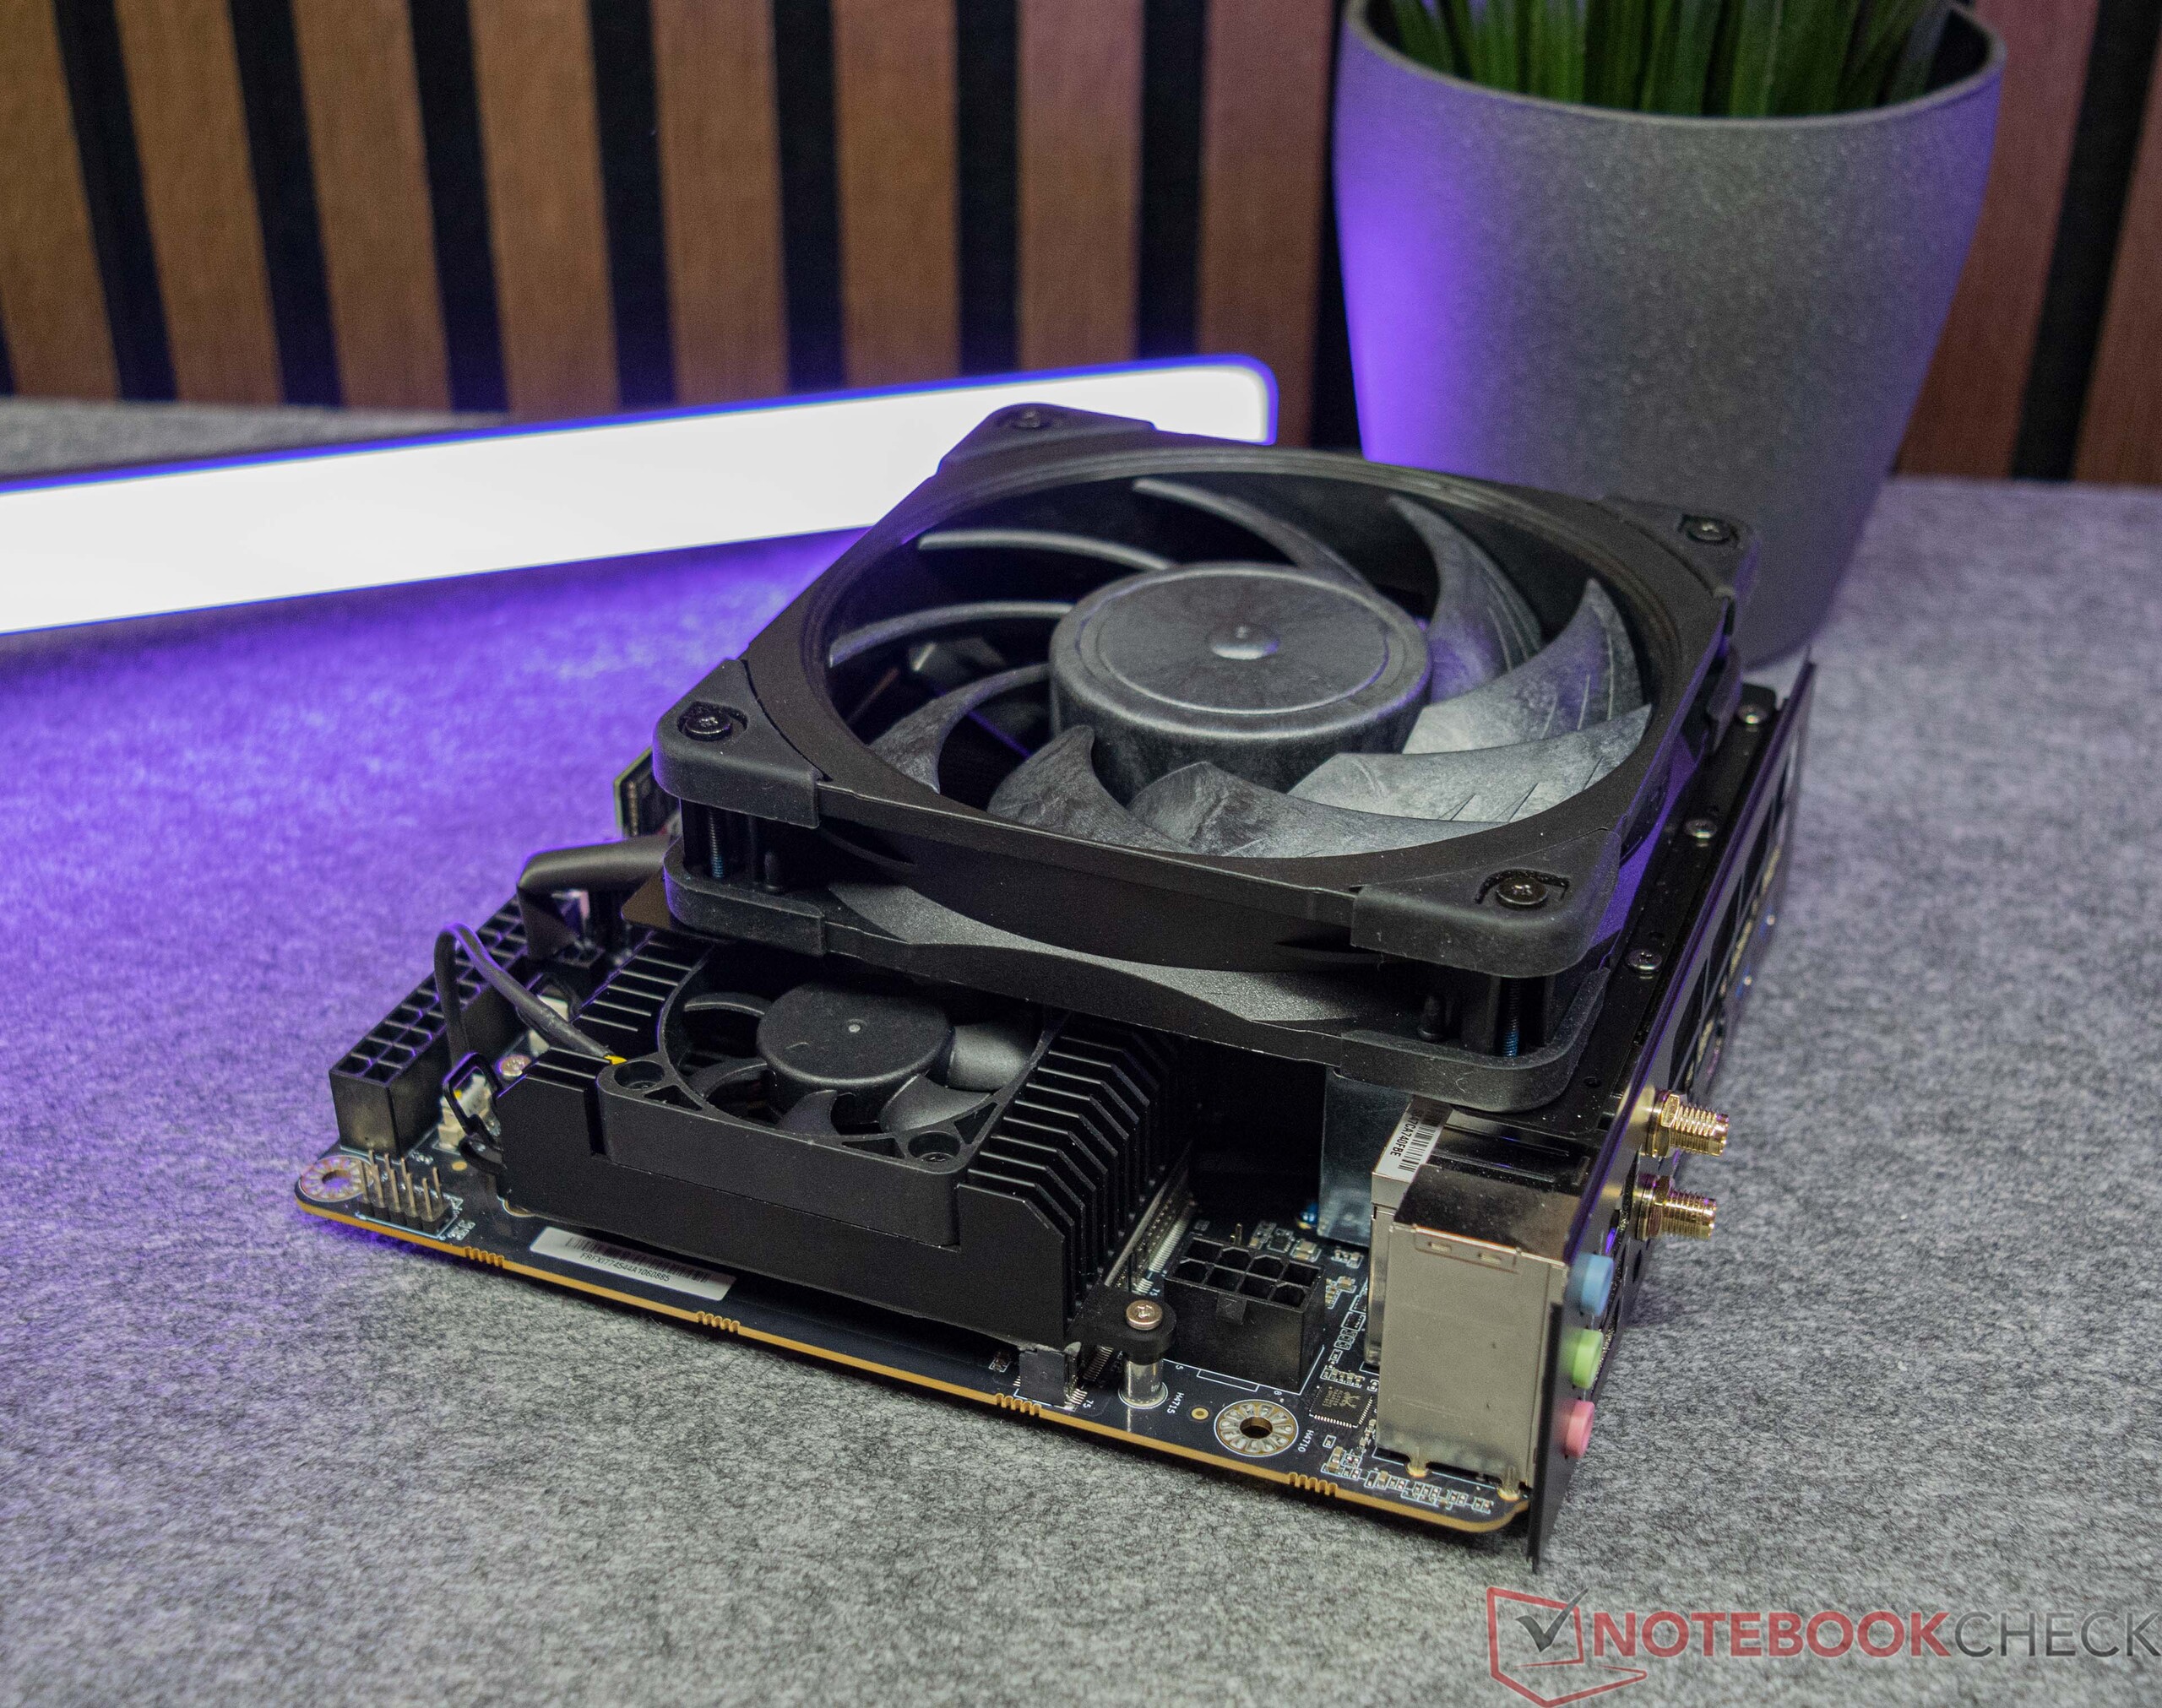
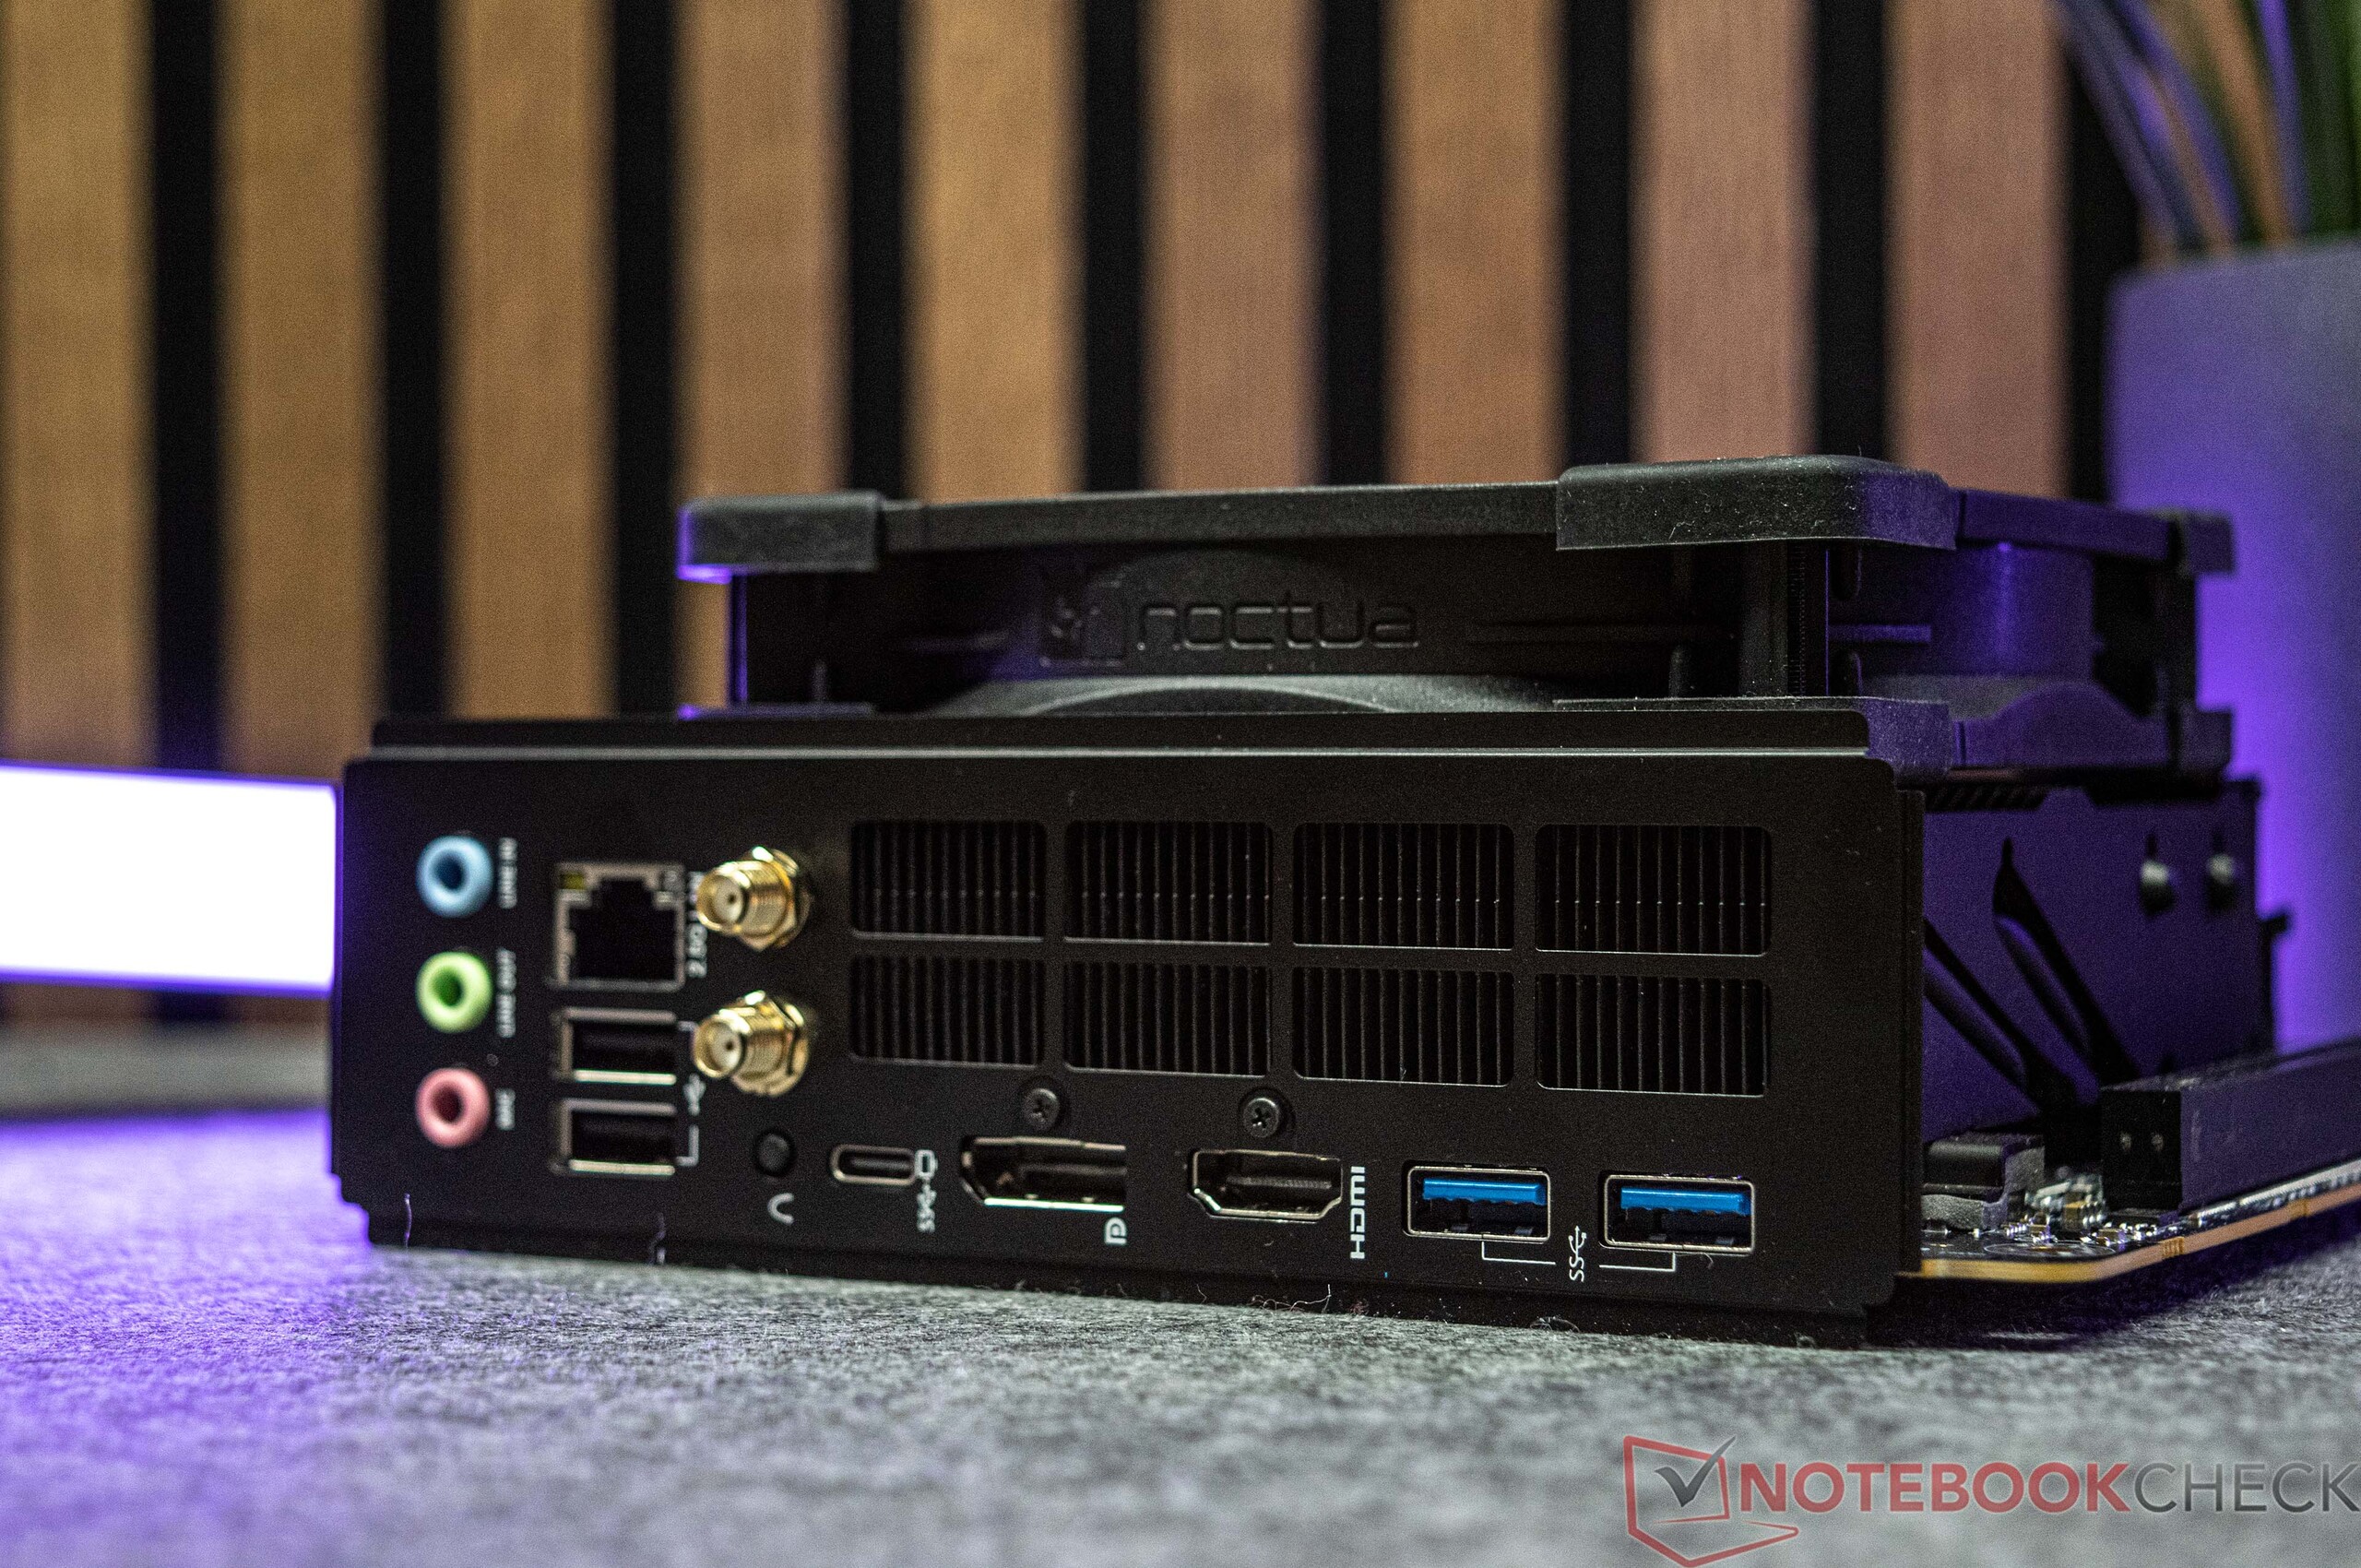
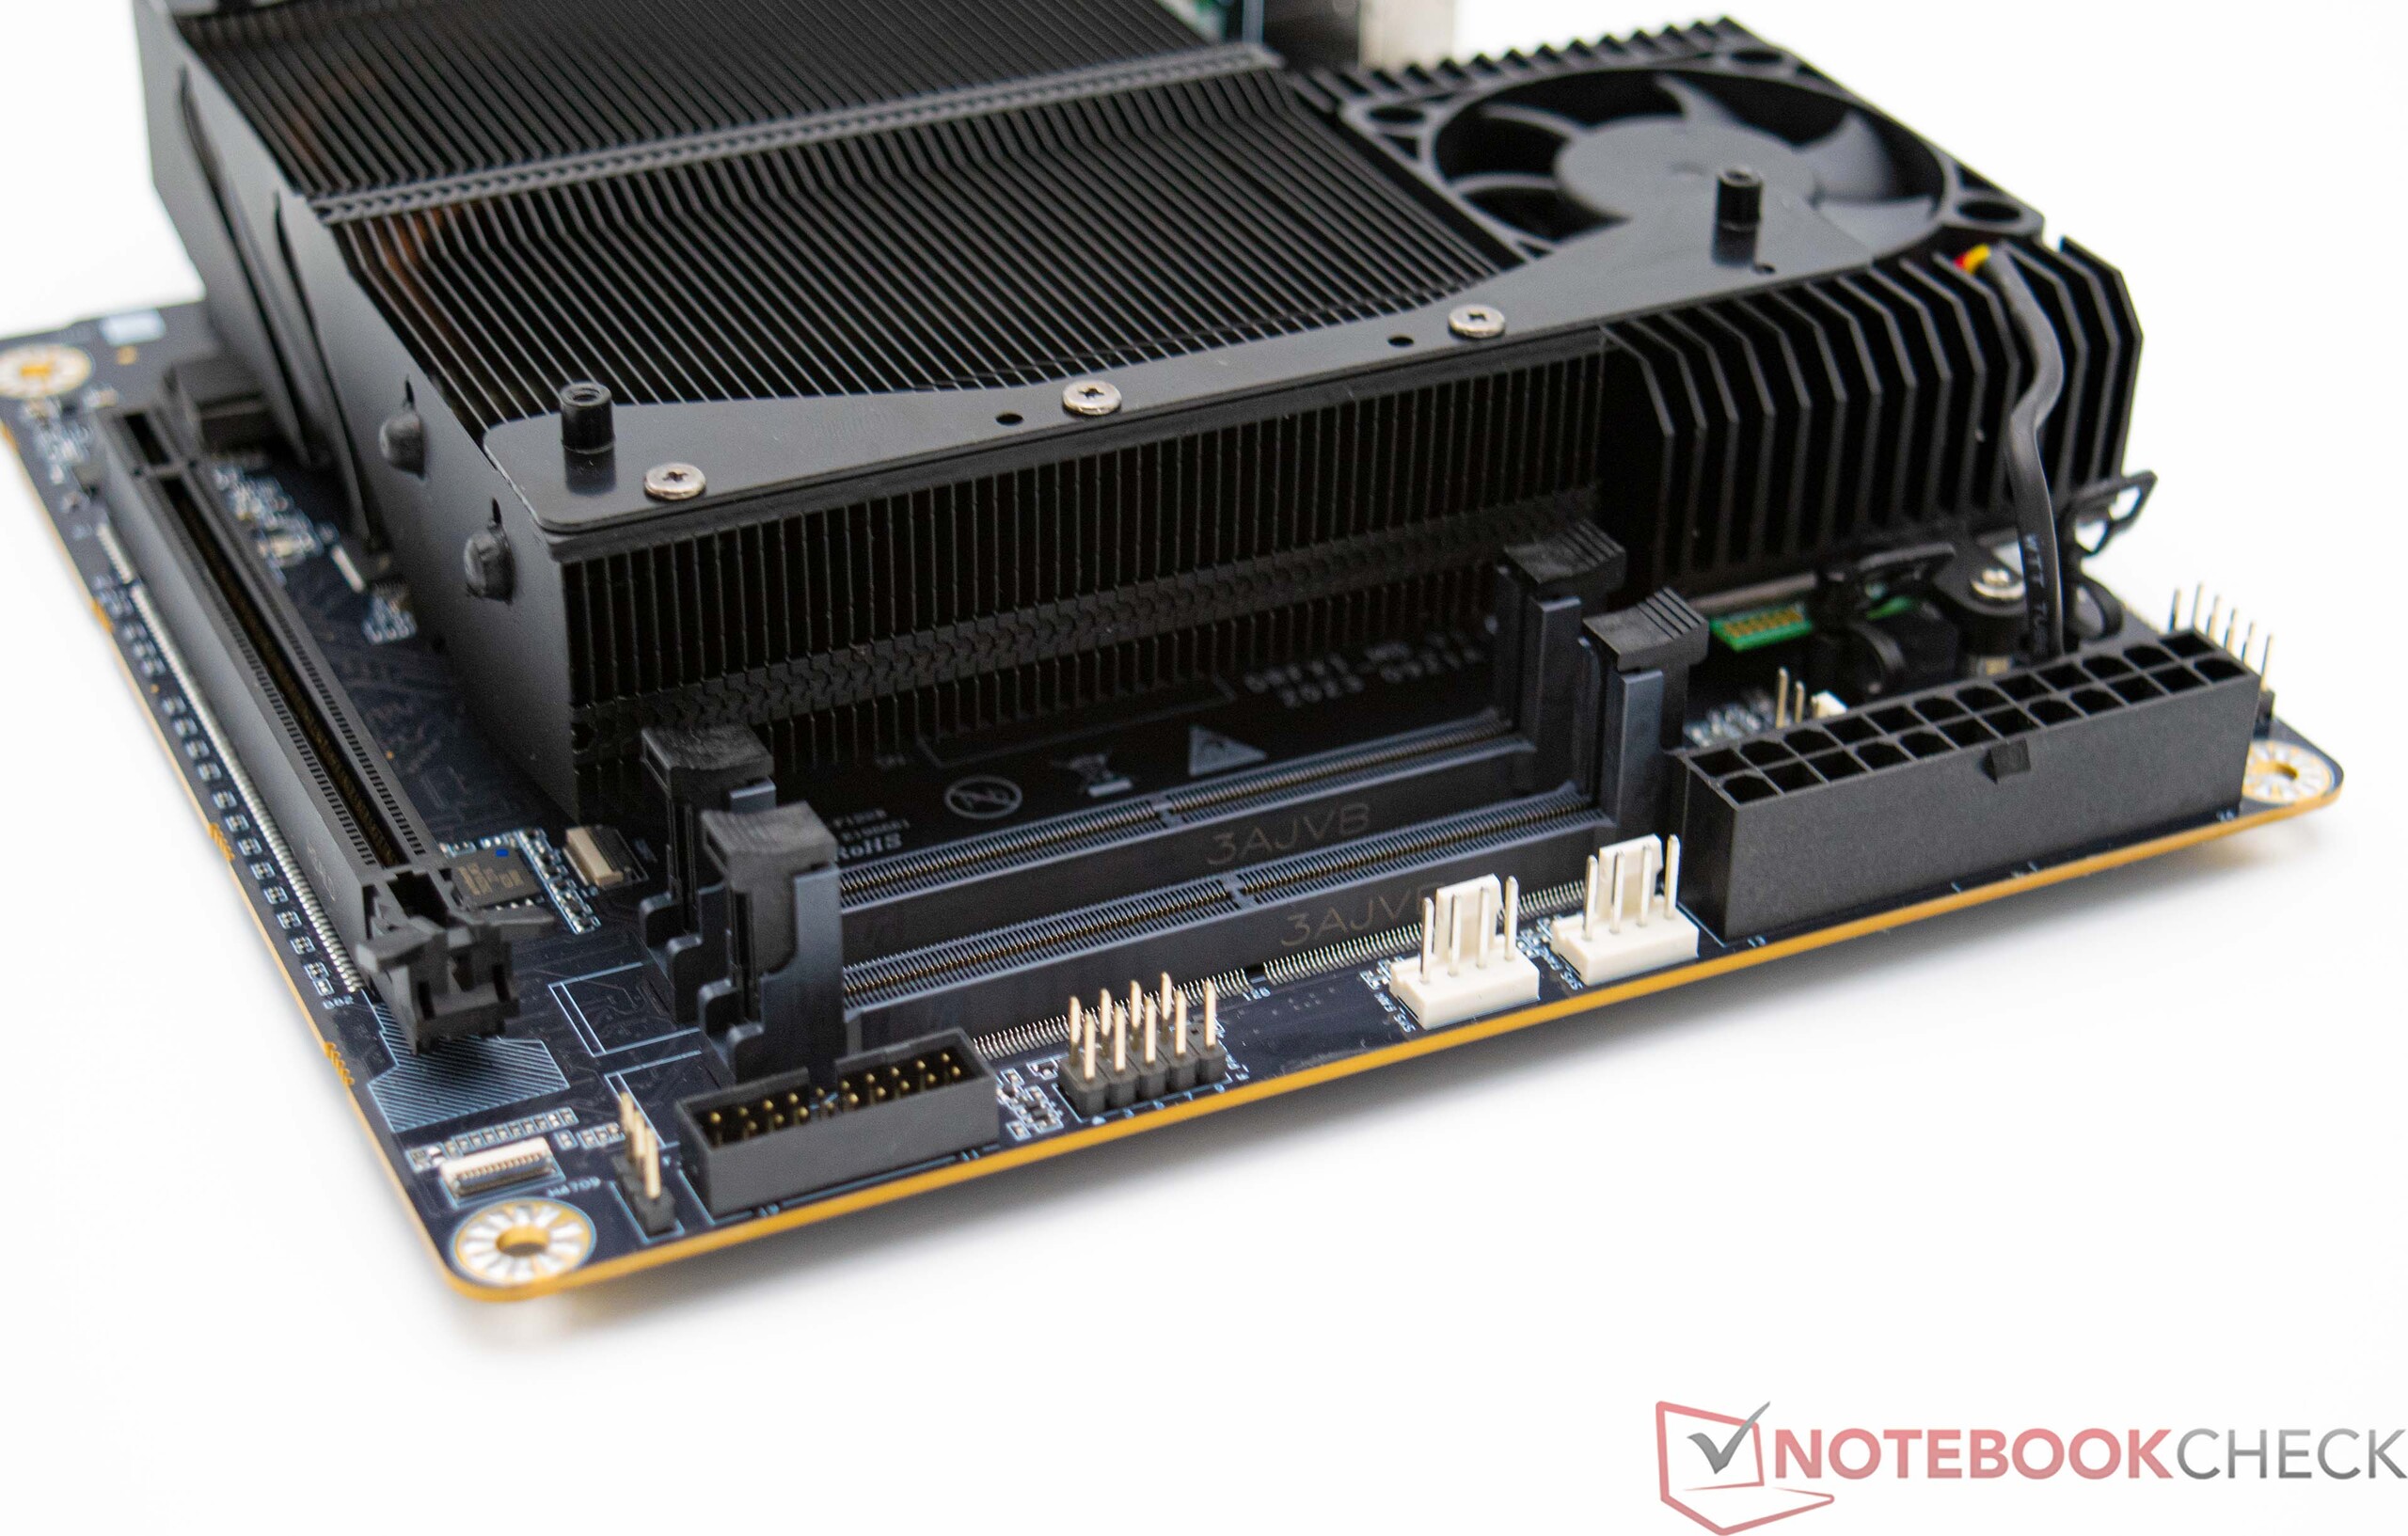
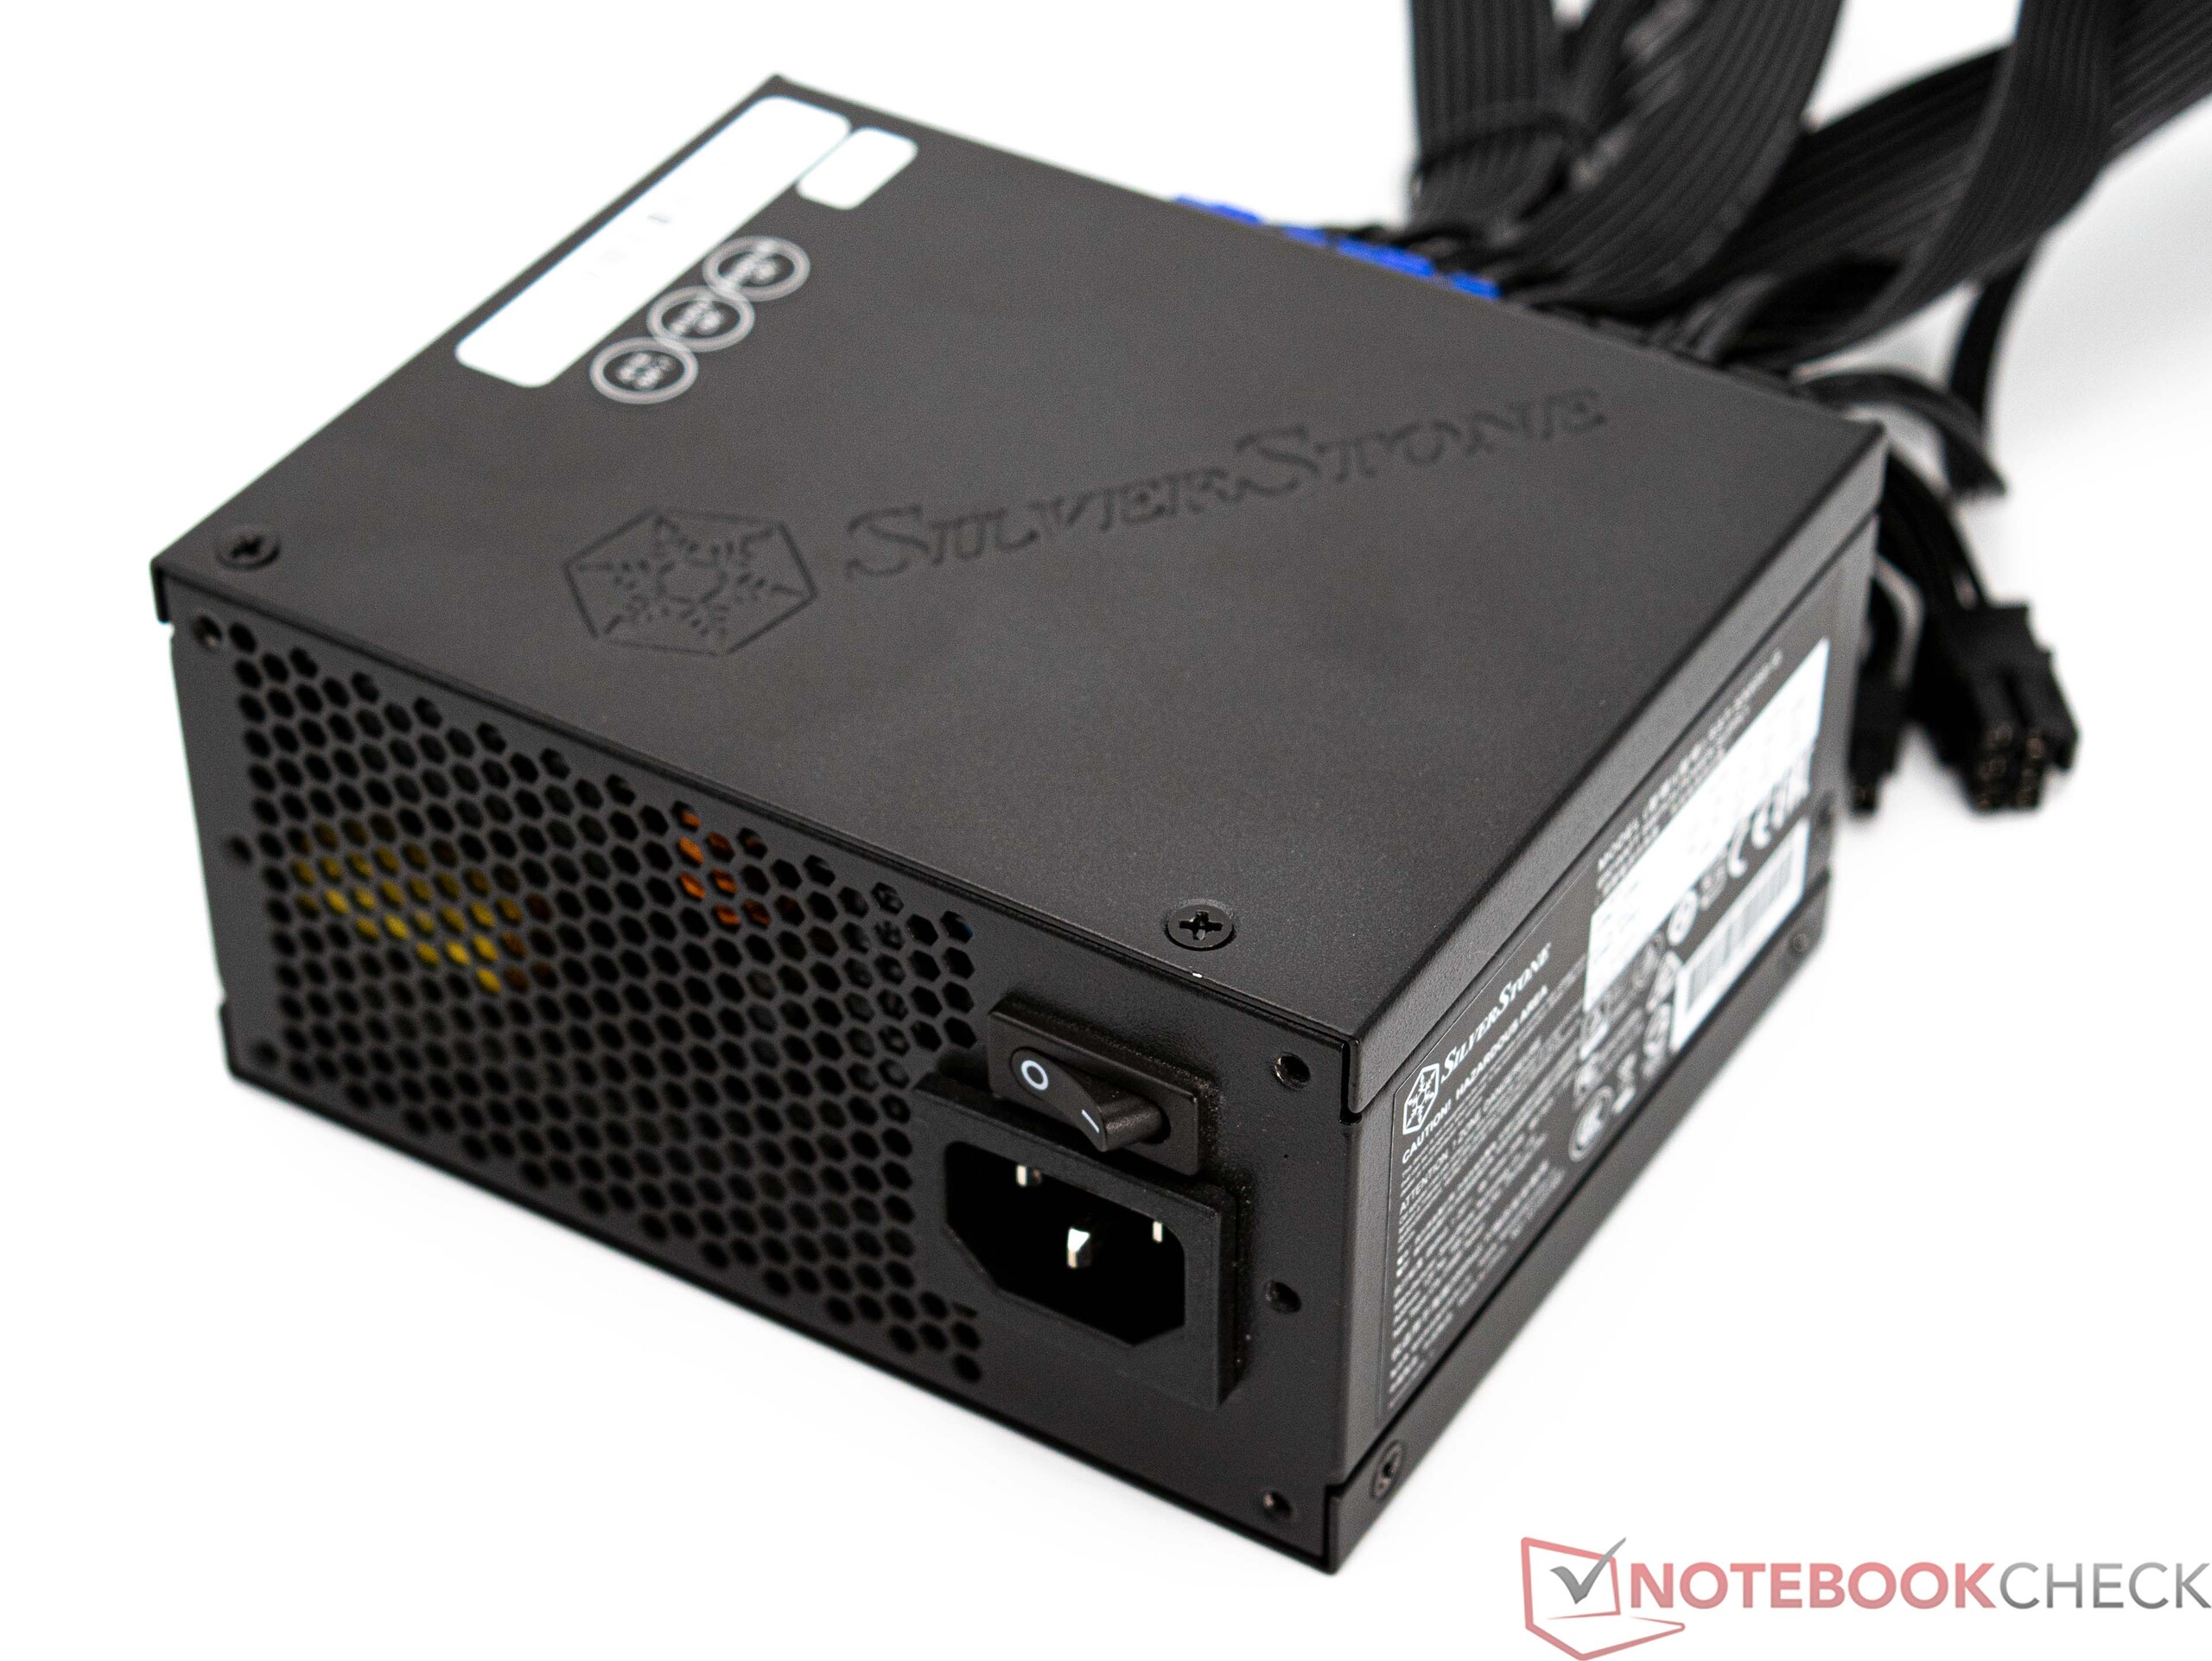
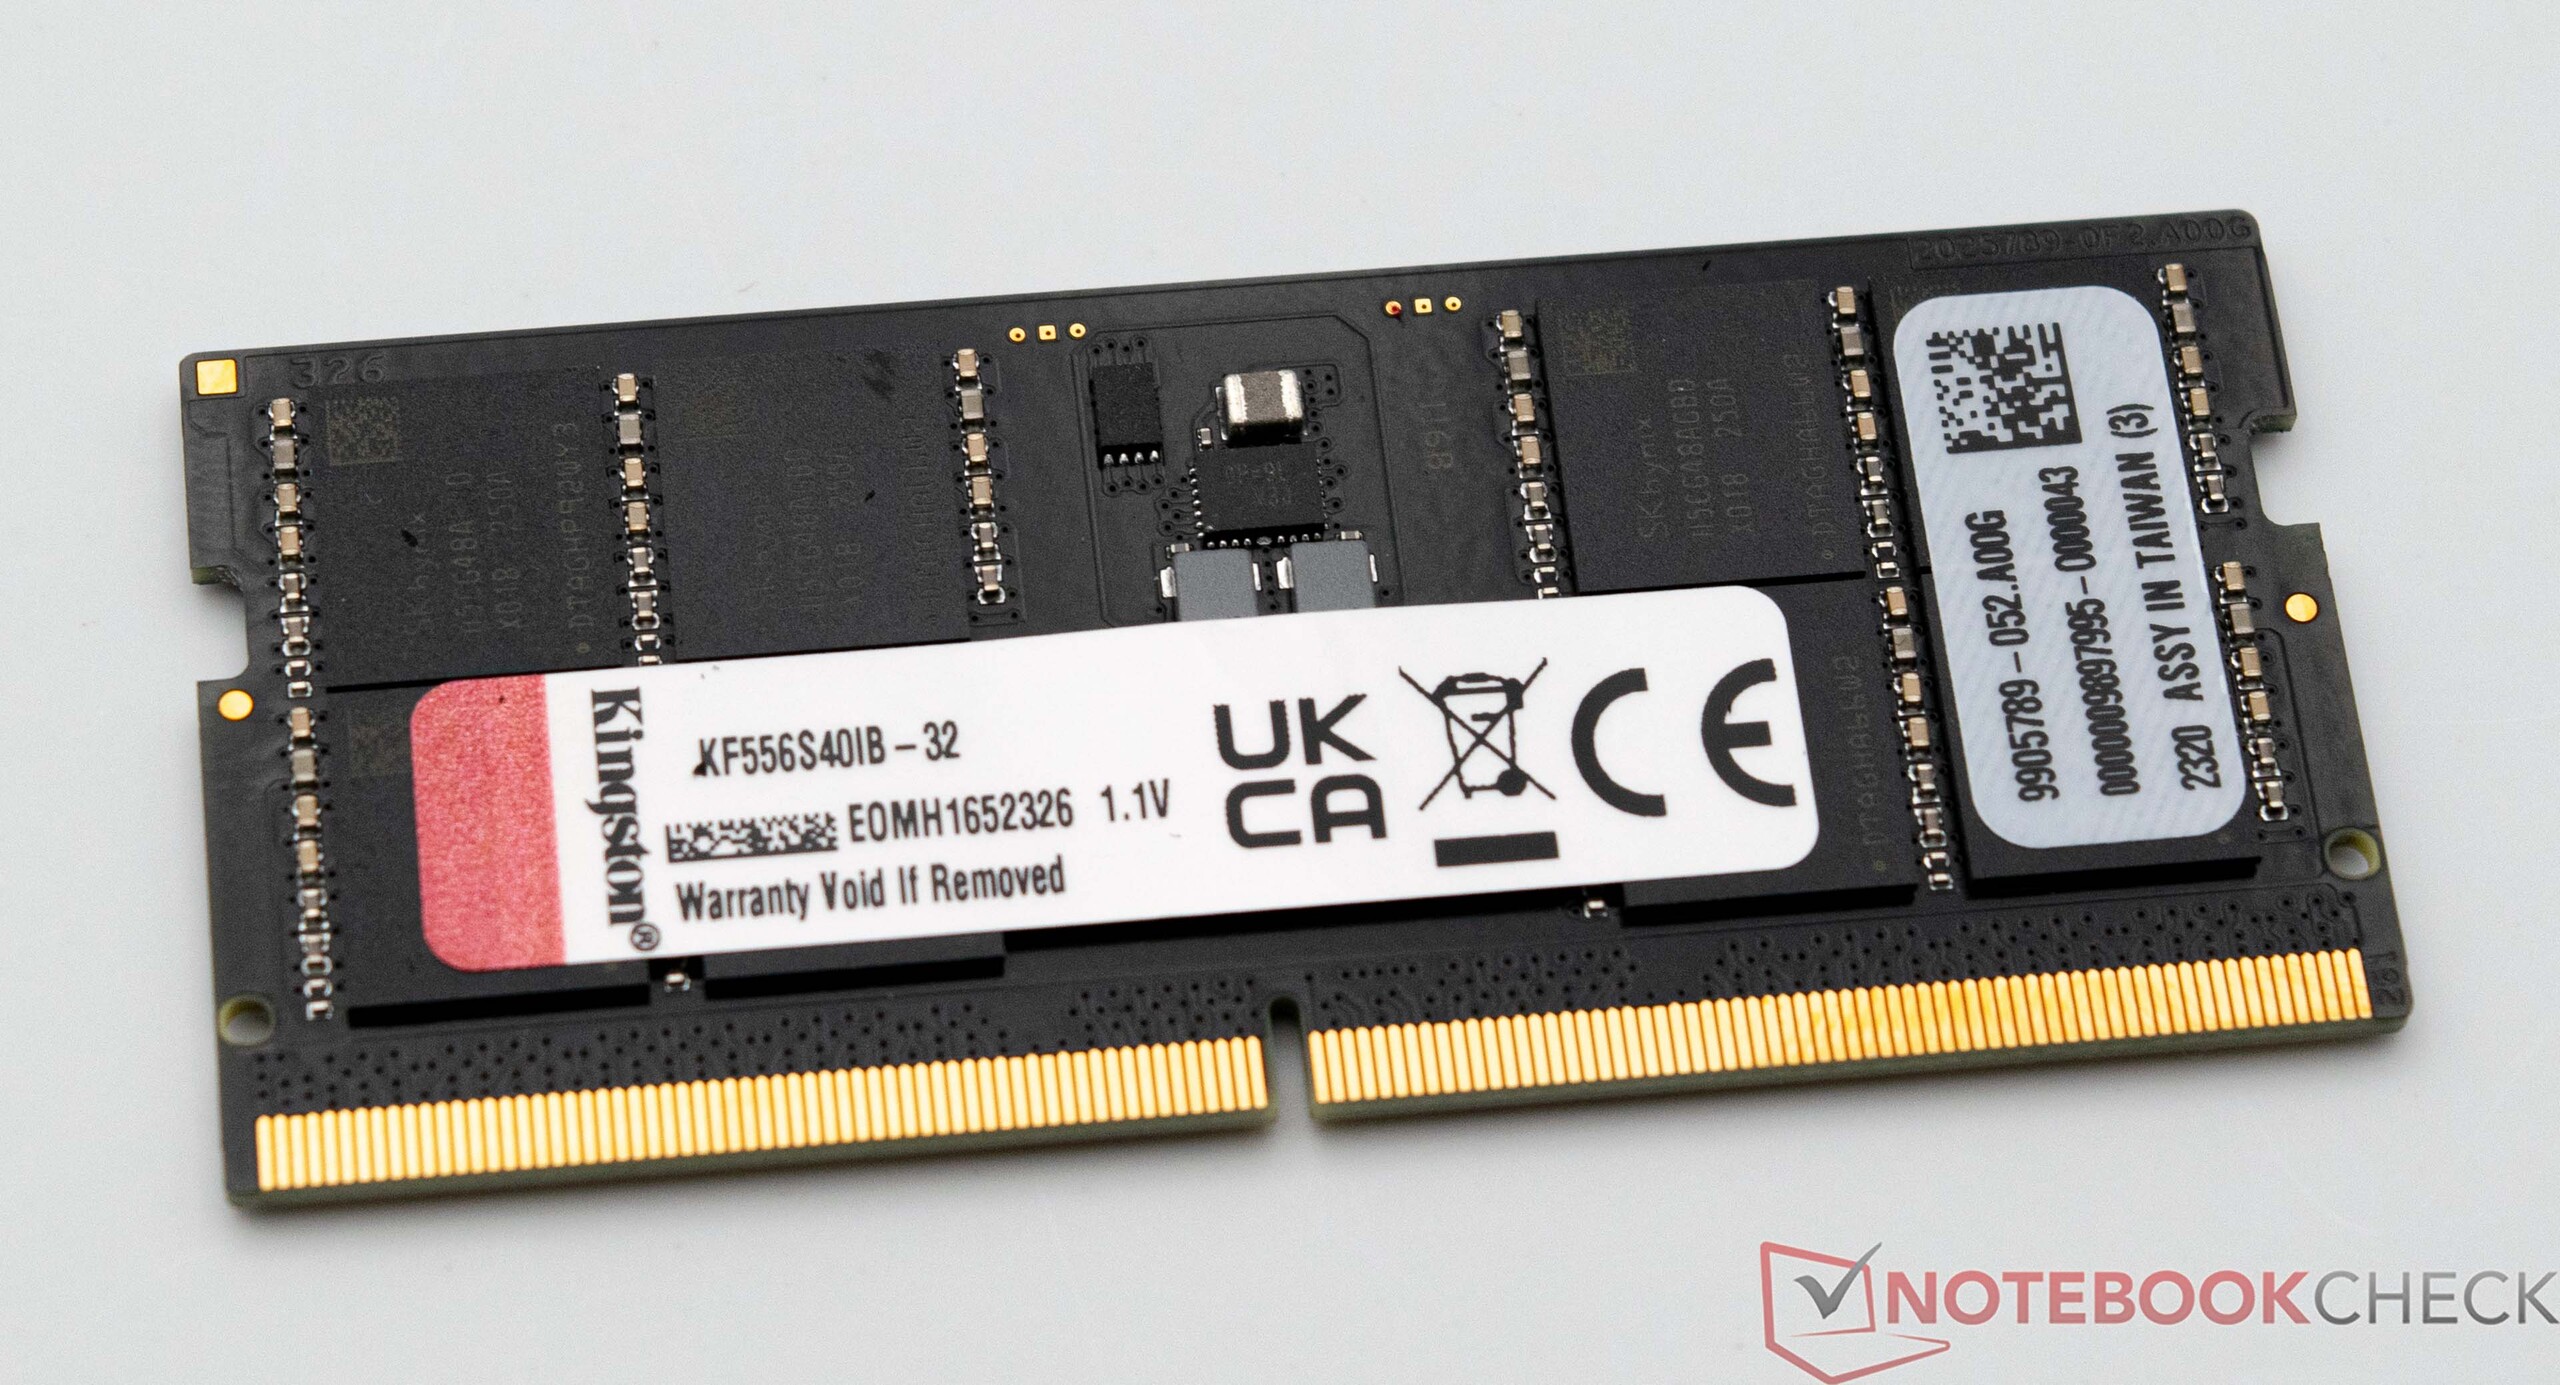
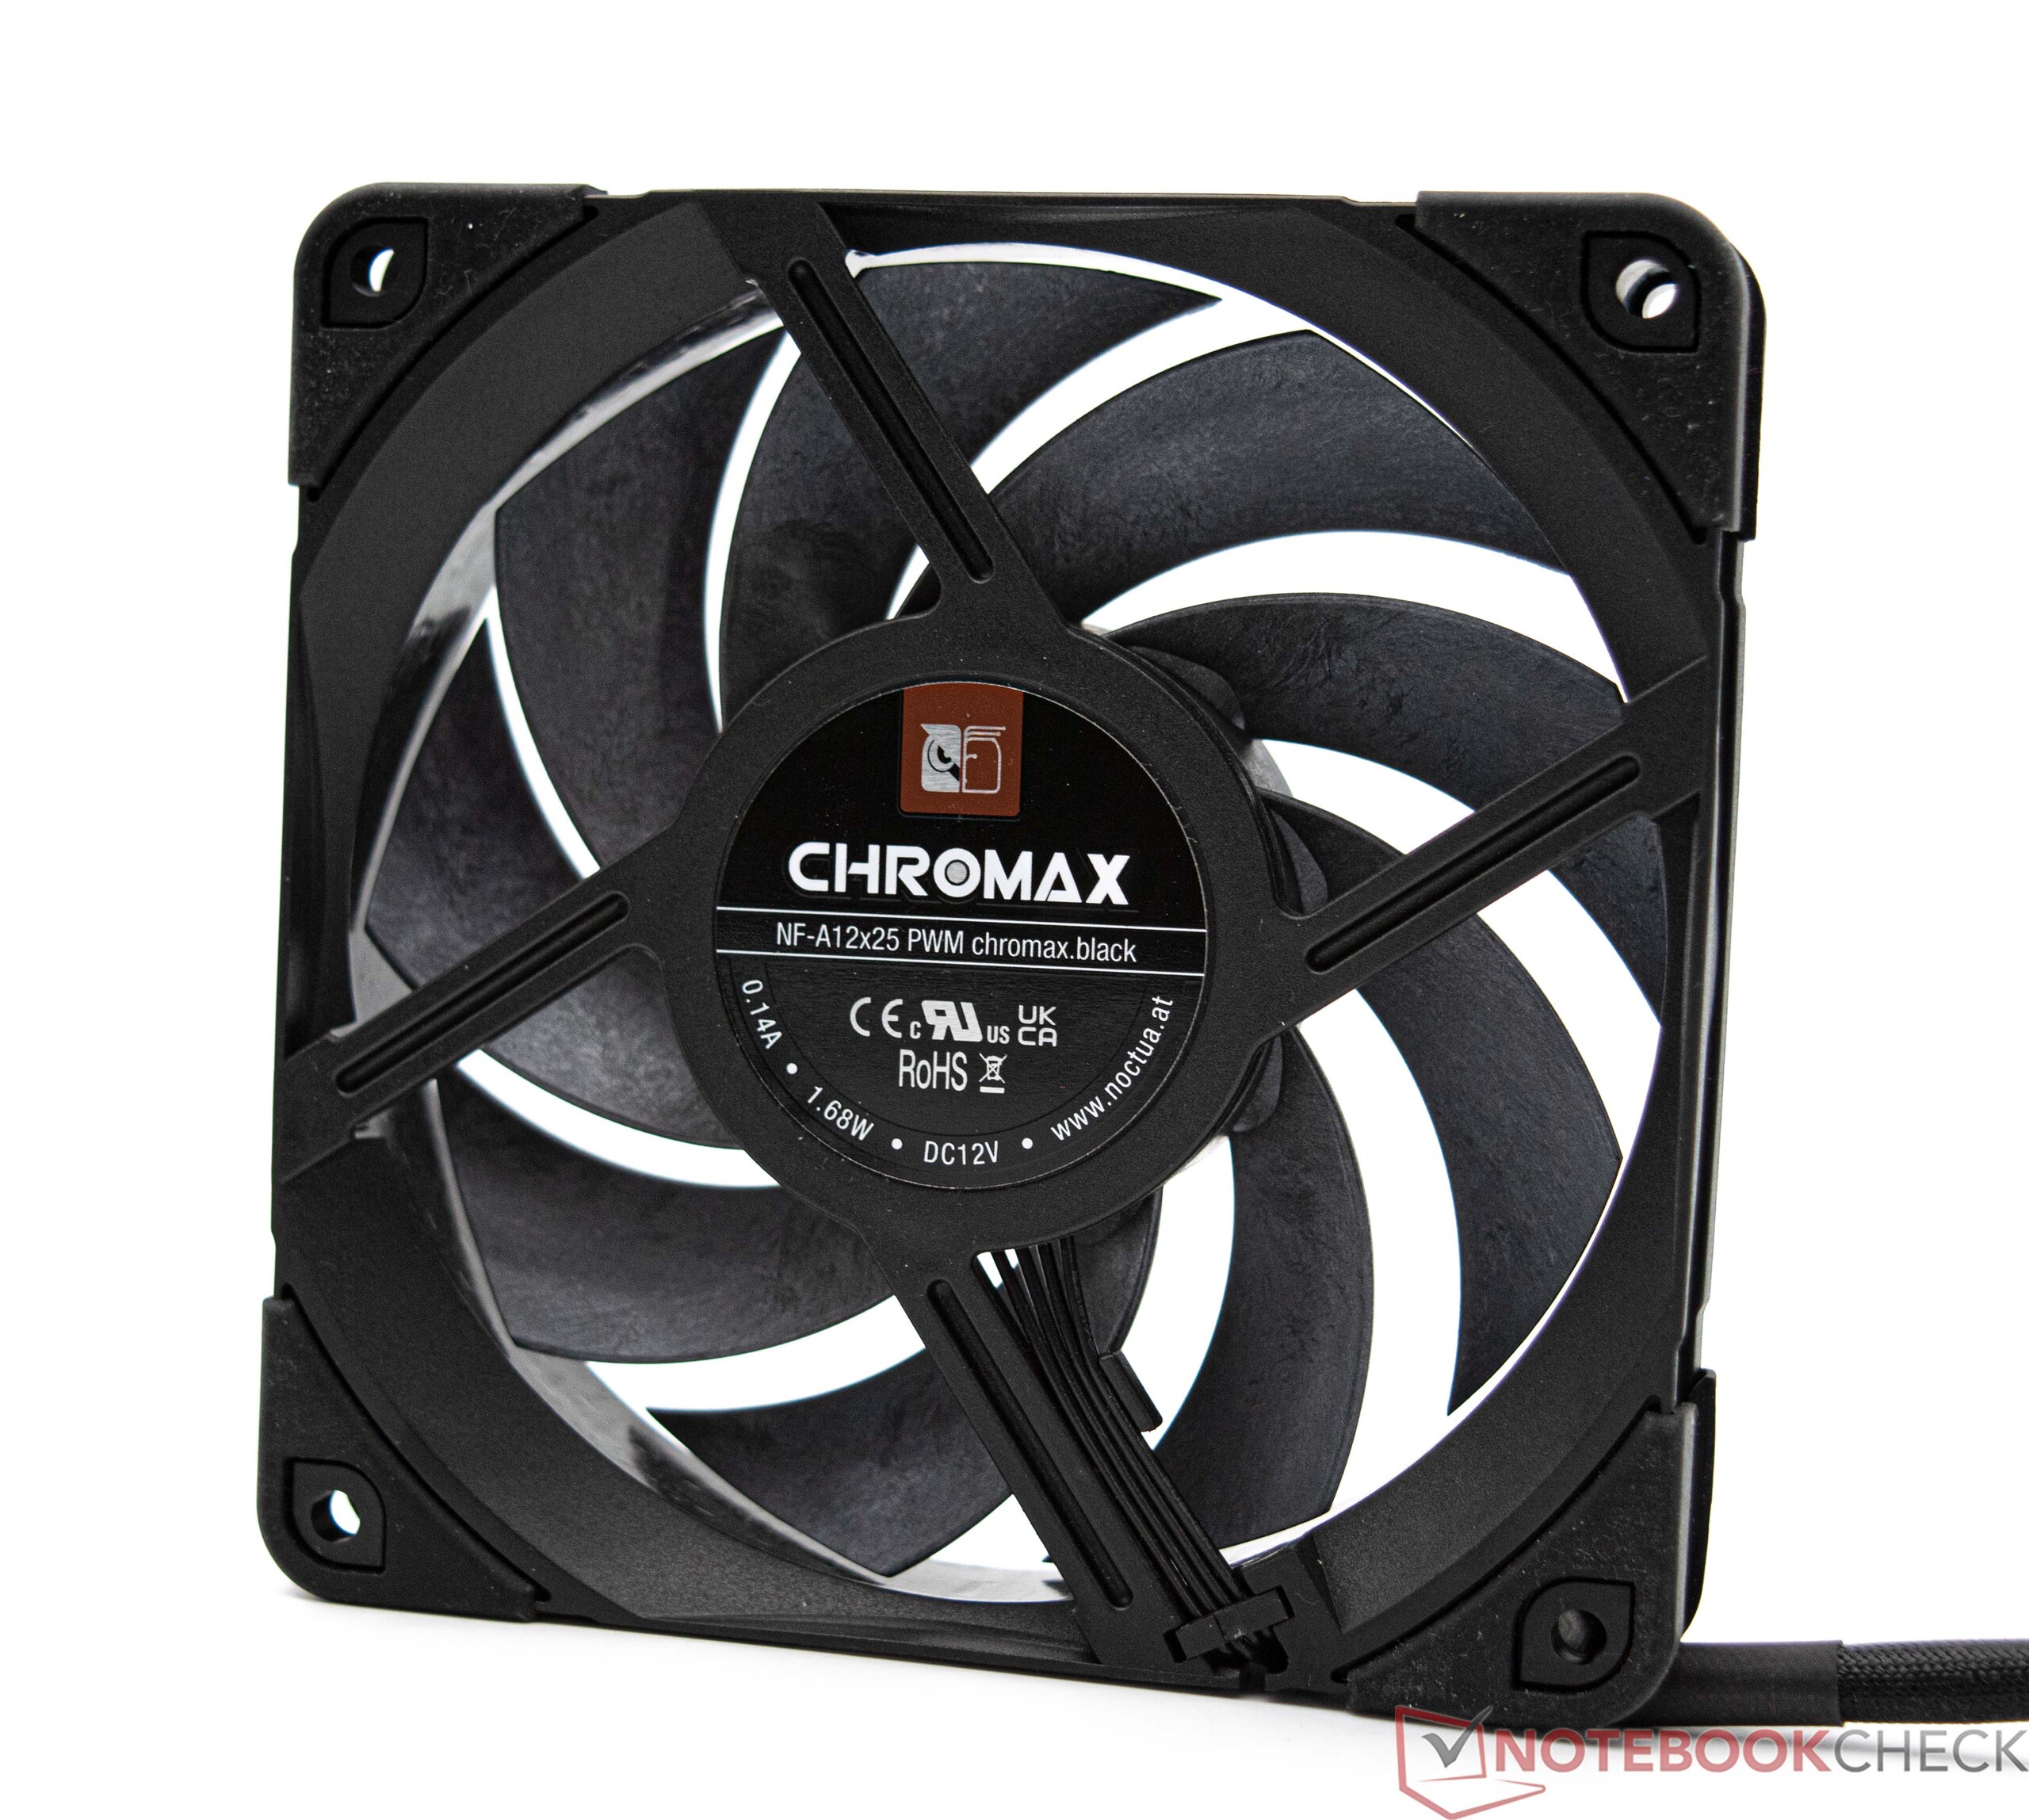
I leveransen ingår Minisforum BD770i moderkort med en SoC kylfläns redan monterad. Dessutom ingår en relativt stor WLAN-antenn med ett magnetiskt stativ och den matchande IO-skölden. Andra delar behövs för att driva Minisforum BD770i. Varken en 120-millimetersfläkt eller förinstallerat RAM-minne eller SSD erbjuds av tillverkaren. Dessutom behövs en lämplig PC-strömförsörjning; den ska vara liten och i SFX-format för att passa i Phanteks Enthoo Evolv Shift XT-chassit. Följaktligen fungerar Minisforum BD770i som en solid grund för en kompakt DIY-dator i en miniatyrformfaktor.

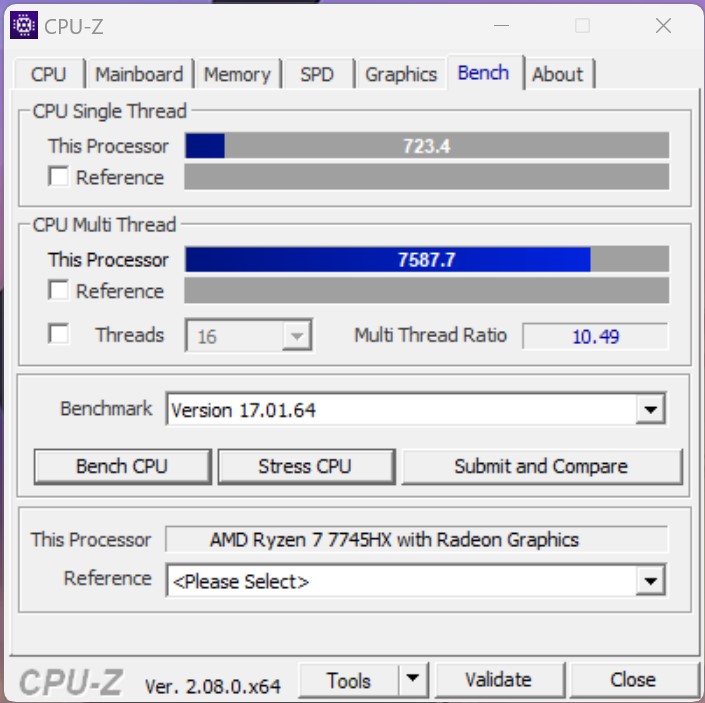
Riktmärken för processorer
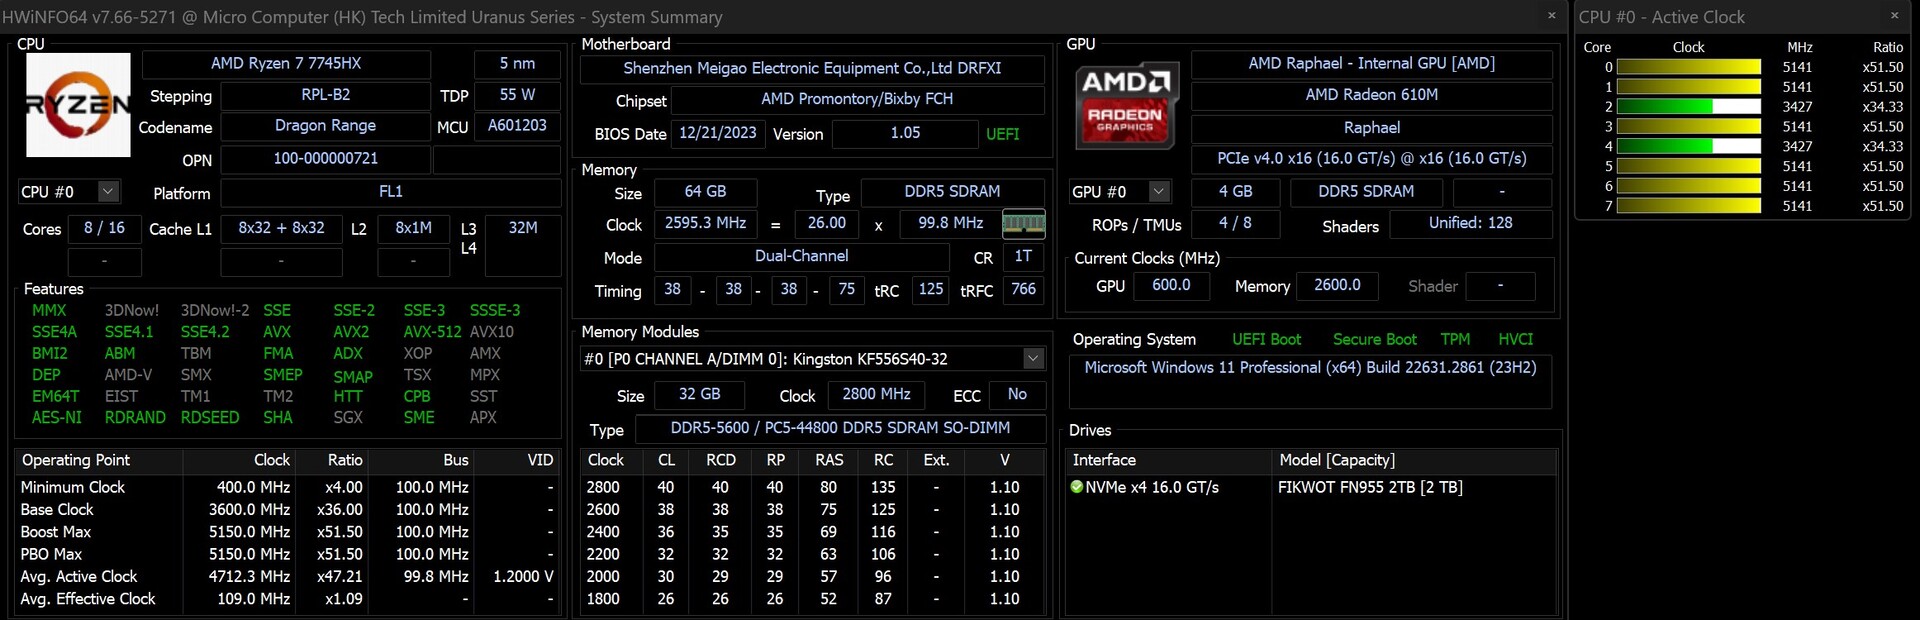
Utrustad med AMD Ryzen 7 7745HX, Minisforum BD770i moderkort har en modern SoC, om än inte de senaste AMD-processorerna. Ändå sticker den installerade SoC:n ut med sina åtta Zen4-kärnor som kan bearbeta 16 trådar. Den utmärkta kylningen säkerställer konsekvent hög prestanda, och termiska begränsningar är inte lika allvarliga som i bärbara datorer eller minidatorer. I vår prestandautvärdering följde AMD Ryzen 7 7745HX nära en AMD Ryzen 7 7800X3D. I jämförelse med Intel överträffade den en Core i5-12600Käven om en Intel Core i5-13600K presterade något bättre. Vi uppskattade strategin att integrera en mobil processor i en traditionell stationär dator, eftersom dessa processorer i allmänhet är lättare att kyla samtidigt som de fortfarande levererar berömvärd prestanda. Även en nuvarande Intel Core i5-14600K uppnår bara ett försprång på tio procent i prestandamätningen. Detta understryker den positiva prestandautvecklingen för mobila SoC:er med effektiv kylning. Under enskilda tester kanske AMD Ryzen 7 7745HX inte kan matcha prestandan hos välkända flaggskeppsmodeller på grund av dess lägre antal kärnor.
Anmärkningsvärt är jämförelsen av AMD Ryzen 7 7840HS och AMD Ryzen 9 7940HS, som båda utvärderades i Minisforum Mini-PCs (Minisforum EliteMini UM780 XTX och Minisforum Venus Series UM790 Pro). Man får inte glömma bort att de två HS-modellerna förbrukar marginellt mindre ström. Trots detta blir det uppenbart att mobila SoC:er kan leverera betydligt mer prestanda med effektiv kylning. Detta kräver lämpliga UEFI-inställningar som gör det möjligt för processorn att få mer ihållande ström, förutsatt att de termiska förhållandena tillåter det. BD770i från Minisforum begränsar inte värdena på ett konstlat sätt, och effektgränsen kan justeras manuellt. I standardtillståndet dokumenterade vi en stabil strömförbrukning på 75 watt för AMD Ryzen 7 7745HX.
För ytterligare jämförelser och riktmärken, se vår CPU-jämförelsetabell.
| Performance rating - Percent | |
| Intel Core i9-14900K | |
| Intel Core i9-13900K | |
| AMD Ryzen 9 7950X | |
| AMD Ryzen 9 7950X3D | |
| AMD Ryzen 9 7900X | |
| Intel Core i5-14600K | |
| Intel Core i9-12900K | |
| AMD Ryzen 9 5950X | |
| Intel Core i5-13600K | |
| AMD Ryzen 7 7800X3D | |
| AMD Ryzen 7 7745HX | |
| AMD Ryzen 5 7600X | |
| Intel Core i5-12600K | |
| AMD Ryzen 7 7840HS | |
| AMD Ryzen 9 7940HS | |
| Intel Core i5-13400 | |
| Intel Core i5-12400F | |
| Cinebench R15 | |
| CPU Single 64Bit | |
| Intel Core i9-14900K | |
| AMD Ryzen 9 7950X | |
| Intel Core i9-13900K | |
| AMD Ryzen 9 7950X3D | |
| AMD Ryzen 9 7900X | |
| AMD Ryzen 5 7600X | |
| Intel Core i5-14600K | |
| AMD Ryzen 7 7745HX | |
| AMD Ryzen 7 7800X3D | |
| Intel Core i5-13600K | |
| Intel Core i9-12900K | |
| AMD Ryzen 9 7940HS | |
| AMD Ryzen 7 7840HS | |
| Intel Core i5-12600K | |
| AMD Ryzen 9 5950X | |
| Intel Core i5-13400 | |
| Intel Core i5-12400F | |
| CPU Multi 64Bit | |
| Intel Core i9-14900K | |
| AMD Ryzen 9 7950X | |
| Intel Core i9-13900K | |
| AMD Ryzen 9 7950X3D | |
| AMD Ryzen 9 7900X | |
| AMD Ryzen 9 5950X | |
| Intel Core i9-12900K | |
| Intel Core i5-13600K | |
| Intel Core i5-14600K | |
| AMD Ryzen 7 7745HX | |
| AMD Ryzen 7 7800X3D | |
| AMD Ryzen 9 7940HS | |
| AMD Ryzen 7 7840HS | |
| Intel Core i5-12600K | |
| AMD Ryzen 5 7600X | |
| Intel Core i5-13400 | |
| Intel Core i5-12400F | |
| Cinebench R20 | |
| CPU (Single Core) | |
| Intel Core i9-14900K | |
| Intel Core i9-13900K | |
| AMD Ryzen 9 7950X | |
| AMD Ryzen 9 7950X3D | |
| Intel Core i5-14600K | |
| AMD Ryzen 9 7900X | |
| Intel Core i5-13600K | |
| Intel Core i9-12900K | |
| AMD Ryzen 5 7600X | |
| Intel Core i5-12600K | |
| AMD Ryzen 7 7745HX | |
| AMD Ryzen 9 7940HS | |
| AMD Ryzen 7 7800X3D | |
| AMD Ryzen 7 7840HS | |
| Intel Core i5-13400 | |
| Intel Core i5-12400F | |
| AMD Ryzen 9 5950X | |
| CPU (Multi Core) | |
| Intel Core i9-14900K | |
| Intel Core i9-13900K | |
| AMD Ryzen 9 7950X | |
| AMD Ryzen 9 7950X3D | |
| AMD Ryzen 9 7900X | |
| AMD Ryzen 9 5950X | |
| Intel Core i9-12900K | |
| Intel Core i5-14600K | |
| Intel Core i5-13600K | |
| AMD Ryzen 7 7745HX | |
| AMD Ryzen 7 7800X3D | |
| Intel Core i5-12600K | |
| AMD Ryzen 9 7940HS | |
| AMD Ryzen 7 7840HS | |
| Intel Core i5-13400 | |
| AMD Ryzen 5 7600X | |
| Intel Core i5-12400F | |
| Cinebench R23 | |
| Single Core | |
| Intel Core i9-14900K | |
| Intel Core i9-13900K | |
| Intel Core i5-14600K | |
| AMD Ryzen 9 7950X3D | |
| AMD Ryzen 9 7950X | |
| AMD Ryzen 9 7900X | |
| Intel Core i5-13600K | |
| Intel Core i9-12900K | |
| AMD Ryzen 5 7600X | |
| Intel Core i5-12600K | |
| AMD Ryzen 7 7745HX | |
| AMD Ryzen 7 7800X3D | |
| AMD Ryzen 9 7940HS | |
| Intel Core i5-13400 | |
| AMD Ryzen 7 7840HS | |
| Intel Core i5-12400F | |
| AMD Ryzen 9 5950X | |
| Multi Core | |
| Intel Core i9-14900K | |
| Intel Core i9-13900K | |
| AMD Ryzen 9 7950X | |
| AMD Ryzen 9 7950X3D | |
| AMD Ryzen 9 7900X | |
| AMD Ryzen 9 5950X | |
| Intel Core i9-12900K | |
| Intel Core i5-14600K | |
| Intel Core i5-13600K | |
| AMD Ryzen 7 7745HX | |
| AMD Ryzen 7 7800X3D | |
| Intel Core i5-12600K | |
| AMD Ryzen 9 7940HS | |
| AMD Ryzen 7 7840HS | |
| Intel Core i5-13400 | |
| AMD Ryzen 5 7600X | |
| Intel Core i5-12400F | |
| Cinebench R11.5 | |
| CPU Single 64Bit | |
| Intel Core i9-14900K | |
| Intel Core i9-13900K | |
| AMD Ryzen 9 7950X | |
| AMD Ryzen 9 7950X3D | |
| AMD Ryzen 9 7900X | |
| AMD Ryzen 5 7600X | |
| Intel Core i5-14600K | |
| AMD Ryzen 7 7745HX | |
| Intel Core i9-12900K | |
| Intel Core i5-13600K | |
| AMD Ryzen 9 7940HS | |
| AMD Ryzen 7 7800X3D | |
| AMD Ryzen 7 7840HS | |
| Intel Core i5-12600K | |
| AMD Ryzen 9 5950X | |
| Intel Core i5-13400 | |
| Intel Core i5-12400F | |
| CPU Multi 64Bit | |
| Intel Core i9-14900K | |
| Intel Core i9-13900K | |
| AMD Ryzen 9 7950X | |
| AMD Ryzen 9 7950X3D | |
| AMD Ryzen 9 7900X | |
| AMD Ryzen 9 5950X | |
| Intel Core i9-12900K | |
| Intel Core i5-13600K | |
| Intel Core i5-14600K | |
| AMD Ryzen 7 7745HX | |
| AMD Ryzen 7 7800X3D | |
| AMD Ryzen 9 7940HS | |
| AMD Ryzen 7 7840HS | |
| Intel Core i5-12600K | |
| AMD Ryzen 5 7600X | |
| Intel Core i5-13400 | |
| Intel Core i5-12400F | |
| Cinebench R10 | |
| Rendering Single CPUs 64Bit | |
| Intel Core i9-14900K | |
| Intel Core i9-13900K | |
| Intel Core i5-14600K | |
| AMD Ryzen 9 7900X | |
| AMD Ryzen 9 7950X | |
| Intel Core i5-13600K | |
| Intel Core i9-12900K | |
| AMD Ryzen 5 7600X | |
| Intel Core i5-12600K | |
| AMD Ryzen 7 7745HX | |
| AMD Ryzen 9 7940HS | |
| AMD Ryzen 7 7800X3D | |
| AMD Ryzen 7 7840HS | |
| Intel Core i5-13400 | |
| Intel Core i5-12400F | |
| AMD Ryzen 9 5950X | |
| AMD Ryzen 9 7950X3D | |
| Rendering Multiple CPUs 64Bit | |
| Intel Core i9-14900K | |
| Intel Core i9-13900K | |
| AMD Ryzen 9 7950X | |
| AMD Ryzen 9 7900X | |
| Intel Core i5-14600K | |
| Intel Core i9-12900K | |
| Intel Core i5-13600K | |
| AMD Ryzen 9 5950X | |
| AMD Ryzen 7 7745HX | |
| AMD Ryzen 7 7800X3D | |
| AMD Ryzen 5 7600X | |
| Intel Core i5-12600K | |
| AMD Ryzen 9 7940HS | |
| AMD Ryzen 7 7840HS | |
| Intel Core i5-13400 | |
| AMD Ryzen 9 7950X3D | |
| Intel Core i5-12400F | |
| Blender - v2.79 BMW27 CPU | |
| Intel Core i5-12400F | |
| Intel Core i5-13400 | |
| AMD Ryzen 5 7600X | |
| AMD Ryzen 7 7840HS | |
| Intel Core i5-12600K | |
| AMD Ryzen 9 7940HS | |
| AMD Ryzen 7 7800X3D | |
| AMD Ryzen 7 7745HX | |
| Intel Core i5-13600K | |
| Intel Core i5-14600K | |
| Intel Core i9-12900K | |
| AMD Ryzen 9 5950X | |
| AMD Ryzen 9 7900X | |
| AMD Ryzen 9 7950X3D | |
| AMD Ryzen 9 7950X | |
| Intel Core i9-13900K | |
| Intel Core i9-14900K | |
| wPrime 2.10 | |
| 32m | |
| Intel Core i9-12900K | |
| Intel Core i5-12600K | |
| Intel Core i5-12400F | |
| Intel Core i5-13400 | |
| AMD Ryzen 5 7600X | |
| AMD Ryzen 9 7940HS | |
| AMD Ryzen 7 7840HS | |
| AMD Ryzen 9 5950X | |
| Intel Core i5-13600K | |
| AMD Ryzen 7 7800X3D | |
| Intel Core i5-14600K | |
| AMD Ryzen 7 7745HX | |
| Intel Core i9-14900K | |
| AMD Ryzen 9 7950X3D | |
| Intel Core i9-13900K | |
| AMD Ryzen 9 7900X | |
| AMD Ryzen 9 7950X | |
| 1024m | |
| Intel Core i5-13400 | |
| Intel Core i5-12600K | |
| Intel Core i9-12900K | |
| Intel Core i5-13600K | |
| Intel Core i5-14600K | |
| Intel Core i5-12400F | |
| Intel Core i9-13900K | |
| AMD Ryzen 5 7600X | |
| Intel Core i9-14900K | |
| AMD Ryzen 7 7840HS | |
| AMD Ryzen 9 7940HS | |
| AMD Ryzen 9 5950X | |
| AMD Ryzen 7 7800X3D | |
| AMD Ryzen 7 7745HX | |
| AMD Ryzen 9 7900X | |
| AMD Ryzen 9 7950X3D | |
| AMD Ryzen 9 7950X | |
| X264 HD Benchmark 4.0 | |
| Pass 1 | |
| Intel Core i9-14900K | |
| Intel Core i9-13900K | |
| Intel Core i5-14600K | |
| AMD Ryzen 9 7950X3D | |
| Intel Core i5-13600K | |
| AMD Ryzen 9 7950X | |
| AMD Ryzen 9 7900X | |
| Intel Core i9-12900K | |
| AMD Ryzen 5 7600X | |
| AMD Ryzen 7 7745HX | |
| AMD Ryzen 7 7800X3D | |
| AMD Ryzen 9 5950X | |
| Intel Core i5-12600K | |
| Intel Core i5-13400 | |
| AMD Ryzen 9 7940HS | |
| AMD Ryzen 7 7840HS | |
| Intel Core i5-12400F | |
| Pass 2 | |
| Intel Core i9-14900K | |
| Intel Core i9-13900K | |
| AMD Ryzen 9 7950X | |
| AMD Ryzen 9 7950X3D | |
| AMD Ryzen 9 7900X | |
| AMD Ryzen 9 5950X | |
| Intel Core i5-14600K | |
| Intel Core i9-12900K | |
| Intel Core i5-13600K | |
| AMD Ryzen 7 7745HX | |
| AMD Ryzen 7 7800X3D | |
| AMD Ryzen 9 7940HS | |
| AMD Ryzen 7 7840HS | |
| Intel Core i5-12600K | |
| AMD Ryzen 5 7600X | |
| Intel Core i5-13400 | |
| Intel Core i5-12400F | |
| WinRAR - Result | |
| AMD Ryzen 9 7900X | |
| AMD Ryzen 7 7800X3D | |
| AMD Ryzen 9 7950X | |
| AMD Ryzen 5 7600X | |
| Intel Core i9-14900K | |
| AMD Ryzen 9 7950X3D | |
| Intel Core i9-13900K | |
| AMD Ryzen 7 7745HX | |
| AMD Ryzen 9 5950X | |
| Intel Core i5-14600K | |
| Intel Core i5-13600K | |
| Intel Core i9-12900K | |
| Intel Core i5-13400 | |
| Intel Core i5-12400F | |
| AMD Ryzen 7 7840HS | |
| AMD Ryzen 9 7940HS | |
| Intel Core i5-12600K | |
| Geekbench 5.5 | |
| Multi-Core | |
| Intel Core i9-14900K | |
| AMD Ryzen 9 7950X | |
| AMD Ryzen 9 7950X3D | |
| Intel Core i9-13900K | |
| AMD Ryzen 9 7900X | |
| Intel Core i9-12900K | |
| Intel Core i5-14600K | |
| AMD Ryzen 9 5950X | |
| Intel Core i5-13600K | |
| AMD Ryzen 7 7800X3D | |
| AMD Ryzen 7 7745HX | |
| Intel Core i5-12600K | |
| AMD Ryzen 7 7840HS | |
| Intel Core i5-13400 | |
| AMD Ryzen 5 7600X | |
| AMD Ryzen 9 7940HS | |
| Intel Core i5-12400F | |
| Single-Core | |
| AMD Ryzen 9 7950X | |
| AMD Ryzen 9 7950X3D | |
| Intel Core i9-13900K | |
| AMD Ryzen 9 7900X | |
| Intel Core i9-14900K | |
| AMD Ryzen 5 7600X | |
| AMD Ryzen 7 7745HX | |
| Intel Core i9-12900K | |
| AMD Ryzen 7 7800X3D | |
| Intel Core i5-14600K | |
| AMD Ryzen 9 7940HS | |
| Intel Core i5-13600K | |
| AMD Ryzen 7 7840HS | |
| Intel Core i5-12600K | |
| Intel Core i5-13400 | |
| Intel Core i5-12400F | |
| AMD Ryzen 9 5950X | |
| Geekbench 5.0 | |
| 5.0 Multi-Core | |
| Intel Core i9-14900K | |
| AMD Ryzen 9 7950X | |
| Intel Core i9-13900K | |
| AMD Ryzen 9 7950X3D | |
| AMD Ryzen 9 7900X | |
| Intel Core i9-12900K | |
| Intel Core i5-14600K | |
| Intel Core i5-13600K | |
| AMD Ryzen 9 5950X | |
| AMD Ryzen 7 7800X3D | |
| AMD Ryzen 7 7745HX | |
| Intel Core i5-12600K | |
| AMD Ryzen 7 7840HS | |
| AMD Ryzen 5 7600X | |
| Intel Core i5-13400 | |
| AMD Ryzen 9 7940HS | |
| Intel Core i5-12400F | |
| 5.0 Single-Core | |
| Intel Core i9-14900K | |
| AMD Ryzen 9 7950X | |
| Intel Core i9-13900K | |
| AMD Ryzen 9 7900X | |
| AMD Ryzen 9 7950X3D | |
| AMD Ryzen 5 7600X | |
| Intel Core i5-14600K | |
| AMD Ryzen 7 7745HX | |
| Intel Core i9-12900K | |
| AMD Ryzen 7 7800X3D | |
| Intel Core i5-13600K | |
| AMD Ryzen 7 7840HS | |
| AMD Ryzen 9 7940HS | |
| Intel Core i5-12600K | |
| Intel Core i5-13400 | |
| AMD Ryzen 9 5950X | |
| Intel Core i5-12400F | |
| Geekbench 4.4 | |
| 64 Bit Single-Core Score | |
| Intel Core i9-14900K | |
| Intel Core i9-13900K | |
| AMD Ryzen 9 7950X | |
| AMD Ryzen 9 7950X3D | |
| AMD Ryzen 9 7900X | |
| AMD Ryzen 7 7800X3D | |
| AMD Ryzen 5 7600X | |
| Intel Core i5-14600K | |
| Intel Core i9-12900K | |
| Intel Core i5-13600K | |
| AMD Ryzen 7 7745HX | |
| Intel Core i5-12600K | |
| AMD Ryzen 7 7840HS | |
| AMD Ryzen 9 7940HS | |
| Intel Core i5-13400 | |
| Intel Core i5-12400F | |
| AMD Ryzen 9 5950X | |
| 64 Bit Multi-Core Score | |
| AMD Ryzen 9 7950X | |
| Intel Core i9-14900K | |
| AMD Ryzen 9 7950X3D | |
| Intel Core i9-13900K | |
| AMD Ryzen 9 7900X | |
| Intel Core i5-14600K | |
| Intel Core i9-12900K | |
| AMD Ryzen 9 5950X | |
| Intel Core i5-13600K | |
| AMD Ryzen 7 7800X3D | |
| AMD Ryzen 7 7745HX | |
| AMD Ryzen 7 7840HS | |
| AMD Ryzen 5 7600X | |
| Intel Core i5-12600K | |
| AMD Ryzen 9 7940HS | |
| Intel Core i5-13400 | |
| Intel Core i5-12400F | |
| 3DMark 11 - 1280x720 Performance Physics | |
| AMD Ryzen 9 7950X3D | |
| AMD Ryzen 7 7800X3D | |
| Intel Core i9-13900K | |
| Intel Core i9-14900K | |
| Intel Core i5-14600K | |
| Intel Core i5-13600K | |
| AMD Ryzen 9 7900X | |
| AMD Ryzen 9 7950X | |
| Intel Core i9-12900K | |
| AMD Ryzen 7 7745HX | |
| AMD Ryzen 5 7600X | |
| AMD Ryzen 9 5950X | |
| Intel Core i5-12600K | |
| Intel Core i5-13400 | |
| AMD Ryzen 7 7840HS | |
| AMD Ryzen 9 7940HS | |
| Intel Core i5-12400F | |
| 7-Zip 18.03 | |
| 7z b 4 | |
| AMD Ryzen 9 7950X | |
| AMD Ryzen 9 7950X3D | |
| Intel Core i9-14900K | |
| Intel Core i9-13900K | |
| AMD Ryzen 9 5950X | |
| AMD Ryzen 9 7900X | |
| Intel Core i9-12900K | |
| Intel Core i5-14600K | |
| Intel Core i5-13600K | |
| AMD Ryzen 7 7800X3D | |
| AMD Ryzen 7 7745HX | |
| AMD Ryzen 7 7840HS | |
| AMD Ryzen 9 7940HS | |
| AMD Ryzen 5 7600X | |
| Intel Core i5-12600K | |
| Intel Core i5-13400 | |
| Intel Core i5-12400F | |
| 7z b 4 -mmt1 | |
| AMD Ryzen 9 7950X | |
| AMD Ryzen 9 7950X3D | |
| AMD Ryzen 9 7900X | |
| AMD Ryzen 7 7800X3D | |
| AMD Ryzen 5 7600X | |
| Intel Core i9-14900K | |
| AMD Ryzen 7 7745HX | |
| Intel Core i9-13900K | |
| AMD Ryzen 9 5950X | |
| Intel Core i5-14600K | |
| AMD Ryzen 9 7940HS | |
| Intel Core i9-12900K | |
| AMD Ryzen 7 7840HS | |
| Intel Core i5-13600K | |
| Intel Core i5-12600K | |
| Intel Core i5-13400 | |
| Intel Core i5-12400F | |
| HWBOT x265 Benchmark v2.2 - 4k Preset | |
| AMD Ryzen 9 7950X | |
| Intel Core i9-14900K | |
| Intel Core i9-13900K | |
| AMD Ryzen 9 7950X3D | |
| AMD Ryzen 9 7900X | |
| AMD Ryzen 9 5950X | |
| Intel Core i5-12600K | |
| Intel Core i9-12900K | |
| Intel Core i5-14600K | |
| Intel Core i5-13600K | |
| AMD Ryzen 7 7800X3D | |
| AMD Ryzen 7 7745HX | |
| AMD Ryzen 5 7600X | |
| AMD Ryzen 7 7840HS | |
| AMD Ryzen 9 7940HS | |
| Intel Core i5-13400 | |
| Intel Core i5-12400F | |
| R Benchmark 2.5 - Overall mean | |
| Intel Core i5-12400F | |
| Intel Core i5-13400 | |
| AMD Ryzen 9 5950X | |
| Intel Core i5-12600K | |
| AMD Ryzen 7 7840HS | |
| Intel Core i9-12900K | |
| AMD Ryzen 9 7940HS | |
| AMD Ryzen 7 7800X3D | |
| AMD Ryzen 7 7745HX | |
| Intel Core i5-13600K | |
| Intel Core i5-14600K | |
| AMD Ryzen 5 7600X | |
| AMD Ryzen 9 7900X | |
| AMD Ryzen 9 7950X3D | |
| AMD Ryzen 9 7950X | |
| Intel Core i9-13900K | |
| Intel Core i9-14900K | |
| LibreOffice - 20 Documents To PDF | |
| Intel Core i5-12600K | |
| AMD Ryzen 7 7840HS | |
| Intel Core i5-12400F | |
| AMD Ryzen 9 7940HS | |
| AMD Ryzen 9 5950X | |
| AMD Ryzen 7 7745HX | |
| AMD Ryzen 7 7800X3D | |
| Intel Core i9-12900K | |
| Intel Core i5-13400 | |
| AMD Ryzen 9 7950X3D | |
| AMD Ryzen 5 7600X | |
| Intel Core i9-13900K | |
| AMD Ryzen 9 7950X | |
| Intel Core i5-13600K | |
| AMD Ryzen 9 7900X | |
| Intel Core i9-14900K | |
| Intel Core i5-14600K | |
| WebXPRT 3 - Overall | |
| AMD Ryzen 9 7950X3D | |
| Intel Core i9-14900K | |
| AMD Ryzen 9 7900X | |
| AMD Ryzen 9 7950X | |
| AMD Ryzen 5 7600X | |
| Intel Core i9-13900K | |
| Intel Core i5-14600K | |
| AMD Ryzen 7 7800X3D | |
| AMD Ryzen 7 7745HX | |
| Intel Core i5-13600K | |
| AMD Ryzen 7 7840HS | |
| Intel Core i9-12900K | |
| Intel Core i5-13400 | |
| AMD Ryzen 9 7940HS | |
| Intel Core i5-12600K | |
| AMD Ryzen 9 5950X | |
| Intel Core i5-12400F | |
| Mozilla Kraken 1.1 - Total | |
| Intel Core i5-12400F | |
| AMD Ryzen 9 5950X | |
| Intel Core i5-13400 | |
| AMD Ryzen 7 7840HS | |
| Intel Core i5-12600K | |
| AMD Ryzen 7 7800X3D | |
| AMD Ryzen 9 7940HS | |
| Intel Core i9-12900K | |
| AMD Ryzen 7 7745HX | |
| Intel Core i5-13600K | |
| Intel Core i5-14600K | |
| AMD Ryzen 5 7600X | |
| AMD Ryzen 9 7950X3D | |
| AMD Ryzen 9 7950X | |
| Intel Core i9-13900K | |
| AMD Ryzen 9 7900X | |
| Intel Core i9-14900K | |
| 3DMark | |
| 1920x1080 Fire Strike Physics | |
| Intel Core i9-14900K | |
| Intel Core i9-13900K | |
| AMD Ryzen 9 7950X3D | |
| AMD Ryzen 9 7900X | |
| AMD Ryzen 9 7950X | |
| Intel Core i5-14600K | |
| AMD Ryzen 9 5950X | |
| Intel Core i9-12900K | |
| Intel Core i5-13600K | |
| AMD Ryzen 7 7800X3D | |
| AMD Ryzen 5 7600X | |
| Intel Core i5-12600K | |
| AMD Ryzen 7 7840HS | |
| AMD Ryzen 9 7940HS | |
| Intel Core i5-13400 | |
| Intel Core i5-12400F | |
| AMD Ryzen 7 7745HX | |
| 2560x1440 Time Spy CPU | |
| Intel Core i9-14900K | |
| Intel Core i9-13900K | |
| Intel Core i5-14600K | |
| Intel Core i9-12900K | |
| AMD Ryzen 9 7950X3D | |
| Intel Core i5-13600K | |
| AMD Ryzen 9 7900X | |
| AMD Ryzen 9 7950X | |
| AMD Ryzen 7 7800X3D | |
| Intel Core i5-12600K | |
| AMD Ryzen 9 5950X | |
| Intel Core i5-13400 | |
| AMD Ryzen 7 7840HS | |
| AMD Ryzen 7 7745HX | |
| AMD Ryzen 9 7940HS | |
| AMD Ryzen 5 7600X | |
| Intel Core i5-12400F | |
* ... mindre är bättre
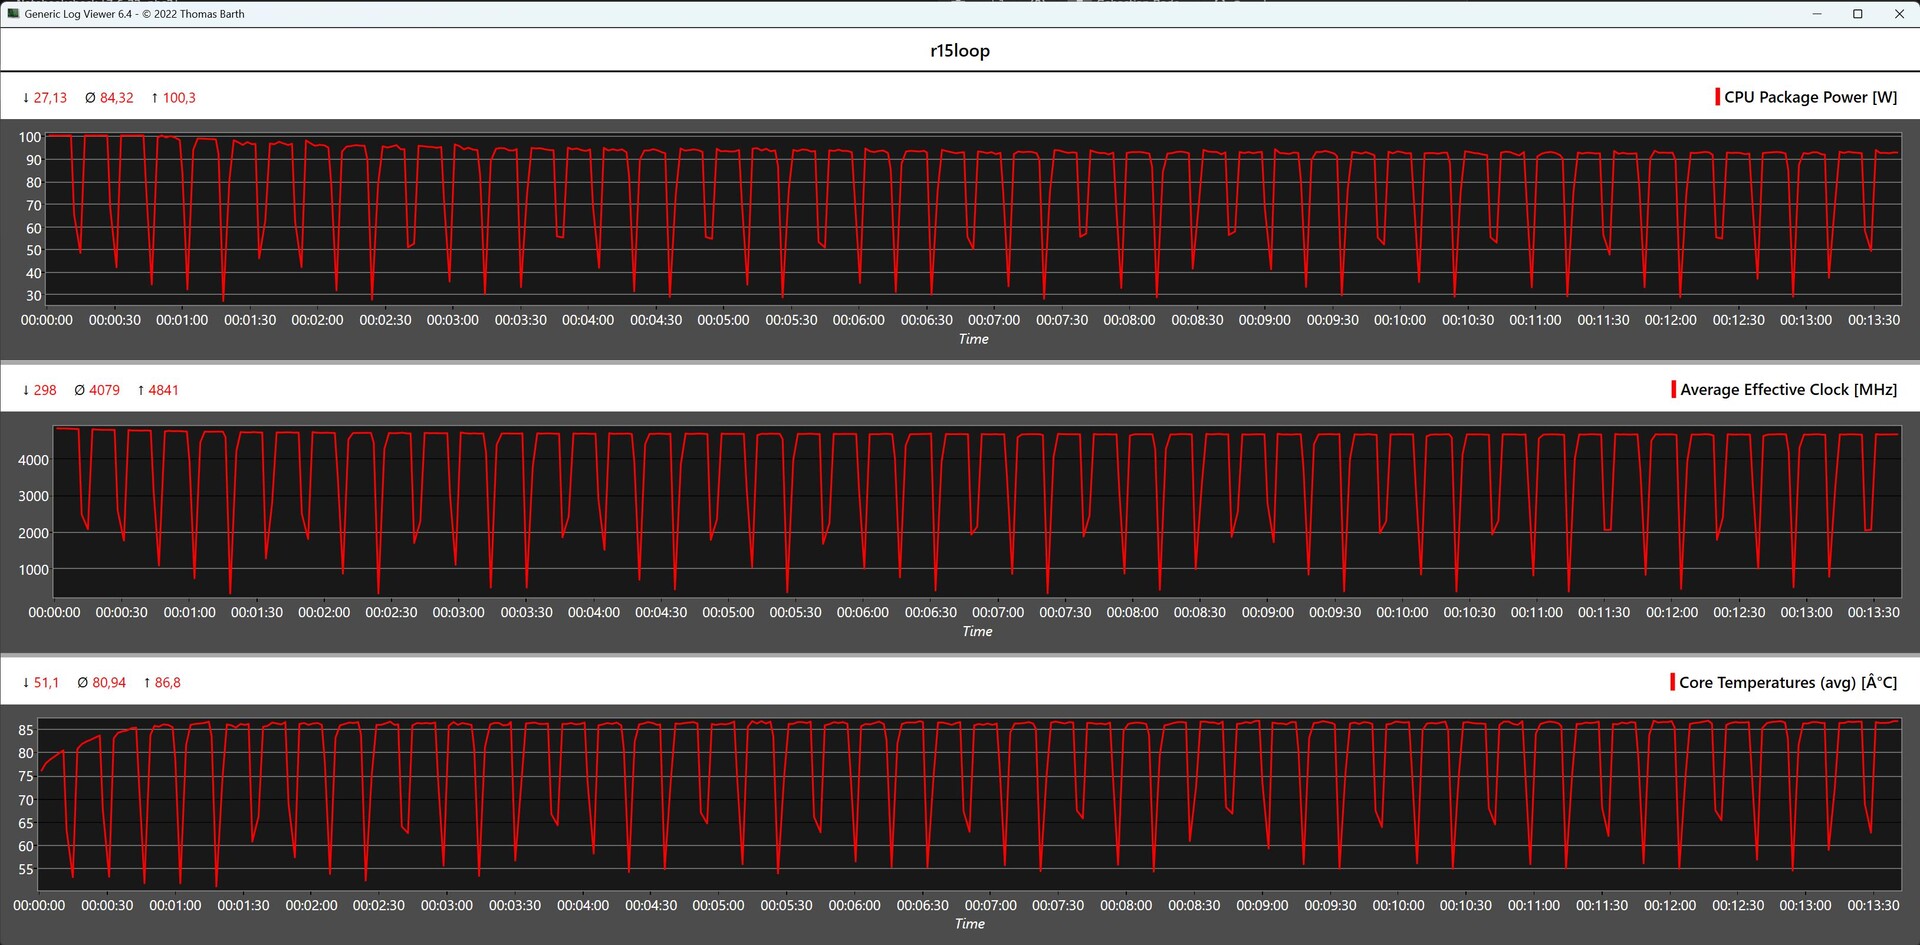
Cinebench-resultat AMD Ryzen 7 7745HX
Det kontinuerliga testet Cinebench R15 Multi ger en första inblick i prestandan hos den installerade kyllösningen. Sammantaget visar AMD Ryzen 7 7745HX relativt stabil prestanda. Med en genomsnittlig poäng på 2 867 poäng levererade vårt testprov ett enastående resultat i detta scenario. I synnerhet överträffar det resultatet som uppnåddes av en AMD Ryzen 7 7840HS i denna mätning.
Systemets prestanda
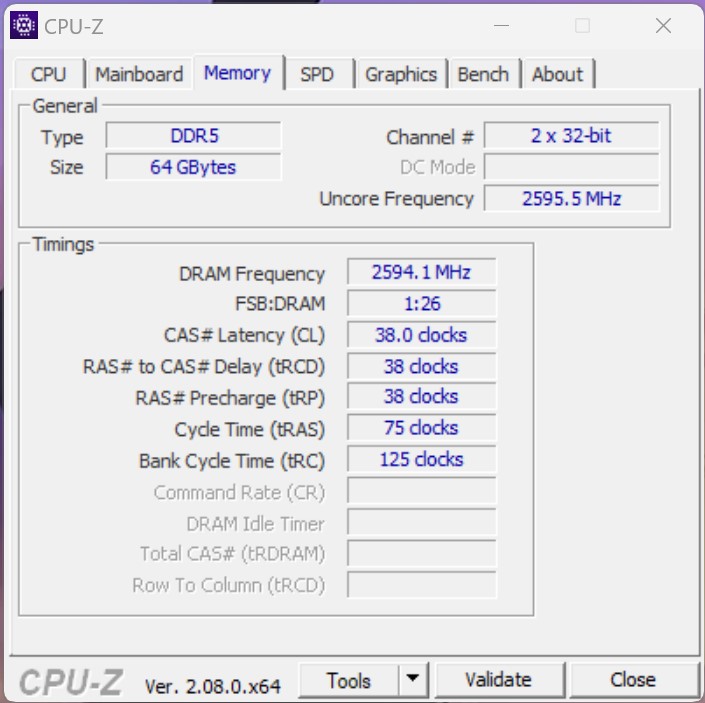
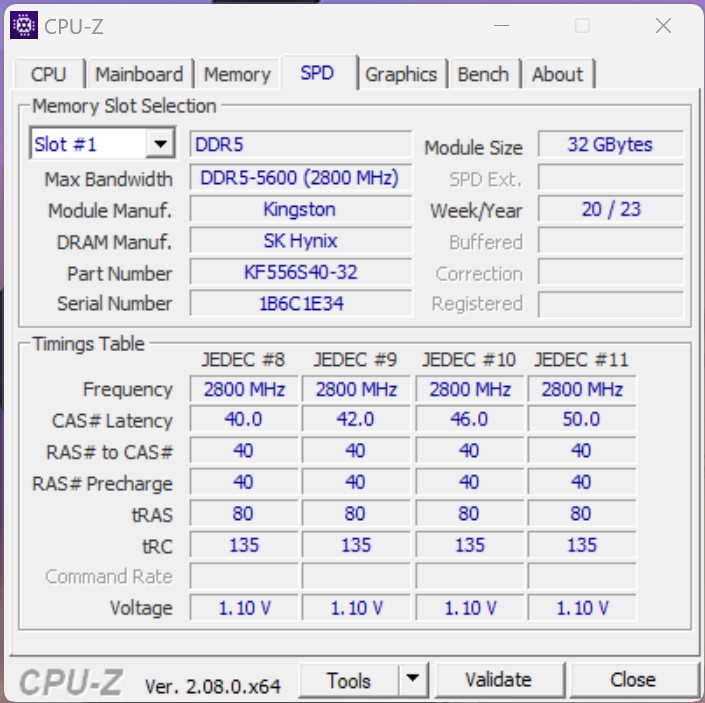
När det gäller systemprestanda har vi kortfattat beskrivit vår subjektiva upplevelse av testsystemet Minisforum BD770i: Systemets prestanda var genomgående hög, och den inbyggda 8-kärnan hanterade krävande applikationer effektivt. I kombination med den snabba NVMe SSD och DDR5 RAM, säkerställde det en snabb drifthastighet. Denna observation gäller för alla jämförelsesystem som nämns här. Ingen kombination uppvisade betydande brister, och skillnaderna var huvudsakligen mätbara. Minisforums BD770i-system placerade sig i det nedre mittfältet, en position som delades med de två mini-PC:erna från Minisforum. Även om dessa enheter kanske inte hade kunnat matcha ett avancerat stationärt system i kraft, är det viktigt att notera att denna jämförelse var något orättvis. Att inkludera dessa enheter i översikten gav dock ett bättre sammanhang för att utvärdera prestandan hos Minisforum BD770i med AMD Ryzen 7 7745HX.
| Performance rating - Percent | |
| AMD Ryzen 9 7950X3D, AMD Ryzen 9 7950X3D -1! | |
| NVIDIA GeForce RTX 3090 Founders Edition, AMD Ryzen 9 7950X | |
| AMD Ryzen 9 7900X, AMD Ryzen 9 7900X | |
| Palit GeForce RTX 4090 GameRock OC, Intel Core i9-14900K | |
| AMD Ryzen 5 7600X, AMD Ryzen 5 7600X | |
| Intel Core i9-13900K, Intel Core i9-13900K | |
| Intel Core i5-13600K, Intel Core i5-13600K | |
| Intel Core i5-14600K, Intel Core i5-14600K | |
| AMD Ryzen 7 7800X3D, AMD Ryzen 7 7800X3D | |
| AMD Ryzen 9 5950X, AMD Ryzen 9 5950X | |
| Intel Core i9-12900K, Intel Core i9-12900K | |
| Intel Core i5-13400, Intel Core i5-13400 | |
| Intel Core i5-12600K, Intel Core i5-12600K | |
| Minisforum BD770i, AMD Ryzen 7 7745HX | |
| Minisforum EliteMini UM780 XTX, AMD Ryzen 7 7840HS | |
| Minisforum Venus Series UM790 Pro, AMD Ryzen 9 7940HS | |
| Intel Core i5-12400F, Intel Core i5-12400F | |
| CrossMark / Overall | |
| Palit GeForce RTX 4090 GameRock OC, Palit GeForce RTX 4090 GameRock OC, Intel Core i9-14900K | |
| Intel Core i9-13900K, Intel Core i9-13900K, Intel Core i9-13900K | |
| NVIDIA GeForce RTX 3090 Founders Edition, NVIDIA GeForce RTX 3090 Founders Edition, AMD Ryzen 9 7950X | |
| AMD Ryzen 9 7900X, AMD Ryzen 9 7900X, AMD Ryzen 9 7900X | |
| Intel Core i5-14600K, Intel Core i5-14600K, Intel Core i5-14600K | |
| Intel Core i5-13600K, Intel Core i5-13600K, Intel Core i5-13600K | |
| AMD Ryzen 5 7600X, AMD Ryzen 5 7600X, AMD Ryzen 5 7600X | |
| AMD Ryzen 7 7800X3D, AMD Ryzen 7 7800X3D, AMD Ryzen 7 7800X3D | |
| AMD Ryzen 9 7950X3D, AMD Ryzen 9 7950X3D, AMD Ryzen 9 7950X3D | |
| Minisforum BD770i, AMD Ryzen 7 7745HX | |
| Intel Core i5-13400, Intel Core i5-13400, Intel Core i5-13400 | |
| Intel Core i5-12400F, Intel Core i5-12400F, Intel Core i5-12400F | |
| Minisforum EliteMini UM780 XTX, AMD Ryzen 7 7840HS | |
| Minisforum Venus Series UM790 Pro, AMD Ryzen 9 7940HS | |
| AMD Ryzen 9 5950X, AMD Ryzen 9 5950X, AMD Ryzen 9 5950X | |
| CrossMark / Productivity | |
| Palit GeForce RTX 4090 GameRock OC, Palit GeForce RTX 4090 GameRock OC, Intel Core i9-14900K | |
| Intel Core i9-13900K, Intel Core i9-13900K, Intel Core i9-13900K | |
| NVIDIA GeForce RTX 3090 Founders Edition, NVIDIA GeForce RTX 3090 Founders Edition, AMD Ryzen 9 7950X | |
| AMD Ryzen 9 7900X, AMD Ryzen 9 7900X, AMD Ryzen 9 7900X | |
| Intel Core i5-14600K, Intel Core i5-14600K, Intel Core i5-14600K | |
| Intel Core i5-13600K, Intel Core i5-13600K, Intel Core i5-13600K | |
| AMD Ryzen 5 7600X, AMD Ryzen 5 7600X, AMD Ryzen 5 7600X | |
| AMD Ryzen 7 7800X3D, AMD Ryzen 7 7800X3D, AMD Ryzen 7 7800X3D | |
| Minisforum BD770i, AMD Ryzen 7 7745HX | |
| AMD Ryzen 9 7950X3D, AMD Ryzen 9 7950X3D, AMD Ryzen 9 7950X3D | |
| Intel Core i5-13400, Intel Core i5-13400, Intel Core i5-13400 | |
| Minisforum Venus Series UM790 Pro, AMD Ryzen 9 7940HS | |
| Intel Core i5-12400F, Intel Core i5-12400F, Intel Core i5-12400F | |
| Minisforum EliteMini UM780 XTX, AMD Ryzen 7 7840HS | |
| AMD Ryzen 9 5950X, AMD Ryzen 9 5950X, AMD Ryzen 9 5950X | |
| CrossMark / Creativity | |
| Palit GeForce RTX 4090 GameRock OC, Palit GeForce RTX 4090 GameRock OC, Intel Core i9-14900K | |
| NVIDIA GeForce RTX 3090 Founders Edition, NVIDIA GeForce RTX 3090 Founders Edition, AMD Ryzen 9 7950X | |
| Intel Core i9-13900K, Intel Core i9-13900K, Intel Core i9-13900K | |
| AMD Ryzen 9 7900X, AMD Ryzen 9 7900X, AMD Ryzen 9 7900X | |
| Intel Core i5-14600K, Intel Core i5-14600K, Intel Core i5-14600K | |
| AMD Ryzen 9 7950X3D, AMD Ryzen 9 7950X3D, AMD Ryzen 9 7950X3D | |
| AMD Ryzen 7 7800X3D, AMD Ryzen 7 7800X3D, AMD Ryzen 7 7800X3D | |
| AMD Ryzen 5 7600X, AMD Ryzen 5 7600X, AMD Ryzen 5 7600X | |
| Intel Core i5-13600K, Intel Core i5-13600K, Intel Core i5-13600K | |
| Minisforum BD770i, AMD Ryzen 7 7745HX | |
| Minisforum EliteMini UM780 XTX, AMD Ryzen 7 7840HS | |
| Intel Core i5-13400, Intel Core i5-13400, Intel Core i5-13400 | |
| Minisforum Venus Series UM790 Pro, AMD Ryzen 9 7940HS | |
| Intel Core i5-12400F, Intel Core i5-12400F, Intel Core i5-12400F | |
| AMD Ryzen 9 5950X, AMD Ryzen 9 5950X, AMD Ryzen 9 5950X | |
| CrossMark / Responsiveness | |
| Intel Core i9-13900K, Intel Core i9-13900K, Intel Core i9-13900K | |
| Palit GeForce RTX 4090 GameRock OC, Palit GeForce RTX 4090 GameRock OC, Intel Core i9-14900K | |
| Intel Core i5-13600K, Intel Core i5-13600K, Intel Core i5-13600K | |
| NVIDIA GeForce RTX 3090 Founders Edition, NVIDIA GeForce RTX 3090 Founders Edition, AMD Ryzen 9 7950X | |
| AMD Ryzen 9 7900X, AMD Ryzen 9 7900X, AMD Ryzen 9 7900X | |
| AMD Ryzen 5 7600X, AMD Ryzen 5 7600X, AMD Ryzen 5 7600X | |
| Intel Core i5-14600K, Intel Core i5-14600K, Intel Core i5-14600K | |
| AMD Ryzen 7 7800X3D, AMD Ryzen 7 7800X3D, AMD Ryzen 7 7800X3D | |
| Minisforum BD770i, AMD Ryzen 7 7745HX | |
| Intel Core i5-13400, Intel Core i5-13400, Intel Core i5-13400 | |
| Intel Core i5-12400F, Intel Core i5-12400F, Intel Core i5-12400F | |
| AMD Ryzen 9 7950X3D, AMD Ryzen 9 7950X3D, AMD Ryzen 9 7950X3D | |
| Minisforum Venus Series UM790 Pro, AMD Ryzen 9 7940HS | |
| Minisforum EliteMini UM780 XTX, AMD Ryzen 7 7840HS | |
| AMD Ryzen 9 5950X, AMD Ryzen 9 5950X, AMD Ryzen 9 5950X | |
| AIDA64 / Memory Copy | |
| Palit GeForce RTX 4090 GameRock OC | |
| Palit GeForce RTX 4090 GameRock OC | |
| Intel Core i5-14600K | |
| Intel Core i9-13900K | |
| AMD Ryzen 9 7950X3D | |
| Intel Core i9-12900K | |
| NVIDIA GeForce RTX 3090 Founders Edition | |
| Intel Core i5-13400 | |
| Intel Core i5-13600K | |
| Intel Core i5-12400F | |
| Intel Core i5-12600K | |
| Genomsnitt av klass Desktop (54743 - 98416, n=21, senaste 2 åren) | |
| AMD Ryzen 9 7900X | |
| Minisforum EliteMini UM780 XTX | |
| AMD Ryzen 7 7800X3D | |
| Minisforum Venus Series UM790 Pro | |
| AMD Ryzen 5 7600X | |
| AMD Ryzen 9 5950X | |
| Minisforum BD770i | |
| Genomsnitt AMD Ryzen 7 7745HX (50007 - 53867, n=2) | |
| AIDA64 / Memory Read | |
| Palit GeForce RTX 4090 GameRock OC | |
| Palit GeForce RTX 4090 GameRock OC | |
| Intel Core i5-14600K | |
| Intel Core i9-13900K | |
| Intel Core i9-12900K | |
| AMD Ryzen 9 7950X3D | |
| NVIDIA GeForce RTX 3090 Founders Edition | |
| Intel Core i5-13400 | |
| Intel Core i5-12600K | |
| Intel Core i5-13600K | |
| Genomsnitt av klass Desktop (58375 - 110448, n=21, senaste 2 åren) | |
| AMD Ryzen 9 7900X | |
| Intel Core i5-12400F | |
| AMD Ryzen 9 5950X | |
| AMD Ryzen 7 7800X3D | |
| Minisforum EliteMini UM780 XTX | |
| Minisforum Venus Series UM790 Pro | |
| AMD Ryzen 5 7600X | |
| Minisforum BD770i | |
| Genomsnitt AMD Ryzen 7 7745HX (50703 - 54278, n=2) | |
| AIDA64 / Memory Write | |
| AMD Ryzen 7 7800X3D | |
| Minisforum EliteMini UM780 XTX | |
| AMD Ryzen 9 7950X3D | |
| Intel Core i5-14600K | |
| Palit GeForce RTX 4090 GameRock OC | |
| Palit GeForce RTX 4090 GameRock OC | |
| AMD Ryzen 5 7600X | |
| NVIDIA GeForce RTX 3090 Founders Edition | |
| Minisforum Venus Series UM790 Pro | |
| Genomsnitt av klass Desktop (60635 - 93889, n=21, senaste 2 åren) | |
| AMD Ryzen 9 7900X | |
| Intel Core i9-13900K | |
| Intel Core i5-13400 | |
| Intel Core i5-12600K | |
| Intel Core i5-12400F | |
| Intel Core i9-12900K | |
| Intel Core i5-13600K | |
| Minisforum BD770i | |
| Genomsnitt AMD Ryzen 7 7745HX (54587 - 70803, n=2) | |
| AMD Ryzen 9 5950X | |
| AIDA64 / Memory Latency | |
| Minisforum EliteMini UM780 XTX | |
| Genomsnitt av klass Desktop (68.5 - 168, n=21, senaste 2 åren) | |
| Minisforum Venus Series UM790 Pro | |
| Genomsnitt AMD Ryzen 7 7745HX (80.7 - 86.5, n=2) | |
| Intel Core i5-13600K | |
| Minisforum BD770i | |
| Intel Core i5-12400F | |
| Intel Core i5-13400 | |
| Intel Core i9-13900K | |
| Palit GeForce RTX 4090 GameRock OC | |
| Palit GeForce RTX 4090 GameRock OC | |
| Intel Core i5-14600K | |
| AMD Ryzen 7 7800X3D | |
| AMD Ryzen 9 5950X | |
| AMD Ryzen 9 7950X3D | |
| AMD Ryzen 5 7600X | |
| AMD Ryzen 9 7900X | |
| NVIDIA GeForce RTX 3090 Founders Edition | |
* ... mindre är bättre
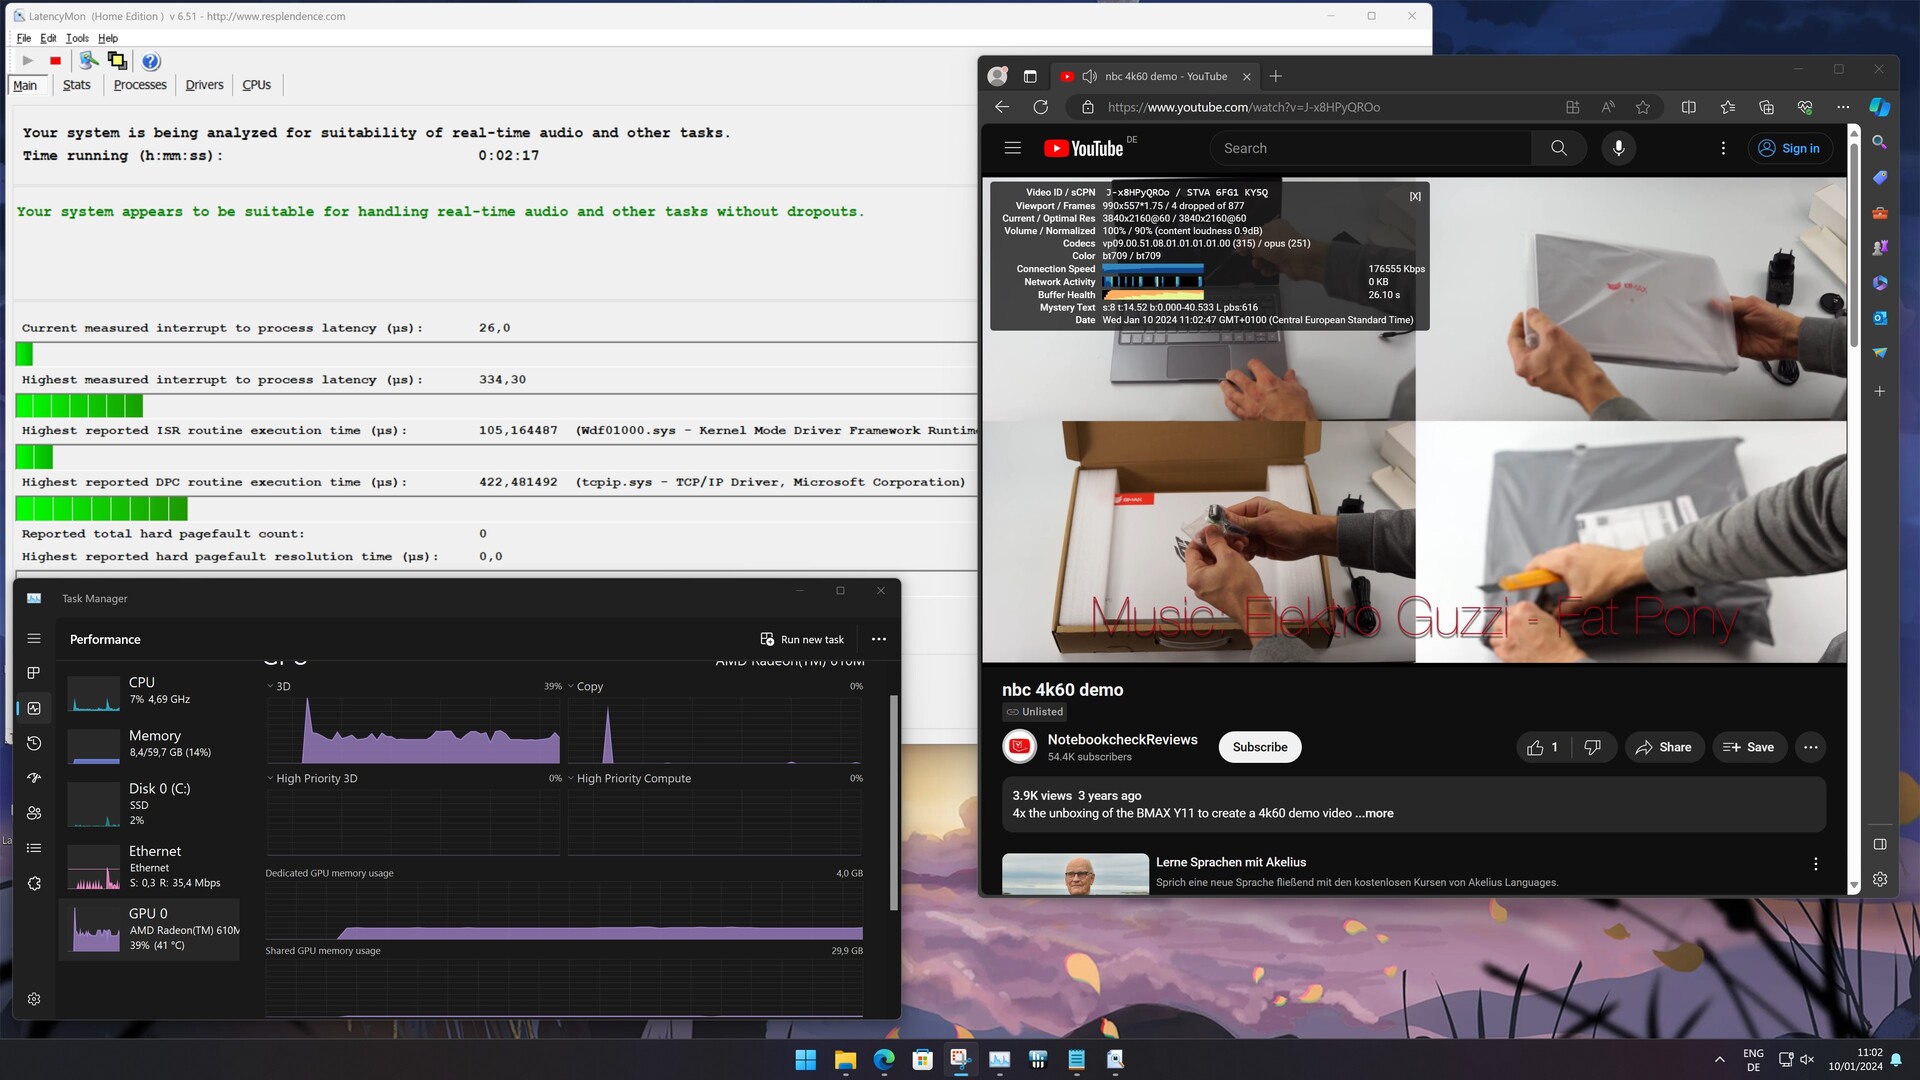
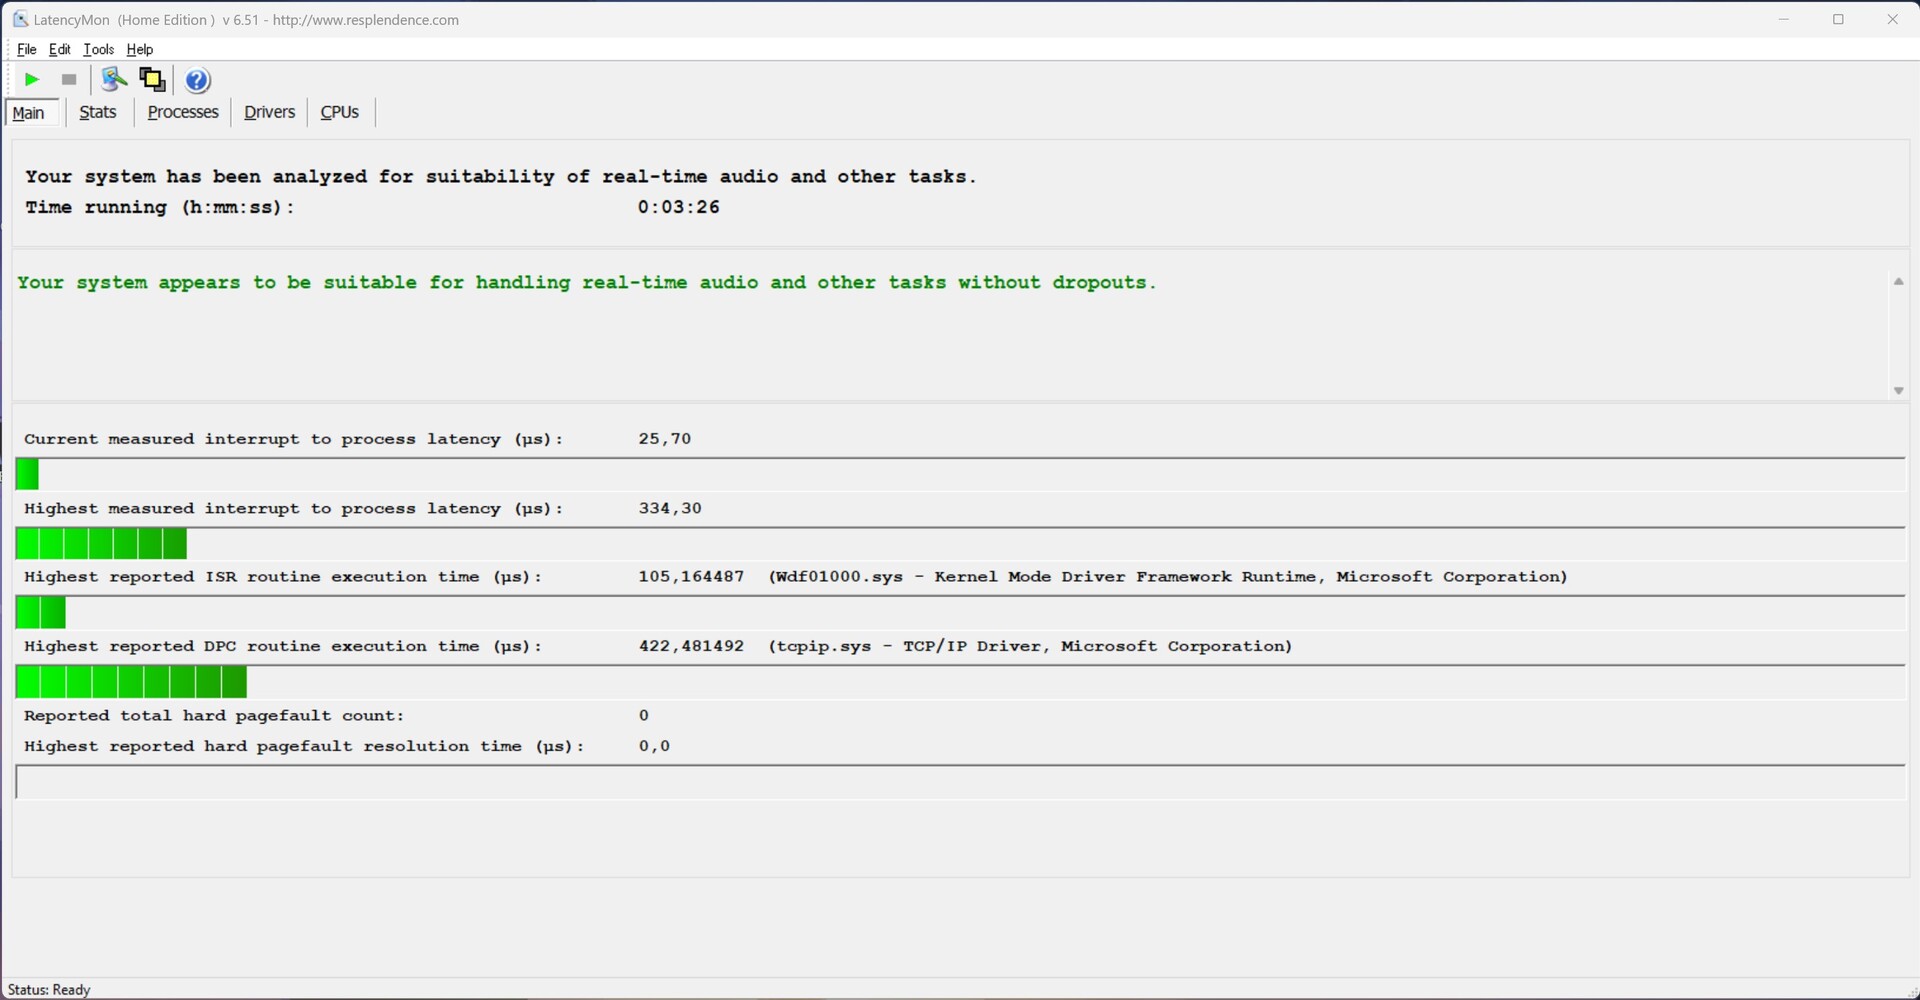
DPC-fördröjning
I vårt testsystem byggt kring Minisforum BD770i observerade vi mycket låga latenser. Oavsett om vi ägnade oss åt enkel internetsurfning eller spelade upp en 4K-testvideo, ledde inte ens Prime95-stresstestet till höga fördröjningar. Som ett resultat är Minisforum BD770i moderkort väl lämpat för att skapa kompakta och tysta streamingsystem för vardagsrummet.
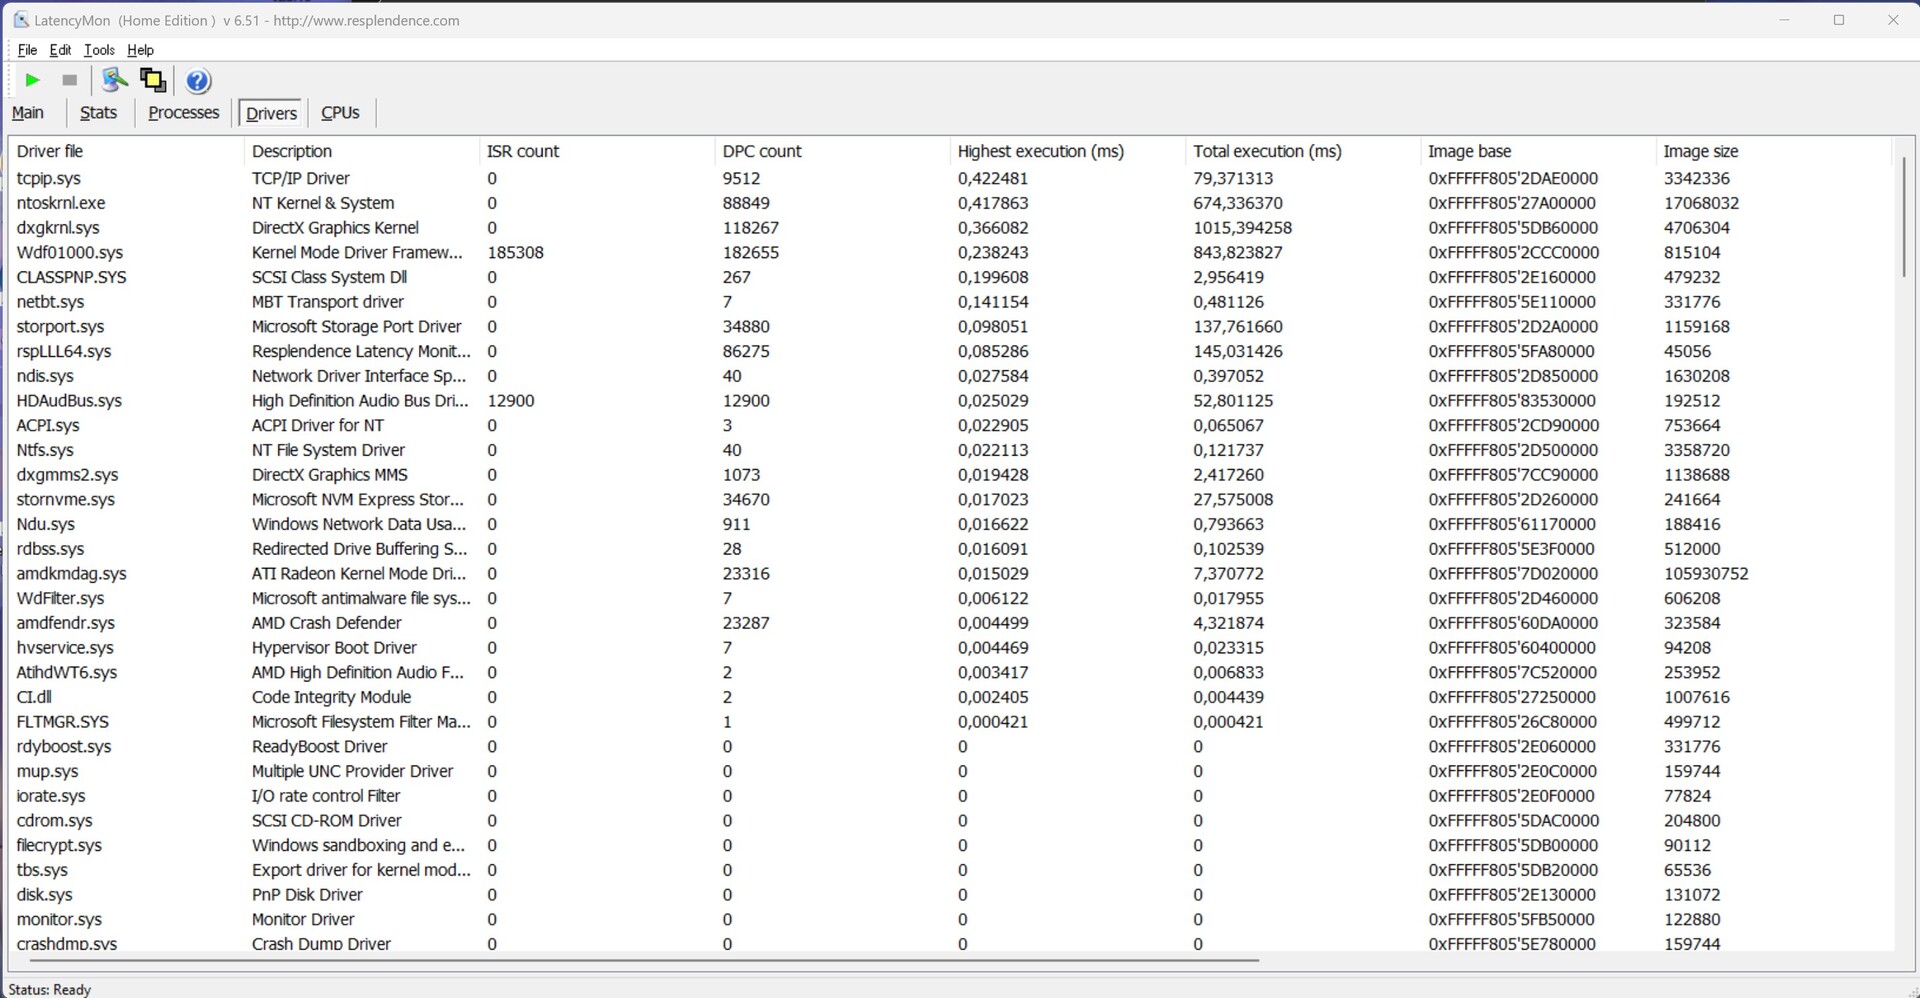
| DPC Latencies / LatencyMon - interrupt to process latency (max), Web, Youtube, Prime95 | |
| Minisforum EliteMini UM780 XTX | |
| Minisforum Venus Series UM790 Pro | |
| Minisforum BD770i | |
* ... mindre är bättre
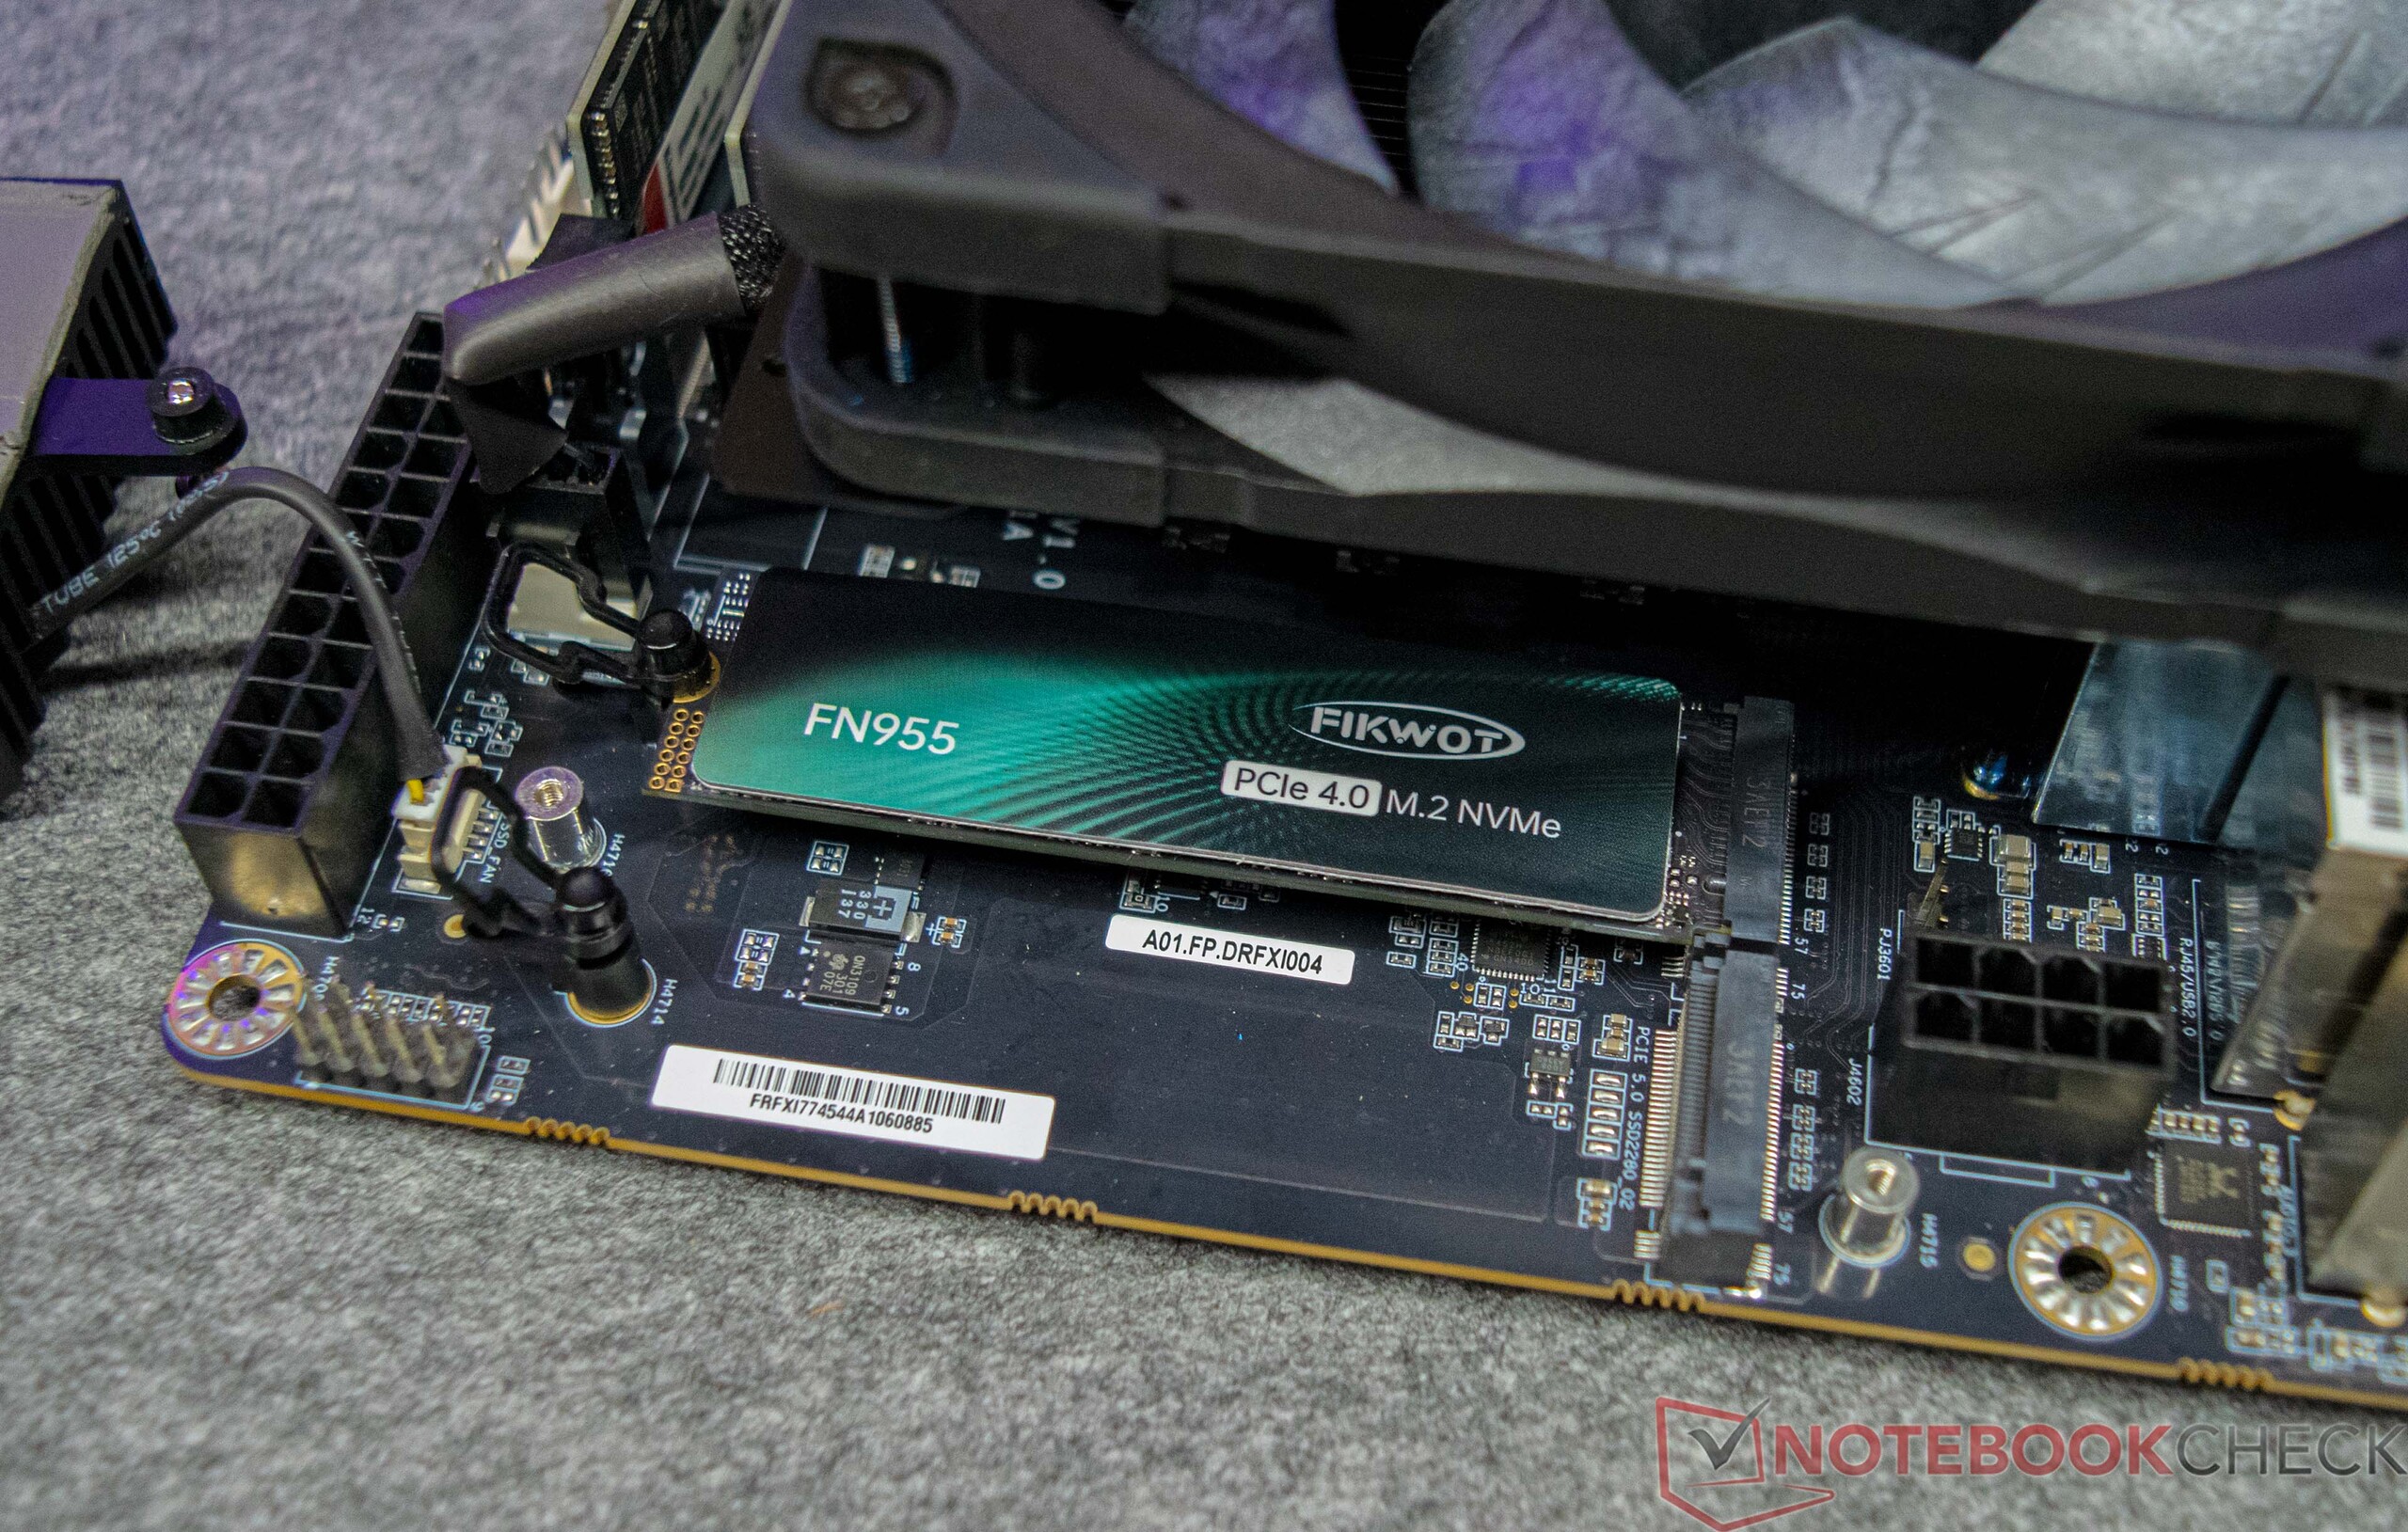
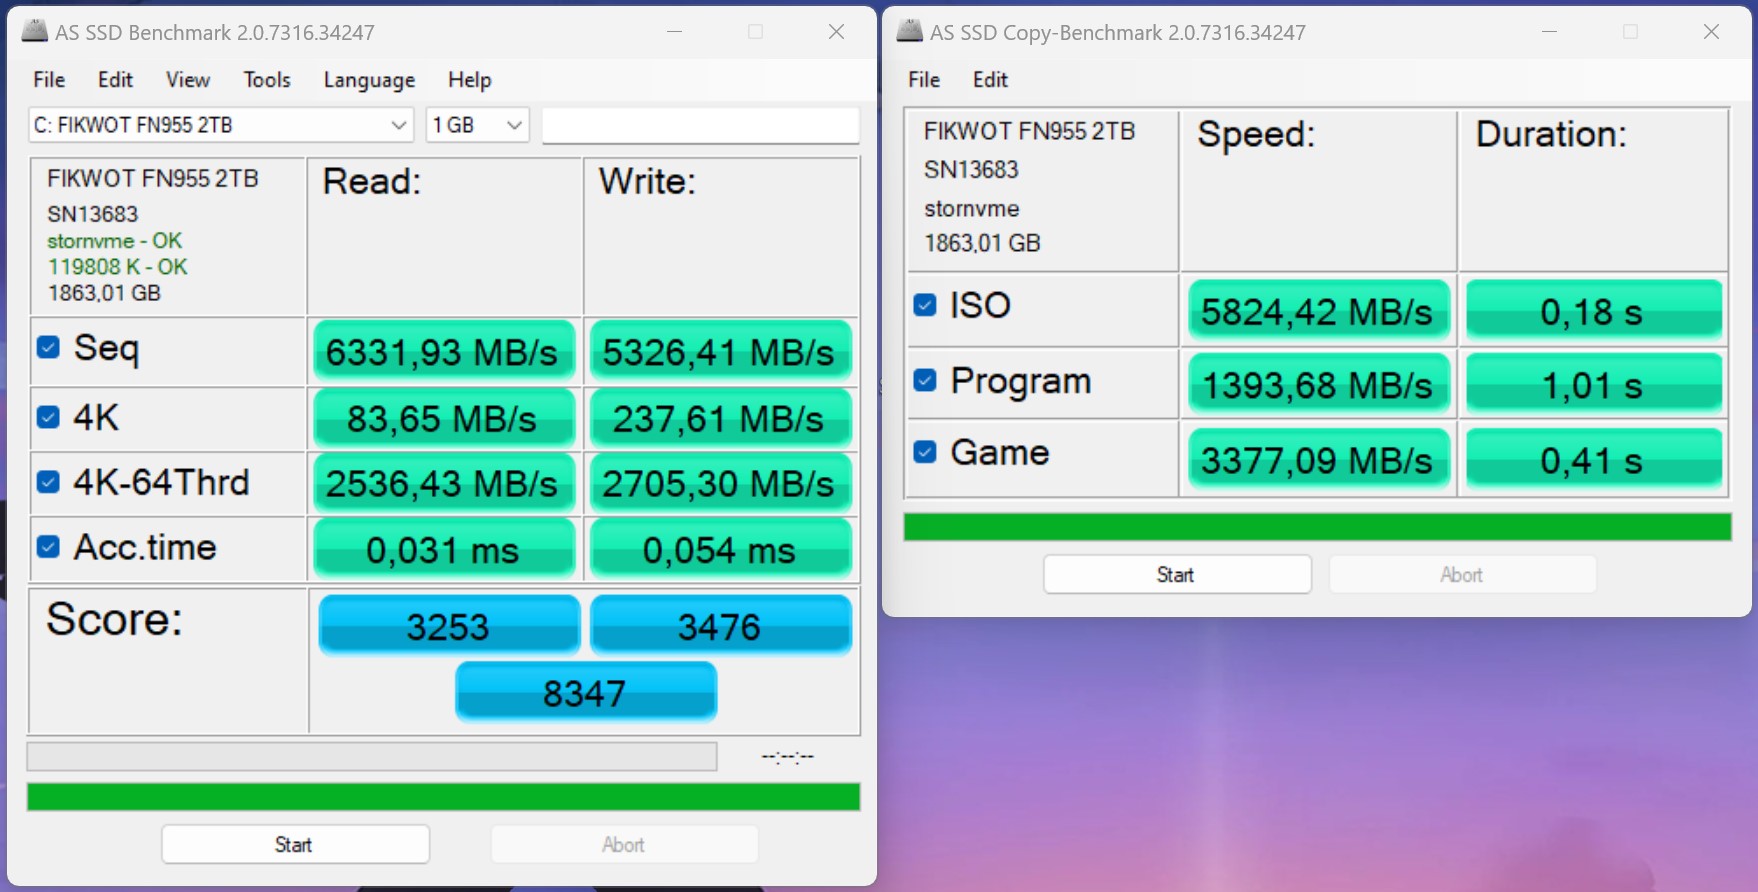
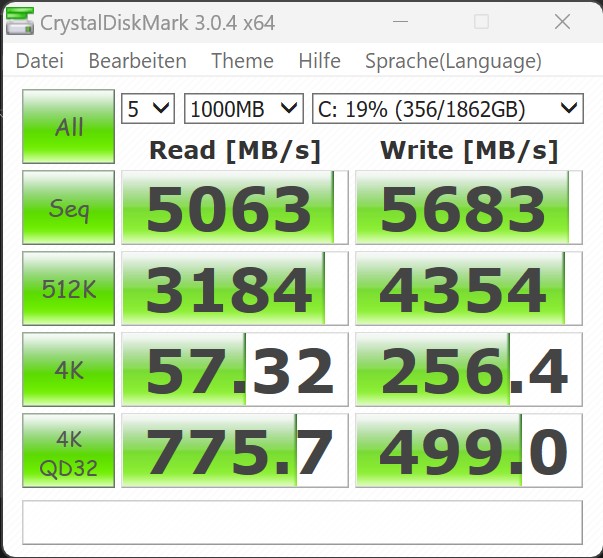
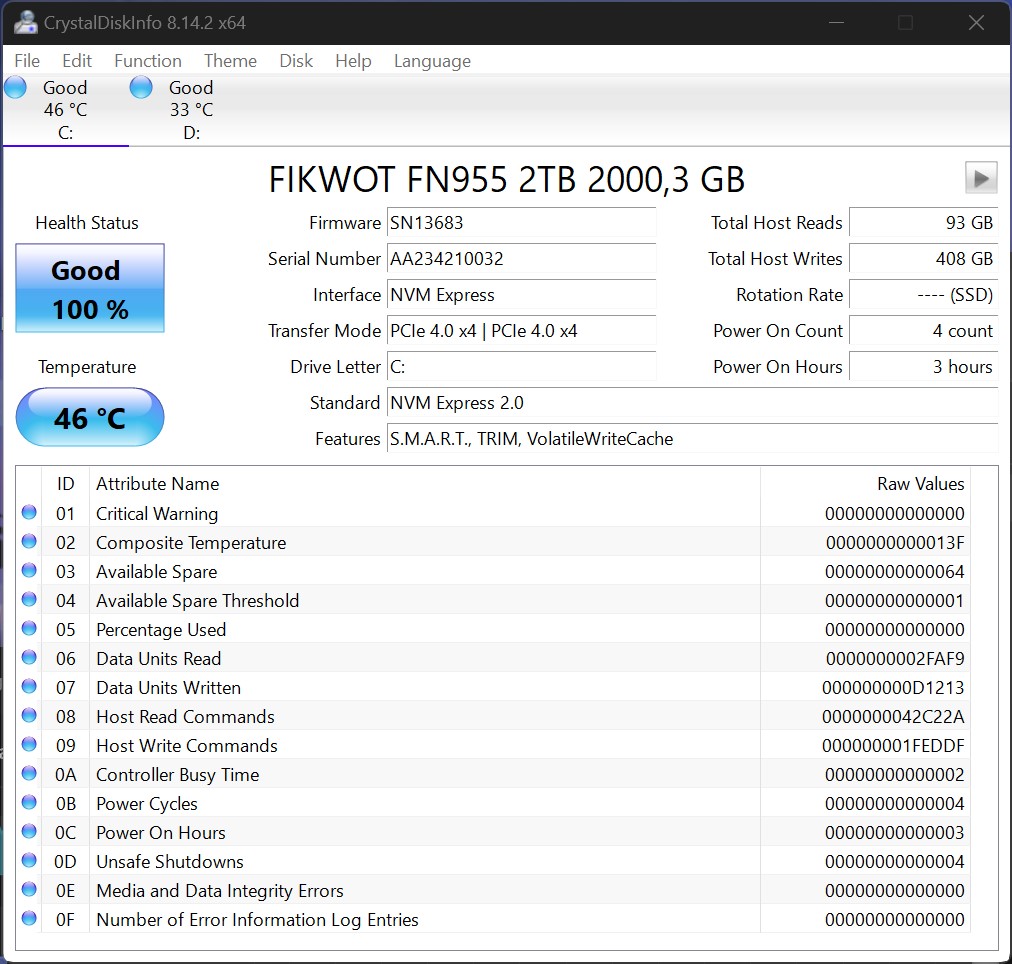
Lagringsenheter
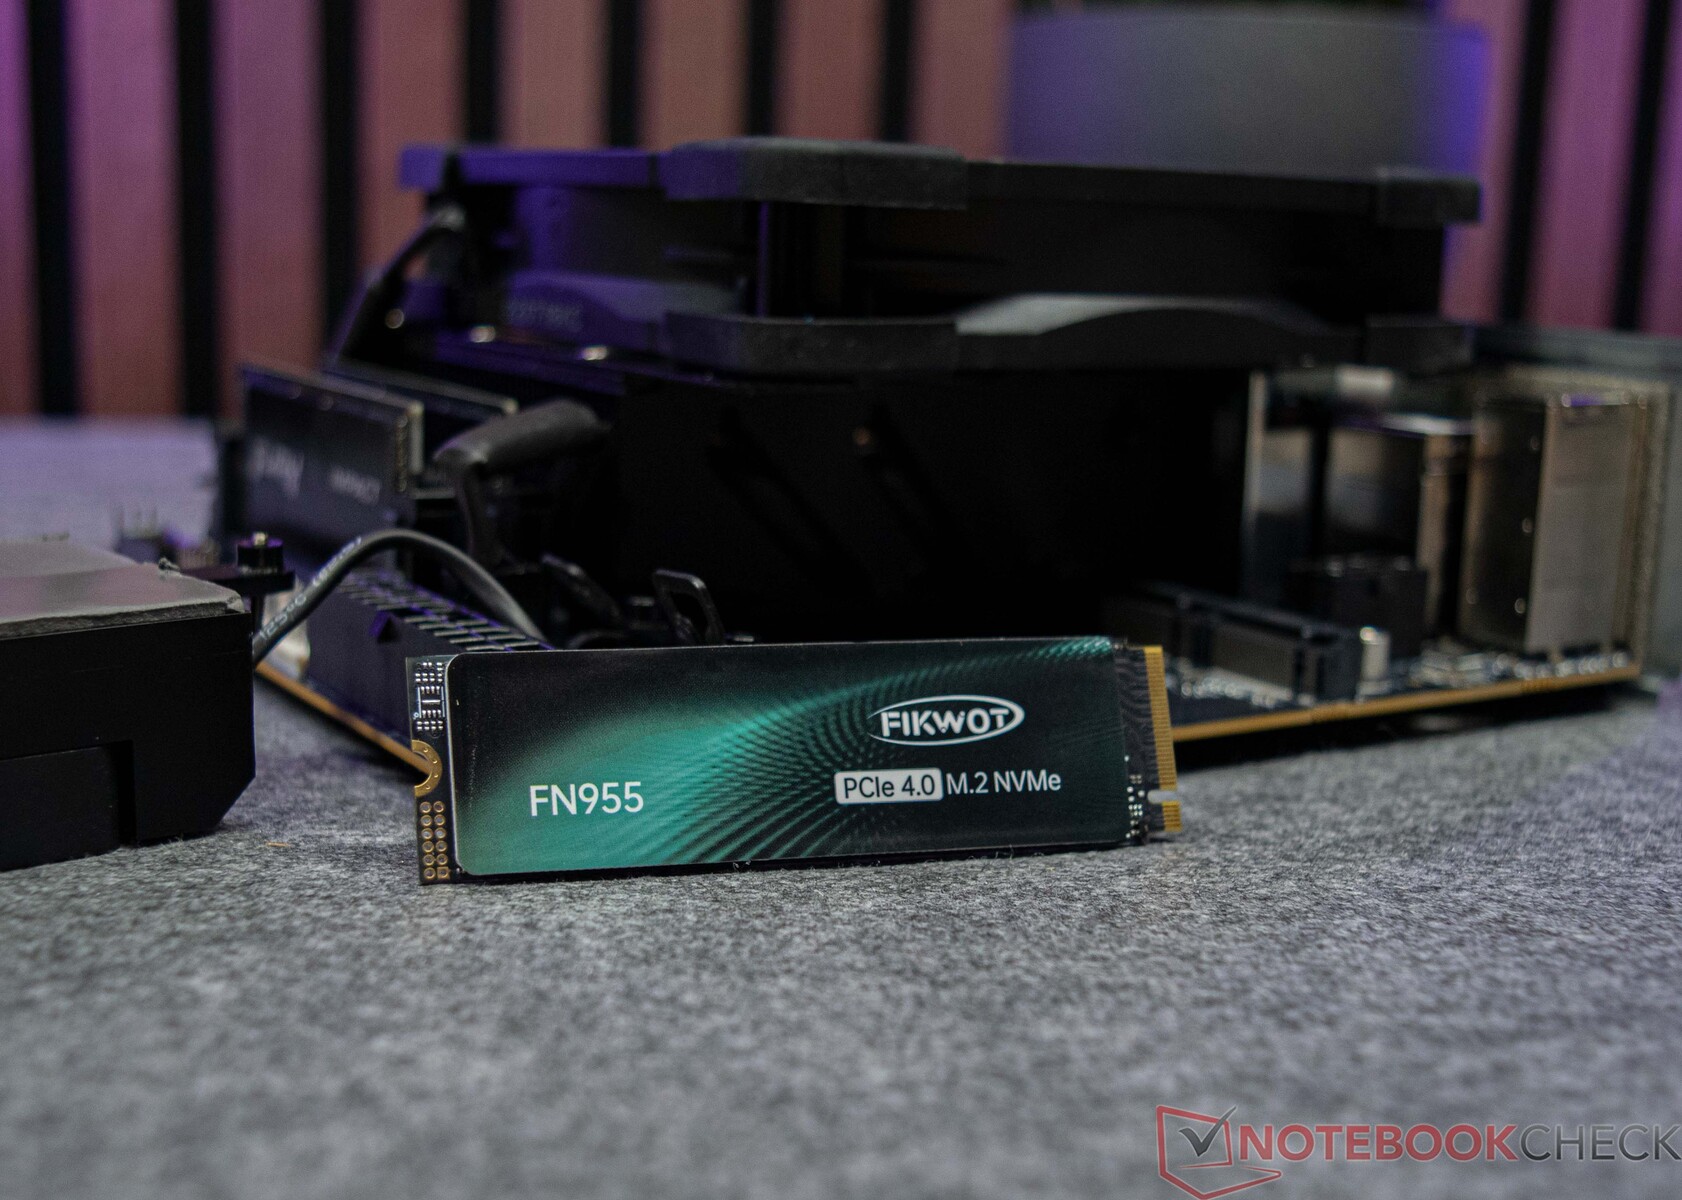
Som tidigare nämnts tillhandahåller Minisforum moderkortet BD770i utan inbyggd masslagring. För våra teständamål använde vi en relativt prisvärd 2 TB SSD från tillverkaren Fikwot. Denna modell använder M.2-gränssnittet och ansluts via PCIe 4.0 x4, vilket resulterar i utmärkta överföringshastigheter. Moderkortet stöder upp till två masslagringsenheter och är kompatibelt med den senaste PCI 5.0-standarden. SSD-enheterna kan också utrustas med aktiv kylning, vilket är särskilt fördelaktigt för PCIe 5.0 SSD-enheter. Under våra tester uppvisade vår SSD inga termiska problem under belastning och bibehöll konsekvent prestanda.
För ytterligare jämförelser och riktmärken, se vår jämförelsetabell.
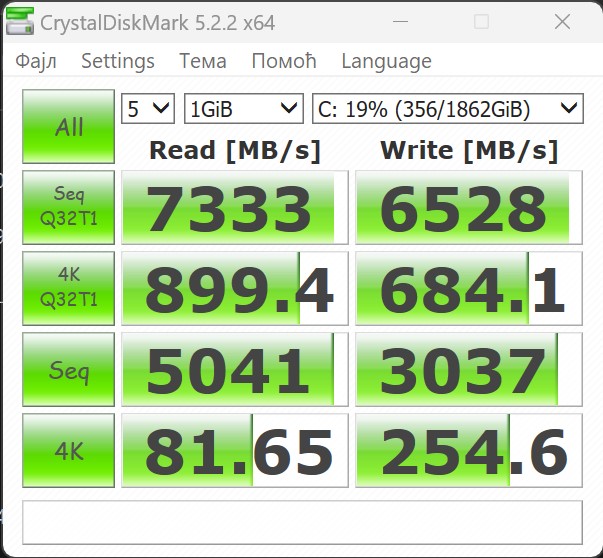
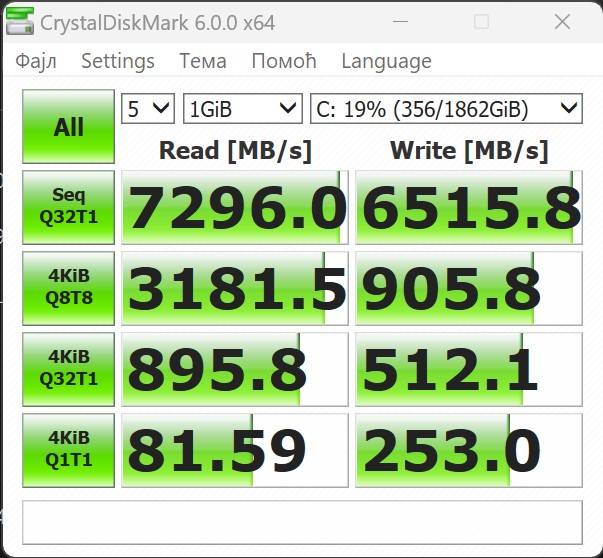

"Reading continuous performance: DiskSpd Read Loop, Queue Depth 8 "
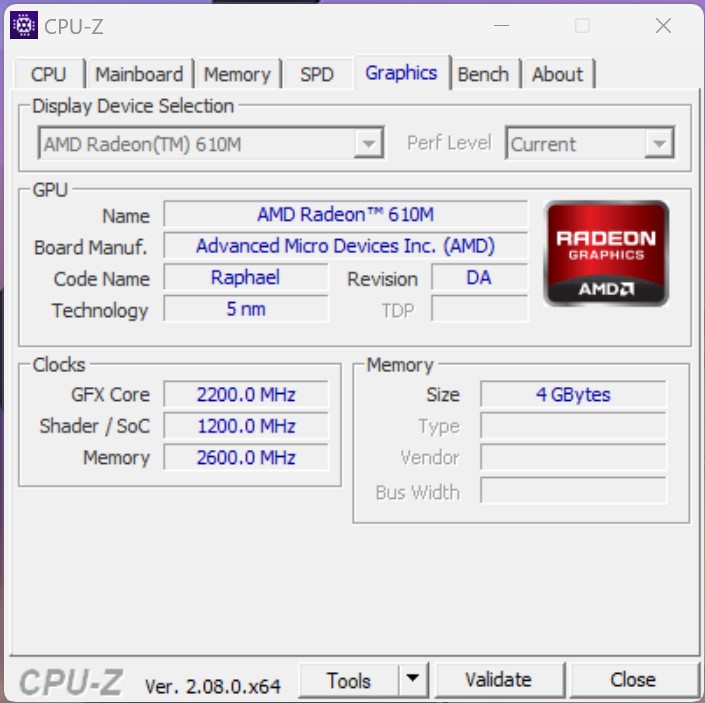
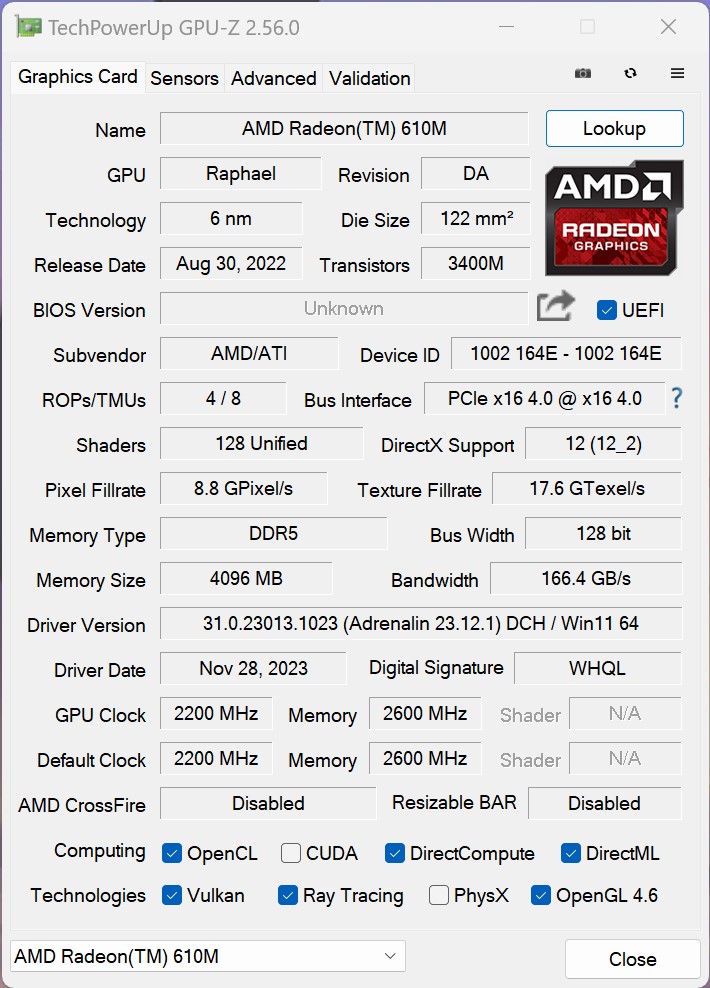
Grafikkort - AMD Radeon 610M som iGPU
AMD Ryzen 7 AMD Ryzen 7 7745HX är utrustad med en AMD Radeon 610M iGPU. Denna iGPU är dock baserad på RDNA2-arkitekturen och erbjuder endast 2 beräkningsenheter (CU), vilket resulterar i totalt 128 shader-enheter som hanterar 3D-beräkningar. Följaktligen är prestandan hos AMD Radeon 610M relativt blygsam. I vår genomsnittliga jämförelse överträffade Minisforum BD770is iGPU den hos en konventionell bärbar dator men var begränsad till enkla grafikuppgifter. Förväntningar utöver enkel bildproduktion bör hållas i schack med tanke på begränsningarna i denna grafiklösning på instegsnivå.
För ytterligare jämförelser och riktmärken, se vår GPU-jämförelsetabell.
| Performance rating - Percent | |
| Minisforum EliteMini UM780 XTX | |
| Minisforum Venus Series UM790 Pro | |
| Minisforum Mars Series MC560 | |
| NiPoGi AD08 | |
| Acemagic AD15 | |
| Minisforum BD770i | |
| Genomsnitt AMD Radeon 610M | |
| Performance rating - Percent | |
| NiPoGi AD08 | |
| Minisforum EliteMini UM780 XTX | |
| Minisforum Venus Series UM790 Pro | |
| Genomsnitt AMD Radeon 610M | |
| Acemagic AD15 | |
| Minisforum Mars Series MC560 | |
| Minisforum BD770i | |
| Unigine Valley 1.0 | |
| 1920x1080 Extreme HD DirectX AA:x8 | |
| Minisforum EliteMini UM780 XTX | |
| Minisforum Venus Series UM790 Pro | |
| Minisforum Mars Series MC560 | |
| NiPoGi AD08 | |
| Minisforum BD770i | |
| Genomsnitt AMD Radeon 610M (9.8 - 10, n=4) | |
| Acemagic AD15 | |
| 1920x1080 Extreme HD Preset OpenGL AA:x8 | |
| Minisforum EliteMini UM780 XTX | |
| Minisforum Venus Series UM790 Pro | |
| NiPoGi AD08 | |
| Minisforum Mars Series MC560 | |
| Acemagic AD15 | |
| Minisforum BD770i | |
| Genomsnitt AMD Radeon 610M (9.1 - 9.6, n=4) | |
| Affinity Photo 2 - Combined (Single / Multi GPU) | |
| NiPoGi AD08 | |
| Genomsnitt AMD Radeon 610M (889 - 5750, n=4) | |
| Acemagic AD15 | |
| Minisforum EliteMini UM780 XTX | |
| Minisforum Mars Series MC560 | |
| Minisforum Venus Series UM790 Pro | |
| Minisforum BD770i | |
| 3DMark 06 Standard Score | 20555 poäng | |
| 3DMark Vantage P Result | 12092 poäng | |
| 3DMark 11 Performance | 3873 poäng | |
| 3DMark Ice Storm Standard Score | 41556 poäng | |
| 3DMark Cloud Gate Standard Score | 14629 poäng | |
| 3DMark Fire Strike Score | 2156 poäng | |
| 3DMark Fire Strike Extreme Score | 530 poäng | |
| 3DMark Time Spy Score | 740 poäng | |
Hjälp | ||
Spelprestanda - AMD Radeon 610M
Endast en begränsad mängd 3D-applikationer kan dra nytta av AMD Radeon 610M: s prestanda, vilket framgår av de syntetiska riktmärkena. Detta är också uppenbart i speltesterna. Den integrerade GPU:n (iGPU) kan bara generera anständiga bildfrekvenser vid de lägsta grafiska inställningarna och en upplösning på bara 1 280 x 720 pixlar. De två Mini-PC som är utrustade med AMD Radeon 780m iGPU ger märkbart bättre prestanda, men även i dessa fall når systemet snabbt sina gränser när man försöker spela moderna spel. Alla aktuella grafikkort kan enkelt anslutas via PCI Express-gränssnittet.
För en omfattande översikt över iGPU:ns prestanda jämfört med andra grafikkort, se vår GPU-spellista.
| The Witcher 3 | |
| 1024x768 Low Graphics & Postprocessing (sortera efter värde) | |
| Minisforum EliteMini UM780 XTX | |
| Minisforum Venus Series UM790 Pro | |
| Minisforum BD770i | |
| NiPoGi AD08 | |
| Acemagic AD15 | |
| Minisforum Mars Series MC560 | |
| 1920x1080 High Graphics & Postprocessing (Nvidia HairWorks Off) (sortera efter värde) | |
| Minisforum EliteMini UM780 XTX | |
| Minisforum Venus Series UM790 Pro | |
| Minisforum BD770i | |
| NiPoGi AD08 | |
| Acemagic AD15 | |
| Minisforum Mars Series MC560 | |
| Borderlands 3 | |
| 1280x720 Very Low Overall Quality (DX11) (sortera efter värde) | |
| Minisforum EliteMini UM780 XTX | |
| Minisforum Venus Series UM790 Pro | |
| Minisforum BD770i | |
| NiPoGi AD08 | |
| Acemagic AD15 | |
| Minisforum Mars Series MC560 | |
| 1920x1080 High Overall Quality (DX11) (sortera efter värde) | |
| Minisforum EliteMini UM780 XTX | |
| Minisforum Venus Series UM790 Pro | |
| Minisforum BD770i | |
| NiPoGi AD08 | |
| Acemagic AD15 | |
| Minisforum Mars Series MC560 | |
| GTA V | |
| 1024x768 Lowest Settings possible (sortera efter värde) | |
| Minisforum EliteMini UM780 XTX | |
| Minisforum Venus Series UM790 Pro | |
| Minisforum BD770i | |
| NiPoGi AD08 | |
| Acemagic AD15 | |
| Minisforum Mars Series MC560 | |
| 1920x1080 High/On (Advanced Graphics Off) AA:2xMSAA + FX AF:8x (sortera efter värde) | |
| Minisforum EliteMini UM780 XTX | |
| Minisforum Venus Series UM790 Pro | |
| Minisforum BD770i | |
| NiPoGi AD08 | |
| Acemagic AD15 | |
| Minisforum Mars Series MC560 | |
| Tiny Tina's Wonderlands | |
| 1280x720 Lowest Preset (DX12) (sortera efter värde) | |
| Minisforum EliteMini UM780 XTX | |
| Minisforum Venus Series UM790 Pro | |
| Minisforum BD770i | |
| Acemagic AD15 | |
| Minisforum Mars Series MC560 | |
| 1920x1080 High Preset (DX12) (sortera efter värde) | |
| Minisforum EliteMini UM780 XTX | |
| Minisforum Venus Series UM790 Pro | |
| Minisforum BD770i | |
| Acemagic AD15 | |
| Minisforum Mars Series MC560 | |
| Metro Exodus | |
| 1280x720 Low Quality AF:4x (sortera efter värde) | |
| Minisforum EliteMini UM780 XTX | |
| Minisforum Venus Series UM790 Pro | |
| Minisforum BD770i | |
| NiPoGi AD08 | |
| 1920x1080 High Quality AF:16x (sortera efter värde) | |
| Minisforum EliteMini UM780 XTX | |
| Minisforum Venus Series UM790 Pro | |
| Minisforum BD770i | |
| NiPoGi AD08 | |
| Shadow of the Tomb Raider | |
| 1280x720 Lowest Preset (sortera efter värde) | |
| Minisforum EliteMini UM780 XTX | |
| Minisforum Venus Series UM790 Pro | |
| Minisforum BD770i | |
| NiPoGi AD08 | |
| Acemagic AD15 | |
| 1920x1080 High Preset AA:SM (sortera efter värde) | |
| Minisforum EliteMini UM780 XTX | |
| Minisforum Venus Series UM790 Pro | |
| Minisforum BD770i | |
| NiPoGi AD08 | |
| Acemagic AD15 | |
| låg | med. | hög | ultra | |
|---|---|---|---|---|
| GTA V (2015) | 134.5 | 101.9 | 23.1 | 10.5 |
| The Witcher 3 (2015) | 44 | 26.2 | 13.5 | 8.49 |
| Final Fantasy XV Benchmark (2018) | 26.8 | 12.3 | 8.79 | |
| X-Plane 11.11 (2018) | 44.7 | 26.2 | 22.9 | |
| Far Cry 5 (2018) | 34 | 15 | 14 | 13 |
| Strange Brigade (2018) | 67.7 | 21.4 | 17 | |
| Shadow of the Tomb Raider (2018) | 40 | 14 | 12.6 | 10.5 |
| Far Cry New Dawn (2019) | 35 | 17 | 16 | 14 |
| Metro Exodus (2019) | 28.4 | 11.8 | 8.4 | 6.95 |
| Borderlands 3 (2019) | 40.3 | 14.9 | 9.04 | 6.48 |
| Tiny Tina's Wonderlands (2022) | 18.1 | 14.5 | 9.24 | 6.92 |
Minisforum BD770i med Nvidia GeForce RTX 4090
Om du tänker använda Minisforum BD770i-moderkortet som grund för ett spelsystem kan du fortsätta utan att tveka. AMD Ryzen 7 7745HX har gott om prestandareserver för att hålla jämna steg med nuvarande system. I syntetiska riktmärken lyckades vårt testsystem till och med säkra den tredje positionen. På grund av grafikkortets storlek var vi dock tvungna att använda Minisforum BD770i i en öppen konfiguration för dessa tester, eftersom Pait GeForce RTX 4090 Gamerock OC är för stort för Phanteks Enthoo Evolv Shift XT-chassit.
När det gäller spelbenchmarks är det viktigt att göra en distinktion: när man bestämmer ren CPU-prestanda är det viktigt att hålla sig inom CPU-gränsen. I det här scenariot är AMD Ryzen 7 7745HX i nivå med en Intel Core i7-13700, och även Intel Core i7-13700K kan inte överträffa den. Rankningen av vårt testexemplar förblir konsekvent vid högre detaljnivåer och maximala inställningar. Minisforum BD770i-moderkortet fortsätter att konkurrera med Intel Core i7-13700, och när man undersöker enskilda tester separat kan AMD Ryzen 7 7745HX, i kombination med Palit GeForce RTX 4090 Gamerock OC, konkurrera med toppmodeller i vissa fall. Alla aktuella titlar kan spelas smidigt i 2 160p utan detaljförlust i denna konfiguration.
Alla system som listas i denna jämförelse testades med samma grafikkort, nämligen Pait GeForce RTX 4090 Gamerock OC.
En viktig anmärkning vid användning av ett Nvidia GeForce RTX 4090:
Vårt testexemplar av Minisforum BD770i var inte utrustad med den senaste BIOS under testningen. Följaktligen var grafikkortet endast anslutet med PCIe 4.0 x1. Version 1.05 är den enda som tillåter grafikkortet att köras med maximal bandbredd; den kan hittas på supportwebbplatsen. BIOS-uppdateringsprocessen kan initieras direkt från Windows.
| Performance rating - Percent | |
| NVIDIA GeForce RTX 4090, Intel Core i9-14900K | |
| NVIDIA GeForce RTX 4090, Intel Core i5-14600K | |
| NVIDIA GeForce RTX 4090, AMD Ryzen 7 7745HX | |
| NVIDIA GeForce RTX 4090, AMD Ryzen 9 7950X | |
| NVIDIA GeForce RTX 4090, AMD Ryzen 7 7800X3D | |
| NVIDIA GeForce RTX 4090, Intel Core i7-13700 | |
| NVIDIA GeForce RTX 4090, Intel Core i7-12700 | |
| NVIDIA GeForce RTX 4090, Intel Core i5-13400 | |
| NVIDIA GeForce RTX 4090, Intel Core i5-12400F -6! | |
| 3DMark 11 - 1280x720 Performance GPU | |
| NVIDIA GeForce RTX 4090, AMD Ryzen 7 7745HX | |
| NVIDIA GeForce RTX 4090, AMD Ryzen 7 7800X3D | |
| NVIDIA GeForce RTX 4090, Intel Core i5-14600K | |
| NVIDIA GeForce RTX 4090, AMD Ryzen 9 7950X | |
| NVIDIA GeForce RTX 4090, Intel Core i7-13700 | |
| NVIDIA GeForce RTX 4090, Intel Core i7-12700 | |
| NVIDIA GeForce RTX 4090, Intel Core i5-13400 | |
| NVIDIA GeForce RTX 4090, Intel Core i9-14900K | |
| NVIDIA GeForce RTX 4090, Intel Core i5-12400F | |
| 3DMark | |
| 2560x1440 Time Spy Graphics | |
| NVIDIA GeForce RTX 4090, AMD Ryzen 7 7745HX | |
| NVIDIA GeForce RTX 4090, Intel Core i5-14600K | |
| NVIDIA GeForce RTX 4090, Intel Core i9-14900K | |
| NVIDIA GeForce RTX 4090, AMD Ryzen 7 7800X3D | |
| NVIDIA GeForce RTX 4090, Intel Core i7-13700 | |
| NVIDIA GeForce RTX 4090, AMD Ryzen 9 7950X | |
| NVIDIA GeForce RTX 4090, Intel Core i7-12700 | |
| NVIDIA GeForce RTX 4090, Intel Core i5-13400 | |
| NVIDIA GeForce RTX 4090, Intel Core i5-12400F | |
| 1920x1080 Fire Strike Graphics | |
| NVIDIA GeForce RTX 4090, AMD Ryzen 7 7745HX | |
| NVIDIA GeForce RTX 4090, Intel Core i5-14600K | |
| NVIDIA GeForce RTX 4090, Intel Core i5-12400F | |
| NVIDIA GeForce RTX 4090, Intel Core i7-12700 | |
| NVIDIA GeForce RTX 4090, Intel Core i7-13700 | |
| NVIDIA GeForce RTX 4090, Intel Core i5-13400 | |
| NVIDIA GeForce RTX 4090, AMD Ryzen 7 7800X3D | |
| NVIDIA GeForce RTX 4090, AMD Ryzen 9 7950X | |
| NVIDIA GeForce RTX 4090, Intel Core i9-14900K | |
| 3840x2160 Fire Strike Ultra Graphics | |
| NVIDIA GeForce RTX 4090, AMD Ryzen 7 7800X3D | |
| NVIDIA GeForce RTX 4090, AMD Ryzen 7 7745HX | |
| NVIDIA GeForce RTX 4090, Intel Core i5-14600K | |
| NVIDIA GeForce RTX 4090, Intel Core i7-13700 | |
| NVIDIA GeForce RTX 4090, Intel Core i5-13400 | |
| NVIDIA GeForce RTX 4090, AMD Ryzen 9 7950X | |
| NVIDIA GeForce RTX 4090, Intel Core i9-14900K | |
| NVIDIA GeForce RTX 4090, Intel Core i7-12700 | |
| NVIDIA GeForce RTX 4090, Intel Core i5-12400F | |
| Unigine Superposition | |
| 1280x720 720p Low | |
| NVIDIA GeForce RTX 4090, Intel Core i9-14900K | |
| NVIDIA GeForce RTX 4090, AMD Ryzen 7 7800X3D | |
| NVIDIA GeForce RTX 4090, AMD Ryzen 9 7950X | |
| NVIDIA GeForce RTX 4090, AMD Ryzen 7 7745HX | |
| NVIDIA GeForce RTX 4090, Intel Core i7-13700 | |
| NVIDIA GeForce RTX 4090, Intel Core i5-14600K | |
| NVIDIA GeForce RTX 4090, Intel Core i7-12700 | |
| NVIDIA GeForce RTX 4090, Intel Core i5-13400 | |
| NVIDIA GeForce RTX 4090, Intel Core i5-12400F | |
| 1920x1080 1080p High | |
| NVIDIA GeForce RTX 4090, Intel Core i9-14900K | |
| NVIDIA GeForce RTX 4090, AMD Ryzen 7 7800X3D | |
| NVIDIA GeForce RTX 4090, AMD Ryzen 9 7950X | |
| NVIDIA GeForce RTX 4090, AMD Ryzen 7 7745HX | |
| NVIDIA GeForce RTX 4090, Intel Core i7-13700 | |
| NVIDIA GeForce RTX 4090, Intel Core i5-14600K | |
| NVIDIA GeForce RTX 4090, Intel Core i7-12700 | |
| NVIDIA GeForce RTX 4090, Intel Core i5-13400 | |
| NVIDIA GeForce RTX 4090, Intel Core i5-12400F | |
| 1920x1080 1080p Extreme | |
| NVIDIA GeForce RTX 4090, AMD Ryzen 7 7800X3D | |
| NVIDIA GeForce RTX 4090, AMD Ryzen 7 7745HX | |
| NVIDIA GeForce RTX 4090, Intel Core i5-14600K | |
| NVIDIA GeForce RTX 4090, Intel Core i9-14900K | |
| NVIDIA GeForce RTX 4090, AMD Ryzen 9 7950X | |
| NVIDIA GeForce RTX 4090, Intel Core i7-13700 | |
| NVIDIA GeForce RTX 4090, Intel Core i5-13400 | |
| NVIDIA GeForce RTX 4090, Intel Core i7-12700 | |
| NVIDIA GeForce RTX 4090, Intel Core i5-12400F | |
| 3840x2160 4k Optimized | |
| NVIDIA GeForce RTX 4090, AMD Ryzen 9 7950X | |
| NVIDIA GeForce RTX 4090, Intel Core i7-13700 | |
| NVIDIA GeForce RTX 4090, Intel Core i9-14900K | |
| NVIDIA GeForce RTX 4090, Intel Core i5-14600K | |
| NVIDIA GeForce RTX 4090, AMD Ryzen 7 7800X3D | |
| NVIDIA GeForce RTX 4090, AMD Ryzen 7 7745HX | |
| NVIDIA GeForce RTX 4090, Intel Core i7-12700 | |
| NVIDIA GeForce RTX 4090, Intel Core i5-13400 | |
| NVIDIA GeForce RTX 4090, Intel Core i5-12400F | |
| 7680x4320 8k Optimized | |
| NVIDIA GeForce RTX 4090, AMD Ryzen 9 7950X | |
| NVIDIA GeForce RTX 4090, Intel Core i7-13700 | |
| NVIDIA GeForce RTX 4090, Intel Core i7-12700 | |
| NVIDIA GeForce RTX 4090, Intel Core i5-13400 | |
| NVIDIA GeForce RTX 4090, Intel Core i5-12400F | |
| NVIDIA GeForce RTX 4090, Intel Core i9-14900K | |
| NVIDIA GeForce RTX 4090, Intel Core i5-14600K | |
| NVIDIA GeForce RTX 4090, AMD Ryzen 7 7800X3D | |
| NVIDIA GeForce RTX 4090, AMD Ryzen 7 7745HX | |
| Unigine Valley 1.0 | |
| 1920x1080 Extreme HD DirectX AA:x8 | |
| NVIDIA GeForce RTX 4090, Intel Core i9-14900K | |
| NVIDIA GeForce RTX 4090, Intel Core i5-14600K | |
| NVIDIA GeForce RTX 4090, AMD Ryzen 9 7950X | |
| NVIDIA GeForce RTX 4090, Intel Core i7-13700 | |
| NVIDIA GeForce RTX 4090, AMD Ryzen 7 7745HX | |
| NVIDIA GeForce RTX 4090, AMD Ryzen 7 7800X3D | |
| NVIDIA GeForce RTX 4090, Intel Core i7-12700 | |
| NVIDIA GeForce RTX 4090, Intel Core i5-13400 | |
| NVIDIA GeForce RTX 4090, Intel Core i5-12400F | |
| 1920x1080 Extreme HD Preset OpenGL AA:x8 | |
| NVIDIA GeForce RTX 4090, Intel Core i9-14900K | |
| NVIDIA GeForce RTX 4090, Intel Core i5-14600K | |
| NVIDIA GeForce RTX 4090, Intel Core i7-13700 | |
| NVIDIA GeForce RTX 4090, AMD Ryzen 9 7950X | |
| NVIDIA GeForce RTX 4090, AMD Ryzen 7 7745HX | |
| NVIDIA GeForce RTX 4090, AMD Ryzen 7 7800X3D | |
| NVIDIA GeForce RTX 4090, Intel Core i7-12700 | |
| NVIDIA GeForce RTX 4090, Intel Core i5-13400 | |
| NVIDIA GeForce RTX 4090, Intel Core i5-12400F | |
| Unigine Heaven 4.0 | |
| Extreme Preset OpenGL | |
| NVIDIA GeForce RTX 4090, Intel Core i9-14900K | |
| NVIDIA GeForce RTX 4090, AMD Ryzen 7 7745HX | |
| NVIDIA GeForce RTX 4090, Intel Core i5-14600K | |
| NVIDIA GeForce RTX 4090, AMD Ryzen 9 7950X | |
| NVIDIA GeForce RTX 4090, Intel Core i7-13700 | |
| NVIDIA GeForce RTX 4090, AMD Ryzen 7 7800X3D | |
| NVIDIA GeForce RTX 4090, Intel Core i7-12700 | |
| NVIDIA GeForce RTX 4090, Intel Core i5-13400 | |
| NVIDIA GeForce RTX 4090, Intel Core i5-12400F | |
| Extreme Preset DX11 | |
| NVIDIA GeForce RTX 4090, AMD Ryzen 9 7950X | |
| NVIDIA GeForce RTX 4090, Intel Core i9-14900K | |
| NVIDIA GeForce RTX 4090, AMD Ryzen 7 7745HX | |
| NVIDIA GeForce RTX 4090, Intel Core i5-14600K | |
| NVIDIA GeForce RTX 4090, AMD Ryzen 7 7800X3D | |
| NVIDIA GeForce RTX 4090, Intel Core i7-13700 | |
| NVIDIA GeForce RTX 4090, Intel Core i7-12700 | |
| NVIDIA GeForce RTX 4090, Intel Core i5-13400 | |
| NVIDIA GeForce RTX 4090, Intel Core i5-12400F | |
| ComputeMark v2.1 | |
| 1024x600 Normal, Score | |
| NVIDIA GeForce RTX 4090, AMD Ryzen 7 7745HX | |
| NVIDIA GeForce RTX 4090, Intel Core i5-14600K | |
| NVIDIA GeForce RTX 4090, AMD Ryzen 9 7950X | |
| NVIDIA GeForce RTX 4090, Intel Core i9-14900K | |
| NVIDIA GeForce RTX 4090, Intel Core i7-12700 | |
| NVIDIA GeForce RTX 4090, AMD Ryzen 7 7800X3D | |
| NVIDIA GeForce RTX 4090, Intel Core i5-13400 | |
| NVIDIA GeForce RTX 4090, Intel Core i7-13700 | |
| 1024x600 Normal, Fluid 3DTex | |
| NVIDIA GeForce RTX 4090, AMD Ryzen 7 7800X3D | |
| NVIDIA GeForce RTX 4090, Intel Core i5-14600K | |
| NVIDIA GeForce RTX 4090, Intel Core i7-13700 | |
| NVIDIA GeForce RTX 4090, Intel Core i5-13400 | |
| NVIDIA GeForce RTX 4090, Intel Core i7-12700 | |
| NVIDIA GeForce RTX 4090, AMD Ryzen 9 7950X | |
| NVIDIA GeForce RTX 4090, AMD Ryzen 7 7745HX | |
| NVIDIA GeForce RTX 4090, Intel Core i9-14900K | |
| 1024x600 Normal, Fluid 2DTexArr | |
| NVIDIA GeForce RTX 4090, AMD Ryzen 7 7745HX | |
| NVIDIA GeForce RTX 4090, Intel Core i5-14600K | |
| NVIDIA GeForce RTX 4090, Intel Core i9-14900K | |
| NVIDIA GeForce RTX 4090, AMD Ryzen 9 7950X | |
| NVIDIA GeForce RTX 4090, Intel Core i7-12700 | |
| NVIDIA GeForce RTX 4090, Intel Core i7-13700 | |
| NVIDIA GeForce RTX 4090, AMD Ryzen 7 7800X3D | |
| NVIDIA GeForce RTX 4090, Intel Core i5-13400 | |
| 1024x600 Normal, Mandel Vector | |
| NVIDIA GeForce RTX 4090, AMD Ryzen 7 7745HX | |
| NVIDIA GeForce RTX 4090, Intel Core i5-14600K | |
| NVIDIA GeForce RTX 4090, AMD Ryzen 9 7950X | |
| NVIDIA GeForce RTX 4090, Intel Core i9-14900K | |
| NVIDIA GeForce RTX 4090, Intel Core i7-13700 | |
| NVIDIA GeForce RTX 4090, Intel Core i7-12700 | |
| NVIDIA GeForce RTX 4090, AMD Ryzen 7 7800X3D | |
| NVIDIA GeForce RTX 4090, Intel Core i5-13400 | |
| 1024x600 Normal, Mandel Scalar | |
| NVIDIA GeForce RTX 4090, AMD Ryzen 7 7745HX | |
| NVIDIA GeForce RTX 4090, Intel Core i5-14600K | |
| NVIDIA GeForce RTX 4090, Intel Core i9-14900K | |
| NVIDIA GeForce RTX 4090, AMD Ryzen 7 7800X3D | |
| NVIDIA GeForce RTX 4090, AMD Ryzen 9 7950X | |
| NVIDIA GeForce RTX 4090, Intel Core i7-12700 | |
| NVIDIA GeForce RTX 4090, Intel Core i7-13700 | |
| NVIDIA GeForce RTX 4090, Intel Core i5-13400 | |
| 1024x600 Normal, QJuliaRayTrace | |
| NVIDIA GeForce RTX 4090, AMD Ryzen 7 7745HX | |
| NVIDIA GeForce RTX 4090, Intel Core i5-14600K | |
| NVIDIA GeForce RTX 4090, AMD Ryzen 9 7950X | |
| NVIDIA GeForce RTX 4090, Intel Core i9-14900K | |
| NVIDIA GeForce RTX 4090, Intel Core i5-13400 | |
| NVIDIA GeForce RTX 4090, Intel Core i7-12700 | |
| NVIDIA GeForce RTX 4090, Intel Core i7-13700 | |
| NVIDIA GeForce RTX 4090, AMD Ryzen 7 7800X3D | |
| Performance rating - Percent | |
| AMD Ryzen 7 7800X3D | |
| AMD Ryzen 9 7950X3D | |
| Intel Core i9-14900K | |
| AMD Ryzen 9 7950X | |
| AMD Ryzen 5 7600X | |
| Intel Core i9-13900K | |
| Intel Core i7-13700K | |
| Intel Core i7-13700 | |
| AMD Ryzen 7 7745HX | |
| Intel Core i7-12700 | |
| Intel Core i5-13400 | |
| F1 22 - 1280x720 Ultra Low Preset AA:T AF:16x | |
| AMD Ryzen 7 7800X3D | |
| Intel Core i9-14900K | |
| AMD Ryzen 9 7950X3D | |
| AMD Ryzen 9 7950X | |
| AMD Ryzen 5 7600X | |
| Intel Core i9-13900K | |
| AMD Ryzen 7 7745HX | |
| Intel Core i7-13700K | |
| Intel Core i7-13700 | |
| Intel Core i7-12700 | |
| Intel Core i5-13400 | |
| Far Cry 5 - 1280x720 Low Preset AA:T | |
| AMD Ryzen 7 7800X3D | |
| AMD Ryzen 9 7950X3D | |
| Intel Core i9-14900K | |
| Intel Core i9-13900K | |
| Intel Core i7-13700K | |
| AMD Ryzen 5 7600X | |
| AMD Ryzen 9 7950X | |
| Intel Core i7-13700 | |
| AMD Ryzen 7 7745HX | |
| Intel Core i7-12700 | |
| Intel Core i5-13400 | |
| X-Plane 11.11 - 1280x720 low (fps_test=1) | |
| Intel Core i9-13900K | |
| Intel Core i9-14900K | |
| AMD Ryzen 9 7950X3D | |
| Intel Core i7-13700K | |
| AMD Ryzen 9 7950X | |
| AMD Ryzen 7 7800X3D | |
| Intel Core i7-13700 | |
| AMD Ryzen 5 7600X | |
| AMD Ryzen 7 7745HX | |
| Intel Core i7-12700 | |
| Intel Core i5-13400 | |
| Final Fantasy XV Benchmark - 1280x720 Lite Quality | |
| AMD Ryzen 7 7745HX | |
| Intel Core i9-13900K | |
| AMD Ryzen 9 7950X | |
| AMD Ryzen 5 7600X | |
| Intel Core i7-13700 | |
| Intel Core i7-13700K | |
| AMD Ryzen 7 7800X3D | |
| Intel Core i9-14900K | |
| AMD Ryzen 9 7950X3D | |
| Intel Core i7-12700 | |
| Intel Core i5-13400 | |
| Dota 2 Reborn - 1280x720 min (0/3) fastest | |
| AMD Ryzen 7 7800X3D | |
| AMD Ryzen 9 7950X3D | |
| AMD Ryzen 9 7950X | |
| Intel Core i9-14900K | |
| Intel Core i9-13900K | |
| AMD Ryzen 5 7600X | |
| AMD Ryzen 7 7745HX | |
| Intel Core i7-13700K | |
| Intel Core i7-13700 | |
| Intel Core i7-12700 | |
| Intel Core i5-13400 | |
| The Witcher 3 - 1024x768 Low Graphics & Postprocessing | |
| AMD Ryzen 9 7950X3D | |
| AMD Ryzen 7 7800X3D | |
| Intel Core i9-14900K | |
| AMD Ryzen 9 7950X | |
| Intel Core i9-13900K | |
| AMD Ryzen 5 7600X | |
| AMD Ryzen 7 7745HX | |
| Intel Core i7-13700K | |
| Intel Core i7-13700 | |
| Intel Core i7-12700 | |
| Intel Core i5-13400 | |
| GTA V - 1024x768 Lowest Settings possible | |
| AMD Ryzen 7 7800X3D | |
| AMD Ryzen 9 7950X | |
| AMD Ryzen 9 7950X3D | |
| AMD Ryzen 5 7600X | |
| Intel Core i9-14900K | |
| Intel Core i9-13900K | |
| Intel Core i7-13700 | |
| Intel Core i7-13700K | |
| AMD Ryzen 7 7745HX | |
| Intel Core i7-12700 | |
| Intel Core i5-13400 | |
| Borderlands 3 - 1280x720 Very Low Overall Quality (DX11) | |
| AMD Ryzen 7 7800X3D | |
| AMD Ryzen 9 7950X3D | |
| Intel Core i9-14900K | |
| Intel Core i9-13900K | |
| AMD Ryzen 9 7950X | |
| AMD Ryzen 5 7600X | |
| Intel Core i7-13700 | |
| Intel Core i7-13700K | |
| AMD Ryzen 7 7745HX | |
| Intel Core i7-12700 | |
| Intel Core i5-13400 | |
| Far Cry New Dawn - 1280x720 Low Preset | |
| AMD Ryzen 7 7800X3D | |
| AMD Ryzen 9 7950X3D | |
| Intel Core i9-14900K | |
| Intel Core i9-13900K | |
| Intel Core i7-13700 | |
| Intel Core i7-13700K | |
| AMD Ryzen 9 7950X | |
| AMD Ryzen 5 7600X | |
| Intel Core i7-12700 | |
| AMD Ryzen 7 7745HX | |
| Intel Core i5-13400 | |
| Shadow of the Tomb Raider - 1280x720 Lowest Preset | |
| AMD Ryzen 7 7800X3D | |
| AMD Ryzen 9 7950X3D | |
| AMD Ryzen 9 7950X | |
| Intel Core i9-14900K | |
| AMD Ryzen 5 7600X | |
| Intel Core i9-13900K | |
| AMD Ryzen 7 7745HX | |
| Intel Core i7-13700 | |
| Intel Core i7-13700K | |
| Intel Core i7-12700 | |
| Intel Core i5-13400 | |
| Tiny Tina's Wonderlands - 1280x720 Lowest Preset (DX12) | |
| AMD Ryzen 7 7800X3D | |
| Intel Core i9-14900K | |
| AMD Ryzen 9 7950X3D | |
| AMD Ryzen 9 7950X | |
| AMD Ryzen 5 7600X | |
| Intel Core i9-13900K | |
| AMD Ryzen 7 7745HX | |
| Intel Core i7-13700 | |
| Intel Core i7-13700K | |
| Intel Core i7-12700 | |
| Intel Core i5-13400 | |
| Strange Brigade - 1280x720 lowest AF:1 | |
| AMD Ryzen 5 7600X | |
| Intel Core i9-14900K | |
| AMD Ryzen 7 7800X3D | |
| AMD Ryzen 9 7950X | |
| Intel Core i9-13900K | |
| AMD Ryzen 7 7745HX | |
| AMD Ryzen 9 7950X3D | |
| Intel Core i7-13700K | |
| Intel Core i7-13700 | |
| Intel Core i7-12700 | |
| Intel Core i5-13400 | |
| Metro Exodus - 1280x720 Low Quality AF:4x | |
| AMD Ryzen 7 7800X3D | |
| Intel Core i9-14900K | |
| AMD Ryzen 5 7600X | |
| AMD Ryzen 9 7950X | |
| AMD Ryzen 9 7950X3D | |
| AMD Ryzen 7 7745HX | |
| Intel Core i7-13700 | |
| Intel Core i9-13900K | |
| Intel Core i7-13700K | |
| Intel Core i7-12700 | |
| Intel Core i5-13400 | |
| F1 2020 - 1280x720 Ultra Low Preset | |
| AMD Ryzen 7 7800X3D | |
| Intel Core i9-14900K | |
| AMD Ryzen 9 7950X3D | |
| AMD Ryzen 9 7950X | |
| AMD Ryzen 5 7600X | |
| AMD Ryzen 7 7745HX | |
| Intel Core i9-13900K | |
| Intel Core i7-13700K | |
| Intel Core i7-13700 | |
| Intel Core i7-12700 | |
| Intel Core i5-13400 | |
| F1 2021 - 1280x720 Ultra Low Preset | |
| AMD Ryzen 7 7800X3D | |
| Intel Core i9-14900K | |
| AMD Ryzen 5 7600X | |
| AMD Ryzen 9 7950X3D | |
| AMD Ryzen 9 7950X | |
| Intel Core i9-13900K | |
| AMD Ryzen 7 7745HX | |
| Intel Core i7-13700K | |
| Intel Core i7-13700 | |
| Intel Core i7-12700 | |
| Intel Core i5-13400 | |
| Performance rating - Percent | |
| AMD Ryzen 7 7800X3D | |
| AMD Ryzen 9 7950X3D | |
| Intel Core i9-14900K | |
| AMD Ryzen 9 7950X | |
| AMD Ryzen 5 7600X | |
| Intel Core i9-13900K | |
| Intel Core i7-13700K | |
| Intel Core i7-13700 | |
| AMD Ryzen 7 7745HX | |
| Intel Core i7-12700 | |
| Intel Core i5-13400 | |
| F1 22 | |
| 3840x2160 Ultra High Preset AA:T AF:16x | |
| AMD Ryzen 7 7745HX | |
| AMD Ryzen 7 7800X3D | |
| Intel Core i9-14900K | |
| AMD Ryzen 5 7600X | |
| AMD Ryzen 9 7950X | |
| Intel Core i7-13700K | |
| AMD Ryzen 9 7950X3D | |
| Intel Core i7-13700 | |
| Intel Core i7-12700 | |
| Intel Core i5-13400 | |
| Intel Core i9-13900K | |
| 2560x1440 Ultra High Preset AA:T AF:16x | |
| AMD Ryzen 7 7800X3D | |
| Intel Core i9-14900K | |
| AMD Ryzen 7 7745HX | |
| AMD Ryzen 9 7950X3D | |
| AMD Ryzen 5 7600X | |
| AMD Ryzen 9 7950X | |
| Intel Core i9-13900K | |
| Intel Core i7-13700K | |
| Intel Core i7-13700 | |
| Intel Core i7-12700 | |
| Intel Core i5-13400 | |
| 1920x1080 Ultra High Preset AA:T AF:16x | |
| AMD Ryzen 7 7800X3D | |
| Intel Core i9-14900K | |
| AMD Ryzen 5 7600X | |
| AMD Ryzen 9 7950X3D | |
| AMD Ryzen 9 7950X | |
| Intel Core i9-13900K | |
| AMD Ryzen 7 7745HX | |
| Intel Core i7-13700K | |
| Intel Core i7-13700 | |
| Intel Core i7-12700 | |
| Intel Core i5-13400 | |
| Far Cry 5 | |
| 3840x2160 Ultra Preset AA:T | |
| AMD Ryzen 7 7800X3D | |
| Intel Core i9-14900K | |
| Intel Core i9-13900K | |
| AMD Ryzen 9 7950X3D | |
| AMD Ryzen 9 7950X | |
| AMD Ryzen 5 7600X | |
| Intel Core i7-13700K | |
| Intel Core i7-13700 | |
| Intel Core i7-12700 | |
| AMD Ryzen 7 7745HX | |
| Intel Core i5-13400 | |
| 2560x1440 Ultra Preset AA:T | |
| AMD Ryzen 7 7800X3D | |
| AMD Ryzen 9 7950X3D | |
| Intel Core i9-14900K | |
| Intel Core i9-13900K | |
| AMD Ryzen 5 7600X | |
| AMD Ryzen 9 7950X | |
| Intel Core i7-13700K | |
| Intel Core i7-13700 | |
| AMD Ryzen 7 7745HX | |
| Intel Core i7-12700 | |
| Intel Core i5-13400 | |
| 1920x1080 Ultra Preset AA:T | |
| AMD Ryzen 7 7800X3D | |
| AMD Ryzen 9 7950X3D | |
| Intel Core i9-14900K | |
| Intel Core i9-13900K | |
| AMD Ryzen 9 7950X | |
| AMD Ryzen 5 7600X | |
| Intel Core i7-13700 | |
| Intel Core i7-13700K | |
| Intel Core i7-12700 | |
| AMD Ryzen 7 7745HX | |
| Intel Core i5-13400 | |
| Final Fantasy XV Benchmark | |
| 3840x2160 High Quality | |
| Intel Core i9-14900K | |
| Intel Core i9-13900K | |
| AMD Ryzen 9 7950X | |
| AMD Ryzen 7 7745HX | |
| AMD Ryzen 5 7600X | |
| AMD Ryzen 7 7800X3D | |
| Intel Core i7-13700 | |
| AMD Ryzen 9 7950X3D | |
| Intel Core i7-13700K | |
| Intel Core i7-12700 | |
| Intel Core i5-13400 | |
| 2560x1440 High Quality | |
| AMD Ryzen 7 7800X3D | |
| Intel Core i9-14900K | |
| Intel Core i9-13900K | |
| AMD Ryzen 9 7950X | |
| AMD Ryzen 9 7950X3D | |
| AMD Ryzen 5 7600X | |
| Intel Core i7-13700K | |
| Intel Core i7-13700 | |
| AMD Ryzen 7 7745HX | |
| Intel Core i7-12700 | |
| Intel Core i5-13400 | |
| 1920x1080 High Quality | |
| Intel Core i9-14900K | |
| AMD Ryzen 9 7950X | |
| AMD Ryzen 7 7800X3D | |
| Intel Core i9-13900K | |
| AMD Ryzen 9 7950X3D | |
| Intel Core i7-13700K | |
| AMD Ryzen 5 7600X | |
| Intel Core i7-13700 | |
| AMD Ryzen 7 7745HX | |
| Intel Core i7-12700 | |
| Intel Core i5-13400 | |
| Dota 2 Reborn | |
| 3840x2160 ultra (3/3) best looking | |
| AMD Ryzen 7 7800X3D | |
| AMD Ryzen 9 7950X3D | |
| AMD Ryzen 9 7950X | |
| Intel Core i9-13900K | |
| Intel Core i9-14900K | |
| AMD Ryzen 5 7600X | |
| Intel Core i7-13700K | |
| Intel Core i7-13700 | |
| AMD Ryzen 7 7745HX | |
| Intel Core i7-12700 | |
| Intel Core i5-13400 | |
| 1920x1080 ultra (3/3) best looking | |
| AMD Ryzen 7 7800X3D | |
| AMD Ryzen 9 7950X3D | |
| AMD Ryzen 9 7950X | |
| Intel Core i9-13900K | |
| Intel Core i9-14900K | |
| AMD Ryzen 5 7600X | |
| Intel Core i7-13700K | |
| Intel Core i7-13700 | |
| AMD Ryzen 7 7745HX | |
| Intel Core i7-12700 | |
| Intel Core i5-13400 | |
| The Witcher 3 | |
| 3840x2160 High Graphics & Postprocessing (Nvidia HairWorks Off) | |
| AMD Ryzen 5 7600X | |
| Intel Core i9-14900K | |
| AMD Ryzen 9 7950X | |
| Intel Core i5-13400 | |
| Intel Core i7-13700 | |
| Intel Core i7-12700 | |
| AMD Ryzen 7 7800X3D | |
| Intel Core i7-13700K | |
| AMD Ryzen 7 7745HX | |
| AMD Ryzen 9 7950X3D | |
| Intel Core i9-13900K | |
| 1920x1080 Ultra Graphics & Postprocessing (HBAO+) | |
| Intel Core i9-13900K | |
| AMD Ryzen 9 7950X | |
| AMD Ryzen 7 7800X3D | |
| Intel Core i9-14900K | |
| AMD Ryzen 5 7600X | |
| Intel Core i7-13700K | |
| Intel Core i7-13700 | |
| AMD Ryzen 9 7950X3D | |
| Intel Core i7-12700 | |
| AMD Ryzen 7 7745HX | |
| Intel Core i5-13400 | |
| GTA V | |
| 3840x2160 Highest AA:4xMSAA + FX AF:16x | |
| AMD Ryzen 7 7800X3D | |
| Intel Core i9-14900K | |
| Intel Core i9-13900K | |
| AMD Ryzen 9 7950X | |
| AMD Ryzen 9 7950X3D | |
| Intel Core i7-13700K | |
| AMD Ryzen 5 7600X | |
| Intel Core i7-13700 | |
| AMD Ryzen 7 7745HX | |
| Intel Core i7-12700 | |
| Intel Core i5-13400 | |
| 2560x1440 Highest AA:4xMSAA + FX AF:16x | |
| AMD Ryzen 7 7800X3D | |
| Intel Core i9-14900K | |
| Intel Core i9-13900K | |
| AMD Ryzen 9 7950X | |
| AMD Ryzen 9 7950X3D | |
| Intel Core i7-13700K | |
| Intel Core i7-13700 | |
| AMD Ryzen 5 7600X | |
| AMD Ryzen 7 7745HX | |
| Intel Core i7-12700 | |
| Intel Core i5-13400 | |
| 1920x1080 Highest AA:4xMSAA + FX AF:16x | |
| AMD Ryzen 7 7800X3D | |
| Intel Core i9-14900K | |
| Intel Core i9-13900K | |
| AMD Ryzen 9 7950X | |
| AMD Ryzen 9 7950X3D | |
| Intel Core i7-13700K | |
| AMD Ryzen 5 7600X | |
| Intel Core i7-13700 | |
| AMD Ryzen 7 7745HX | |
| Intel Core i7-12700 | |
| Intel Core i5-13400 | |
| Borderlands 3 | |
| 3840x2160 Badass Overall Quality (DX11) | |
| Intel Core i7-13700K | |
| Intel Core i9-14900K | |
| AMD Ryzen 7 7800X3D | |
| AMD Ryzen 9 7950X3D | |
| Intel Core i9-13900K | |
| AMD Ryzen 9 7950X | |
| AMD Ryzen 5 7600X | |
| Intel Core i7-13700 | |
| AMD Ryzen 7 7745HX | |
| Intel Core i7-12700 | |
| Intel Core i5-13400 | |
| 2560x1440 Badass Overall Quality (DX11) | |
| AMD Ryzen 7 7800X3D | |
| AMD Ryzen 9 7950X3D | |
| Intel Core i9-14900K | |
| AMD Ryzen 9 7950X | |
| Intel Core i9-13900K | |
| AMD Ryzen 5 7600X | |
| Intel Core i7-13700K | |
| Intel Core i7-13700 | |
| AMD Ryzen 7 7745HX | |
| Intel Core i7-12700 | |
| Intel Core i5-13400 | |
| 1920x1080 Badass Overall Quality (DX11) | |
| AMD Ryzen 9 7950X3D | |
| AMD Ryzen 7 7800X3D | |
| Intel Core i9-14900K | |
| AMD Ryzen 9 7950X | |
| Intel Core i9-13900K | |
| AMD Ryzen 5 7600X | |
| Intel Core i7-13700K | |
| Intel Core i7-13700 | |
| AMD Ryzen 7 7745HX | |
| Intel Core i7-12700 | |
| Intel Core i5-13400 | |
| Far Cry New Dawn | |
| 3840x2160 Ultra Preset | |
| AMD Ryzen 7 7800X3D | |
| AMD Ryzen 9 7950X3D | |
| Intel Core i9-14900K | |
| Intel Core i9-13900K | |
| AMD Ryzen 9 7950X | |
| Intel Core i7-13700 | |
| Intel Core i7-13700K | |
| AMD Ryzen 5 7600X | |
| Intel Core i7-12700 | |
| AMD Ryzen 7 7745HX | |
| Intel Core i5-13400 | |
| 2560x1440 Ultra Preset | |
| AMD Ryzen 7 7800X3D | |
| AMD Ryzen 9 7950X3D | |
| Intel Core i9-14900K | |
| Intel Core i9-13900K | |
| AMD Ryzen 9 7950X | |
| Intel Core i7-13700K | |
| AMD Ryzen 5 7600X | |
| Intel Core i7-13700 | |
| Intel Core i7-12700 | |
| AMD Ryzen 7 7745HX | |
| Intel Core i5-13400 | |
| 1920x1080 Ultra Preset | |
| AMD Ryzen 7 7800X3D | |
| AMD Ryzen 9 7950X3D | |
| Intel Core i9-14900K | |
| Intel Core i9-13900K | |
| AMD Ryzen 9 7950X | |
| Intel Core i7-13700K | |
| AMD Ryzen 5 7600X | |
| Intel Core i7-13700 | |
| Intel Core i7-12700 | |
| AMD Ryzen 7 7745HX | |
| Intel Core i5-13400 | |
| Shadow of the Tomb Raider | |
| 3840x2160 Highest Preset AA:T | |
| Intel Core i9-14900K | |
| Intel Core i7-13700K | |
| AMD Ryzen 7 7800X3D | |
| Intel Core i7-13700 | |
| AMD Ryzen 9 7950X3D | |
| AMD Ryzen 5 7600X | |
| AMD Ryzen 7 7745HX | |
| AMD Ryzen 9 7950X | |
| Intel Core i9-13900K | |
| Intel Core i7-12700 | |
| Intel Core i5-13400 | |
| 2560x1440 Highest Preset AA:T | |
| AMD Ryzen 7 7800X3D | |
| AMD Ryzen 9 7950X3D | |
| Intel Core i9-14900K | |
| Intel Core i9-13900K | |
| AMD Ryzen 9 7950X | |
| AMD Ryzen 5 7600X | |
| Intel Core i7-13700K | |
| Intel Core i7-13700 | |
| AMD Ryzen 7 7745HX | |
| Intel Core i7-12700 | |
| Intel Core i5-13400 | |
| 1920x1080 Highest Preset AA:T | |
| AMD Ryzen 7 7800X3D | |
| AMD Ryzen 9 7950X3D | |
| Intel Core i9-14900K | |
| AMD Ryzen 9 7950X | |
| Intel Core i9-13900K | |
| AMD Ryzen 5 7600X | |
| Intel Core i7-13700K | |
| Intel Core i7-13700 | |
| AMD Ryzen 7 7745HX | |
| Intel Core i7-12700 | |
| Intel Core i5-13400 | |
| Tiny Tina's Wonderlands | |
| 3840x2160 Badass Preset (DX12) | |
| Intel Core i9-14900K | |
| AMD Ryzen 9 7950X3D | |
| AMD Ryzen 7 7745HX | |
| AMD Ryzen 5 7600X | |
| AMD Ryzen 9 7950X | |
| Intel Core i7-13700 | |
| Intel Core i9-13900K | |
| AMD Ryzen 7 7800X3D | |
| Intel Core i7-12700 | |
| Intel Core i5-13400 | |
| Intel Core i7-13700K | |
| 2560x1440 Badass Preset (DX12) | |
| AMD Ryzen 9 7950X3D | |
| Intel Core i9-14900K | |
| AMD Ryzen 7 7800X3D | |
| AMD Ryzen 9 7950X | |
| AMD Ryzen 7 7745HX | |
| AMD Ryzen 5 7600X | |
| Intel Core i7-13700K | |
| Intel Core i9-13900K | |
| Intel Core i7-13700 | |
| Intel Core i7-12700 | |
| Intel Core i5-13400 | |
| 1920x1080 Badass Preset (DX12) | |
| AMD Ryzen 7 7800X3D | |
| Intel Core i9-14900K | |
| AMD Ryzen 9 7950X3D | |
| AMD Ryzen 9 7950X | |
| AMD Ryzen 5 7600X | |
| AMD Ryzen 7 7745HX | |
| Intel Core i9-13900K | |
| Intel Core i7-13700 | |
| Intel Core i7-13700K | |
| Intel Core i7-12700 | |
| Intel Core i5-13400 | |
| Strange Brigade | |
| 3840x2160 ultra AA:ultra AF:16 | |
| Intel Core i9-14900K | |
| AMD Ryzen 7 7800X3D | |
| AMD Ryzen 7 7745HX | |
| Intel Core i7-13700K | |
| AMD Ryzen 9 7950X3D | |
| Intel Core i7-12700 | |
| AMD Ryzen 5 7600X | |
| Intel Core i7-13700 | |
| AMD Ryzen 9 7950X | |
| Intel Core i9-13900K | |
| Intel Core i5-13400 | |
| 2560x1440 ultra AA:ultra AF:16 | |
| Intel Core i9-14900K | |
| AMD Ryzen 7 7800X3D | |
| AMD Ryzen 5 7600X | |
| AMD Ryzen 7 7745HX | |
| AMD Ryzen 9 7950X | |
| Intel Core i9-13900K | |
| AMD Ryzen 9 7950X3D | |
| Intel Core i7-13700K | |
| Intel Core i7-13700 | |
| Intel Core i7-12700 | |
| Intel Core i5-13400 | |
| 1920x1080 ultra AA:ultra AF:16 | |
| Intel Core i9-14900K | |
| AMD Ryzen 5 7600X | |
| AMD Ryzen 7 7800X3D | |
| AMD Ryzen 9 7950X | |
| Intel Core i9-13900K | |
| AMD Ryzen 7 7745HX | |
| AMD Ryzen 9 7950X3D | |
| Intel Core i7-13700K | |
| Intel Core i7-13700 | |
| Intel Core i7-12700 | |
| Intel Core i5-13400 | |
| Metro Exodus | |
| 3840x2160 Ultra Quality AF:16x | |
| Intel Core i9-14900K | |
| AMD Ryzen 7 7800X3D | |
| AMD Ryzen 9 7950X | |
| AMD Ryzen 9 7950X3D | |
| Intel Core i9-13900K | |
| AMD Ryzen 5 7600X | |
| Intel Core i7-13700 | |
| Intel Core i7-13700K | |
| AMD Ryzen 7 7745HX | |
| Intel Core i7-12700 | |
| Intel Core i5-13400 | |
| 2560x1440 Ultra Quality AF:16x | |
| AMD Ryzen 7 7800X3D | |
| Intel Core i9-14900K | |
| AMD Ryzen 9 7950X | |
| AMD Ryzen 5 7600X | |
| AMD Ryzen 7 7745HX | |
| AMD Ryzen 9 7950X3D | |
| Intel Core i9-13900K | |
| Intel Core i7-13700 | |
| Intel Core i7-13700K | |
| Intel Core i7-12700 | |
| Intel Core i5-13400 | |
| 1920x1080 Ultra Quality AF:16x | |
| AMD Ryzen 7 7800X3D | |
| Intel Core i9-14900K | |
| AMD Ryzen 9 7950X | |
| AMD Ryzen 7 7745HX | |
| AMD Ryzen 5 7600X | |
| AMD Ryzen 9 7950X3D | |
| Intel Core i9-13900K | |
| Intel Core i7-13700 | |
| Intel Core i7-13700K | |
| Intel Core i7-12700 | |
| Intel Core i5-13400 | |
| F1 2020 | |
| 3840x2160 Ultra High Preset AA:T AF:16x | |
| Intel Core i9-14900K | |
| AMD Ryzen 9 7950X3D | |
| AMD Ryzen 7 7800X3D | |
| AMD Ryzen 7 7745HX | |
| AMD Ryzen 9 7950X | |
| Intel Core i9-13900K | |
| AMD Ryzen 5 7600X | |
| Intel Core i7-13700K | |
| Intel Core i7-13700 | |
| Intel Core i7-12700 | |
| Intel Core i5-13400 | |
| 2560x1440 Ultra High Preset AA:T AF:16x | |
| AMD Ryzen 7 7800X3D | |
| Intel Core i9-14900K | |
| AMD Ryzen 9 7950X3D | |
| AMD Ryzen 9 7950X | |
| Intel Core i9-13900K | |
| AMD Ryzen 5 7600X | |
| AMD Ryzen 7 7745HX | |
| Intel Core i7-13700K | |
| Intel Core i7-13700 | |
| Intel Core i7-12700 | |
| Intel Core i5-13400 | |
| 1920x1080 Ultra High Preset AA:T AF:16x | |
| AMD Ryzen 7 7800X3D | |
| AMD Ryzen 9 7950X3D | |
| Intel Core i9-14900K | |
| AMD Ryzen 5 7600X | |
| AMD Ryzen 9 7950X | |
| AMD Ryzen 7 7745HX | |
| Intel Core i9-13900K | |
| Intel Core i7-13700K | |
| Intel Core i7-13700 | |
| Intel Core i7-12700 | |
| Intel Core i5-13400 | |
| F1 2021 | |
| 3840x2160 Ultra High Preset + Raytracing AA:T AF:16x | |
| AMD Ryzen 7 7800X3D | |
| AMD Ryzen 7 7745HX | |
| AMD Ryzen 5 7600X | |
| AMD Ryzen 9 7950X3D | |
| Intel Core i9-14900K | |
| AMD Ryzen 9 7950X | |
| Intel Core i7-13700K | |
| Intel Core i7-13700 | |
| Intel Core i9-13900K | |
| Intel Core i7-12700 | |
| Intel Core i5-13400 | |
| 2560x1440 Ultra High Preset + Raytracing AA:T AF:16x | |
| AMD Ryzen 7 7800X3D | |
| Intel Core i9-14900K | |
| AMD Ryzen 5 7600X | |
| AMD Ryzen 9 7950X3D | |
| AMD Ryzen 9 7950X | |
| Intel Core i7-13700K | |
| Intel Core i7-13700 | |
| AMD Ryzen 7 7745HX | |
| Intel Core i7-12700 | |
| Intel Core i5-13400 | |
| Intel Core i9-13900K | |
| 1920x1080 Ultra High Preset + Raytracing AA:T AF:16x | |
| AMD Ryzen 7 7800X3D | |
| Intel Core i9-14900K | |
| AMD Ryzen 5 7600X | |
| Intel Core i9-13900K | |
| AMD Ryzen 9 7950X | |
| AMD Ryzen 9 7950X3D | |
| Intel Core i7-13700K | |
| Intel Core i7-13700 | |
| AMD Ryzen 7 7745HX | |
| Intel Core i7-12700 | |
| Intel Core i5-13400 | |
Power consumption with external monitor
| låg | med. | hög | ultra | QHD | 4K DLSS | 4K | |
|---|---|---|---|---|---|---|---|
| GTA V (2015) | 187.6 | 186.9 | 183.7 | 142.9 | 142.6 | 183.6 | |
| The Witcher 3 (2015) | 692 | 608 | 566 | 291 | 255 | 277 | |
| Dota 2 Reborn (2015) | 252 | 222 | 218 | 195.2 | 192.8 | ||
| Final Fantasy XV Benchmark (2018) | 237 | 236 | 217 | 212 | 160.2 | ||
| X-Plane 11.11 (2018) | 195.9 | 164.5 | 127.3 | 106.7 | |||
| Far Cry 5 (2018) | 205 | 176 | 168 | 155 | 157 | 152 | |
| Strange Brigade (2018) | 676 | 553 | 548 | 541 | 517 | 287 | |
| Shadow of the Tomb Raider (2018) | 275 | 253 | 246 | 254 | 242 | 186.4 | |
| Far Cry New Dawn (2019) | 170 | 148 | 143 | 128 | 128 | 124 | |
| Metro Exodus (2019) | 287 | 271 | 239 | 199.4 | 182.8 | 135.8 | |
| Borderlands 3 (2019) | 203 | 179.9 | 162.4 | 154.7 | 153.2 | 127.9 | |
| F1 2020 (2020) | 529 | 408 | 431 | 392 | 383 | 287 | |
| Death Stranding (2020) | 238 | 237 | 234 | 230 | 227 | 197.7 | |
| Horizon Zero Dawn (2020) | 290 | 268 | 250 | 237 | 230 | 208 | 165 |
| F1 2021 (2021) | 589 | 567 | 483 | 253 | 252 | 207 | |
| Forza Horizon 5 (2021) | 359 | 281 | 278 | 201 | 187 | 161 | |
| God of War (2022) | 230 | 233 | 229 | 205 | 179.7 | 127.1 | |
| GRID Legends (2022) | 229 | 205 | 190.1 | 184.2 | 181.8 | 173.9 | |
| Tiny Tina's Wonderlands (2022) | 393 | 333 | 295 | 279 | 229 | 130.8 | |
| F1 22 (2022) | 375 | 391 | 363 | 191.4 | 159.5 | 84.9 | |
| The Callisto Protocol (2022) | 211.1 | 199.9 | 196.8 | 185.5 | 179.2 | 149.6 | |
| High On Life (2023) | 343 | 325 | 292 | 278 | 224 | 109.9 | |
| The Witcher 3 v4 (2023) | 259 | 219 | 191.6 | 180.1 | 176.9 | 160.4 | |
| Dead Space Remake (2023) | 194.3 | 194.1 | 186.1 | 184.9 | 170.6 | 97.9 | |
| Returnal (2023) | 199 | 199 | 196 | 193 | 170 | 113 | |
| Atomic Heart (2023) | 258 | 214 | 190 | 177.9 | 164.6 | 105.6 | |
| Company of Heroes 3 (2023) | 312.3 | 284.6 | 268.8 | 267.4 | 236.3 | 195.4 | |
| The Last of Us (2023) | 182.3 | 171.4 | 170.3 | 166.5 | 142.5 | 123.9 | 82.2 |
| F1 23 (2023) | 384 | 401 | 379 | 174.6 | 153.2 | 133.2 | 80.7 |
| Starfield (2023) | 164 | 162.7 | 152.6 | 144.5 | 122.7 | 82.1 | |
| Lies of P (2023) | 315 | 296 | 276 | 257 | 245 | 224 | 165.8 |
| Cyberpunk 2077 (2023) | 203 | 201 | 185.5 | 170.7 | 152 | 75.9 | |
| Assassin's Creed Mirage (2023) | 253 | 244 | 232 | 166 | 160 | 144 | 130 |
| Total War Pharaoh (2023) | 544.4 | 319.5 | 211.7 | 163.1 | 162.8 | 150 | |
| Lords of the Fallen (2023) | 160.8 | 154.8 | 147.8 | 122.1 | 93.9 | 93.2 | 55.4 |
| EA Sports WRC (2023) | 224 | 147.3 | 138.3 | 134.7 | 131.7 | 123.2 | 120.7 |
| Call of Duty Modern Warfare 3 2023 (2023) | 246 | 245 | 244 | 243 | 230 | 164 | |
| Avatar Frontiers of Pandora (2023) | 236 | 224 | 201 | 169 | 126 | 113 | 68 |
| The Finals (2023) | 302 | 268 | 261 | 270 | 257 | 223 | 140.4 |
Strömförbrukning och temperaturer
Minisforum förser BD770i moderkortet med ett förinstallerat heatpipe-kylsystem. Användarna ges dock flexibiliteten att välja en 120-millimetersfläkt för installation. Det är värt att notera att temperaturvariationer kan uppstå med olika fläktar jämfört med vår Noctua NF-A12x25-fläkt. Överlag har vi inte mycket att anmärka på när det gäller kylaggregatet. SoC och spänningsomvandlarna på moderkortet får direkt kylning, vilket betonar att alternativa kylare inte kan installeras. Temperaturerna på AMD Ryzen 7 7745HX svävar strax över 90 ° C i både stängda och öppna system. Detta är inom det acceptabla intervallet för en CPU från den mobila sektorn, eftersom AMD: s specifikationer tillåter processorn att nå temperaturer upp till 100 ° C innan den upplever prestandaförlust. Inte ens under långvariga stresstester nådde vi 100 °C.
En av de utmärkande egenskaperna hos Minisforum BD770i är dess strömförbrukning. Vi registrerade endast 127,5 watt i Cinebench R15 Multi-testet, vilket resulterar i en exceptionell effektivitet som överträffar andra stationära system i jämförelse. I spelscenarier, där en betydande del av energin används för grafikkortets prestanda, dokumenterade vi ett jämförelsevis bra resultat med ett genomsnitt på 495 watt. Effektiviteten hos AMD Ryzen 7 7745HX är i nivå med AMD Ryzen 7 7800X3D. Men när det gäller effektivitet i spelläge överträffade AMD Ryzen 7 7745HX AMD Ryzen 7 7800X3D. Utan användning av ett dedikerat grafikkort fungerade testsystemet betydligt mer ekonomiskt och krävde i genomsnitt endast 60 watt i spelläge.
När det gäller den övergripande driften och ljudnivån kan vi konstatera att vårt installerade nätaggregat är hörbart i vår testuppställning. Under både tomgångs- och belastningsförhållanden upptäckte vi inga mätningar som påverkades av den installerade adaptern. Den lilla förinstallerade fläkten för aktiv kylning av SSD-enheten arbetar mycket tyst och förblir ohörbar från ett stängt hölje. BIOS-inställningarna på Minisforum BD770i moderkort erbjuder begränsade justeringsalternativ. Användare kan ställa in CPU-effekten i fördefinierade steg (45, 55 och 75 watt) och justera den maximala CPU-temperaturen till valfritt värde. Jämfört med välkända moderkortstillverkare har Minisforum BD770i moderkort mer begränsade inställningsmöjligheter. Möjligheten att justera fläktkurvan kan vara ett värdefullt tillskott för användare som föredrar flexibilitet framför att experimentera med SoC:ns effekt- och temperaturgränser.
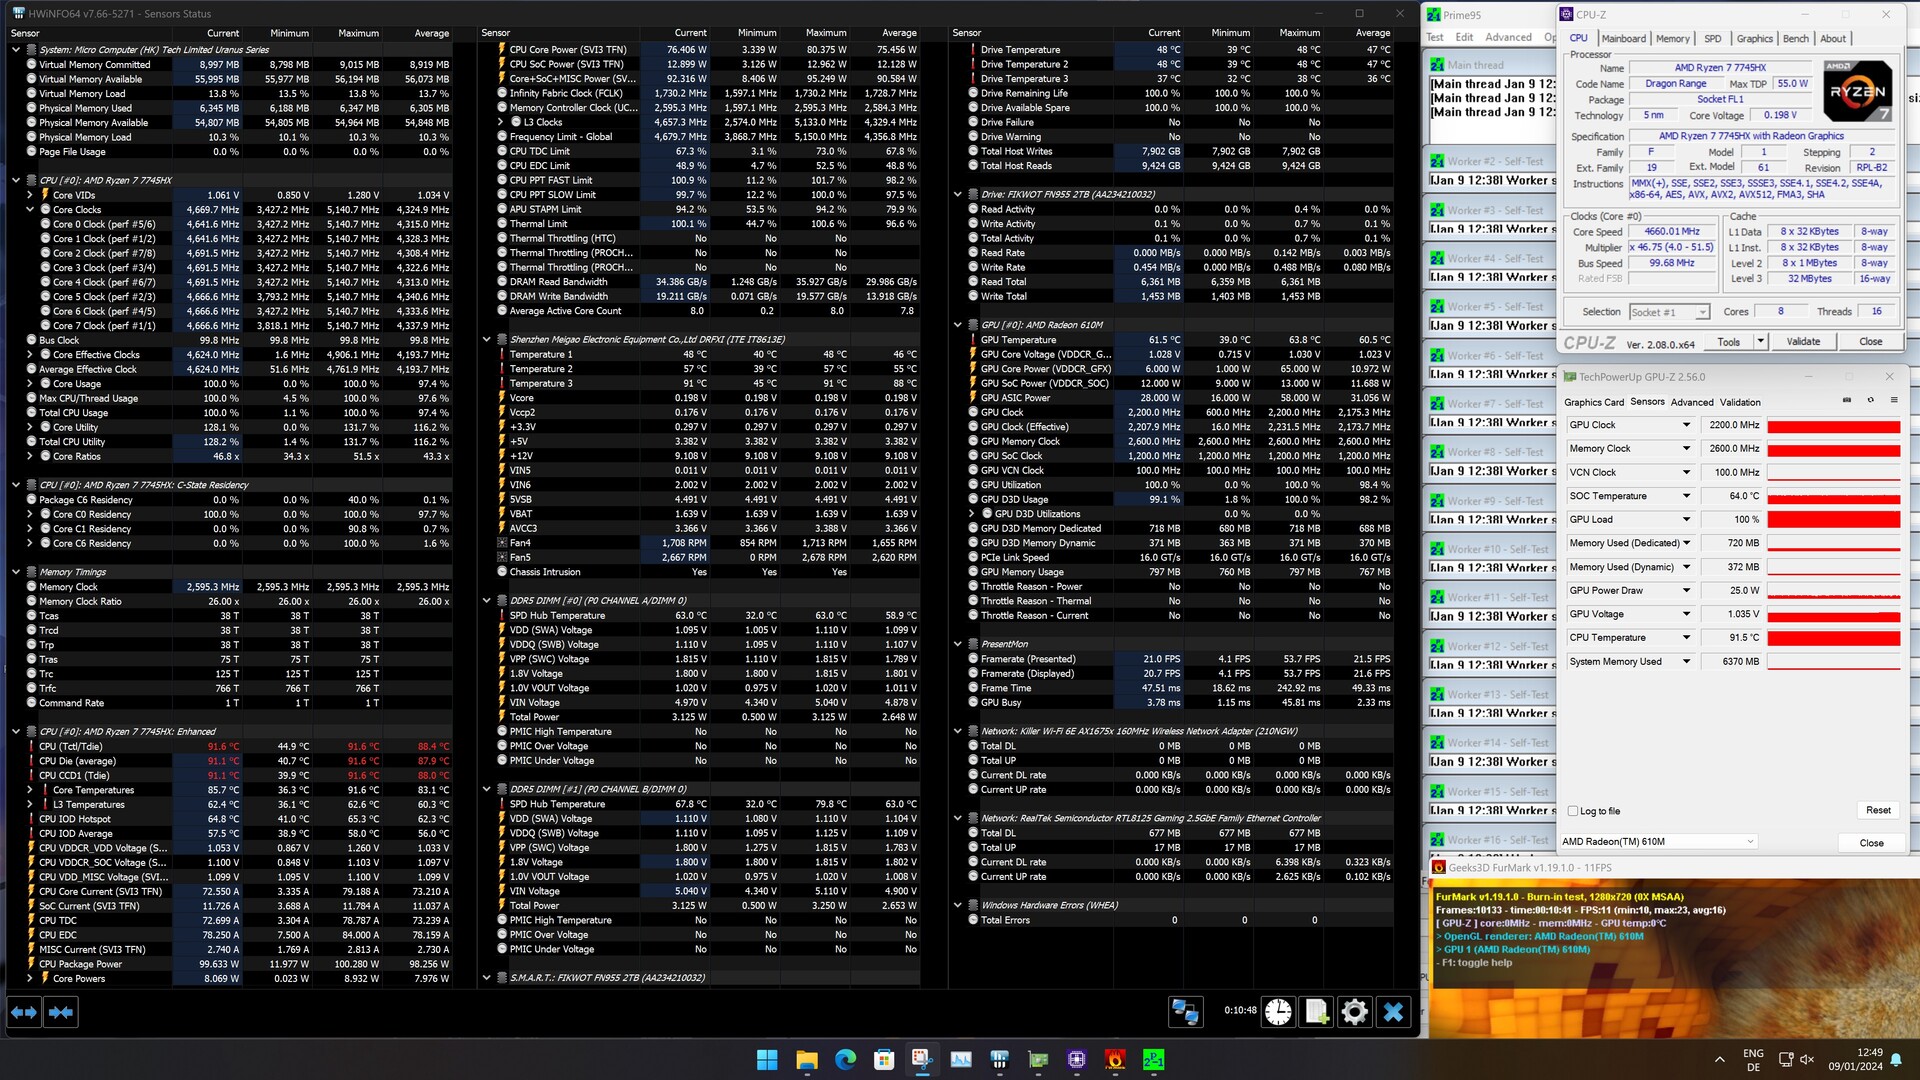
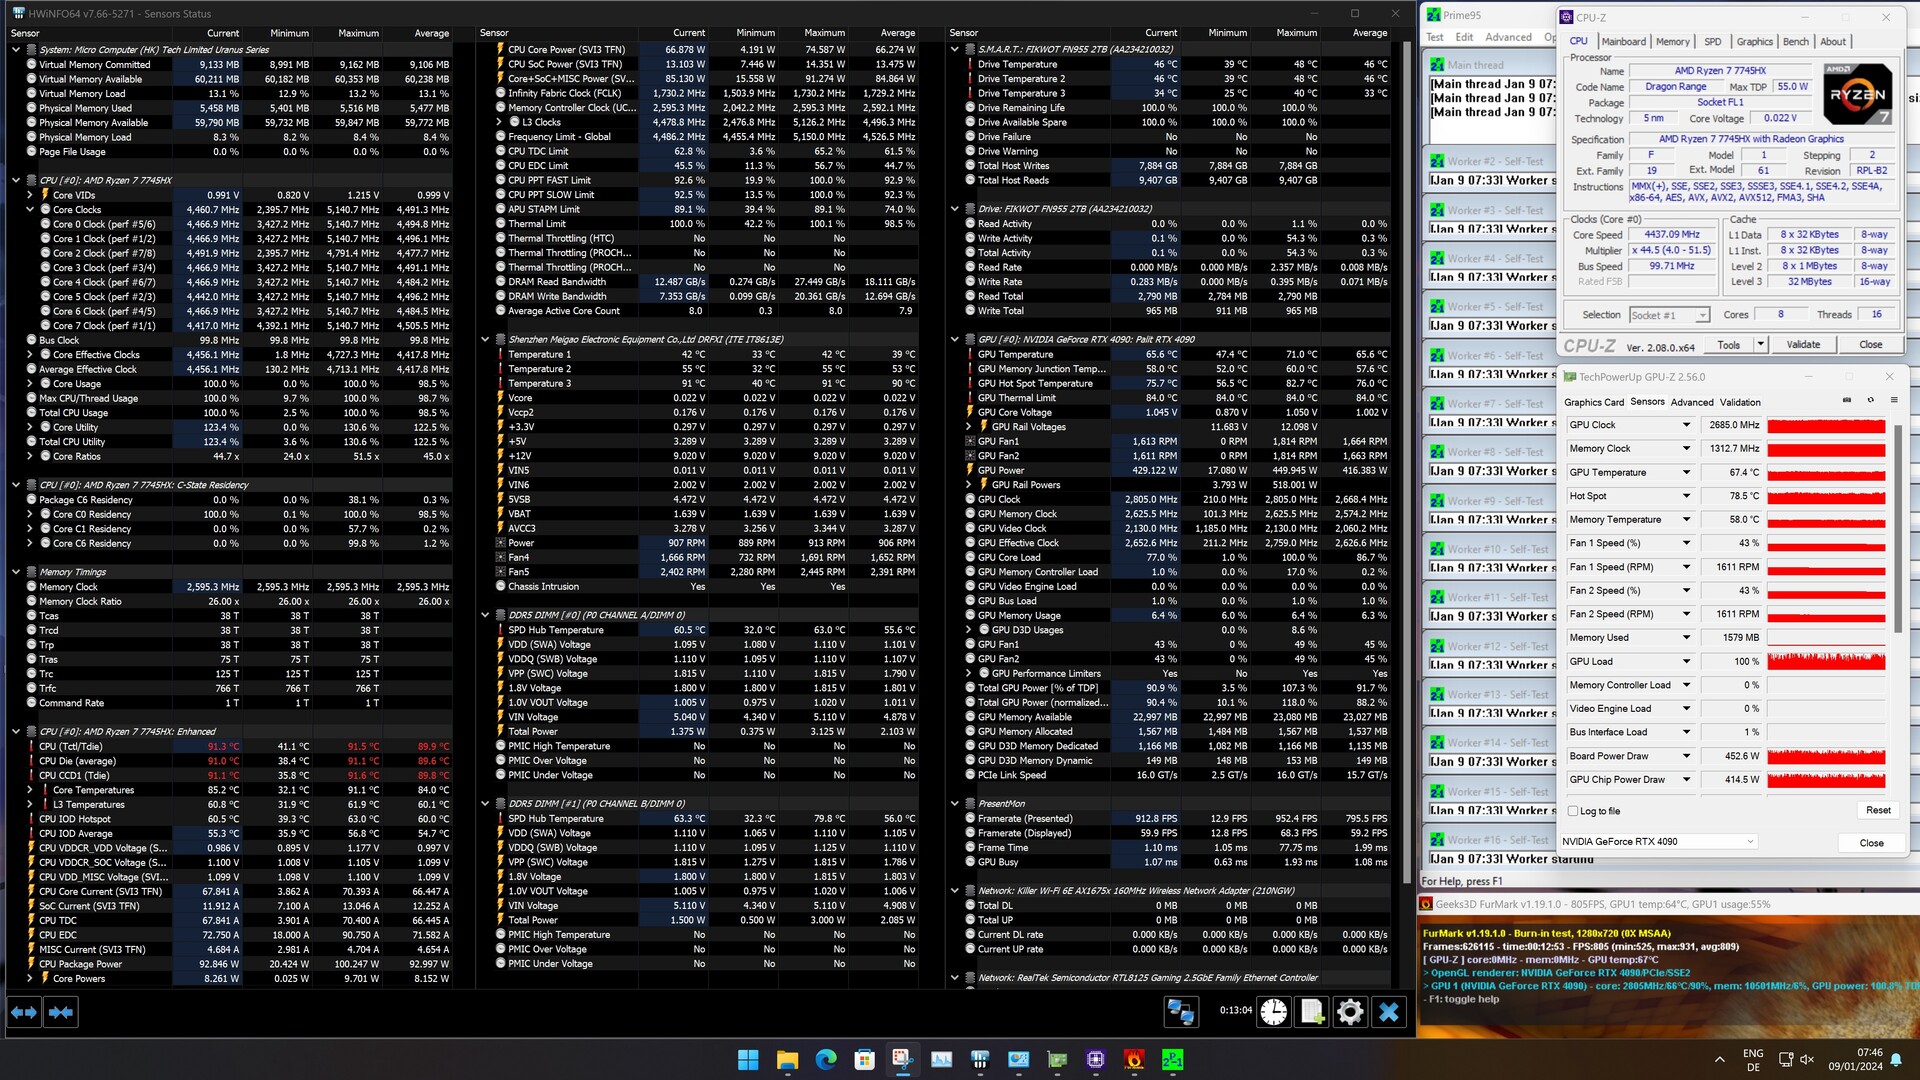
| Power Consumption / Cinebench R15 Multi (external Monitor) | |
| Intel Core i9-14900K | |
| Intel Core i9-13900K | |
| AMD Ryzen 9 7950X (Idle: 95.2 W) | |
| Intel Core i7-13700K | |
| Intel Core i5-14600K | |
| Intel Core i5-13600K | |
| Intel Core i7-12700 | |
| AMD Ryzen 9 7950X3D | |
| AMD Ryzen 7 7800X3D | |
| Intel Core i5-13400 | |
| Intel Core i5-12400F | |
| AMD Ryzen 7 7745HX | |
| Power Consumption / Prime95 V2810 Stress (external Monitor) | |
| Intel Core i9-14900K | |
| Intel Core i9-13900K | |
| Intel Core i5-14600K | |
| Intel Core i7-13700K | |
| Intel Core i5-13600K | |
| AMD Ryzen 9 7950X (Idle: 95.2 W) | |
| Intel Core i7-12700 | |
| AMD Ryzen 9 7950X3D | |
| Intel Core i5-12400F | |
| Intel Core i5-13400 | |
| AMD Ryzen 7 7800X3D | |
| AMD Ryzen 7 7745HX | |
| Power Consumption / Cinebench R23 Multi (external Monitor) | |
| Intel Core i9-14900K | |
| AMD Ryzen 9 7950X (95.2) | |
| Intel Core i5-14600K | |
| AMD Ryzen 9 7950X3D | |
| AMD Ryzen 7 7800X3D | |
| AMD Ryzen 7 7745HX | |
| Power Consumption / Cinebench R23 Single (external Monitor) | |
| AMD Ryzen 7 7800X3D | |
| AMD Ryzen 9 7950X (95.2) | |
| Intel Core i9-14900K | |
| Intel Core i5-14600K | |
| AMD Ryzen 7 7745HX | |
| Power Consumption / Cinebench R15 Multi Efficiency (external Monitor) | |
| AMD Ryzen 7 7745HX | |
| AMD Ryzen 9 7950X3D | |
| AMD Ryzen 9 7950X | |
| AMD Ryzen 7 7800X3D | |
| Intel Core i9-13900K | |
| Intel Core i5-13600K | |
| Intel Core i9-14900K | |
| Intel Core i5-14600K | |
* ... mindre är bättre
| Power Consumption / The Witcher 3 ultra (external Monitor) | |
| Intel Core i5-14600K | |
| Intel Core i9-14900K | |
| Intel Core i7-13700 | |
| Intel Core i7-13700K | |
| AMD Ryzen 9 7950X | |
| AMD Ryzen 9 7950X3D | |
| Intel Core i9-13900K | |
| Intel Core i7-12700 | |
| Intel Core i5-13400 | |
| AMD Ryzen 7 7800X3D | |
| AMD Ryzen 7 7745HX | |
| Intel Core i5-12400F | |
| AMD Ryzen 7 7745HX | |
| Power Consumption / Witcher 3 ultra Efficiency (external Monitor) | |
| AMD Ryzen 7 7800X3D | |
| Intel Core i5-12400F | |
| Intel Core i9-13900K | |
| AMD Ryzen 9 7950X | |
| Intel Core i7-12700 | |
| AMD Ryzen 9 7950X3D | |
| AMD Ryzen 7 7745HX | |
| Intel Core i7-13700K | |
| Intel Core i7-13700 | |
| Intel Core i9-14900K | |
| Intel Core i5-14600K | |
| Intel Core i5-13400 | |
| AMD Ryzen 7 7745HX | |
* ... mindre är bättre
Power consumption with external monitor
För
Emot
Dom - Kraftfull AMD Ryzen 7 7745HX
Minisforum BD770i från den kinesiska systemtillverkaren, känd för sina kompakta PC-datorer, utgör en utmärkt grund för att bygga högeffektiva enheter. Med BD770i vänder sig Minisforum till kunder som är intresserade av att själva montera sina system, eftersom paketet endast innehåller moderkortet med en permanent installerad CPU och en förmonterad heatpipe-kylare. Detta ger flexibilitet att skapa budgetvänliga system för daglig kontorsanvändning eller kraftfulla speluppsättningar genom att integrera ett dedikerat grafikkort.
Minisforum BD770i med AMD Ryzen 7 7745HX levererar robust prestanda och har stöd för framtida grafikkort med sin PCIe 5.0-anslutning.
Strategin att integrera en mobil CPU i en stationär dator har visat sig vara framgångsrik. Den effektiva strömförsörjningen, utan termisk strypning, säkerställer anmärkningsvärd effektivitet tack vare den låga strömförbrukningen. Även jämfört med AMD:s nuvarande X3D-processorer, som är kända för sin enastående effektivitet, håller Minisforums BD770i-moderkort måttet.
Även om det ursprungliga priset på ~399 USD kan verka högt, kan Minisforum BD770i vara ett övertygande val med tanke på dess prestandaklass i förhållande till ett konventionellt stationärt system. Den är särskilt lämplig för användare som inte planerar att uppgradera sin CPU senare. Det är dock viktigt att notera att detta är ett slags barebone-system, vilket innebär ytterligare kostnader för att göra enheten fullt funktionsduglig.
Pris och tillgänglighet
Minisforum säljer BD770i via Amazon, där även moderkortet kan köpas för $399.
Genomskinlighet
Valet av enheter som ska granskas görs av vår redaktion. Testexemplaret gavs till författaren av tillverkaren utan kostnad för granskning. Det fanns inget inflytande från tredje part på den här recensionen, inte heller fick tillverkaren en kopia av den här recensionen före publiceringen. Det fanns ingen skyldighet att publicera denna recension. Som ett oberoende medieföretag är Notebookcheck inte föremål för auktoritet från tillverkare, återförsäljare eller förlag.
This is how Notebookcheck is testingEvery year, Notebookcheck independently reviews hundreds of laptops and smartphones using standardized procedures to ensure that all results are comparable. We have continuously developed our test methods for around 20 years and set industry standards in the process. In our test labs, high-quality measuring equipment is utilized by experienced technicians and editors. These tests involve a multi-stage validation process. Our complex rating system is based on hundreds of well-founded measurements and benchmarks, which maintains objectivity.

