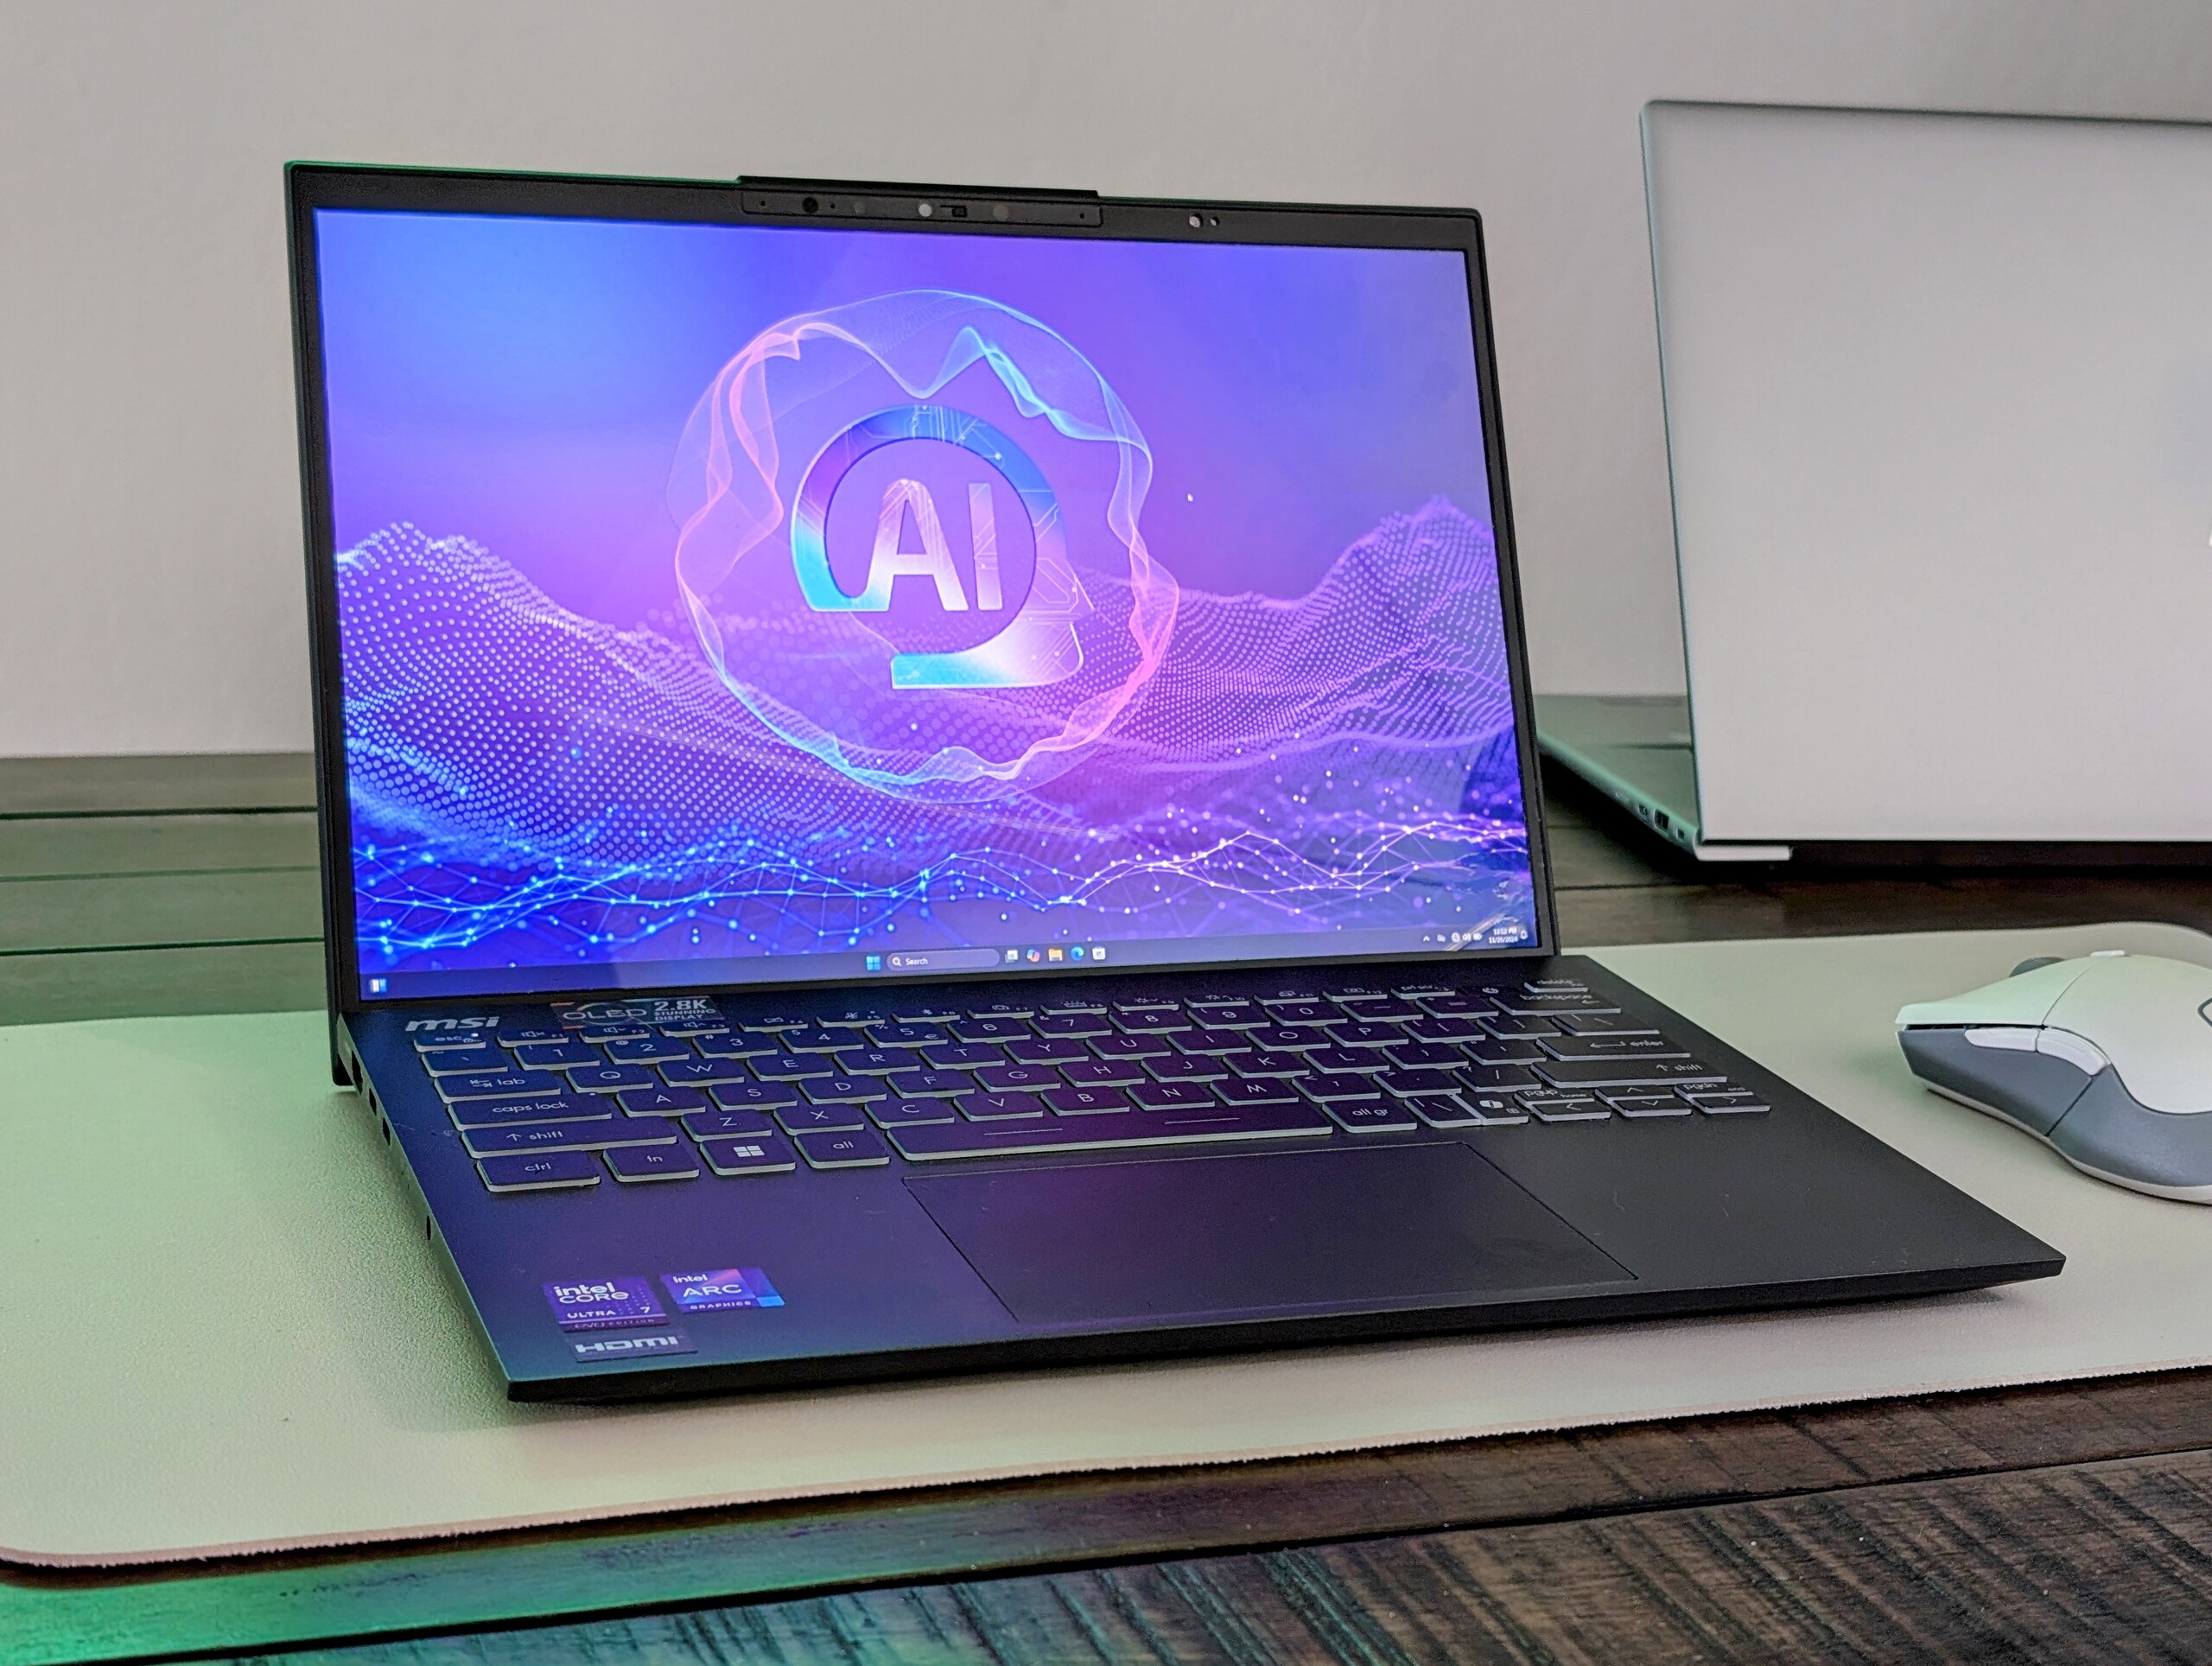
MSI Prestige 13 AI Plus Evo recension av bärbar dator: Bra grafikprestanda för under 1 kg
Core Ultra 7 258V jämfört med Core Ultra 7 155H.
MSI har uppdaterat sin lättaste bärbara 13-tumsdator med Lunar Lake-processorer som ersätter de äldre Meteor Lake-alternativen. Förändringarna har ökat både batteritid och grafikpotential utan att öka fläktljud eller vikt.Allen Ngo, 👁 Allen Ngo (översatt av DeepL / Ninh Duy) Publicerad 🇺🇸 🇫🇷 ...
Bedömning - Imponerande prestanda och portar för vikten
Ett av våra främsta klagomål på den ursprungliga Prestige 13 AI Evo var att processorn stryptes mer än väntat när man körde CPU-intensiva belastningar. Den nya Lunar Lake-processorn tar itu med detta problem genom att sänka den maximala Turbo Boost-potentialen samtidigt som den lägsta prestandanivån höjs vid körning av sådana belastningar. Detta har möjliggjort en jämnare och snabbare prestanda över tid, vilket borde tilltala innehållsskapare eller redaktörer som måste bearbeta eller koda större filer eller videor. Dessutom verkar dessa fördelar inte påverka batteritid, temperatur eller fläktljud i någon märkbar grad mellan Prestige 13 AI Evo och nyare Prestige 13 AI Plus Evo.
Grafikprestandan har ökat avsevärt, med så mycket som 1,5x till 2x beroende på applikation. Även om Arc 140V är långt ifrån en spelmaskin är den ändå imponerande med tanke på hur lätt den bärbara MSI-datorn är.
Medan prestanda har sett en nästan universell uppgång, förblir alla andra nackdelar som vi nämnde i vår Prestige 13 AI Evo-recension oförändrade. OLED-skärmen på 1800p är visserligen skarp och levande, men är begränsad till endast 60 Hz utan VRR- eller pekskärmsalternativ. Webbkamerakvaliteten och chassits styvhet är också några steg ner jämfört med tyngre alternativ från Dell eller HP. Trots detta erbjuder MSI en hel del prestanda och portar med tanke på hur lätt den är.
För
Emot
Pris och tillgänglighet
Amazon levererar nu MSI Prestige 13 AI Plus Evo som granskats för $ 1400 USD.
Potentiella konkurrenter i jämförelse
Bild | Modell / recensioner | Pris | Vikt | Höjd | Skärm |
|---|---|---|---|---|---|
| MSI Prestige 13 AI Plus Evo A2VMG Intel Core Ultra 7 258V ⎘ Intel Arc Graphics 140V ⎘ 32 GB Minne | Amazon: $1,399.99 Listpris: 1400 USD | 970 g | 16.9 mm | 13.30" 2880x1800 255 PPI OLED | |
| MSI Prestige 13 AI Evo Intel Core Ultra 7 155H ⎘ Intel Arc 8-Core iGPU ⎘ 32 GB Minne, 1024 GB SSD | Amazon: $1,399.99 Listpris: 1599€ | 967 g | 16.9 mm | 13.30" 2880x1800 OLED | |
| Dell XPS 13 9350 Intel Core Ultra 7 256V ⎘ Intel Arc Graphics 140V ⎘ 16 GB Minne, 512 GB SSD | Amazon: 1. $1,199.99 Dell XPS 13 9350 AI Business... 2. $1,499.99 Dell XPS 13 9350 AI Business... 3. $39.99 JD25G 90V7W 0N7T6 P54G 5K9CP... Listpris: 1400 USD | 1.2 kg | 15.3 mm | 13.40" 1920x1200 169 PPI IPS | |
| Framework Laptop 13.5 Core Ultra 7 155H Intel Core Ultra 7 155H ⎘ Intel Arc 8-Core iGPU ⎘ 32 GB Minne | Listpris: 1500 USD | 1.4 kg | 15.85 mm | 13.50" 2880x1920 256 PPI IPS | |
| Lenovo Yoga Book 9 13IMU9 Intel Core Ultra 7 155U ⎘ Intel Graphics 4-Core iGPU (Meteor / Arrow Lake) ⎘ 16 GB Minne | Listpris: 2000 USD | 1.4 kg | 15.95 mm | 13.30" 2880x1800 255 PPI OLED | |
| HP Dragonfly G4 Intel Core i7-1365U ⎘ Intel Iris Xe Graphics G7 96EUs ⎘ 16 GB Minne, 512 GB SSD | Amazon: $998.72 Listpris: 1700 USD | 1.1 kg | 16.3 mm | 13.50" 1920x1280 171 PPI IPS |
Det har bara gått sex månader sedan lanseringen av den ursprungliga Prestige 13 AI Evo och MSI har redan uppdaterat modellen med nyare Intel-processorer. Den kallas Prestige 13 AI Plus Evo och den senaste iterationen levereras med Lunar Lake-processorer istället för Meteor Lake.
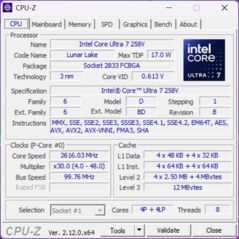
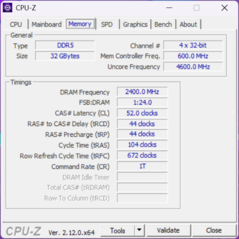
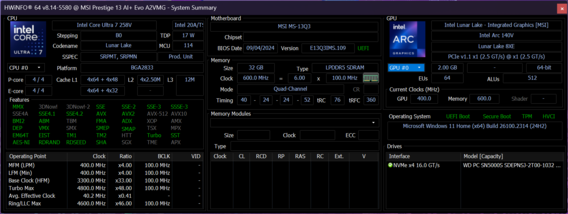
Vår testenhet är en mellankonfiguration med Core Ultra 7 258V, 32 GB LPDDR5x-8533 RAM och 1800p OLED-skärm för cirka $1400. Andra SKU: er kan levereras med en Core Ultra 9 288V eller Core Ultra 7 256V istället med hälften av RAM-minnet.
Konkurrenter inkluderar andra avancerade subnotebooks som Dell XPS 13 9350, Framework Laptop 13.5eller HP Dragonfly 14.
Fler MSI-recensioner:
Topp 10...
» Topp 10: Bästa bärbara allround/multimediadatorerna
» Topp 10: Bästa bärbara speldatorerna
» Topp 10: Bärbara budget/kontorsdatorer
» Topp 10: Bästa bärbara kontors/premiumdatorerna
» Topp 10: Bärbara arbetsstationer
» Topp 10: De bästa små/kompakta bärbara datorerna
» Topp 10: Bästa ultrabooks
» Topp 10: Bästa hybriddatorerna
» Topp 10: Bästa surfplattorna
» Topp 10: Marknadens bästa smartphones
Specifikationer
Fallet
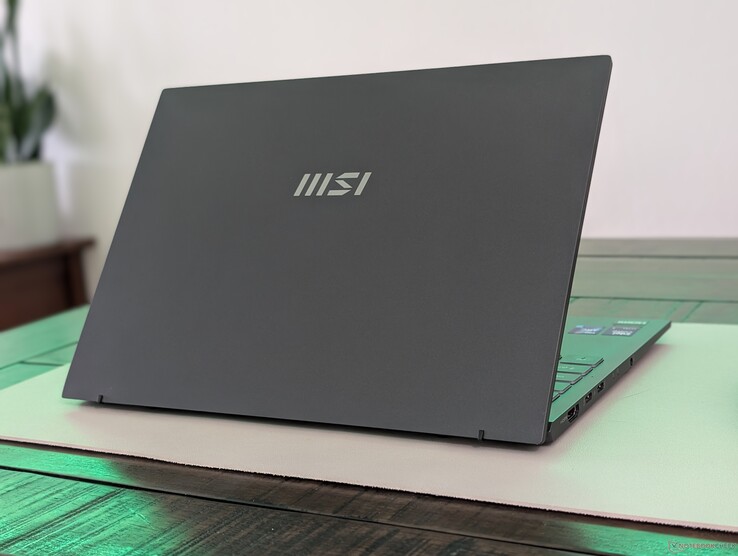
Vi rekommenderar att du kollar in vår recension av Prestige 13 AI Evo eftersom det inte finns några yttre skillnader mellan den och vår Prestige 13 AI Plus Evo. Systemet är en av de lättaste 13-tums subnotebook-datorerna på marknaden med en vikt på under 1 kg, men chassit tenderar att böjas och knaka lättare jämfört med tyngre modeller som XPS 13.
Anslutningsmöjligheter
Prestige 13 AI är en av få kvarvarande subnotebooks med både integrerade HDMI- och USB-A-portar. Vi uppskattar att systemet inte helt förlitar sig på enbart USB-C-portar.
SD-kortläsare
| SD Card Reader | |
| average JPG Copy Test (av. of 3 runs) | |
| Framework Laptop 13.5 Core Ultra 7 155H (Toshiba Exceria Pro SDXC 64 GB UHS-II) | |
| MSI Prestige 13 AI Evo (Angelbird AV Pro V60) | |
| MSI Prestige 13 AI Plus Evo A2VMG (Angelbird AV Pro V60) | |
| maximum AS SSD Seq Read Test (1GB) | |
| Framework Laptop 13.5 Core Ultra 7 155H (Toshiba Exceria Pro SDXC 64 GB UHS-II) | |
| MSI Prestige 13 AI Evo (Angelbird AV Pro V60) | |
| MSI Prestige 13 AI Plus Evo A2VMG (Angelbird AV Pro V60) | |
Kommunikation
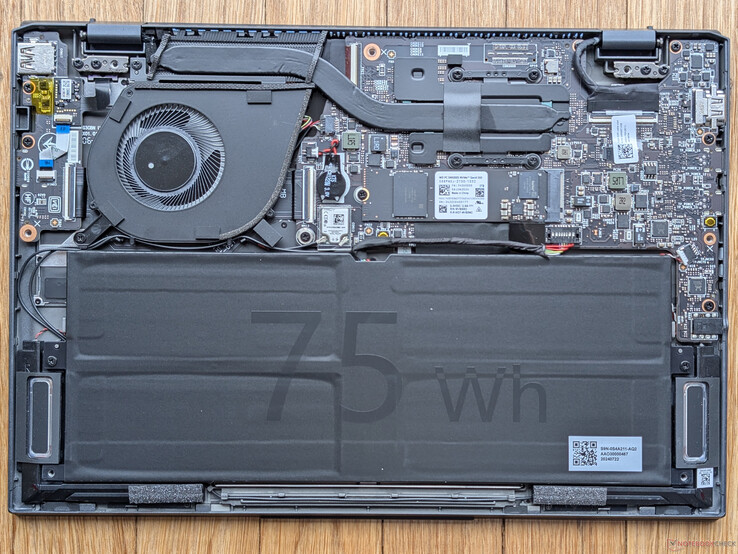
Intressant nog levereras vår enhet med Intel Killer AX1775s istället för BE1750W som finns i Core Ultra 7 155H-konfigurationen. AX1775s har inte stöd för Wi-Fi 7 till skillnad från BE1750W.
Webbkamera
Webbkamerans kvalitet har förbättrats från 2 MP på den ursprungliga modellen till 5 MP för skarpare bilder.
Underhåll
Hållbarhet
Modellen följer EPEAT:s Silver-riktlinjer för hållbarhet och förpackningen består mestadels av kartong och papper med lite plast runt den bärbara datorn och nätadaptern.
Display
Samsung OLED-skärmen på 1800p är densamma som tidigare. Medan bildkvaliteten är utmärkt och utan problem med kornighet, skulle vi ha föredragit en uppgradering av uppdateringsfrekvensen till 90 Hz eller 120 Hz eftersom 60 Hz börjar se föråldrat ut för en avancerad subnotebook.
Maximal ljusstyrka kan nå upp till 598 nits i HDR-läge. Annars toppar den på 382 nits i SDR-läge.
| |||||||||||||||||||||||||
Distribution av ljusstyrkan: 99 %
Mitt på batteriet: 382.4 cd/m²
Kontrast: ∞:1 (Svärta: 0 cd/m²)
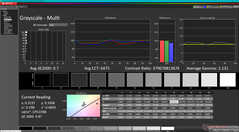
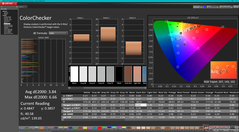
ΔE ColorChecker Calman: 3.84 | ∀{0.5-29.43 Ø4.77}
calibrated: 0.41
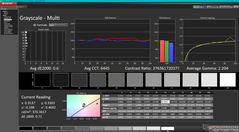
ΔE Greyscale Calman: 0.7 | ∀{0.09-98 Ø5}
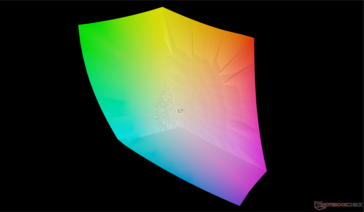
95.8% AdobeRGB 1998 (Argyll 3D)
100% sRGB (Argyll 3D)
99.9% Display P3 (Argyll 3D)
Gamma: 2.23
CCT: 6475 K
| MSI Prestige 13 AI Plus Evo A2VMG ATNA33AA07-0, OLED, 2880x1800, 13.3", 60 Hz | MSI Prestige 13 AI Evo ATNA33AA07-0, OLED, 2880x1800, 13.3", 60 Hz | Dell XPS 13 9350 LG Philips 134WU2, IPS, 1920x1200, 13.4", 120 Hz | Framework Laptop 13.5 Core Ultra 7 155H BOE NE135A1M-NY1, IPS, 2880x1920, 13.5", 120 Hz | Lenovo Yoga Book 9 13IMU9 SDC ATNA33AA02-0, OLED, 2880x1800, 13.3", 60 Hz | HP Dragonfly G4 Chi Mei CMN13C0, IPS, 1920x1280, 13.5", 60 Hz | |
|---|---|---|---|---|---|---|
| Display | 1% | -21% | -17% | 0% | -20% | |
| Display P3 Coverage (%) | 99.9 | 99.9 0% | 67.3 -33% | 72.8 -27% | 99.7 0% | 68.4 -32% |
| sRGB Coverage (%) | 100 | 100 0% | 99 -1% | 98.6 -1% | 100 0% | 98.3 -2% |
| AdobeRGB 1998 Coverage (%) | 95.8 | 97.8 2% | 68.6 -28% | 72.9 -24% | 97 1% | 70.4 -27% |
| Response Times | 25% | -1503% | -1567% | -1% | -1933% | |
| Response Time Grey 50% / Grey 80% * (ms) | 1.94 ? | 1.54 ? 21% | 37.3 ? -1823% | 41.9 ? -2060% | 1.88 ? 3% | 48.8 ? -2415% |
| Response Time Black / White * (ms) | 2.02 ? | 1.44 ? 29% | 25.9 ? -1182% | 23.7 ? -1073% | 2.1 ? -4% | 31.3 ? -1450% |
| PWM Frequency (Hz) | 60 ? | 240 ? | 60 ? | |||
| PWM Amplitude * (%) | 21.9 | |||||
| Screen | 3% | 17% | -108% | -50% | -27% | |
| Brightness middle (cd/m²) | 382.4 | 404 6% | 462.8 21% | 498.5 30% | 362.6 -5% | 408.8 7% |
| Brightness (cd/m²) | 383 | 407 6% | 435 14% | 464 21% | 368 -4% | 399 4% |
| Brightness Distribution (%) | 99 | 98 -1% | 87 -12% | 86 -13% | 97 -2% | 90 -9% |
| Black Level * (cd/m²) | 0.19 | 0.36 | 0.32 | |||
| Colorchecker dE 2000 * | 3.84 | 2.1 45% | 1.92 50% | 4.27 -11% | 4.66 -21% | 2.02 47% |
| Colorchecker dE 2000 max. * | 6.66 | 4.3 35% | 3.45 48% | 7.08 -6% | 7.25 -9% | 3.84 42% |
| Colorchecker dE 2000 calibrated * | 0.41 | 0.48 -17% | 1.26 -207% | 0.56 -37% | 0.61 -49% | |
| Greyscale dE 2000 * | 0.7 | 1.2 -71% | 0.6 14% | 4.7 -571% | 2.6 -271% | 2.3 -229% |
| Gamma | 2.23 99% | 2.16 102% | 2.19 100% | 2.09 105% | 2.2 100% | 2.2 100% |
| CCT | 6475 100% | 6465 101% | 6539 99% | 7417 88% | 6055 107% | 6203 105% |
| Contrast (:1) | 2436 | 1385 | 1278 | |||
| Totalt genomsnitt (program/inställningar) | 10% /
7% | -502% /
-246% | -564% /
-329% | -17% /
-29% | -660% /
-343% |
* ... mindre är bättre
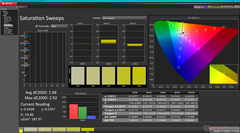
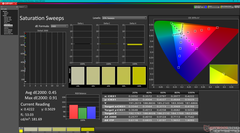
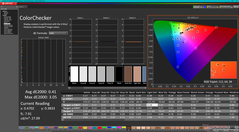
Skärmen är välkalibrerad mot P3-standarden med genomsnittliga deltaE-värden för gråskala och ColorChecker på bara 0,7 respektive 3,84.
Visa svarstider
| ↔ Svarstid svart till vitt | ||
|---|---|---|
| 2.02 ms ... stiga ↗ och falla ↘ kombinerat | ↗ 0.92 ms stiga | |
| ↘ 1.1 ms hösten | ||
| Skärmen visar väldigt snabba svarsfrekvenser i våra tester och borde vara mycket väl lämpad för fartfyllt spel. I jämförelse sträcker sig alla testade enheter från 0.1 (minst) till 240 (maximalt) ms. » 11 % av alla enheter är bättre. Det betyder att den uppmätta svarstiden är bättre än genomsnittet av alla testade enheter (20.1 ms). | ||
| ↔ Svarstid 50 % grått till 80 % grått | ||
| 1.94 ms ... stiga ↗ och falla ↘ kombinerat | ↗ 1 ms stiga | |
| ↘ 0.94 ms hösten | ||
| Skärmen visar väldigt snabba svarsfrekvenser i våra tester och borde vara mycket väl lämpad för fartfyllt spel. I jämförelse sträcker sig alla testade enheter från 0.165 (minst) till 636 (maximalt) ms. » 9 % av alla enheter är bättre. Det betyder att den uppmätta svarstiden är bättre än genomsnittet av alla testade enheter (31.5 ms). | ||
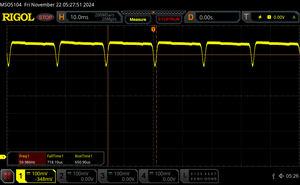
Skärmflimmer / PWM (Puls-Width Modulation)
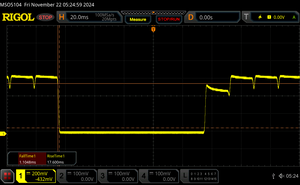
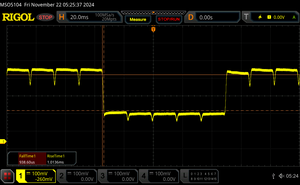
| Skärmflimmer / PWM upptäckt | 60 Hz Amplitude: 21.9 % | ≤ 100 % ljusstyrka inställning | |
Displayens bakgrundsbelysning flimrar vid 60 Hz (i värsta fall, t.ex. med PWM) Flimrande upptäckt vid en ljusstyrkeinställning på 100 % och lägre. Det ska inte finnas något flimmer eller PWM över denna ljusstyrkeinställning. Frekvensen för 60 Hz är mycket låg, så flimmer kan orsaka ögon- och huvudvärk efter långvarig användning. Som jämförelse: 53 % av alla testade enheter använder inte PWM för att dämpa skärmen. Om PWM upptäcktes mättes ett medelvärde av 8042 (minst: 5 - maximum: 343500) Hz. | |||
Prestanda
Testförhållanden
Vi ställde in både Windows och MSI Center till prestandaläge innan vi körde riktmärkena nedan. Cooler Boost-läget (även kallat maximalt fläktläge) är också tillgängligt, men det påverkar inte prestandan avsevärt, vilket våra riktmärken nedan kommer att visa.
Processor
Jämfört med Core Ultra 7 155H har vår Core Ultra 7 258V långsammare Turbo Boost-potential men stabilare och snabbare prestanda under längre perioder. Detta är tydligt när man kör CineBench R15 xT i en loop, vilket visas i diagrammet nedan där Core Ultra 7 155H-konfigurationen bara överträffar vår Core Ultra 7 258V-konfiguration under början av testet innan den så småningom stryps kraftigare efter bara den första loopen.
Cinebench R15 Multi Loop
Cinebench R23: Multi Core | Single Core
Cinebench R20: CPU (Multi Core) | CPU (Single Core)
Cinebench R15: CPU Multi 64Bit | CPU Single 64Bit
Blender: v2.79 BMW27 CPU
7-Zip 18.03: 7z b 4 | 7z b 4 -mmt1
Geekbench 6.5: Multi-Core | Single-Core
Geekbench 5.5: Multi-Core | Single-Core
HWBOT x265 Benchmark v2.2: 4k Preset
LibreOffice : 20 Documents To PDF
R Benchmark 2.5: Overall mean
* ... mindre är bättre
AIDA64: FP32 Ray-Trace | FPU Julia | CPU SHA3 | CPU Queen | FPU SinJulia | FPU Mandel | CPU AES | CPU ZLib | FP64 Ray-Trace | CPU PhotoWorxx
| Performance rating | |
| Framework Laptop 13.5 Core Ultra 7 155H | |
| MSI Prestige 13 AI Plus Evo A2VMG | |
| Dell XPS 13 9350 | |
| Genomsnitt Intel Core Ultra 7 258V | |
| Lenovo Yoga Book 9 13IMU9 | |
| MSI Prestige 13 AI Evo | |
| HP Dragonfly G4 | |
| AIDA64 / FP32 Ray-Trace | |
| MSI Prestige 13 AI Plus Evo A2VMG | |
| Dell XPS 13 9350 | |
| Framework Laptop 13.5 Core Ultra 7 155H | |
| Genomsnitt Intel Core Ultra 7 258V (8454 - 12781, n=23) | |
| Lenovo Yoga Book 9 13IMU9 | |
| HP Dragonfly G4 | |
| MSI Prestige 13 AI Evo | |
| AIDA64 / FPU Julia | |
| MSI Prestige 13 AI Plus Evo A2VMG | |
| Dell XPS 13 9350 | |
| Framework Laptop 13.5 Core Ultra 7 155H | |
| Genomsnitt Intel Core Ultra 7 258V (40875 - 63401, n=23) | |
| MSI Prestige 13 AI Evo | |
| Lenovo Yoga Book 9 13IMU9 | |
| HP Dragonfly G4 | |
| AIDA64 / CPU SHA3 | |
| MSI Prestige 13 AI Plus Evo A2VMG | |
| Framework Laptop 13.5 Core Ultra 7 155H | |
| Dell XPS 13 9350 | |
| Genomsnitt Intel Core Ultra 7 258V (1930 - 2817, n=23) | |
| Lenovo Yoga Book 9 13IMU9 | |
| MSI Prestige 13 AI Evo | |
| HP Dragonfly G4 | |
| AIDA64 / CPU Queen | |
| Framework Laptop 13.5 Core Ultra 7 155H | |
| HP Dragonfly G4 | |
| MSI Prestige 13 AI Evo | |
| MSI Prestige 13 AI Plus Evo A2VMG | |
| Genomsnitt Intel Core Ultra 7 258V (48816 - 49818, n=23) | |
| Dell XPS 13 9350 | |
| Lenovo Yoga Book 9 13IMU9 | |
| AIDA64 / FPU SinJulia | |
| Framework Laptop 13.5 Core Ultra 7 155H | |
| MSI Prestige 13 AI Evo | |
| Lenovo Yoga Book 9 13IMU9 | |
| HP Dragonfly G4 | |
| Dell XPS 13 9350 | |
| MSI Prestige 13 AI Plus Evo A2VMG | |
| Genomsnitt Intel Core Ultra 7 258V (3817 - 4440, n=23) | |
| AIDA64 / FPU Mandel | |
| MSI Prestige 13 AI Plus Evo A2VMG | |
| Dell XPS 13 9350 | |
| Genomsnitt Intel Core Ultra 7 258V (21670 - 33565, n=23) | |
| Framework Laptop 13.5 Core Ultra 7 155H | |
| MSI Prestige 13 AI Evo | |
| Lenovo Yoga Book 9 13IMU9 | |
| HP Dragonfly G4 | |
| AIDA64 / CPU AES | |
| Framework Laptop 13.5 Core Ultra 7 155H | |
| MSI Prestige 13 AI Evo | |
| Lenovo Yoga Book 9 13IMU9 | |
| Dell XPS 13 9350 | |
| MSI Prestige 13 AI Plus Evo A2VMG | |
| Genomsnitt Intel Core Ultra 7 258V (30957 - 40753, n=23) | |
| HP Dragonfly G4 | |
| AIDA64 / CPU ZLib | |
| Framework Laptop 13.5 Core Ultra 7 155H | |
| Lenovo Yoga Book 9 13IMU9 | |
| MSI Prestige 13 AI Plus Evo A2VMG | |
| Genomsnitt Intel Core Ultra 7 258V (422 - 632, n=23) | |
| MSI Prestige 13 AI Evo | |
| Dell XPS 13 9350 | |
| HP Dragonfly G4 | |
| AIDA64 / FP64 Ray-Trace | |
| MSI Prestige 13 AI Plus Evo A2VMG | |
| Dell XPS 13 9350 | |
| Genomsnitt Intel Core Ultra 7 258V (4258 - 6930, n=23) | |
| Framework Laptop 13.5 Core Ultra 7 155H | |
| Lenovo Yoga Book 9 13IMU9 | |
| MSI Prestige 13 AI Evo | |
| HP Dragonfly G4 | |
| AIDA64 / CPU PhotoWorxx | |
| MSI Prestige 13 AI Plus Evo A2VMG | |
| Genomsnitt Intel Core Ultra 7 258V (44223 - 55458, n=23) | |
| Dell XPS 13 9350 | |
| Framework Laptop 13.5 Core Ultra 7 155H | |
| Lenovo Yoga Book 9 13IMU9 | |
| MSI Prestige 13 AI Evo | |
| HP Dragonfly G4 | |
Systemets prestanda
CrossMark: Overall | Productivity | Creativity | Responsiveness
WebXPRT 3: Overall
WebXPRT 4: Overall
Mozilla Kraken 1.1: Total
| PCMark 10 / Score | |
| Dell XPS 13 9350 | |
| Genomsnitt Intel Core Ultra 7 258V, Intel Arc Graphics 140V (6265 - 7314, n=22) | |
| Framework Laptop 13.5 Core Ultra 7 155H | |
| MSI Prestige 13 AI Plus Evo A2VMG | |
| Lenovo Yoga Book 9 13IMU9 | |
| MSI Prestige 13 AI Evo | |
| HP Dragonfly G4 | |
| PCMark 10 / Essentials | |
| Lenovo Yoga Book 9 13IMU9 | |
| HP Dragonfly G4 | |
| Framework Laptop 13.5 Core Ultra 7 155H | |
| Genomsnitt Intel Core Ultra 7 258V, Intel Arc Graphics 140V (9295 - 11467, n=22) | |
| MSI Prestige 13 AI Plus Evo A2VMG | |
| Dell XPS 13 9350 | |
| MSI Prestige 13 AI Evo | |
| PCMark 10 / Productivity | |
| Dell XPS 13 9350 | |
| Genomsnitt Intel Core Ultra 7 258V, Intel Arc Graphics 140V (7357 - 9619, n=22) | |
| MSI Prestige 13 AI Evo | |
| Framework Laptop 13.5 Core Ultra 7 155H | |
| MSI Prestige 13 AI Plus Evo A2VMG | |
| Lenovo Yoga Book 9 13IMU9 | |
| HP Dragonfly G4 | |
| PCMark 10 / Digital Content Creation | |
| MSI Prestige 13 AI Plus Evo A2VMG | |
| Dell XPS 13 9350 | |
| Genomsnitt Intel Core Ultra 7 258V, Intel Arc Graphics 140V (8914 - 10308, n=22) | |
| Framework Laptop 13.5 Core Ultra 7 155H | |
| Lenovo Yoga Book 9 13IMU9 | |
| MSI Prestige 13 AI Evo | |
| HP Dragonfly G4 | |
| CrossMark / Overall | |
| Dell XPS 13 9350 | |
| MSI Prestige 13 AI Plus Evo A2VMG | |
| Framework Laptop 13.5 Core Ultra 7 155H | |
| Genomsnitt Intel Core Ultra 7 258V, Intel Arc Graphics 140V (1551 - 1742, n=21) | |
| HP Dragonfly G4 | |
| Lenovo Yoga Book 9 13IMU9 | |
| MSI Prestige 13 AI Evo | |
| CrossMark / Productivity | |
| Dell XPS 13 9350 | |
| MSI Prestige 13 AI Plus Evo A2VMG | |
| Genomsnitt Intel Core Ultra 7 258V, Intel Arc Graphics 140V (1479 - 1684, n=21) | |
| HP Dragonfly G4 | |
| Framework Laptop 13.5 Core Ultra 7 155H | |
| MSI Prestige 13 AI Evo | |
| Lenovo Yoga Book 9 13IMU9 | |
| CrossMark / Creativity | |
| MSI Prestige 13 AI Plus Evo A2VMG | |
| Dell XPS 13 9350 | |
| Framework Laptop 13.5 Core Ultra 7 155H | |
| Genomsnitt Intel Core Ultra 7 258V, Intel Arc Graphics 140V (1727 - 1977, n=21) | |
| HP Dragonfly G4 | |
| Lenovo Yoga Book 9 13IMU9 | |
| MSI Prestige 13 AI Evo | |
| CrossMark / Responsiveness | |
| HP Dragonfly G4 | |
| Framework Laptop 13.5 Core Ultra 7 155H | |
| Dell XPS 13 9350 | |
| MSI Prestige 13 AI Plus Evo A2VMG | |
| Genomsnitt Intel Core Ultra 7 258V, Intel Arc Graphics 140V (1246 - 1411, n=21) | |
| MSI Prestige 13 AI Evo | |
| Lenovo Yoga Book 9 13IMU9 | |
| WebXPRT 3 / Overall | |
| Dell XPS 13 9350 | |
| HP Dragonfly G4 | |
| MSI Prestige 13 AI Plus Evo A2VMG | |
| Framework Laptop 13.5 Core Ultra 7 155H | |
| Genomsnitt Intel Core Ultra 7 258V, Intel Arc Graphics 140V (219 - 317, n=21) | |
| Lenovo Yoga Book 9 13IMU9 | |
| MSI Prestige 13 AI Evo | |
| WebXPRT 4 / Overall | |
| MSI Prestige 13 AI Plus Evo A2VMG | |
| Dell XPS 13 9350 | |
| Genomsnitt Intel Core Ultra 7 258V, Intel Arc Graphics 140V (199.5 - 291, n=21) | |
| HP Dragonfly G4 | |
| Framework Laptop 13.5 Core Ultra 7 155H | |
| Lenovo Yoga Book 9 13IMU9 | |
| MSI Prestige 13 AI Evo | |
| Mozilla Kraken 1.1 / Total | |
| Lenovo Yoga Book 9 13IMU9 | |
| MSI Prestige 13 AI Evo | |
| Framework Laptop 13.5 Core Ultra 7 155H | |
| HP Dragonfly G4 | |
| Genomsnitt Intel Core Ultra 7 258V, Intel Arc Graphics 140V (468 - 559, n=23) | |
| MSI Prestige 13 AI Plus Evo A2VMG | |
| Dell XPS 13 9350 | |
* ... mindre är bättre
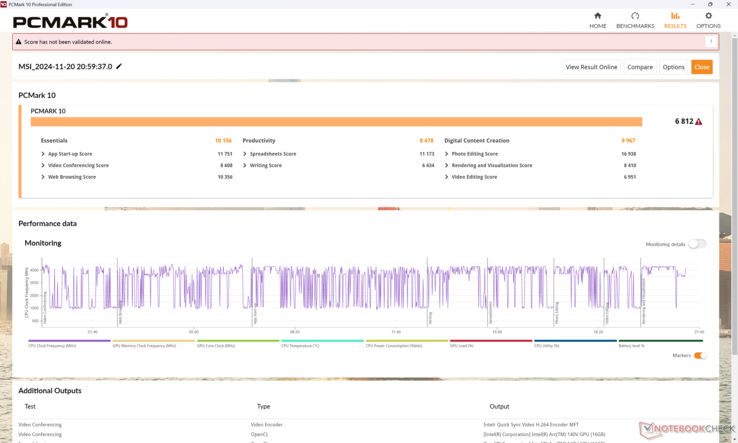
| PCMark 10 Score | 6812 poäng | |
Hjälp | ||
| AIDA64 / Memory Copy | |
| MSI Prestige 13 AI Plus Evo A2VMG | |
| Genomsnitt Intel Core Ultra 7 258V (104408 - 114336, n=23) | |
| Dell XPS 13 9350 | |
| MSI Prestige 13 AI Evo | |
| Lenovo Yoga Book 9 13IMU9 | |
| Framework Laptop 13.5 Core Ultra 7 155H | |
| HP Dragonfly G4 | |
| AIDA64 / Memory Read | |
| Dell XPS 13 9350 | |
| Genomsnitt Intel Core Ultra 7 258V (82846 - 89417, n=23) | |
| MSI Prestige 13 AI Plus Evo A2VMG | |
| Framework Laptop 13.5 Core Ultra 7 155H | |
| MSI Prestige 13 AI Evo | |
| Lenovo Yoga Book 9 13IMU9 | |
| HP Dragonfly G4 | |
| AIDA64 / Memory Write | |
| MSI Prestige 13 AI Plus Evo A2VMG | |
| Genomsnitt Intel Core Ultra 7 258V (108842 - 117989, n=23) | |
| Dell XPS 13 9350 | |
| MSI Prestige 13 AI Evo | |
| Framework Laptop 13.5 Core Ultra 7 155H | |
| HP Dragonfly G4 | |
| Lenovo Yoga Book 9 13IMU9 | |
| AIDA64 / Memory Latency | |
| MSI Prestige 13 AI Evo | |
| Lenovo Yoga Book 9 13IMU9 | |
| Framework Laptop 13.5 Core Ultra 7 155H | |
| MSI Prestige 13 AI Plus Evo A2VMG | |
| Dell XPS 13 9350 | |
| Genomsnitt Intel Core Ultra 7 258V (95 - 101.1, n=23) | |
| HP Dragonfly G4 | |
* ... mindre är bättre
DPC-fördröjning
| DPC Latencies / LatencyMon - interrupt to process latency (max), Web, Youtube, Prime95 | |
| MSI Prestige 13 AI Evo | |
| Lenovo Yoga Book 9 13IMU9 | |
| HP Dragonfly G4 | |
| MSI Prestige 13 AI Plus Evo A2VMG | |
| Framework Laptop 13.5 Core Ultra 7 155H | |
* ... mindre är bättre
Lagringsenheter
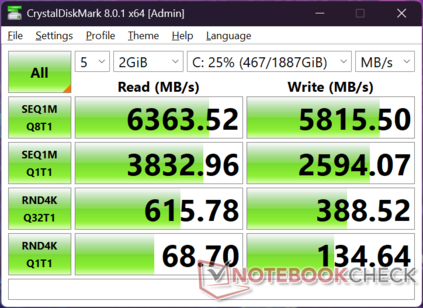
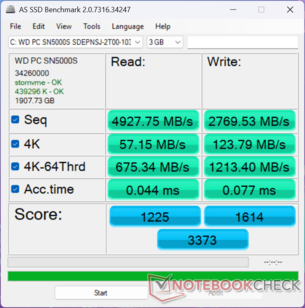
Vår enhet levereras med WD SN5000S istället för Samsung PM9A1 som fanns i vår Core Ultra 7 155H-konfiguration. Hårddisken uppvisar inga av de strypningsproblem som vi upplevde på den ursprungliga Prestige 13 AI.
| Drive Performance rating - Percent | |
| MSI Prestige 13 AI Evo | |
| Framework Laptop 13.5 Core Ultra 7 155H | |
| HP Dragonfly G4 | |
| MSI Prestige 13 AI Plus Evo A2VMG | |
| Lenovo Yoga Book 9 13IMU9 | |
| Dell XPS 13 9350 | |
* ... mindre är bättre
Disk Throttling: DiskSpd Read Loop, Queue Depth 8
GPU-prestanda
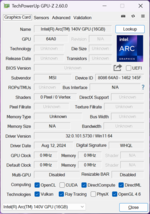
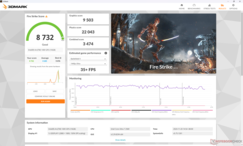
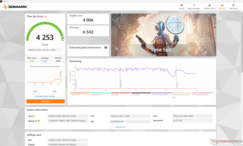
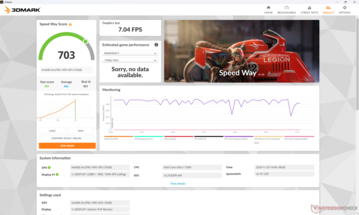
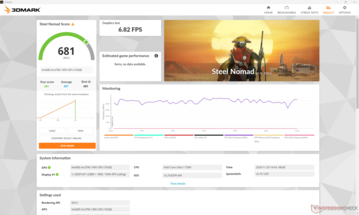
Den nya integrerade Arc 140V GPU är utan tvekan en av de största uppgraderingarna jämfört med Arc 8 i Core Ultra 7 155H-konfigurationen. 3DMark-resultaten är 1,5x till 2x snabbare och detta översätts ganska bra till spelscenarier som GTA V eller till och med Cyberpunk 2077 där Core Ultra 7 155H -konfigurationen tenderar att underprestera.
| Effektprofil | Grafikpoäng | Fysikpoäng | Kombinerad poäng |
| Prestandaläge (Cooler Boost på) | 9513 | 21842 | 3426 |
| Prestanda-läge (kylarboost av) | 9503 | 22043 | 3474 |
| Balanserat läge | 9376 | 21037 | 3019 |
| Batterikraft | 9471 | 21837 | 3440 |
Att köra systemet med Cooler Boost aktiverat eller i balanserat läge eller till och med bara batteridrift kommer inte att påverka prestandan nämnvärt, vilket framgår av resultattabellen Fire Strike ovan.
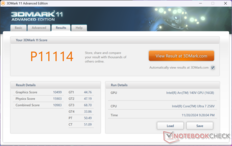
| 3DMark 11 Performance | 11114 poäng | |
| 3DMark Cloud Gate Standard Score | 33012 poäng | |
| 3DMark Fire Strike Score | 8732 poäng | |
| 3DMark Time Spy Score | 4253 poäng | |
| 3DMark Steel Nomad Score | 681 poäng | |
Hjälp | ||
* ... mindre är bättre
| Performance rating - Percent | |
| MSI Prestige 13 AI Plus Evo A2VMG | |
| Dell XPS 13 9350 | |
| Framework Laptop 13.5 Core Ultra 7 155H | |
| MSI Prestige 13 AI Evo -2! | |
| Lenovo Yoga Book 9 13IMU9 -2! | |
| HP Dragonfly G4 -2! | |
| Cyberpunk 2077 - 1920x1080 Ultra Preset (FSR off) | |
| MSI Prestige 13 AI Plus Evo A2VMG | |
| Framework Laptop 13.5 Core Ultra 7 155H | |
| Dell XPS 13 9350 | |
| Lenovo Yoga Book 9 13IMU9 | |
| Baldur's Gate 3 - 1920x1080 Ultra Preset AA:T | |
| MSI Prestige 13 AI Plus Evo A2VMG | |
| Framework Laptop 13.5 Core Ultra 7 155H | |
| Dell XPS 13 9350 | |
| GTA V - 1920x1080 Highest AA:4xMSAA + FX AF:16x | |
| MSI Prestige 13 AI Plus Evo A2VMG | |
| Dell XPS 13 9350 | |
| Framework Laptop 13.5 Core Ultra 7 155H | |
| HP Dragonfly G4 | |
| MSI Prestige 13 AI Evo | |
| Final Fantasy XV Benchmark - 1920x1080 High Quality | |
| MSI Prestige 13 AI Plus Evo A2VMG | |
| Dell XPS 13 9350 | |
| Framework Laptop 13.5 Core Ultra 7 155H | |
| MSI Prestige 13 AI Evo | |
| HP Dragonfly G4 | |
| Lenovo Yoga Book 9 13IMU9 | |
| Strange Brigade - 1920x1080 ultra AA:ultra AF:16 | |
| Dell XPS 13 9350 | |
| MSI Prestige 13 AI Plus Evo A2VMG | |
| Framework Laptop 13.5 Core Ultra 7 155H | |
| MSI Prestige 13 AI Evo | |
| Lenovo Yoga Book 9 13IMU9 | |
| HP Dragonfly G4 | |
| Dota 2 Reborn - 1920x1080 ultra (3/3) best looking | |
| MSI Prestige 13 AI Plus Evo A2VMG | |
| Dell XPS 13 9350 | |
| Framework Laptop 13.5 Core Ultra 7 155H | |
| Lenovo Yoga Book 9 13IMU9 | |
| HP Dragonfly G4 | |
| MSI Prestige 13 AI Evo | |
| X-Plane 11.11 - 1920x1080 high (fps_test=3) | |
| MSI Prestige 13 AI Plus Evo A2VMG | |
| Framework Laptop 13.5 Core Ultra 7 155H | |
| MSI Prestige 13 AI Evo | |
| Dell XPS 13 9350 | |
| HP Dragonfly G4 | |
| Lenovo Yoga Book 9 13IMU9 | |
Cyberpunk 2077 ultra FPS Chart
| låg | med. | hög | ultra | |
|---|---|---|---|---|
| GTA V (2015) | 161.6 | 155.6 | 67.4 | 26.7 |
| Dota 2 Reborn (2015) | 97.2 | 87.8 | 72.1 | 83 |
| Final Fantasy XV Benchmark (2018) | 84 | 46.2 | 31.7 | |
| X-Plane 11.11 (2018) | 56.6 | 42.6 | 36.9 | |
| Far Cry 5 (2018) | 92 | 57 | 49 | 45 |
| Strange Brigade (2018) | 216 | 74.6 | 63 | 55.4 |
| Tiny Tina's Wonderlands (2022) | 72.1 | 53.3 | 36 | 28 |
| F1 22 (2022) | 96.2 | 88.5 | 63.9 | 19.9 |
| Baldur's Gate 3 (2023) | 39.6 | 33.5 | 29.8 | 29.1 |
| Cyberpunk 2077 (2023) | 46.6 | 37.4 | 32.5 | 28.5 |
Utsläpp
Systembuller
Fläktljudet är generellt högre än tidigare när man kör mer krävande belastningar som spel. Att köra Cyberpunk 2077 i Performance-läge skulle ge en fläktljudnivå på 45 dB(A) jämfört med nästan 51 dB(A) i Cooler Boost-läge.
Ljudnivå
| Låg belastning |
| 24.8 / 24.8 / 26.7 dB(A) |
| Hög belastning |
| 36.8 / 50.8 dB(A) |
 | ||
30 dB tyst 40 dB(A) hörbar 50 dB(A) högt ljud |
||
min: | ||
| MSI Prestige 13 AI Plus Evo A2VMG Arc 140V, Core Ultra 7 258V | MSI Prestige 13 AI Evo Arc 8-Core, Ultra 7 155H, Samsung PM9A1 MZVL21T0HCLR | Dell XPS 13 9350 Arc 140V, Core Ultra 7 256V, Micron 2550 512GB | Framework Laptop 13.5 Core Ultra 7 155H Arc 8-Core, Ultra 7 155H | Lenovo Yoga Book 9 13IMU9 Graphics 4-Core iGPU (Arrow Lake), Ultra 7 155U | HP Dragonfly G4 Iris Xe G7 96EUs, i7-1365U, Micron 3400 MTFDKBA512TFH 512GB | |
|---|---|---|---|---|---|---|
| Noise | 6% | 11% | 1% | 16% | 12% | |
| av / miljö * (dB) | 24.1 | 23.4 3% | 24.1 -0% | 24 -0% | 23.3 3% | 23.3 3% |
| Idle Minimum * (dB) | 24.8 | 23.4 6% | 24.4 2% | 24.1 3% | 23.3 6% | 23.5 5% |
| Idle Average * (dB) | 24.8 | 26.9 -8% | 24.4 2% | 25.1 -1% | 23.3 6% | 23.5 5% |
| Idle Maximum * (dB) | 26.7 | 26.9 -1% | 24.4 9% | 27 -1% | 24.6 8% | 26.8 -0% |
| Load Average * (dB) | 36.8 | 32 13% | 26.2 29% | 38.4 -4% | 26.2 29% | 27.2 26% |
| Cyberpunk 2077 ultra * (dB) | 44.5 | 34.2 23% | 43.7 2% | |||
| Load Maximum * (dB) | 50.8 | 40.3 21% | 45.2 11% | 45.8 10% | 27.3 46% | 35 31% |
| Witcher 3 ultra * (dB) | 32 | 27.3 | 32.7 |
* ... mindre är bättre
Temperatur
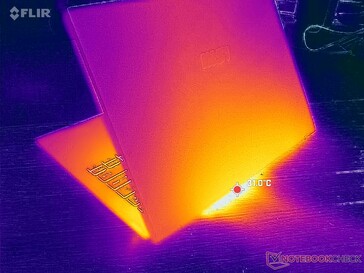
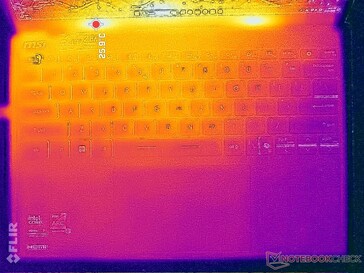
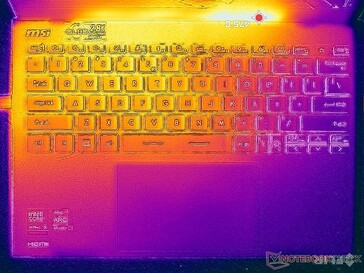
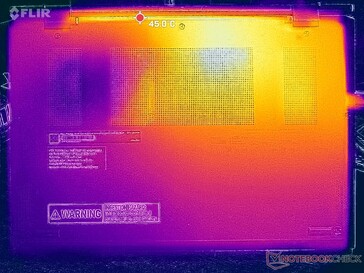
(±) Den maximala temperaturen på ovansidan är 43.4 °C / 110 F, jämfört med genomsnittet av 35.9 °C / 97 F , allt från 21.4 till 59 °C för klassen Subnotebook.
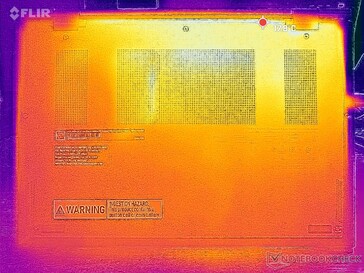
(±) Botten värms upp till maximalt 42.4 °C / 108 F, jämfört med genomsnittet av 39.3 °C / 103 F
(+) Vid tomgångsbruk är medeltemperaturen för ovansidan 23.4 °C / 74 F, jämfört med enhetsgenomsnittet på 30.8 °C / ### class_avg_f### F.
(+) Handledsstöden och pekplattan är kallare än hudtemperaturen med maximalt 29.8 °C / 85.6 F och är därför svala att ta på.
(±) Medeltemperaturen för handledsstödsområdet på liknande enheter var 28.2 °C / 82.8 F (-1.6 °C / -2.8 F).
| MSI Prestige 13 AI Plus Evo A2VMG Intel Core Ultra 7 258V, Intel Arc Graphics 140V | MSI Prestige 13 AI Evo Intel Core Ultra 7 155H, Intel Arc 8-Core iGPU | Dell XPS 13 9350 Intel Core Ultra 7 256V, Intel Arc Graphics 140V | Framework Laptop 13.5 Core Ultra 7 155H Intel Core Ultra 7 155H, Intel Arc 8-Core iGPU | Lenovo Yoga Book 9 13IMU9 Intel Core Ultra 7 155U, Intel Graphics 4-Core iGPU (Meteor / Arrow Lake) | HP Dragonfly G4 Intel Core i7-1365U, Intel Iris Xe Graphics G7 96EUs | |
|---|---|---|---|---|---|---|
| Heat | 3% | 8% | -6% | -9% | -2% | |
| Maximum Upper Side * (°C) | 43.4 | 40.9 6% | 34.8 20% | 42.8 1% | 39.2 10% | 38.6 11% |
| Maximum Bottom * (°C) | 42.4 | 40.4 5% | 37.4 12% | 45.2 -7% | 41 3% | 40.4 5% |
| Idle Upper Side * (°C) | 25.4 | 25 2% | 25.4 -0% | 27.2 -7% | 32.2 -27% | 28.2 -11% |
| Idle Bottom * (°C) | 25.6 | 25.5 -0% | 26.2 -2% | 28.6 -12% | 31.6 -23% | 29 -13% |
* ... mindre är bättre
Stresstest
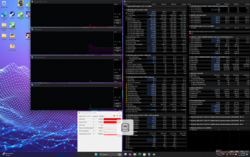
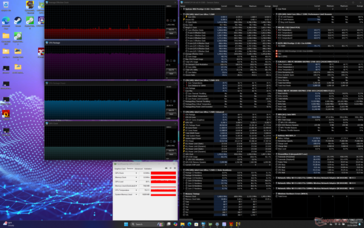
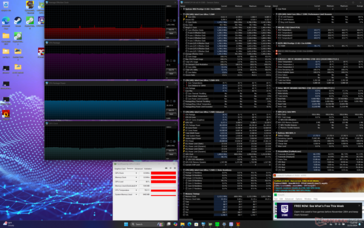
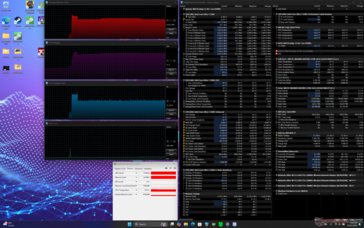
Under Prime95-stress ökar processorn till 3,6 GHz, 40 W och 82 C under cirka 30 sekunder. Därefter sjunker den snabbt och stabiliseras på 2,9 GHz och 27 W för att bibehålla en svalare kärntemperatur på 77 C. Om Cooler Boost är aktiverat sjunker kärntemperaturen något medan klockfrekvensen förblir nästan densamma.
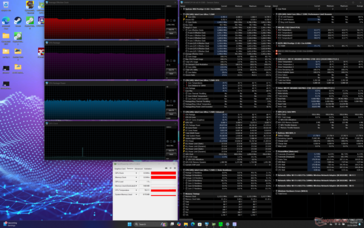
Vid gaming stabiliseras kärntemperaturen på 75 C jämfört med 71 C på Dell XPS 13 med en liknande Lunar Lake-processor.
| Genomsnittlig CPU-klocka (GHz) | GPU-klocka (MHz) | Genomsnittlig CPU-temperatur (°C) | |
| System i viloläge | -- | 400 | 32 |
| Prime95 Stress (Cooler Boost off) | 2.9 | -- | 77 |
| Prime95 Stress (Cooler Boost på) | 3.0 | -- | 75 |
| Prime95 + FurMark Stress | 1.6 | 1800 | 76 |
| Cyberpunk 2077 Stress | 1.5 | 1950 | 75 |
MSI Prestige 13 AI Plus Evo A2VMG ljudanalys
(+) | högtalare kan spela relativt högt (84.5 dB)
Bas 100 - 315 Hz
(-) | nästan ingen bas - i genomsnitt 19.4% lägre än medianen
(±) | linjäriteten för basen är genomsnittlig (9.6% delta till föregående frekvens)
Mellan 400 - 2000 Hz
(±) | högre mellan - i genomsnitt 6.4% högre än median
(+) | mids är linjära (5.1% delta till föregående frekvens)
Högsta 2 - 16 kHz
(±) | högre toppar - i genomsnitt 6.1% högre än medianen
(+) | toppar är linjära (4.6% delta till föregående frekvens)
Totalt 100 - 16 000 Hz
(±) | linjäriteten för det totala ljudet är genomsnittlig (18.2% skillnad mot median)
Jämfört med samma klass
» 51% av alla testade enheter i den här klassen var bättre, 7% liknande, 41% sämre
» Den bästa hade ett delta på 5%, genomsnittet var 18%, sämst var 53%
Jämfört med alla testade enheter
» 38% av alla testade enheter var bättre, 8% liknande, 54% sämre
» Den bästa hade ett delta på 4%, genomsnittet var 24%, sämst var 134%
Apple MacBook Pro 16 2021 M1 Pro ljudanalys
(+) | högtalare kan spela relativt högt (84.7 dB)
Bas 100 - 315 Hz
(+) | bra bas - bara 3.8% från medianen
(+) | basen är linjär (5.2% delta till föregående frekvens)
Mellan 400 - 2000 Hz
(+) | balanserad mellan - endast 1.3% från medianen
(+) | mids är linjära (2.1% delta till föregående frekvens)
Högsta 2 - 16 kHz
(+) | balanserade toppar - endast 1.9% från medianen
(+) | toppar är linjära (2.7% delta till föregående frekvens)
Totalt 100 - 16 000 Hz
(+) | det totala ljudet är linjärt (4.6% skillnad mot median)
Jämfört med samma klass
» 0% av alla testade enheter i den här klassen var bättre, 0% liknande, 100% sämre
» Den bästa hade ett delta på 5%, genomsnittet var 17%, sämst var 45%
Jämfört med alla testade enheter
» 0% av alla testade enheter var bättre, 0% liknande, 100% sämre
» Den bästa hade ett delta på 4%, genomsnittet var 24%, sämst var 134%
Energiförvaltning
Strömförbrukning
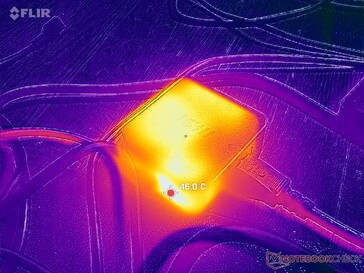
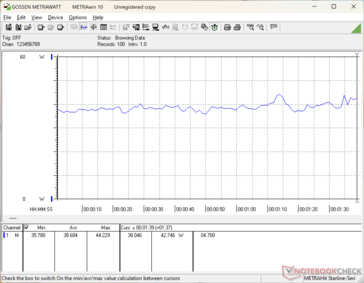
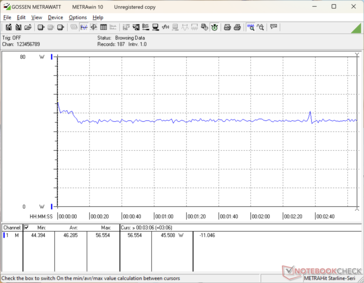
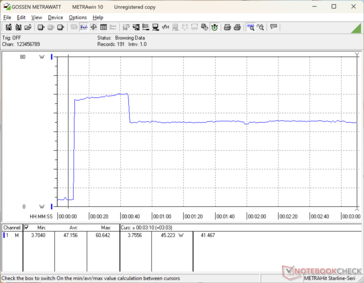
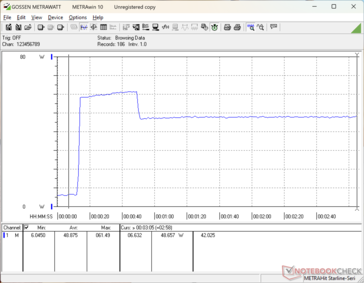
Systemet blir mer krävande än Core Ultra 7 155H-konfigurationen när man kör CPU-tunga uppgifter under längre perioder eftersom det inte stryps lika kraftigt. Förbrukningen är också högre med cirka 50 procent när du spelar, vilket stämmer överens med den mycket snabbare grafikprestandan.
| Av/Standby | |
| Låg belastning | |
| Hög belastning |
|
Förklaring:
min: | |
| MSI Prestige 13 AI Plus Evo A2VMG Core Ultra 7 258V, Arc 140V, , OLED, 2880x1800, 13.3" | MSI Prestige 13 AI Evo Ultra 7 155H, Arc 8-Core, Samsung PM9A1 MZVL21T0HCLR, OLED, 2880x1800, 13.3" | Dell XPS 13 9350 Core Ultra 7 256V, Arc 140V, Micron 2550 512GB, IPS, 1920x1200, 13.4" | Framework Laptop 13.5 Core Ultra 7 155H Ultra 7 155H, Arc 8-Core, , IPS, 2880x1920, 13.5" | Lenovo Yoga Book 9 13IMU9 Ultra 7 155U, Graphics 4-Core iGPU (Arrow Lake), , OLED, 2880x1800, 13.3" | HP Dragonfly G4 i7-1365U, Iris Xe G7 96EUs, Micron 3400 MTFDKBA512TFH 512GB, IPS, 1920x1280, 13.5" | |
|---|---|---|---|---|---|---|
| Power Consumption | -10% | 27% | 4% | -56% | -5% | |
| Idle Minimum * (Watt) | 3.5 | 4.5 -29% | 1.3 63% | 2.5 29% | 7.1 -103% | 4.1 -17% |
| Idle Average * (Watt) | 5.9 | 8 -36% | 2.5 58% | 5.2 12% | 9.1 -54% | 7.5 -27% |
| Idle Maximum * (Watt) | 10 | 8.7 13% | 4.1 59% | 5.8 42% | 18.4 -84% | 8.2 18% |
| Load Average * (Watt) | 38.7 | 36.1 7% | 40.1 -4% | 47.5 -23% | 51.3 -33% | 35.5 8% |
| Cyberpunk 2077 ultra external monitor * (Watt) | 45.6 | 43.1 5% | 52.4 -15% | |||
| Cyberpunk 2077 ultra * (Watt) | 46.3 | 46.1 -0% | 54.5 -18% | |||
| Load Maximum * (Watt) | 61.5 | 65 -6% | 57.3 7% | 61.5 -0% | 65.5 -7% | 66.5 -8% |
| Witcher 3 ultra * (Watt) | 29.7 | 41.5 | 37.5 |
* ... mindre är bättre
Power Consumption Cyberpunk / Stress Test
Power Consumption external Monitor
Batteritid
Körtiderna är nästan två timmar längre än för Core Ultra 7 155H-konfigurationen tack vare den effektivare Lunar Lake-processorn.
| MSI Prestige 13 AI Plus Evo A2VMG Core Ultra 7 258V, Arc 140V, 75 Wh | MSI Prestige 13 AI Evo Ultra 7 155H, Arc 8-Core, 75 Wh | Dell XPS 13 9350 Core Ultra 7 256V, Arc 140V, 55 Wh | Framework Laptop 13.5 Core Ultra 7 155H Ultra 7 155H, Arc 8-Core, 61 Wh | Lenovo Yoga Book 9 13IMU9 Ultra 7 155U, Graphics 4-Core iGPU (Arrow Lake), 80 Wh | HP Dragonfly G4 i7-1365U, Iris Xe G7 96EUs, 68 Wh | |
|---|---|---|---|---|---|---|
| Batteridrifttid | -13% | 54% | -22% | -25% | 19% | |
| WiFi v1.3 (h) | 13.4 | 11.6 -13% | 20.6 54% | 10.5 -22% | 10.1 -25% | 15.9 19% |
| H.264 (h) | 16.7 | |||||
| Load (h) | 2.8 | 2.4 | 1.5 | 3.2 | ||
| Reader / Idle (h) | 56.8 | 38.3 | 42.5 |
Notebookcheck Betyg
MSI Prestige 13 AI Plus Evo A2VMG
- 11/26/2024 v8
Allen Ngo
Genomskinlighet
Valet av enheter som ska granskas görs av vår redaktion. Testprovet gavs till författaren som ett lån av tillverkaren eller återförsäljaren för denna recension. Långivaren hade inget inflytande på denna recension och inte heller fick tillverkaren en kopia av denna recension innan publiceringen. Det fanns ingen skyldighet att publicera denna recension. Som ett oberoende medieföretag är Notebookcheck inte föremål för auktoritet från tillverkare, återförsäljare eller förlag.
This is how Notebookcheck is testingEvery year, Notebookcheck independently reviews hundreds of laptops and smartphones using standardized procedures to ensure that all results are comparable. We have continuously developed our test methods for around 20 years and set industry standards in the process. In our test labs, high-quality measuring equipment is utilized by experienced technicians and editors. These tests involve a multi-stage validation process. Our complex rating system is based on hundreds of well-founded measurements and benchmarks, which maintains objectivity.












 Total Sustainability Score:
