MSI Prestige 13 AI Evo laptop recension - Core Ultra 7 och OLED väger under 1 kg
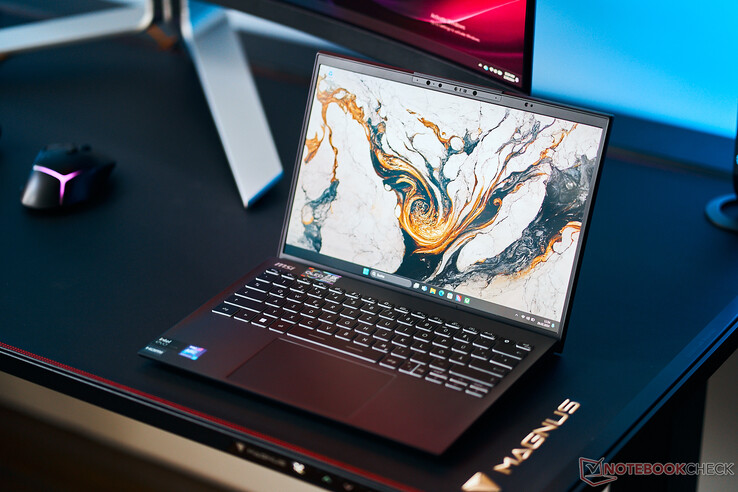
MSI Prestige 13 AI Evo är en kompakt subnotebook som väger mindre än 1 kilo. Den nya 2024-modellen har fått en Meteor Lake-processor från Intel samt en Wi-Fi 7-modul. Vår testenhet är varianten med Core Ultra 7 155H, Intel Arc Graphics, 32 GB RAM, en 1-TB SSD och en 2,8K OLED-skärm för cirka 1 300 USD.
Potentiella konkurrenter i jämförelse
Gradering | Datum | Modell | Vikt | Höjd | Storlek | Upplösning | Pris |
|---|---|---|---|---|---|---|---|
| 86.6 % v7 (old) | 03/2024 | MSI Prestige 13 AI Evo Ultra 7 155H, Arc 8-Core | 967 g | 16.9 mm | 13.30" | 2880x1800 | |
| 89.5 % v7 (old) | 08/2023 | Lenovo ThinkPad X1 Nano Gen 3 i7-1360P, Iris Xe G7 96EUs | 989 g | 14.8 mm | 13.00" | 2160x1350 | |
| 90.2 % v7 (old) | 10/2023 | Dell Latitude 13 7340 i5-1345U i5-1345U, Iris Xe G7 80EUs | 1.1 kg | 18.2 mm | 13.30" | 1920x1200 | |
| 91.9 % v7 (old) | 07/2023 | HP Dragonfly G4 i7-1365U, Iris Xe G7 96EUs | 1.1 kg | 16.3 mm | 13.50" | 1920x1280 | |
| 85.4 % v7 (old) | 05/2023 | Asus ZenBook S13 OLED UX5304 i7-1355U, Iris Xe G7 96EUs | 1 kg | 11.8 mm | 13.30" | 2880x1800 |
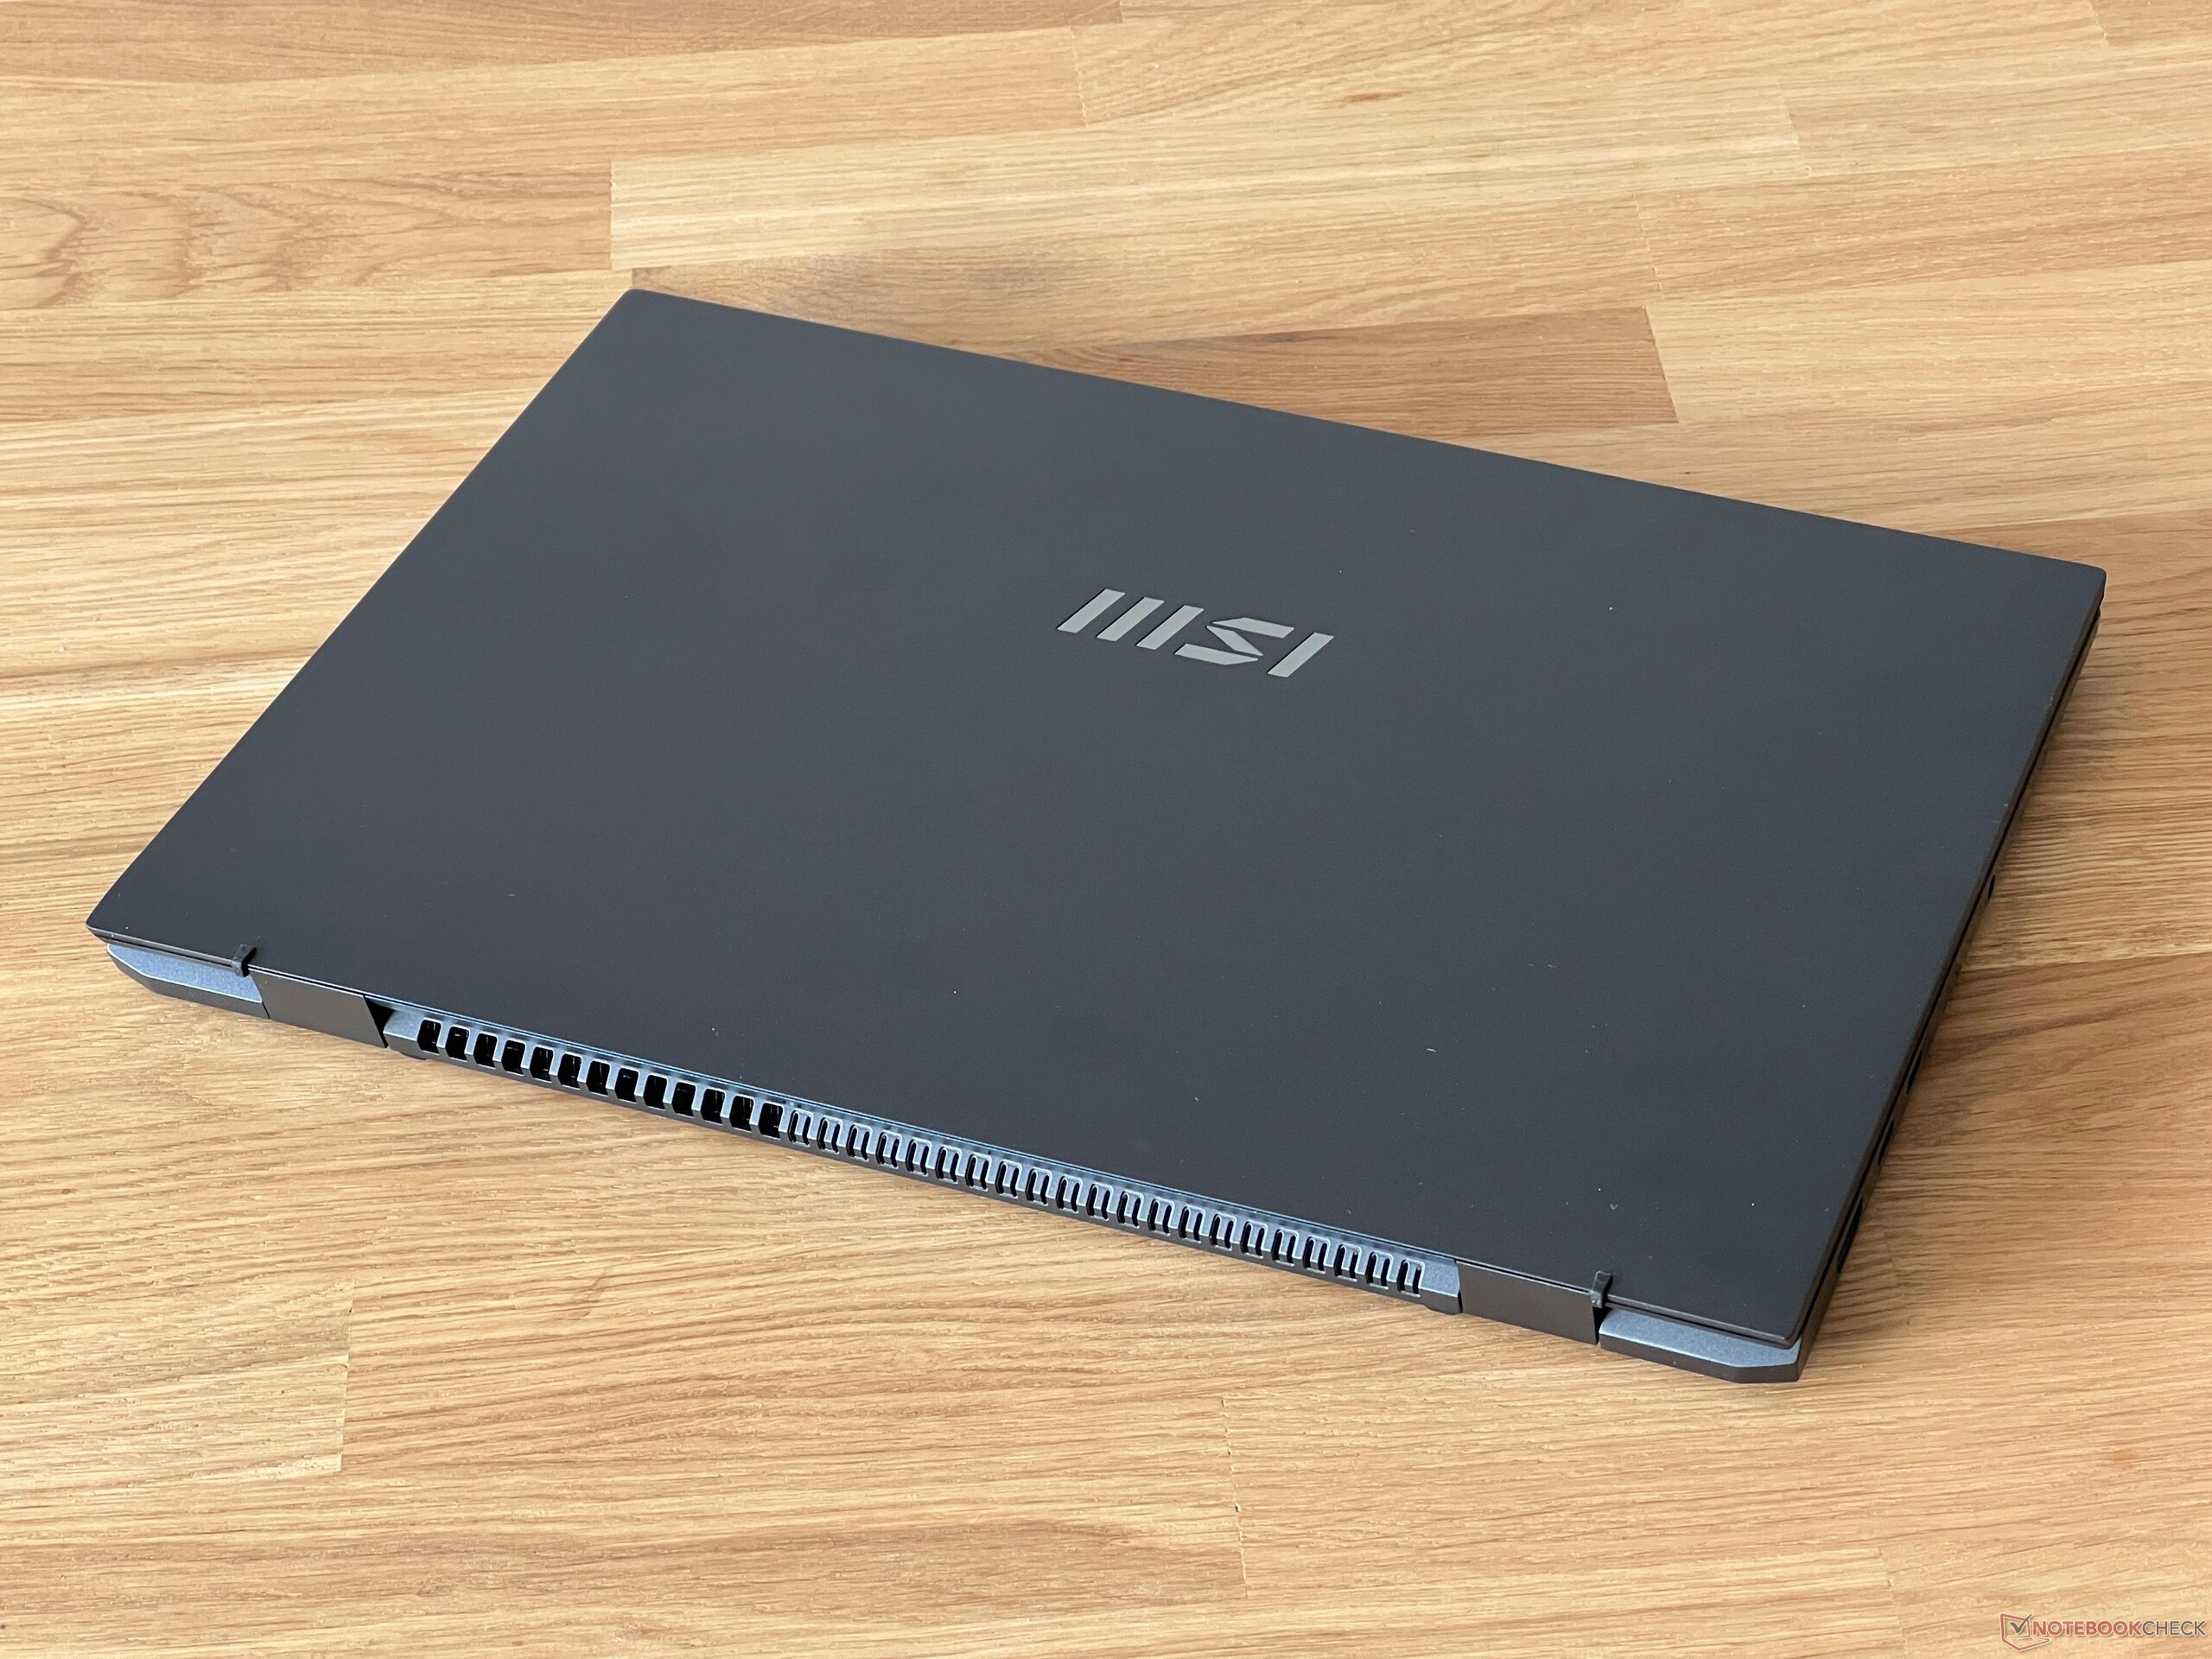
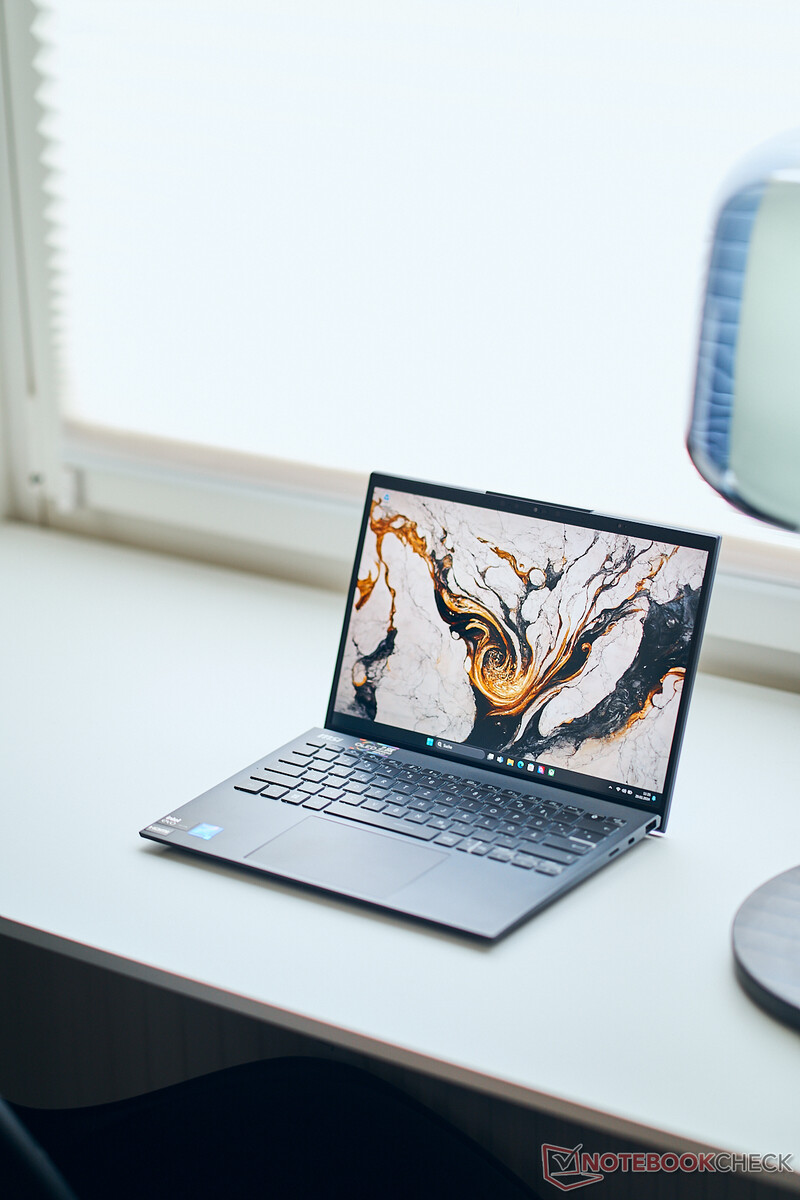
Fodral - Prestige 13 har ett fodral i magnesiumlegering
MSI erbjuder Prestige 13 antingen i mörkgrått (Stellar Gray) - samma som vår testenhet - eller alternativt i vitt (Pure White). Båda versionerna använder en magnesium-aluminiumlegering, vilket förmodligen också bidrar till enhetens låga vikt på 976 gram. När du först kommer i kontakt med den bärbara datorn blir du omedelbart förvånad över hur lätt den verkligen är. Ytorna känns högkvalitativa och även på den mörka modellen verkar fingeravtrycksmärken inte vara ett alltför stort problem. Bortsett från MSI-logotypen har Prestige 13 inga ytterligare designelement. Ramarna är ganska smala på båda sidor men ramen längs den övre kanten är ganska bred på grund av den installerade webbkameran.
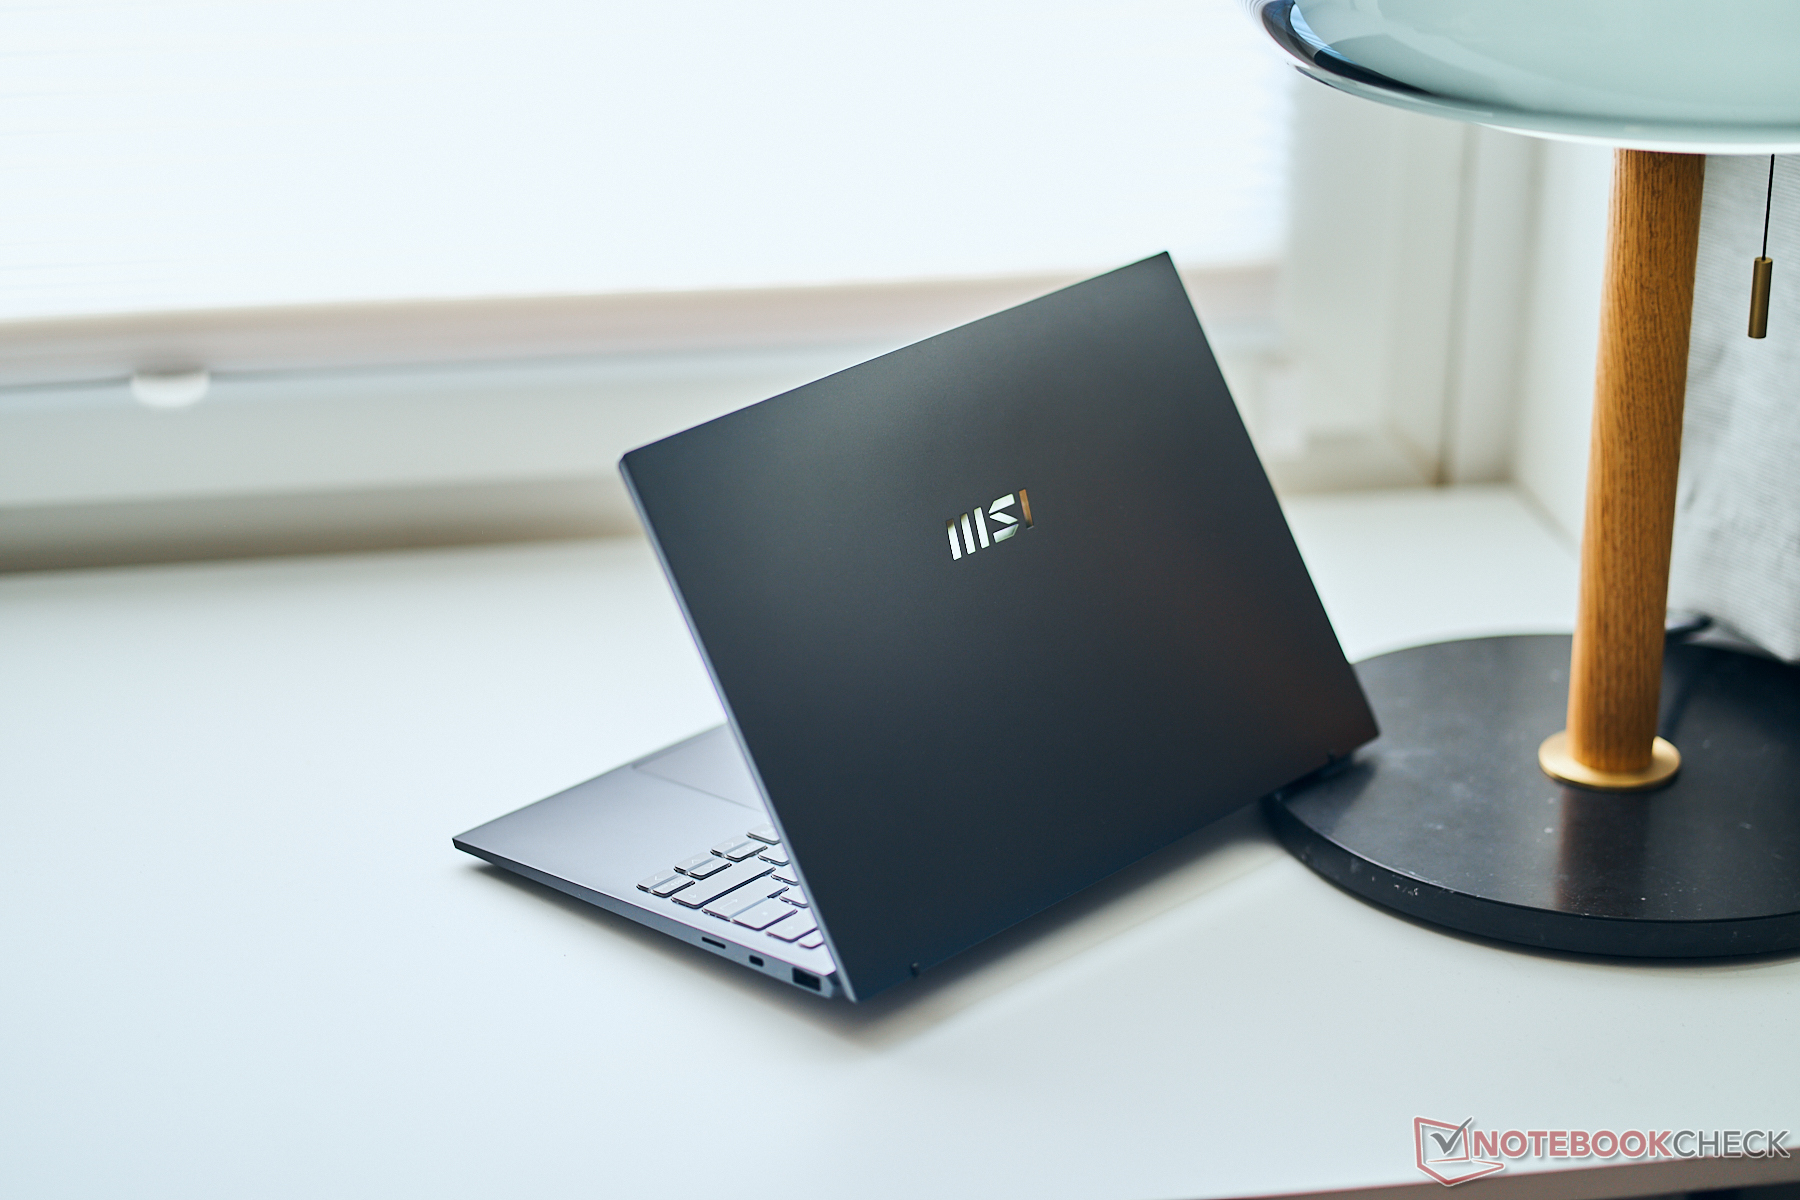
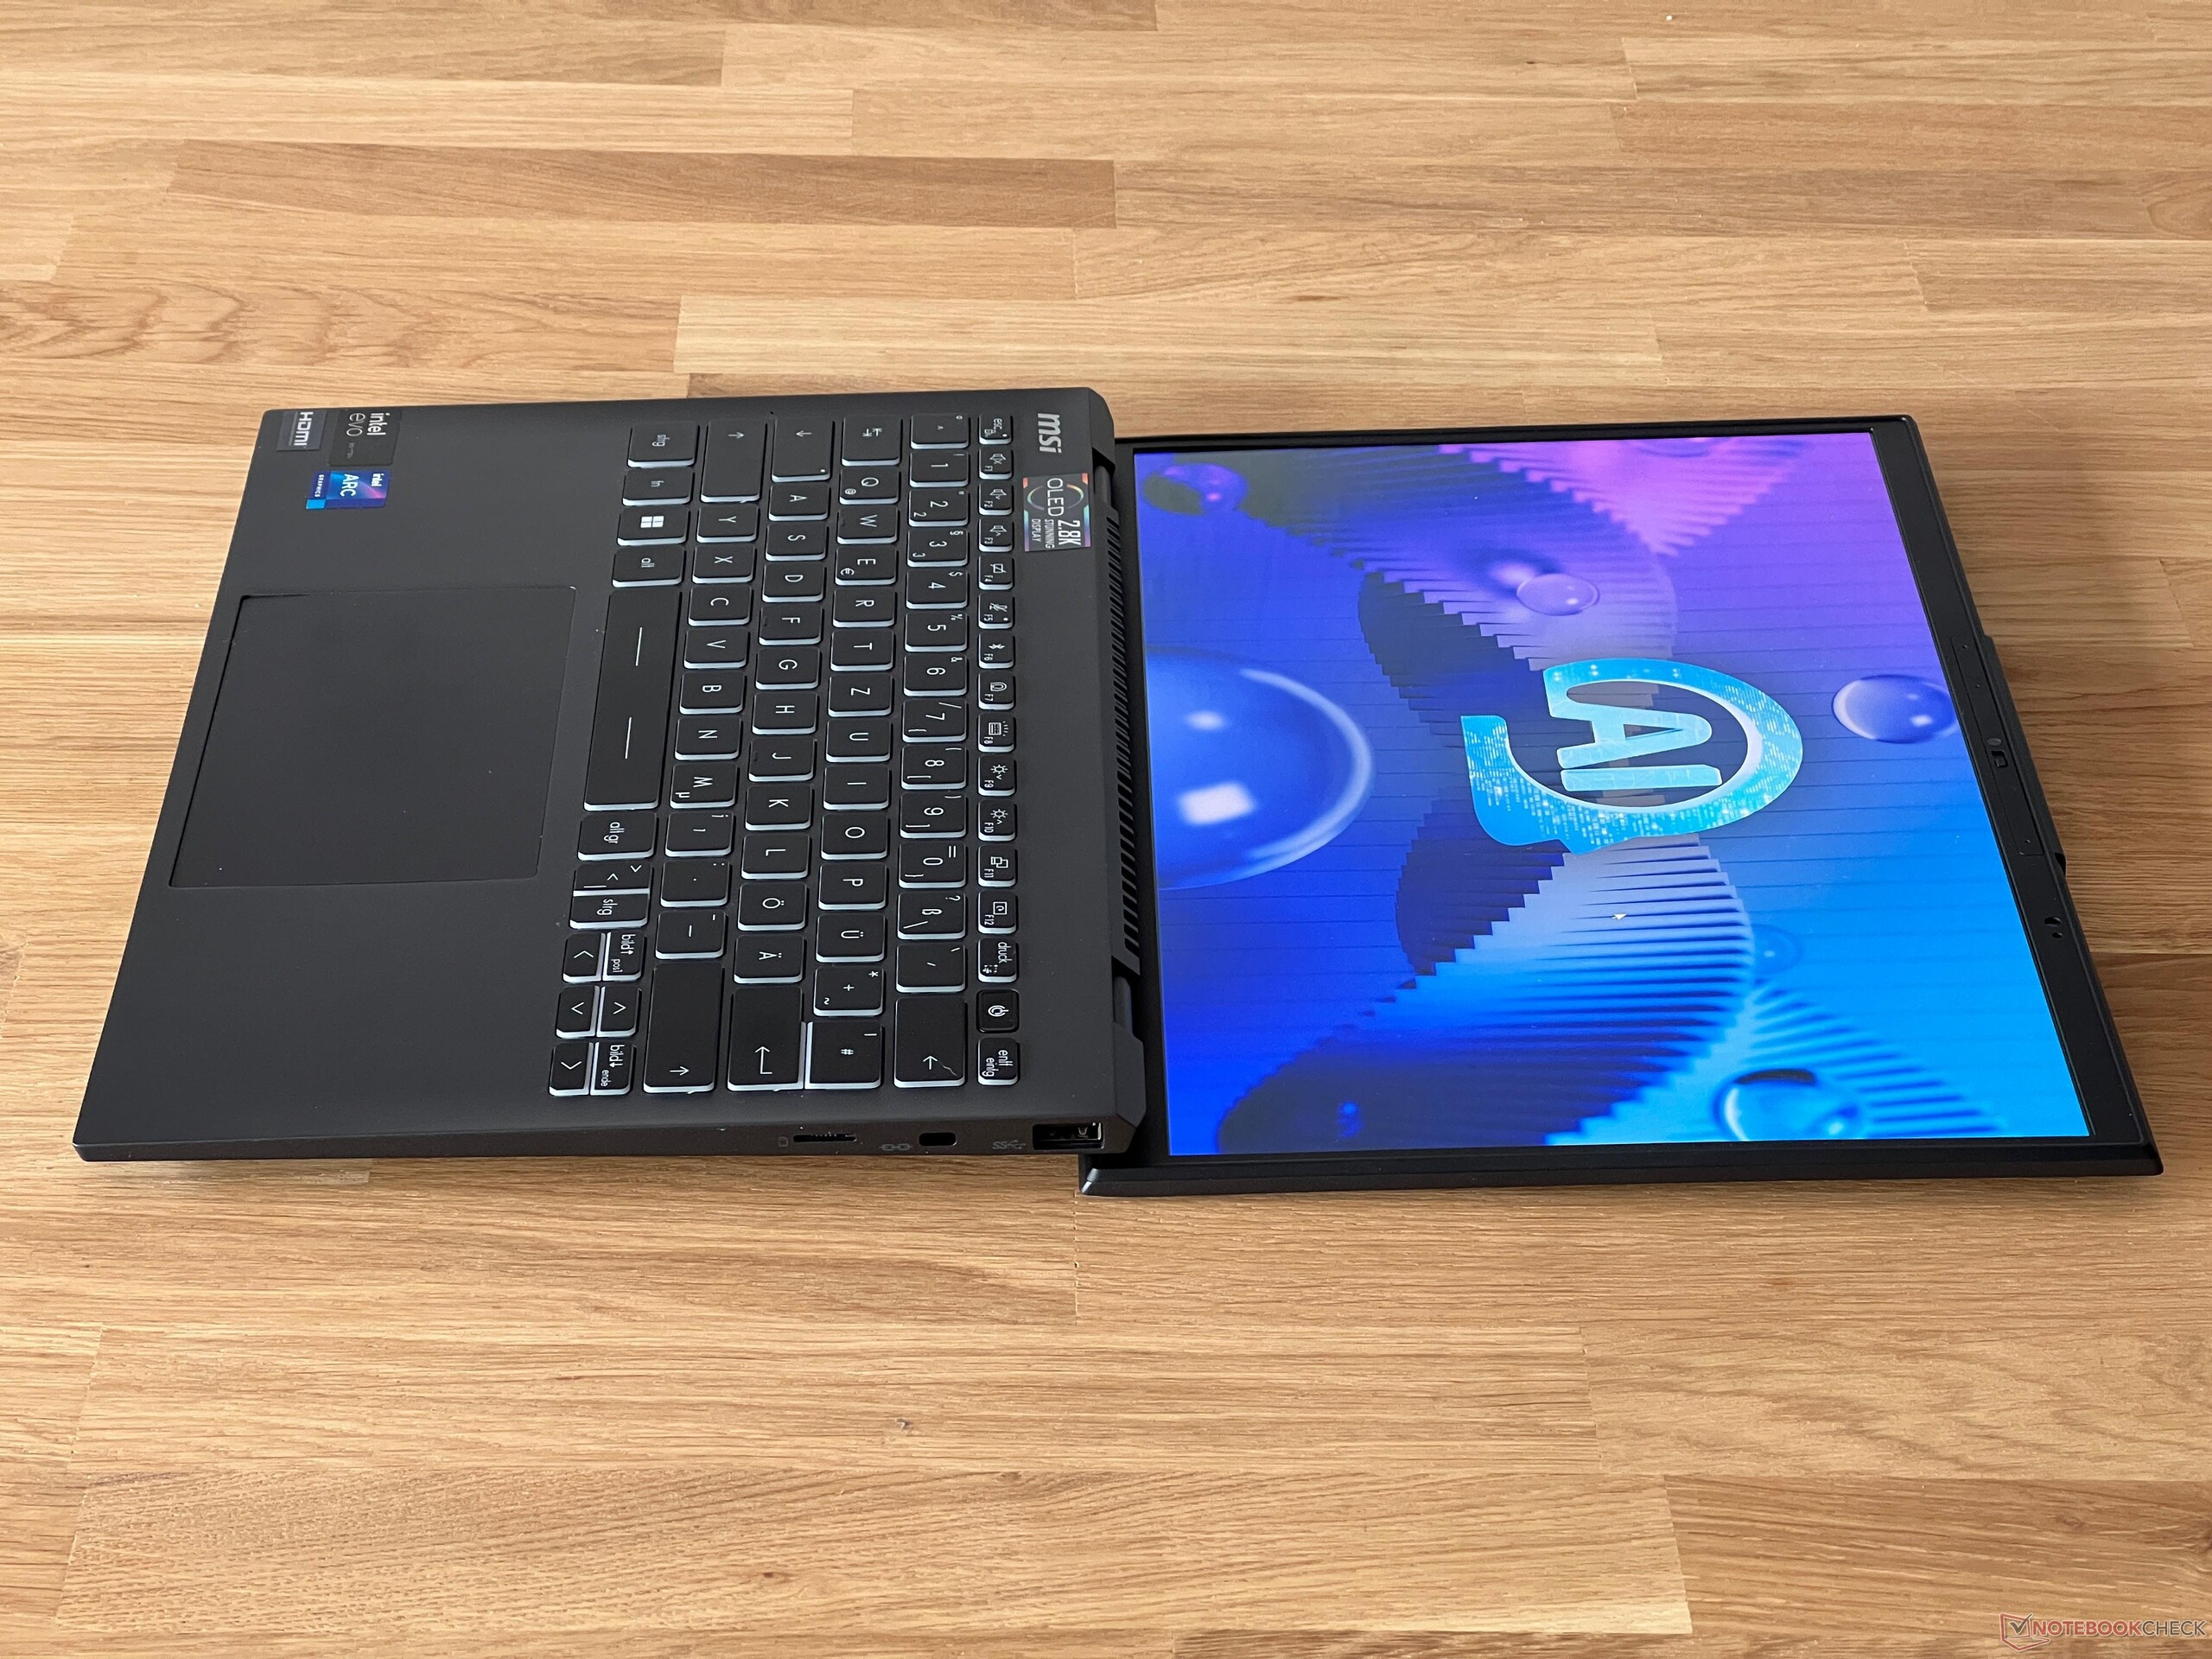
Den är välkonstruerad, men lider av vissa stabilitetsproblem. Den bakre delen av basenheten lyfts något när du öppnar locket och den mellersta delen av tangentbordet kan vridas inåt med lite tryck. När du skriver normalt bör detta dock inte vara ett alltför stort problem. Om du vrider basenheten något, gör den bärbara datorn märkbara knakande ljud. Skärmens gångjärn sitter mycket tätt och förhindrar effektivt att locket vinglar - det gör det bara lite svårt att öppna med en hand. Den maximala öppningsvinkeln är 180 grader och själva locket är mycket stabilt.
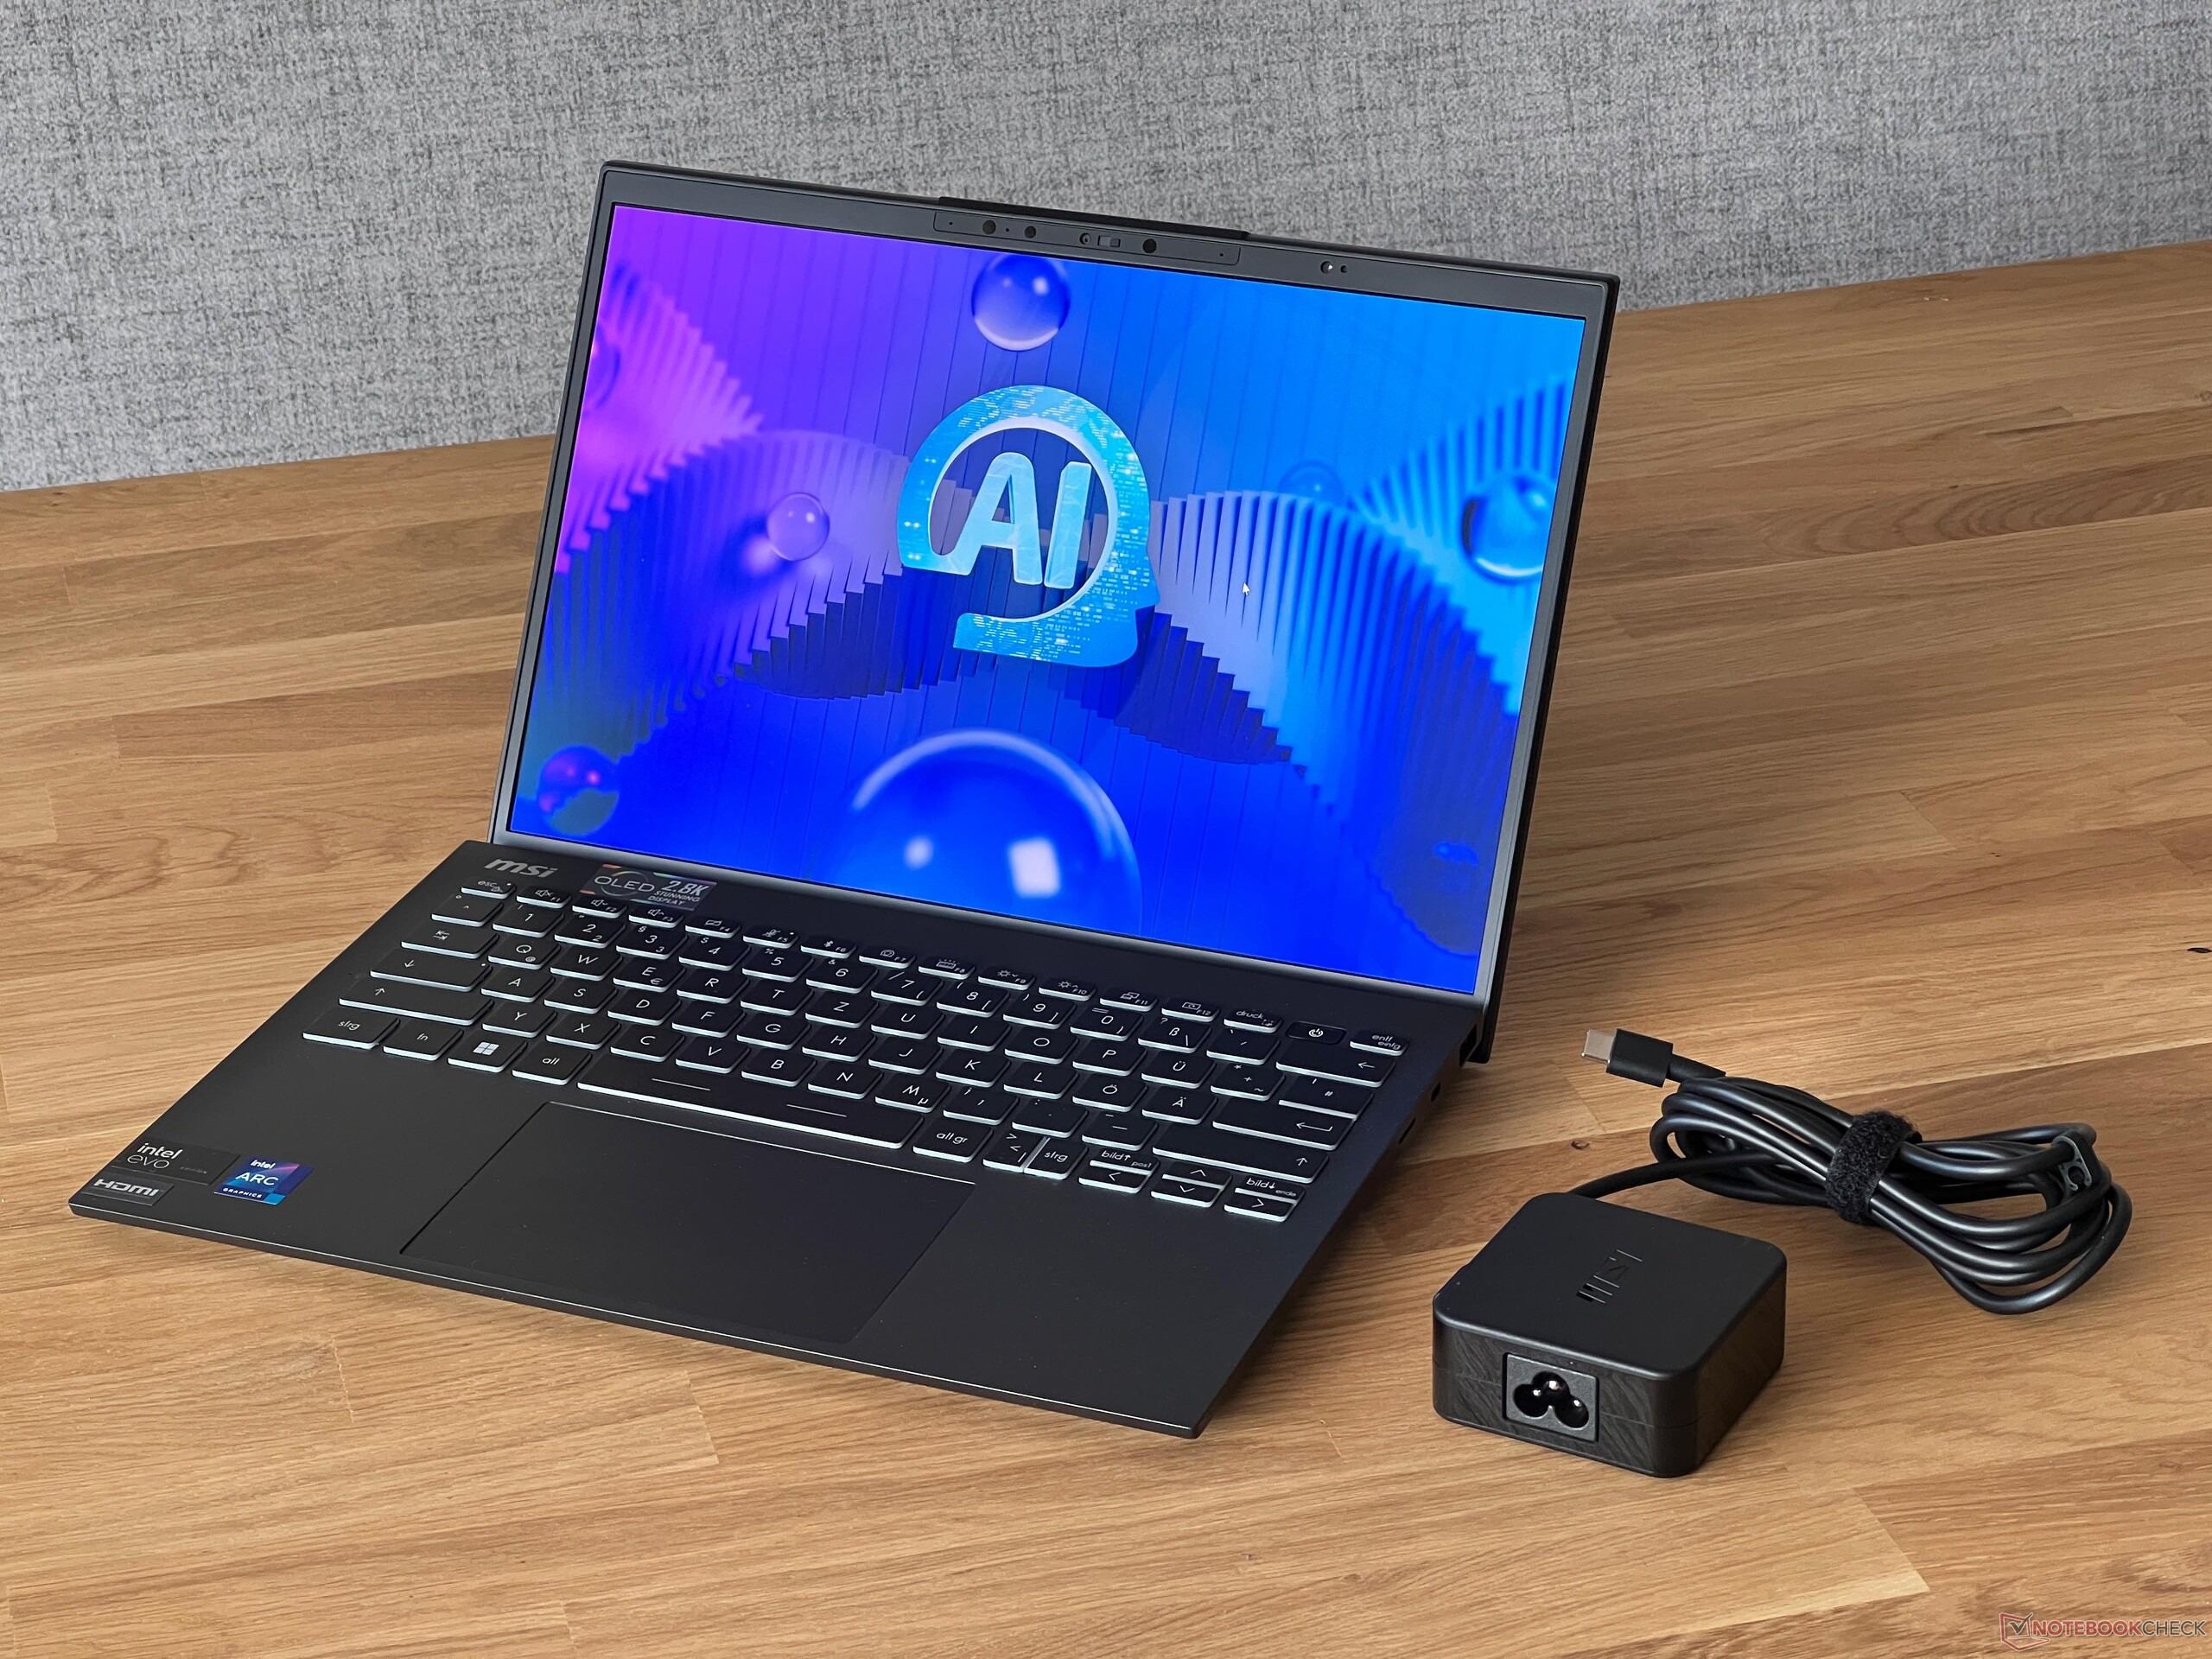
Med en vikt på under 1 kg är Prestige 13 extremt lätt, men samma sak gäller för de andra jämförelseenheterna. När det gäller fotavtryck tar konkurrenterna inte heller mycket plats. Prestige kan enkelt förvaras i vilken väska som helst. MSI använder sig av en kompakt 65-watts strömförsörjning, men det är inte en plug-in-strömförsörjning, vilket är anledningen till att den är ganska tung på 341 gram.
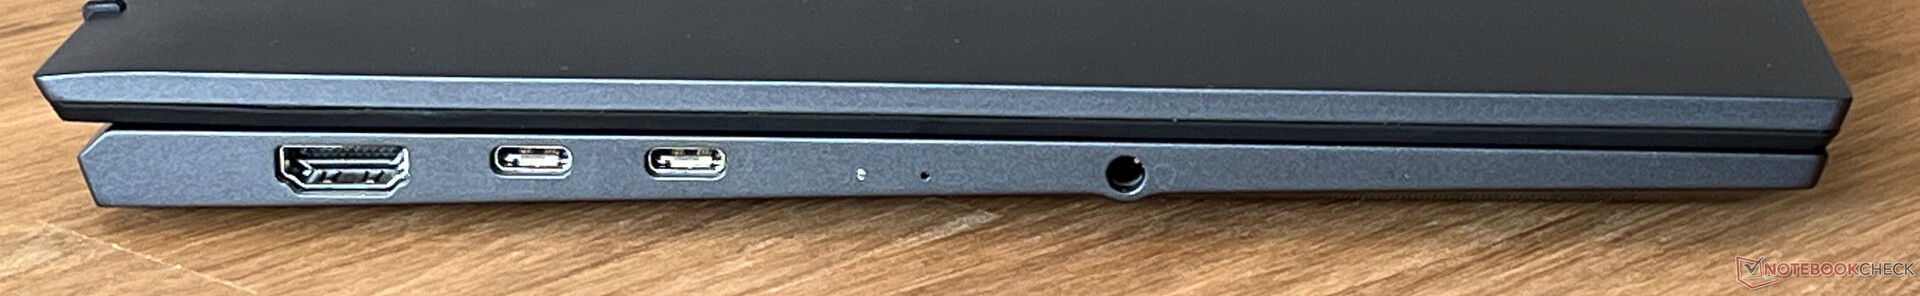
Anslutningsmöjligheter - MSI med Thunderbolt 4 och HDMI 2.1
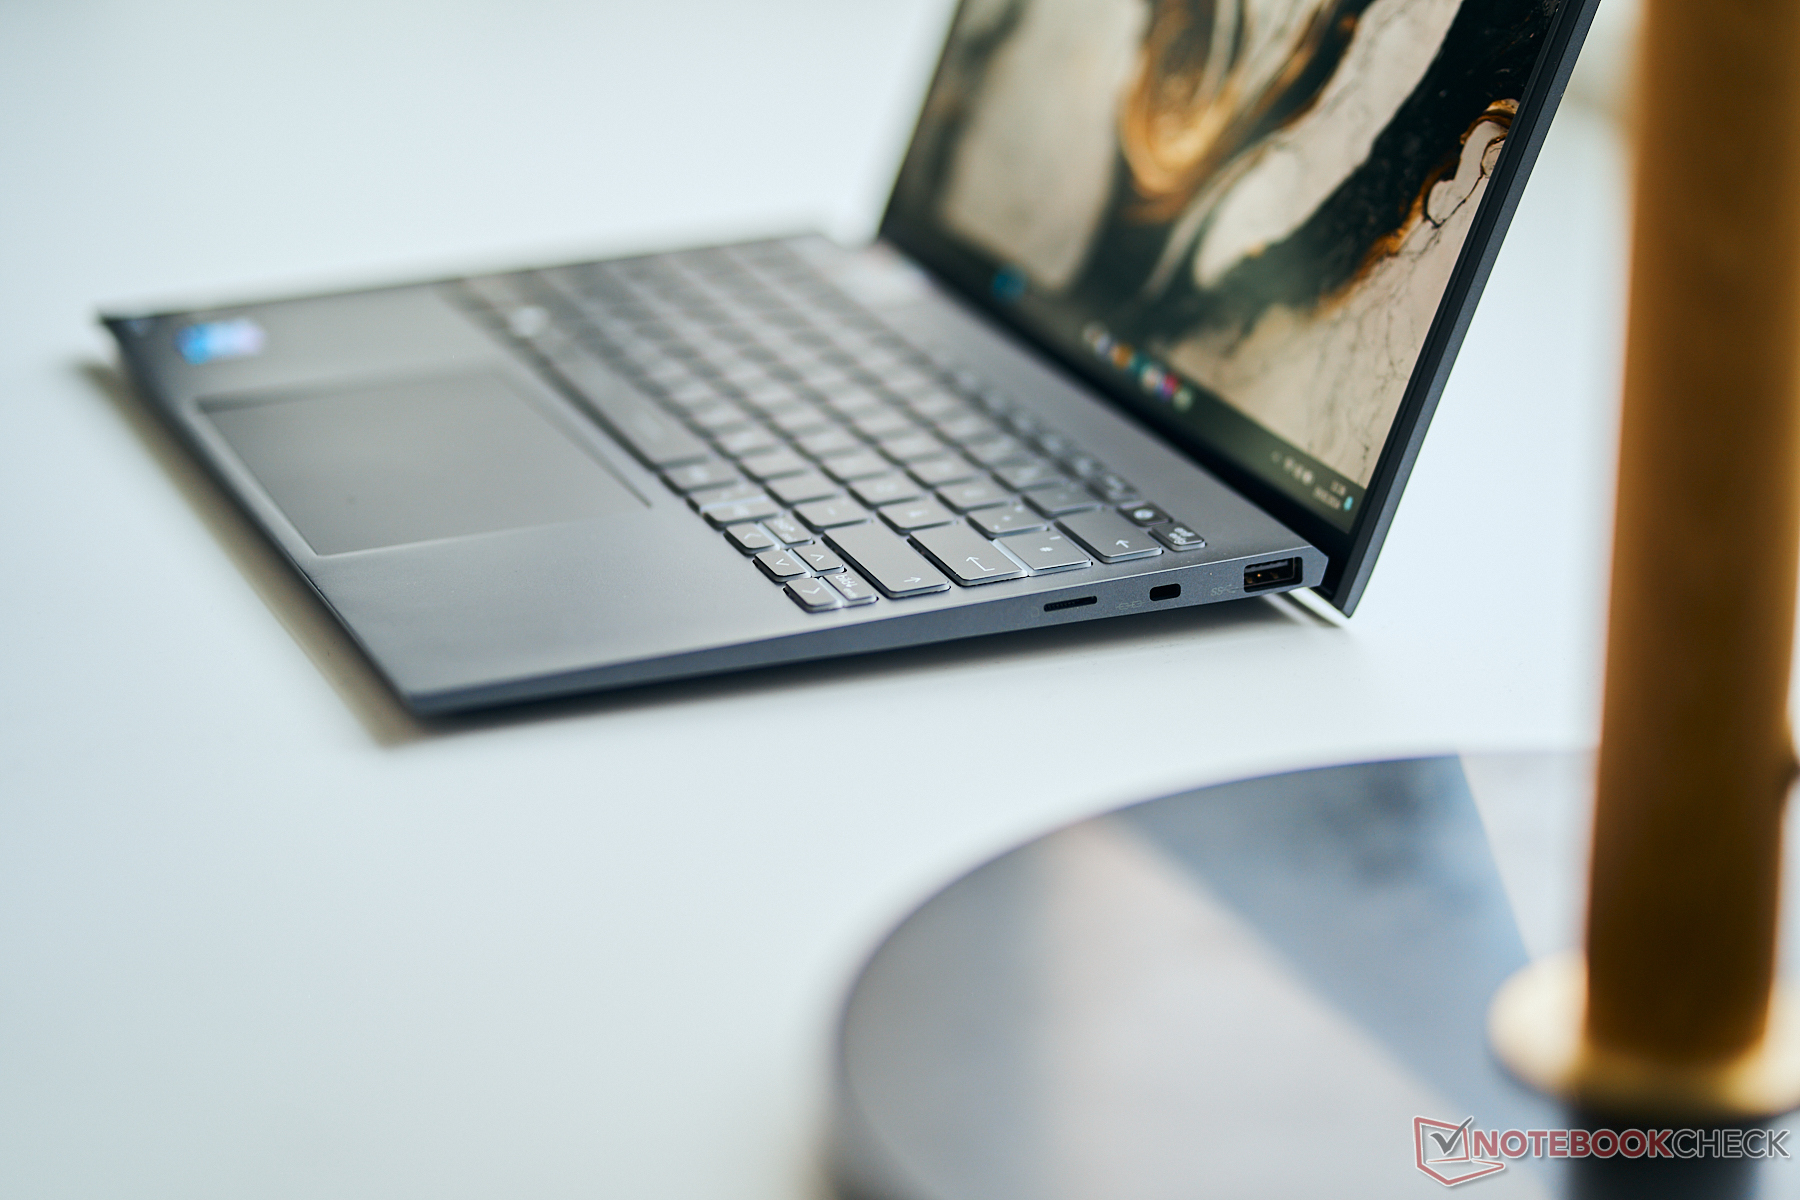
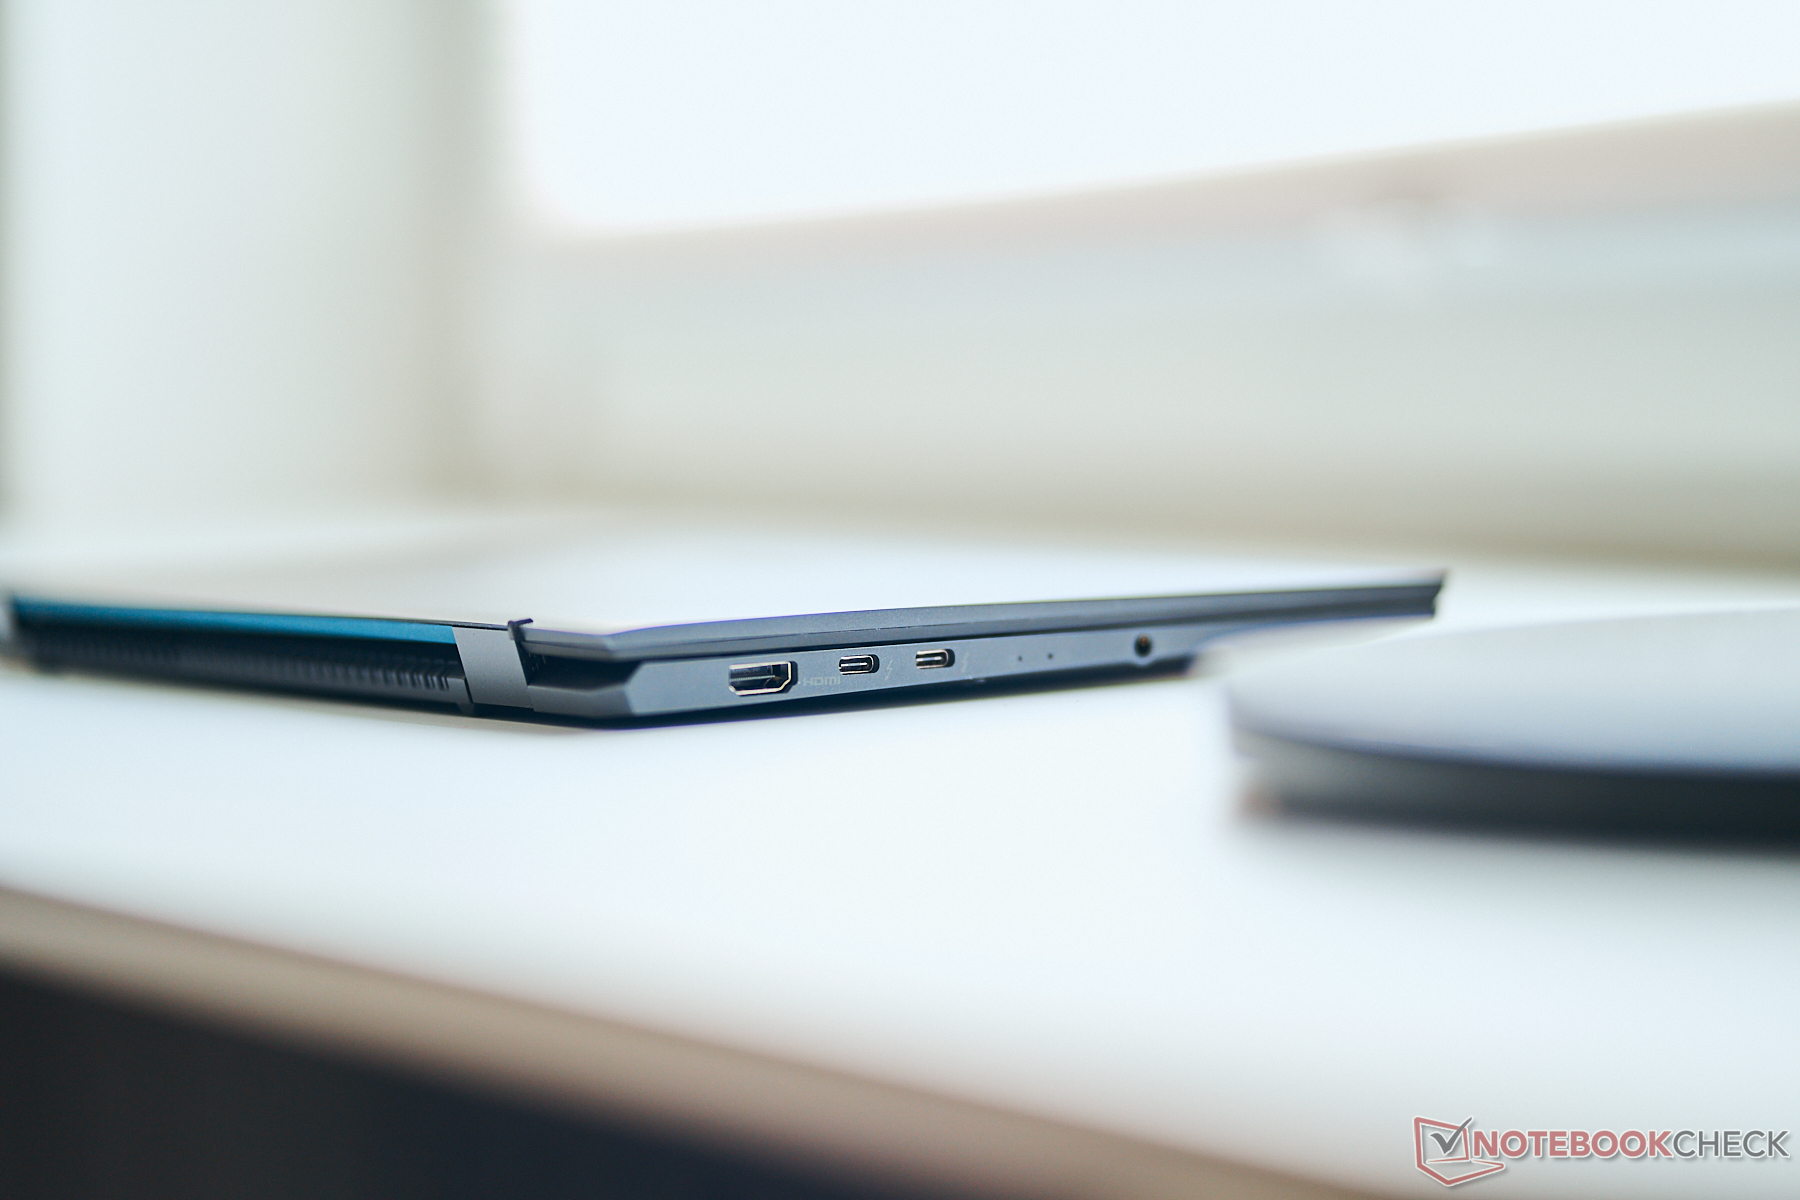
Prestige 13 må vara kompakt, men den har fortfarande alla viktiga anslutningar, inklusive USB-C, USB-A och en fullfjädrad HDMI-utgång. Vi gillar också hur portarna är utspridda över den bärbara datorn och har inte mycket att kritisera.
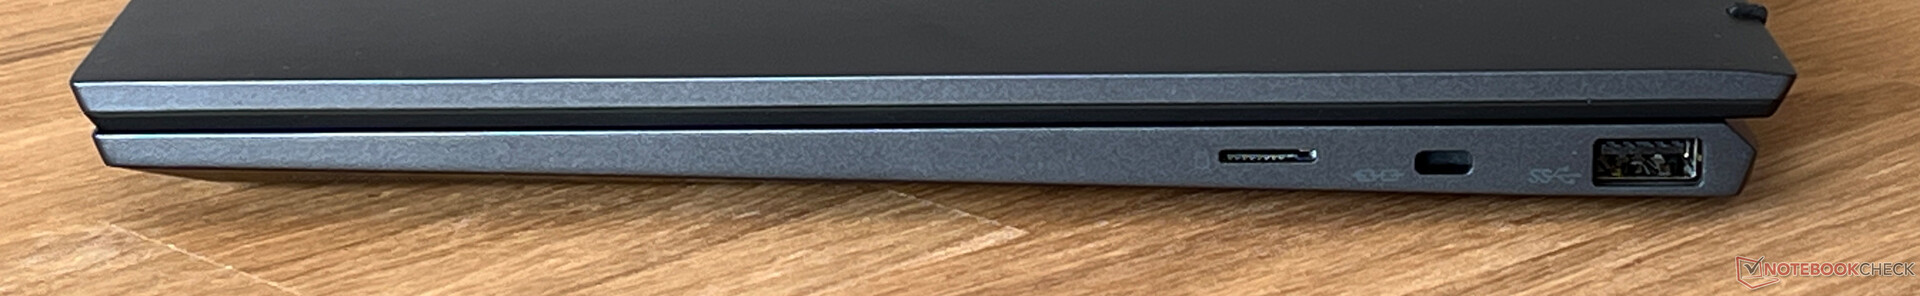
SD-kortläsare
På enhetens högra sida finns en microSD-kortläsare (fjädermekanism) som, i kombination med vårt referenskort (Angelbird AV Pro V60), uppnådde mycket bra överföringshastigheter. Vid kopiering av bilder noterade vi ett genomsnitt på över 140 MB/s och ett maximum på över 200 MB/s. Ingen av de andra jämförelseenheterna har en kortläsare.
| SD Card Reader | |
| average JPG Copy Test (av. of 3 runs) | |
| MSI Prestige 13 AI Evo (Angelbird AV Pro V60) | |
| Genomsnitt av klass Subnotebook (23.7 - 188, n=9, senaste 2 åren) | |
| maximum AS SSD Seq Read Test (1GB) | |
| MSI Prestige 13 AI Evo (Angelbird AV Pro V60) | |
| Genomsnitt av klass Subnotebook (24.9 - 195, n=8, senaste 2 åren) | |
Kommunikation
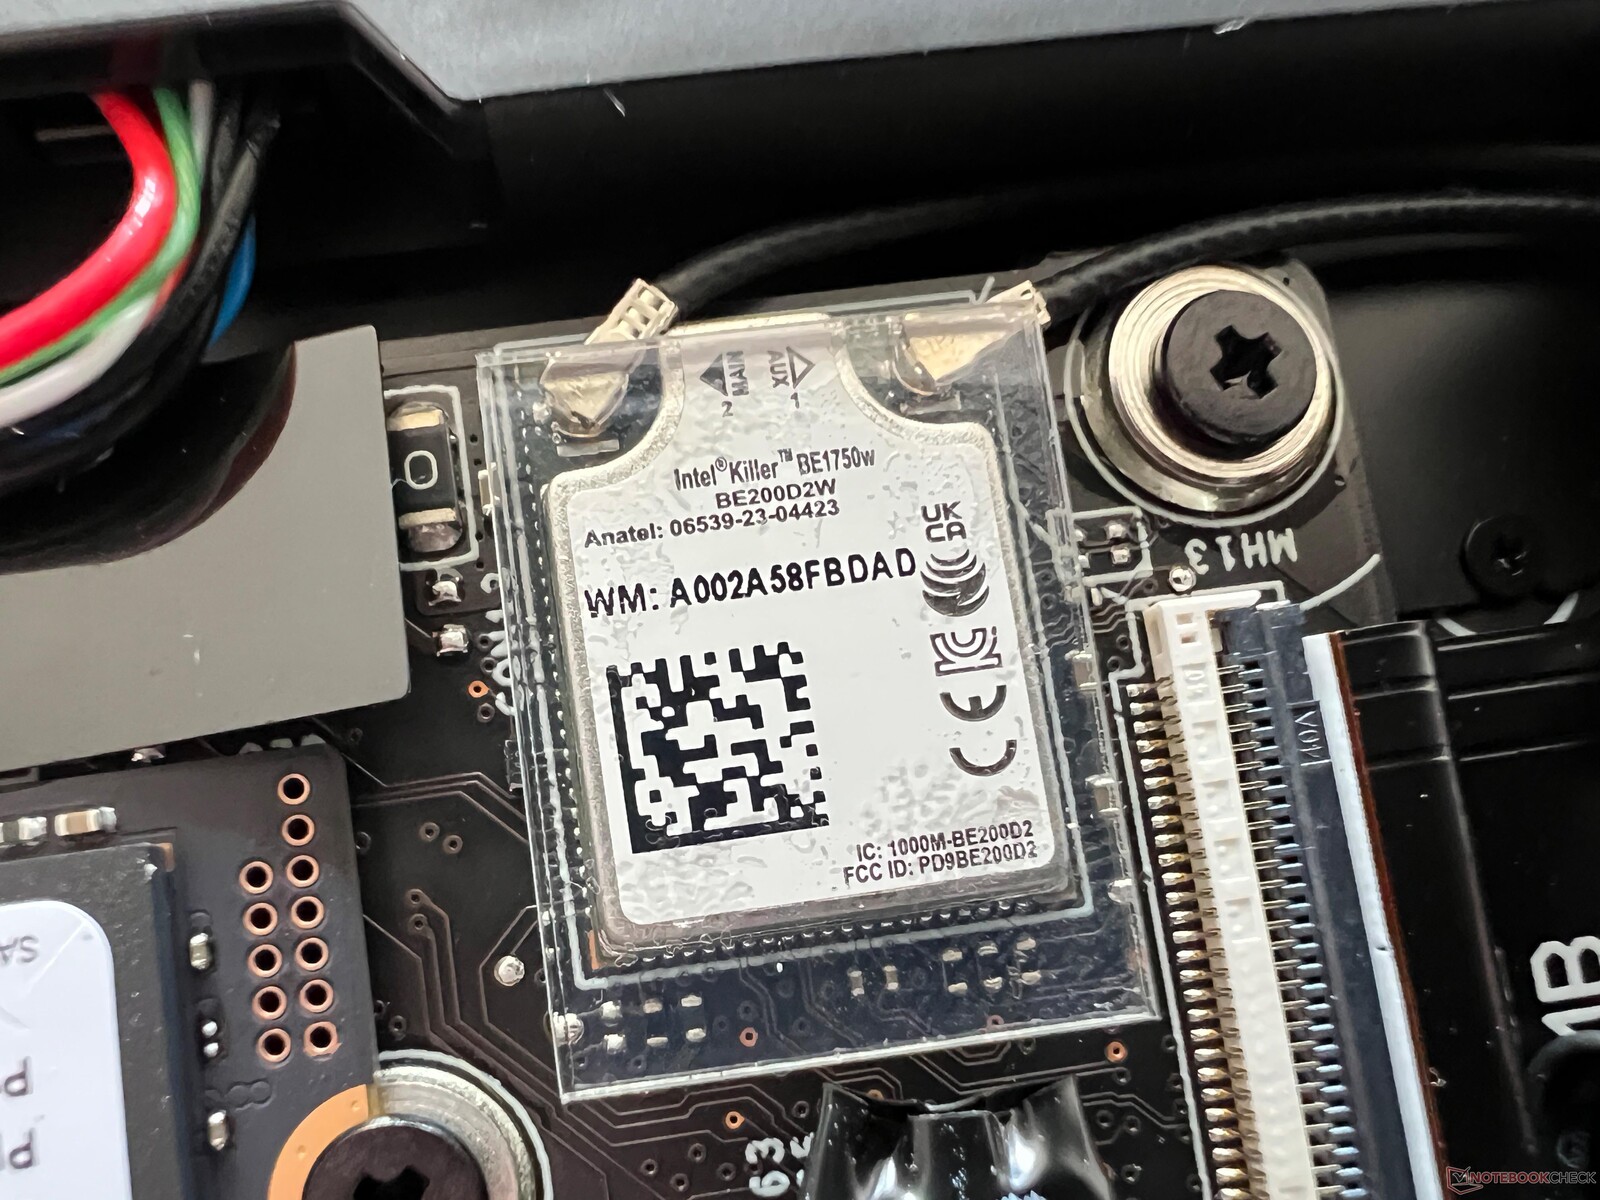
MSI har installerat den nya BE1750W (320 MHz) Wi-Fi 7-modulen från Intel i den bärbara datorn. Tyvärr kan vi ännu inte använda den nya standarden med vår nuvarande referensrouter. Överföringshastigheterna via Wi-Fi 6 var dock mycket stabila och höga.
| Networking | |
| MSI Prestige 13 AI Evo | |
| iperf3 transmit AXE11000 | |
| iperf3 receive AXE11000 | |
| Lenovo ThinkPad X1 Nano Gen 3 | |
| iperf3 transmit AXE11000 | |
| iperf3 receive AXE11000 | |
| iperf3 transmit AXE11000 6GHz | |
| iperf3 receive AXE11000 6GHz | |
| Dell Latitude 13 7340 i5-1345U | |
| iperf3 transmit AXE11000 | |
| iperf3 receive AXE11000 | |
| iperf3 transmit AXE11000 6GHz | |
| iperf3 receive AXE11000 6GHz | |
| HP Dragonfly G4 | |
| iperf3 transmit AXE11000 | |
| iperf3 receive AXE11000 | |
| iperf3 transmit AXE11000 6GHz | |
| iperf3 receive AXE11000 6GHz | |
| Asus ZenBook S13 OLED UX5304 | |
| iperf3 transmit AXE11000 | |
| iperf3 receive AXE11000 | |
Webbkamera
Webbkameran med 1080p ger hyfsad bildkvalitet i bra ljusförhållanden och den har inget mekaniskt skydd. Den har även stöd för Windows Studio-effekter (mjuk bakgrund, ögonkontakt, spårning). Dessutom har den en IR-kamera installerad för ansiktsigenkänning via Windows Hello.


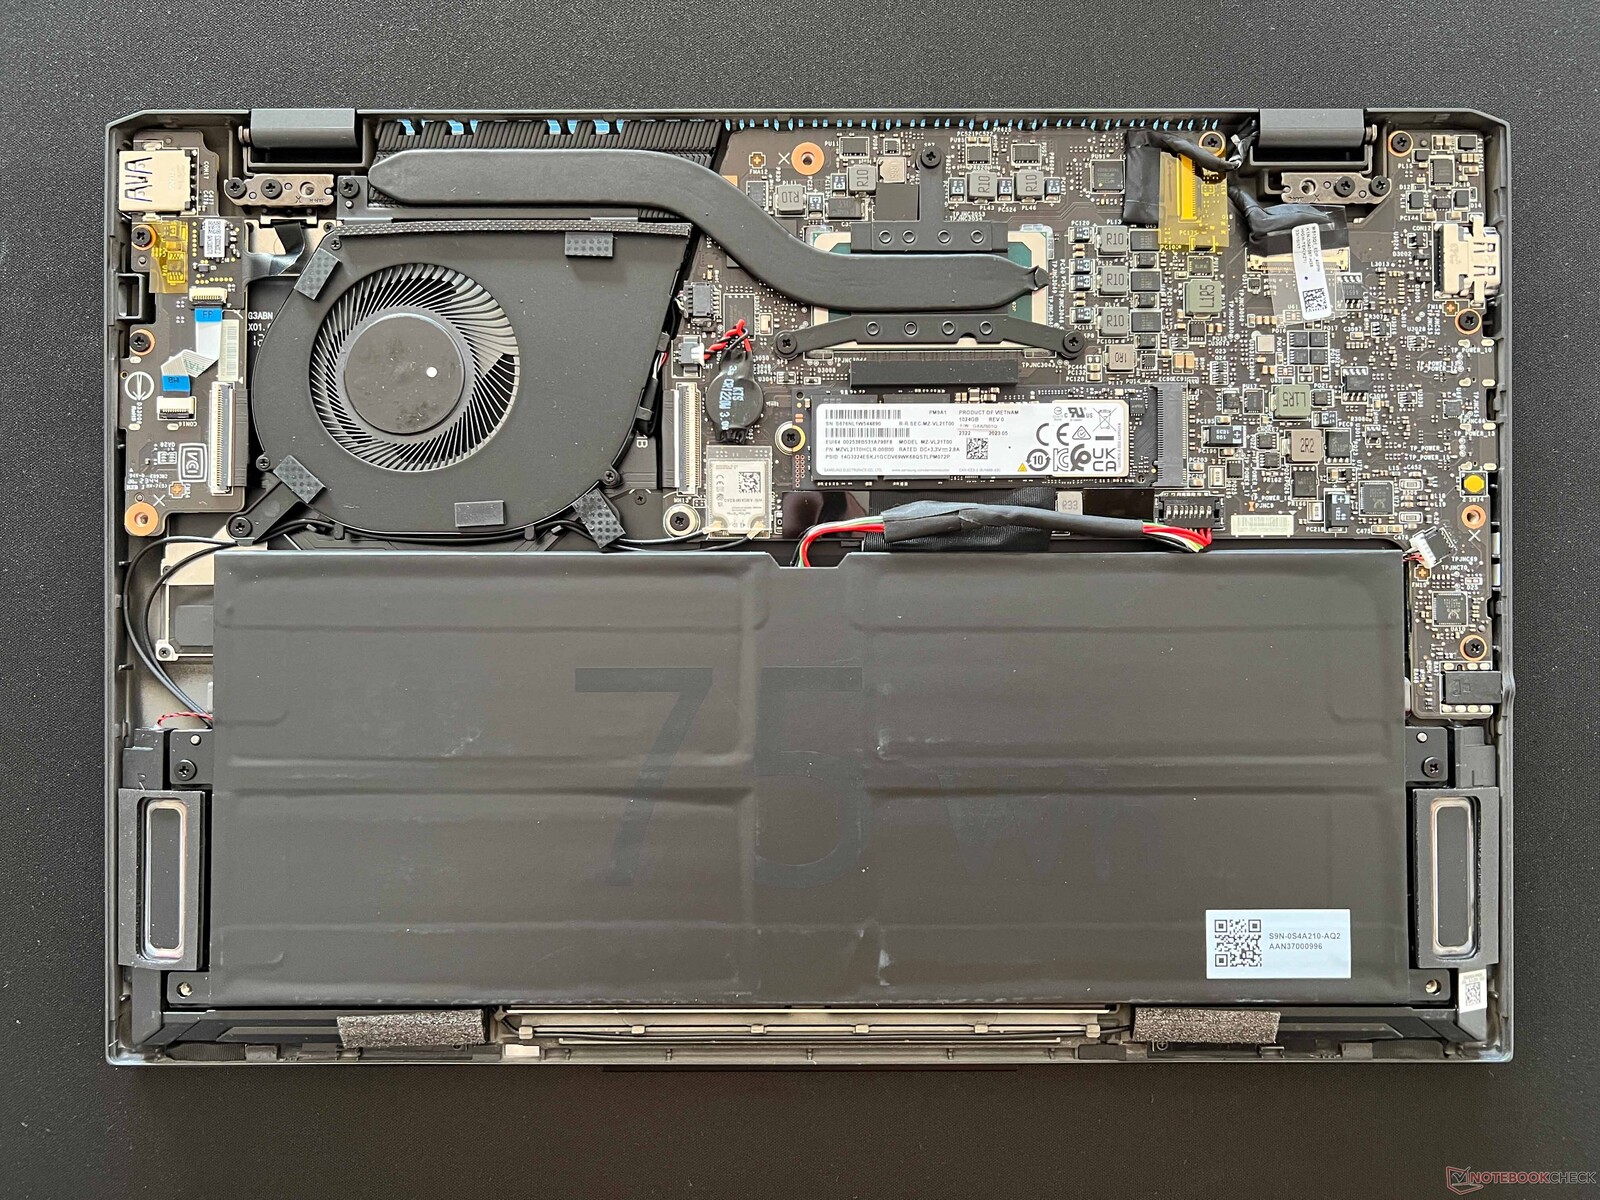
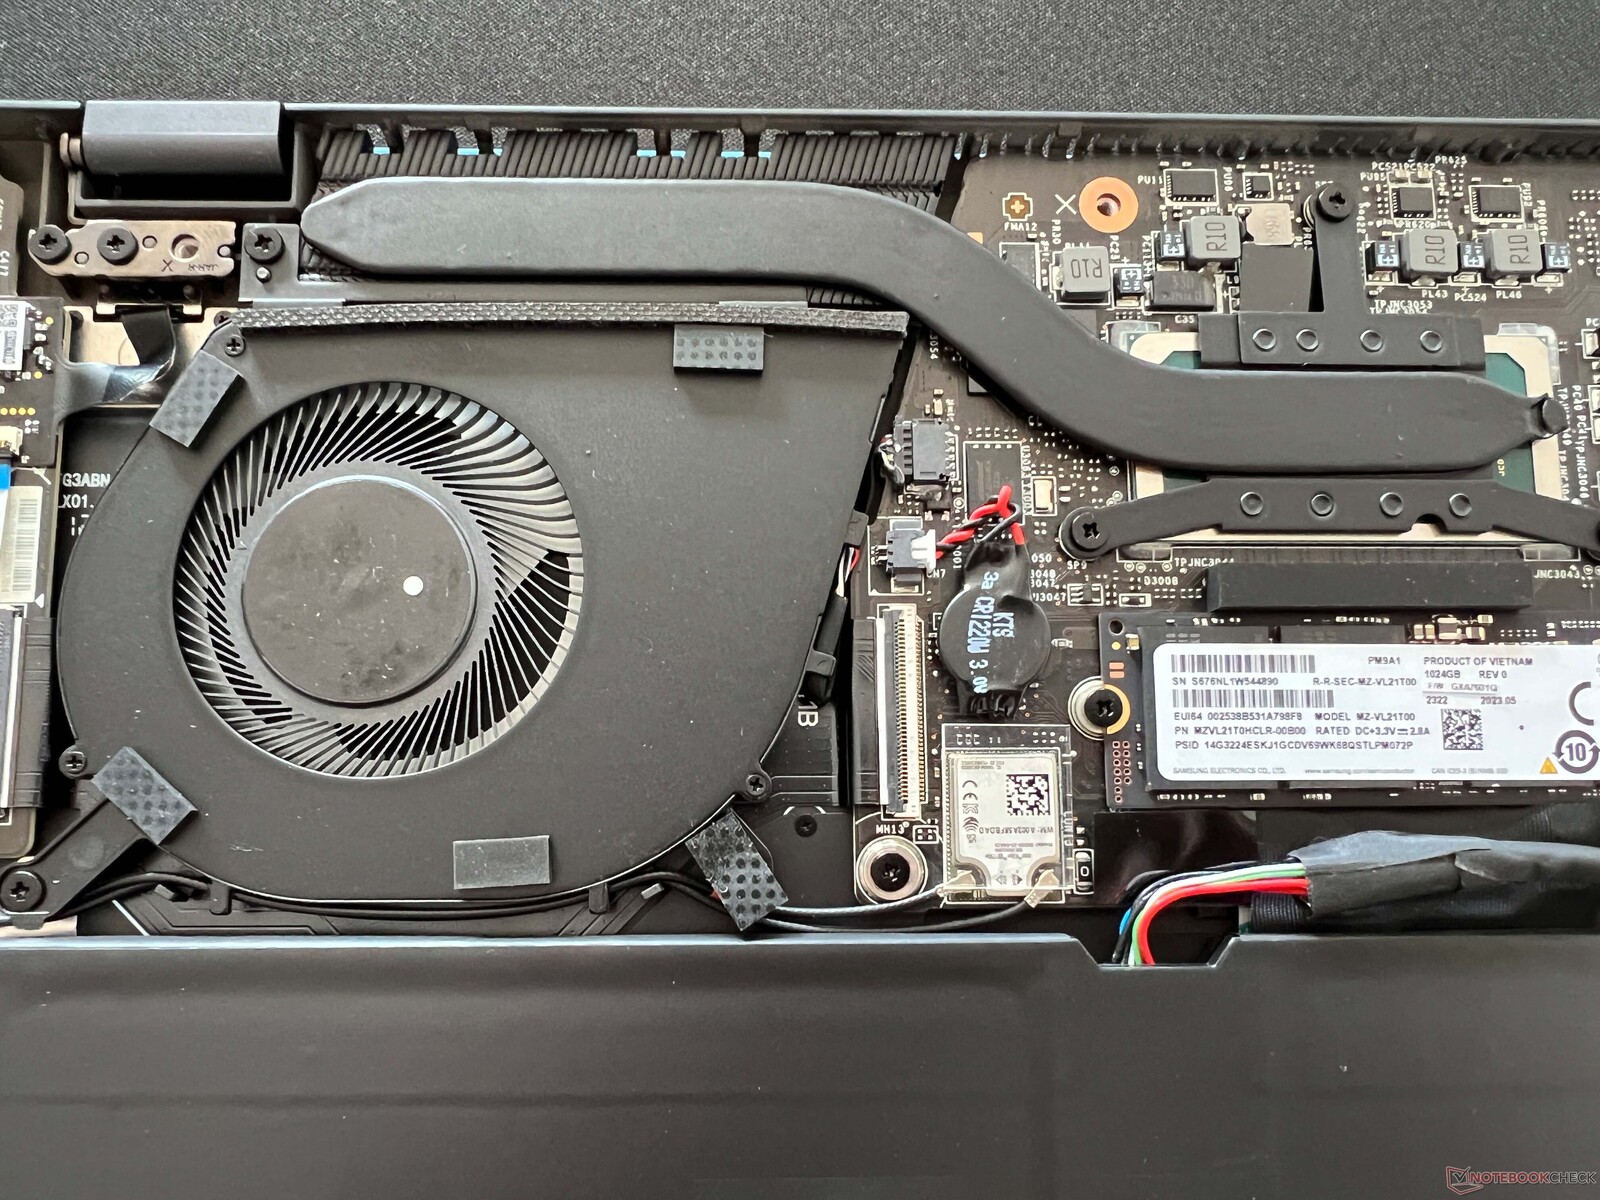
Underhåll
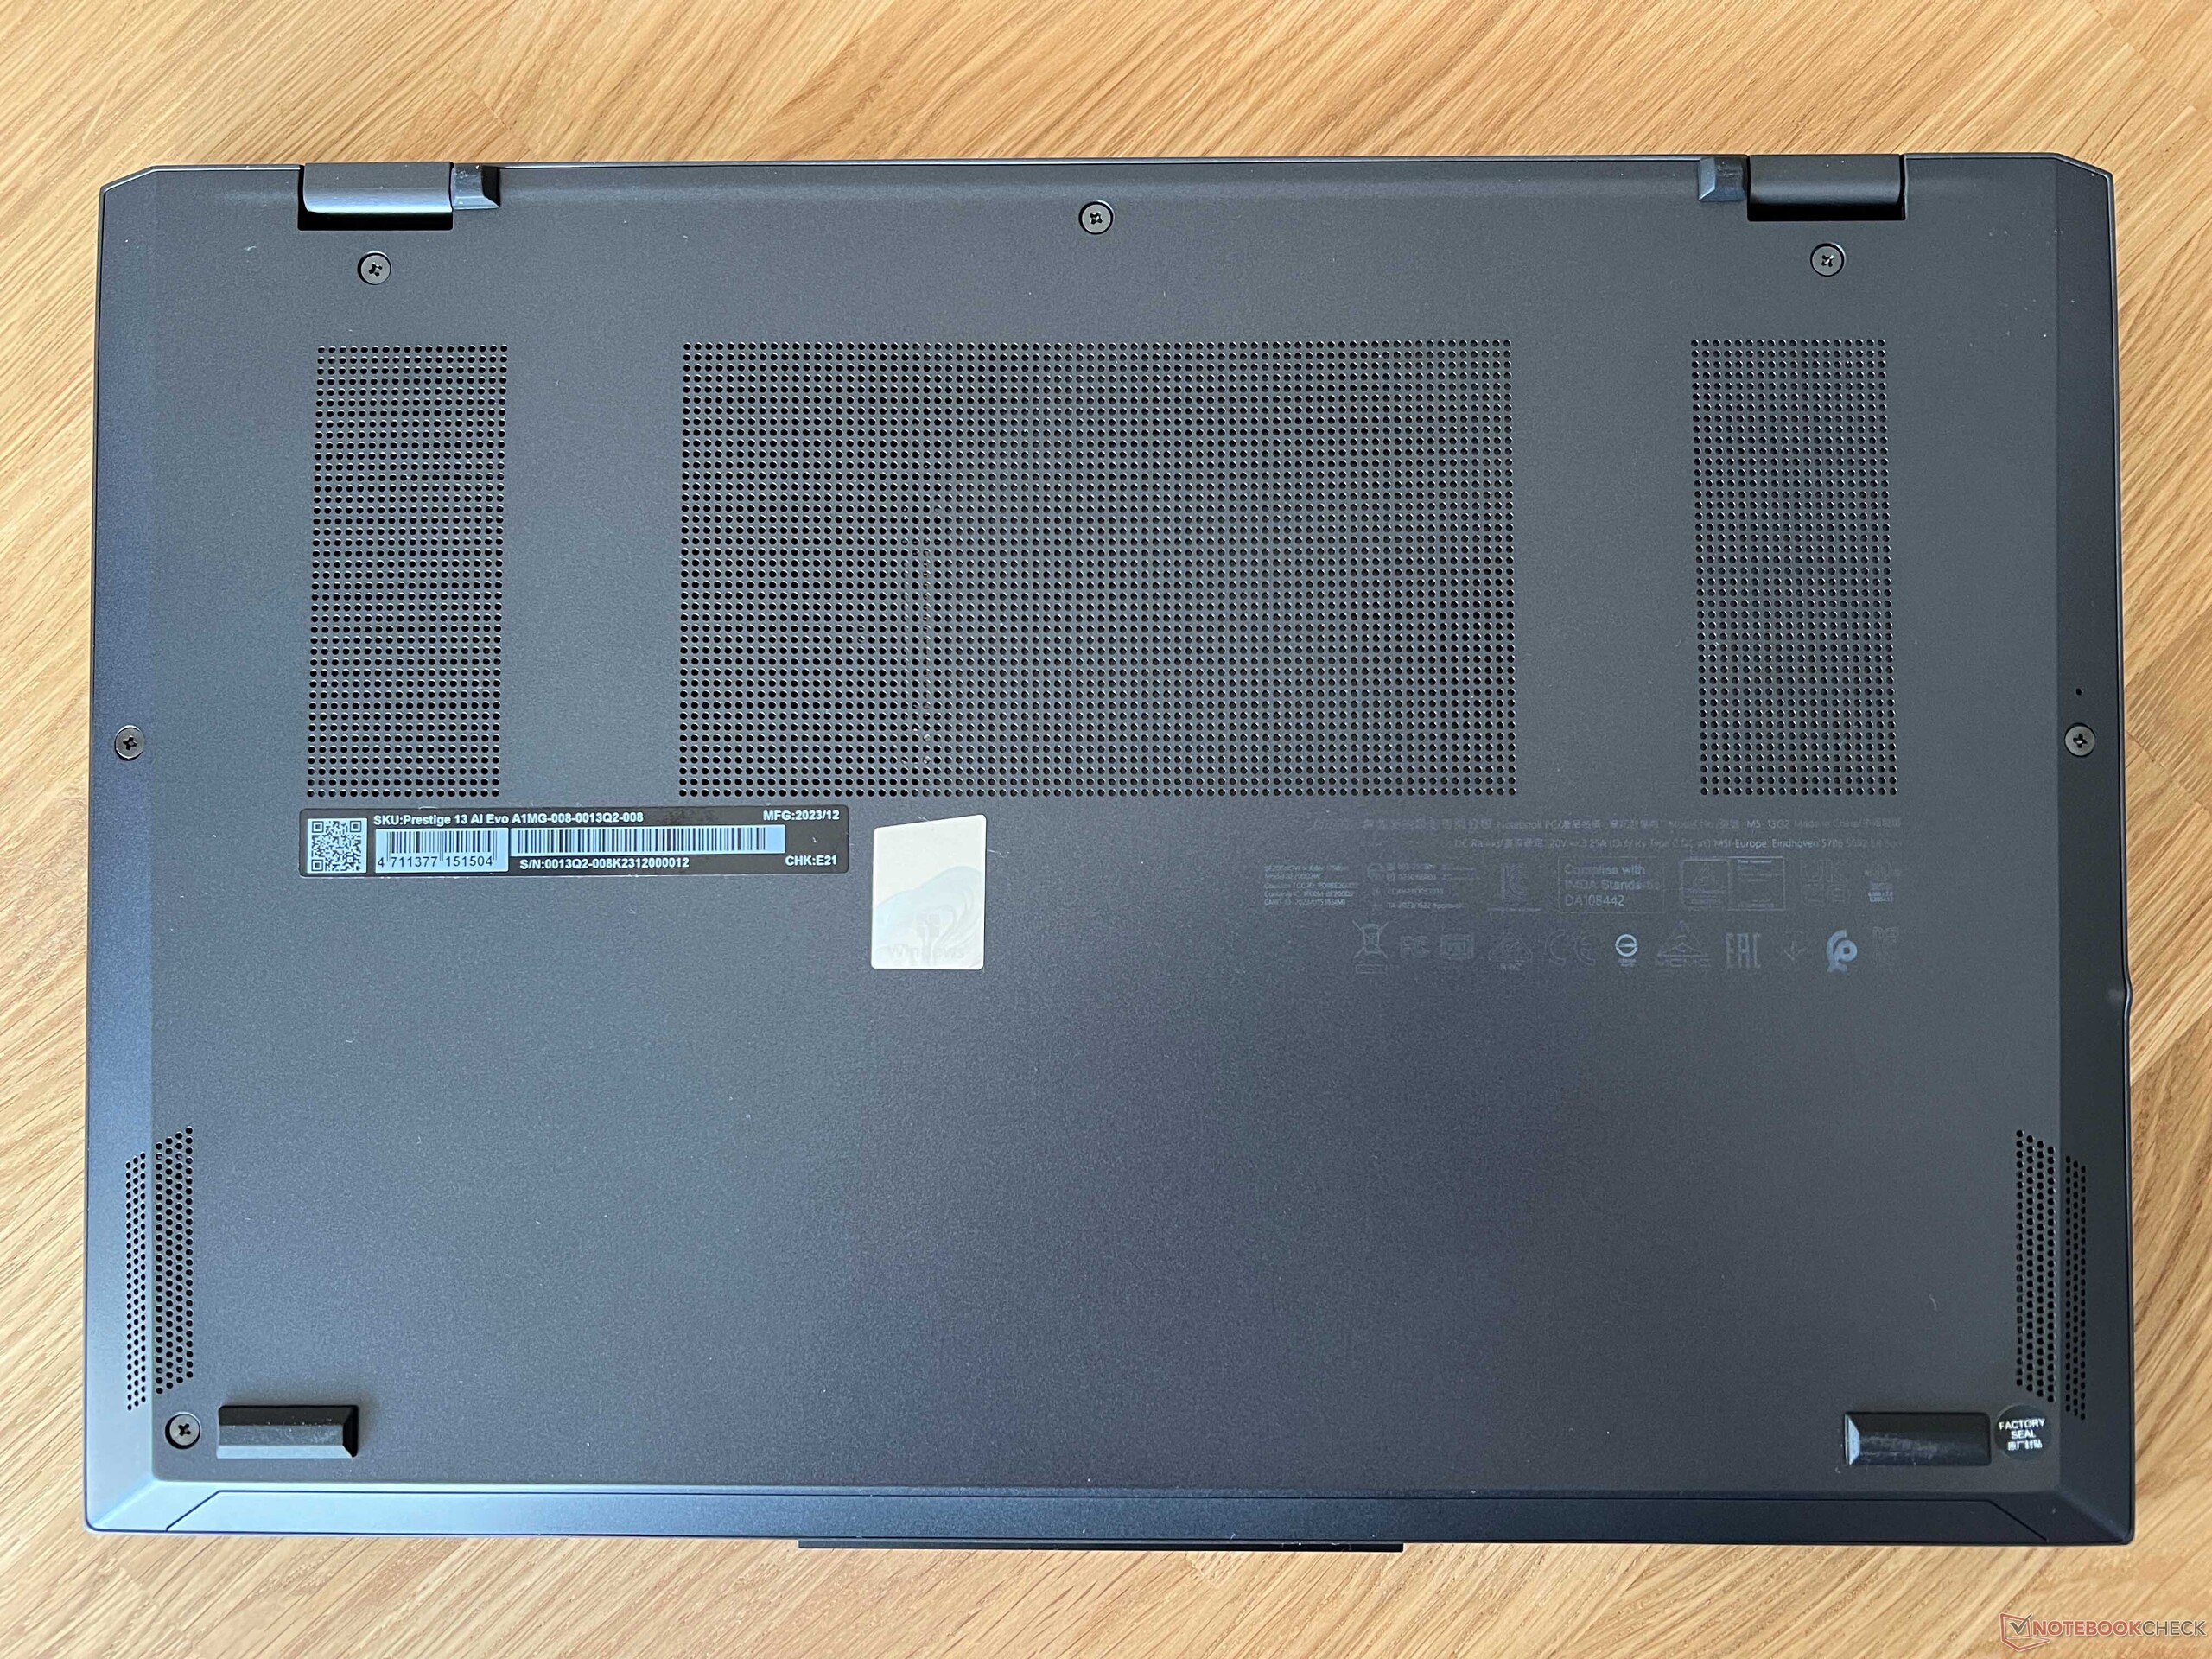
Den nedre delen av chassit är fäst med vanliga korsskruvar och kan enkelt tas bort. Fläkten kan sedan rengöras och SSD och batteri kan bytas ut. Alla andra komponenter, å andra sidan, är lödda på. Detta inkluderar RAM- och WLAN-modulerna.
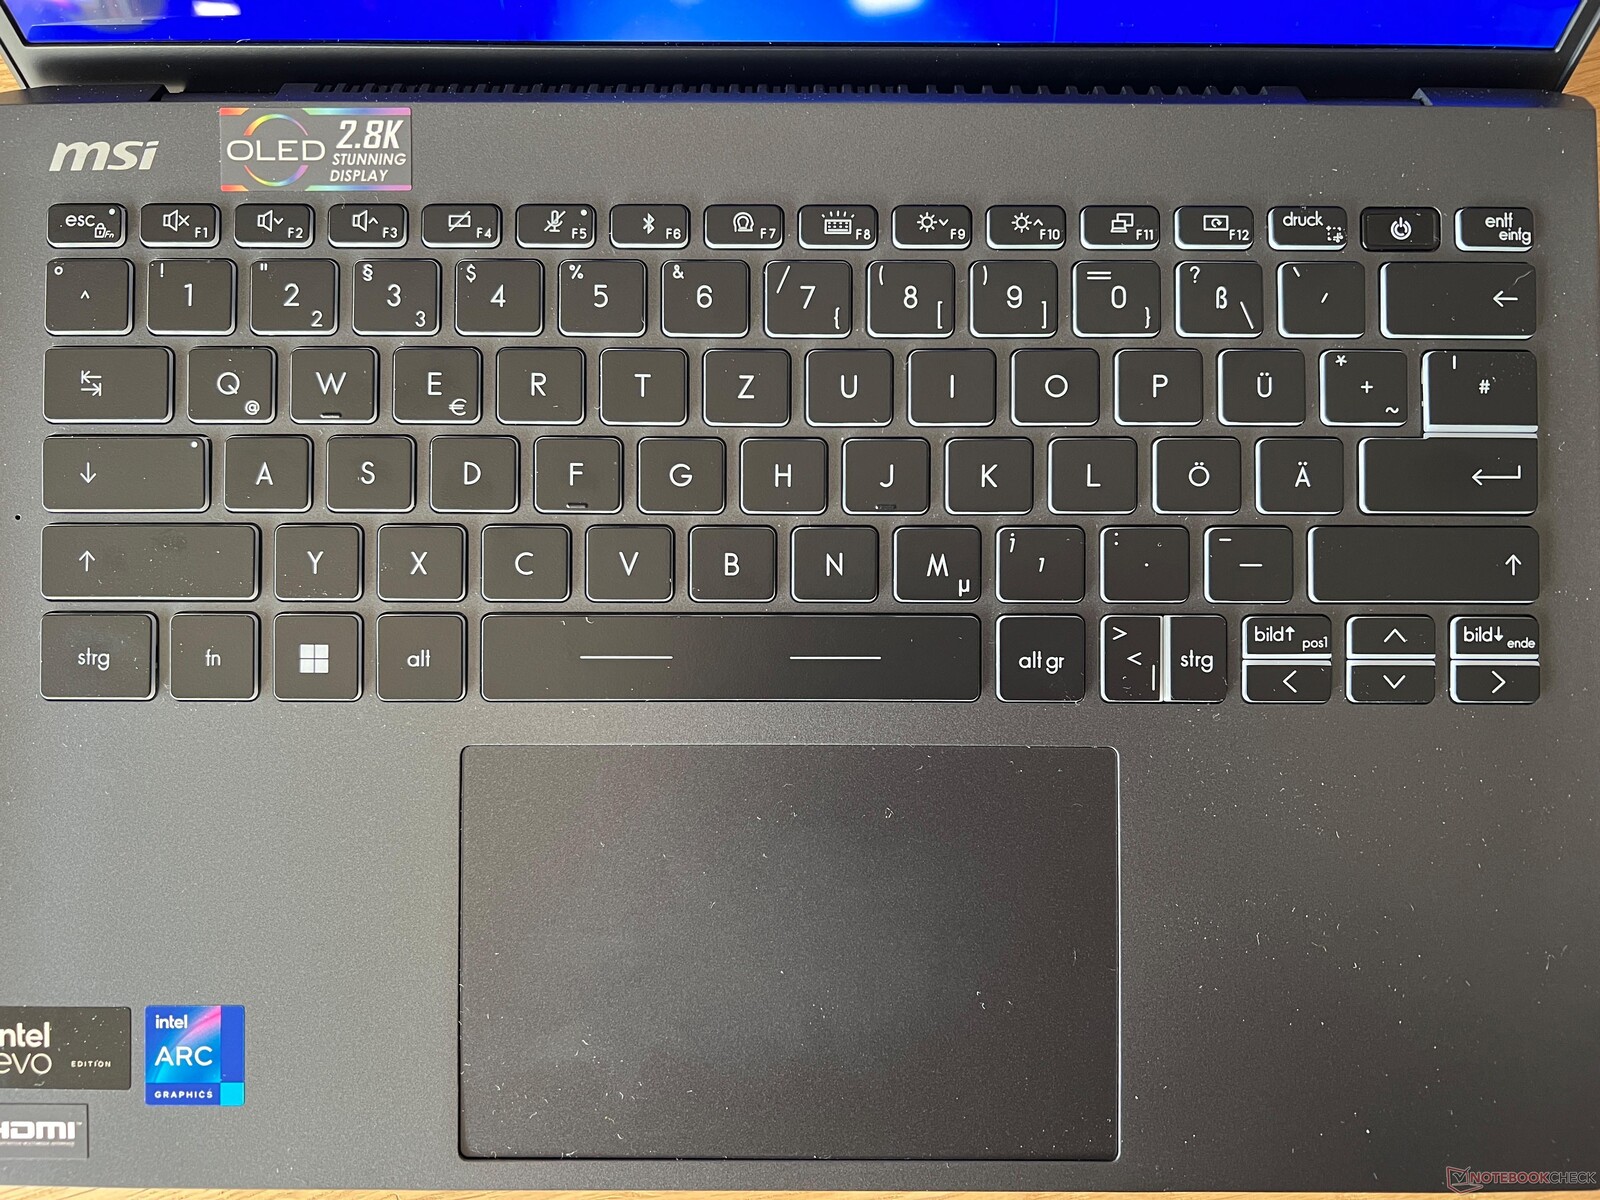
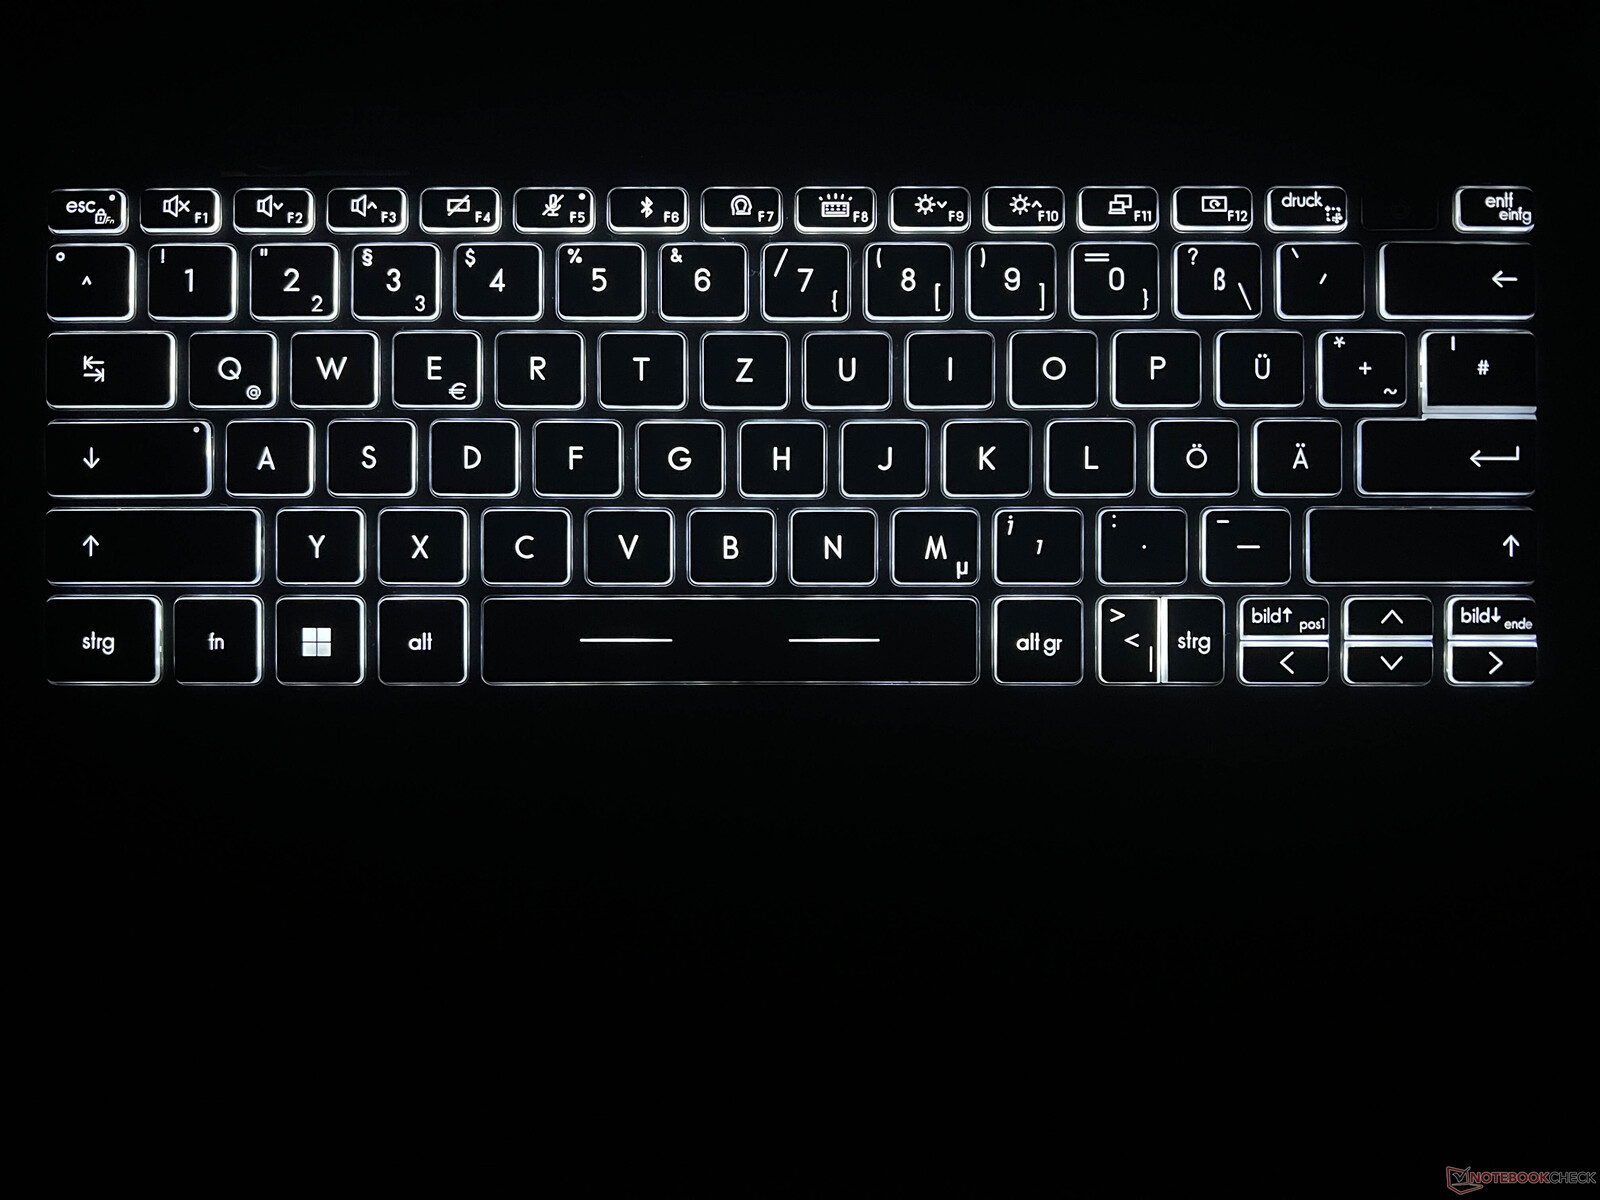
Inmatningsenheter - Förminskat tangentbord
Det svarta tangentbordet känns helt okej att skriva på. Själva mekaniken är exakt men tangenterna är inte särskilt höga (17 mm breda, 1,4 mm höga), vilket du kanske måste vänja dig vid till en början. Dess layout i allmänhet känns ganska trång men MSI har åtminstone installerat dedikerade bild-upp / bild-ned-tangenter. Strömknappen (inklusive en fingeravtrycksläsare) är placerad längst upp till höger och den sitter djupare i höljet, vilket innebär att du enkelt kan känna efter den. Raderingsknappen sitter längst ut till höger. Tangentbordets vita bakgrundsbelysning har tre intensitetsnivåer.
Klickplattan (12 x 7,5 cm) är fin och smidig och vi hade inga problem under användningen. Den nedre halvan av plattan kan tryckas ned och klickljudet som det framkallar är mycket jämnt. Det skulle kunna vara lite tystare men det låter inte på något sätt billigt.
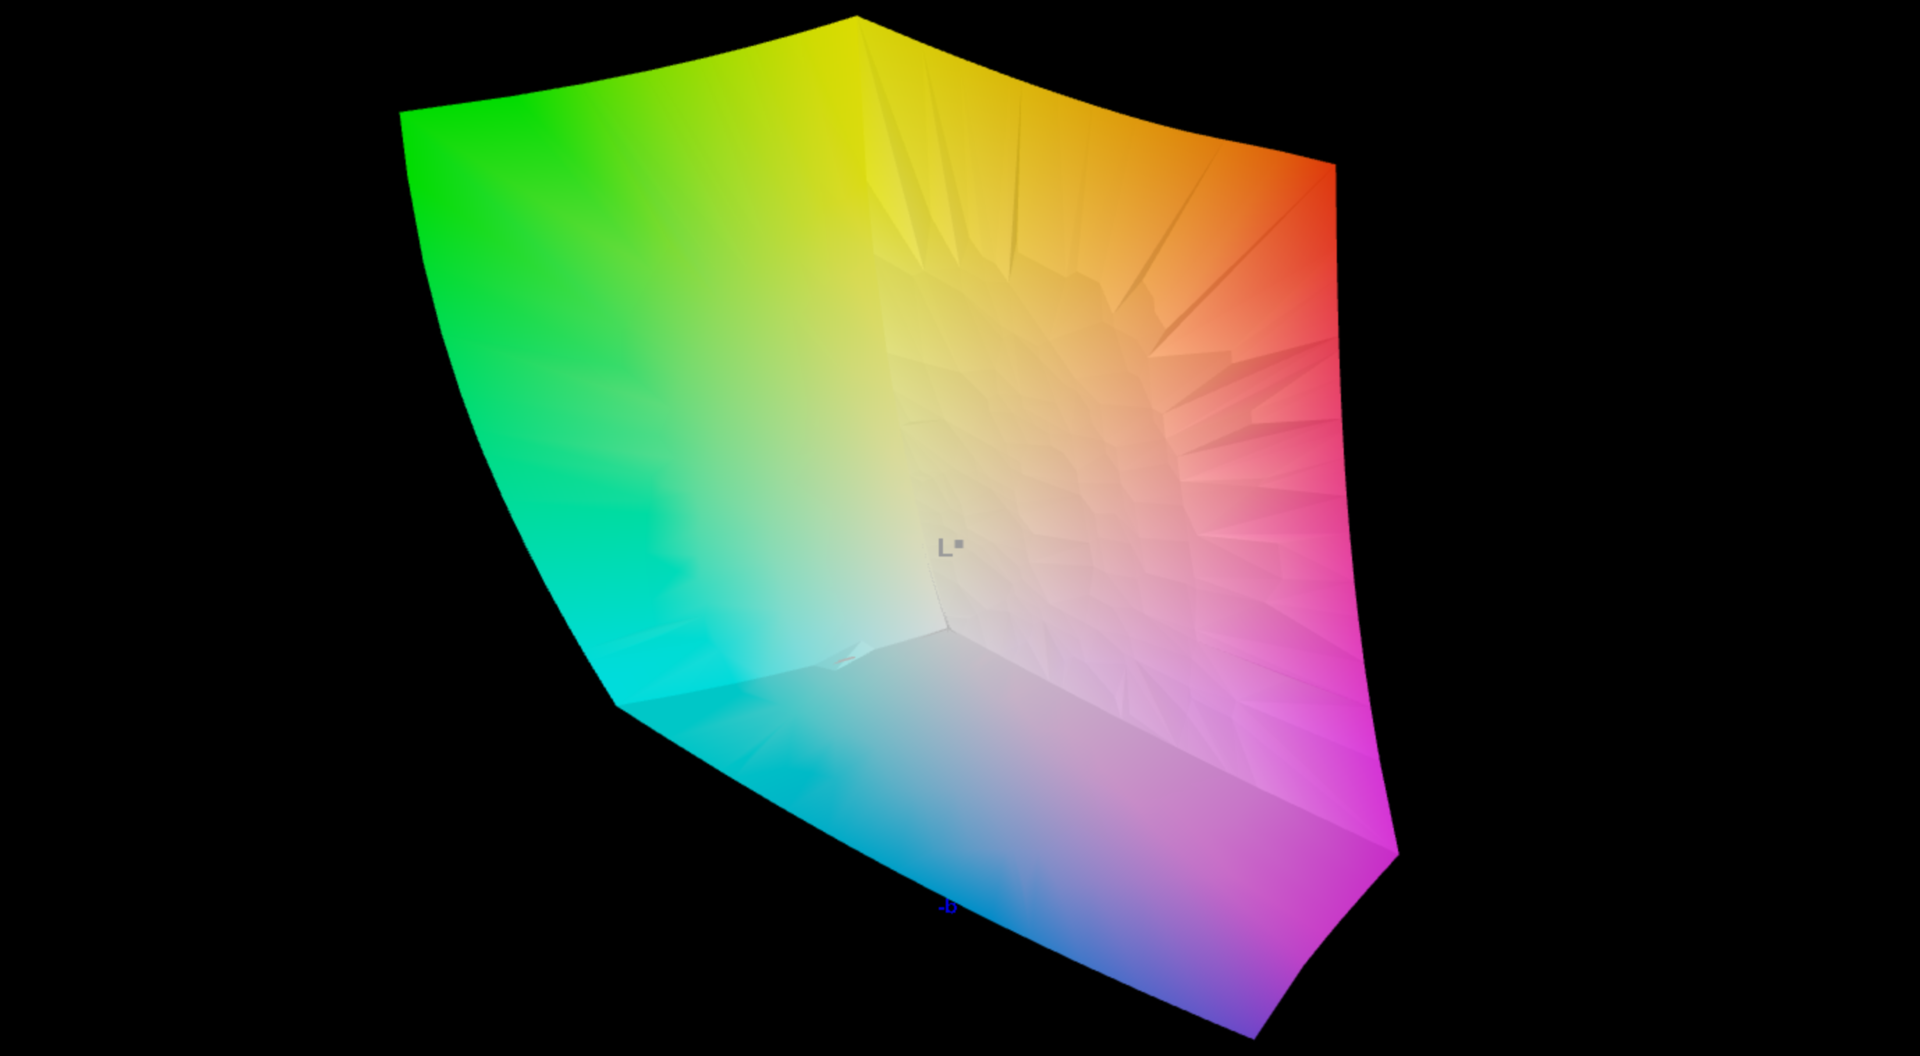
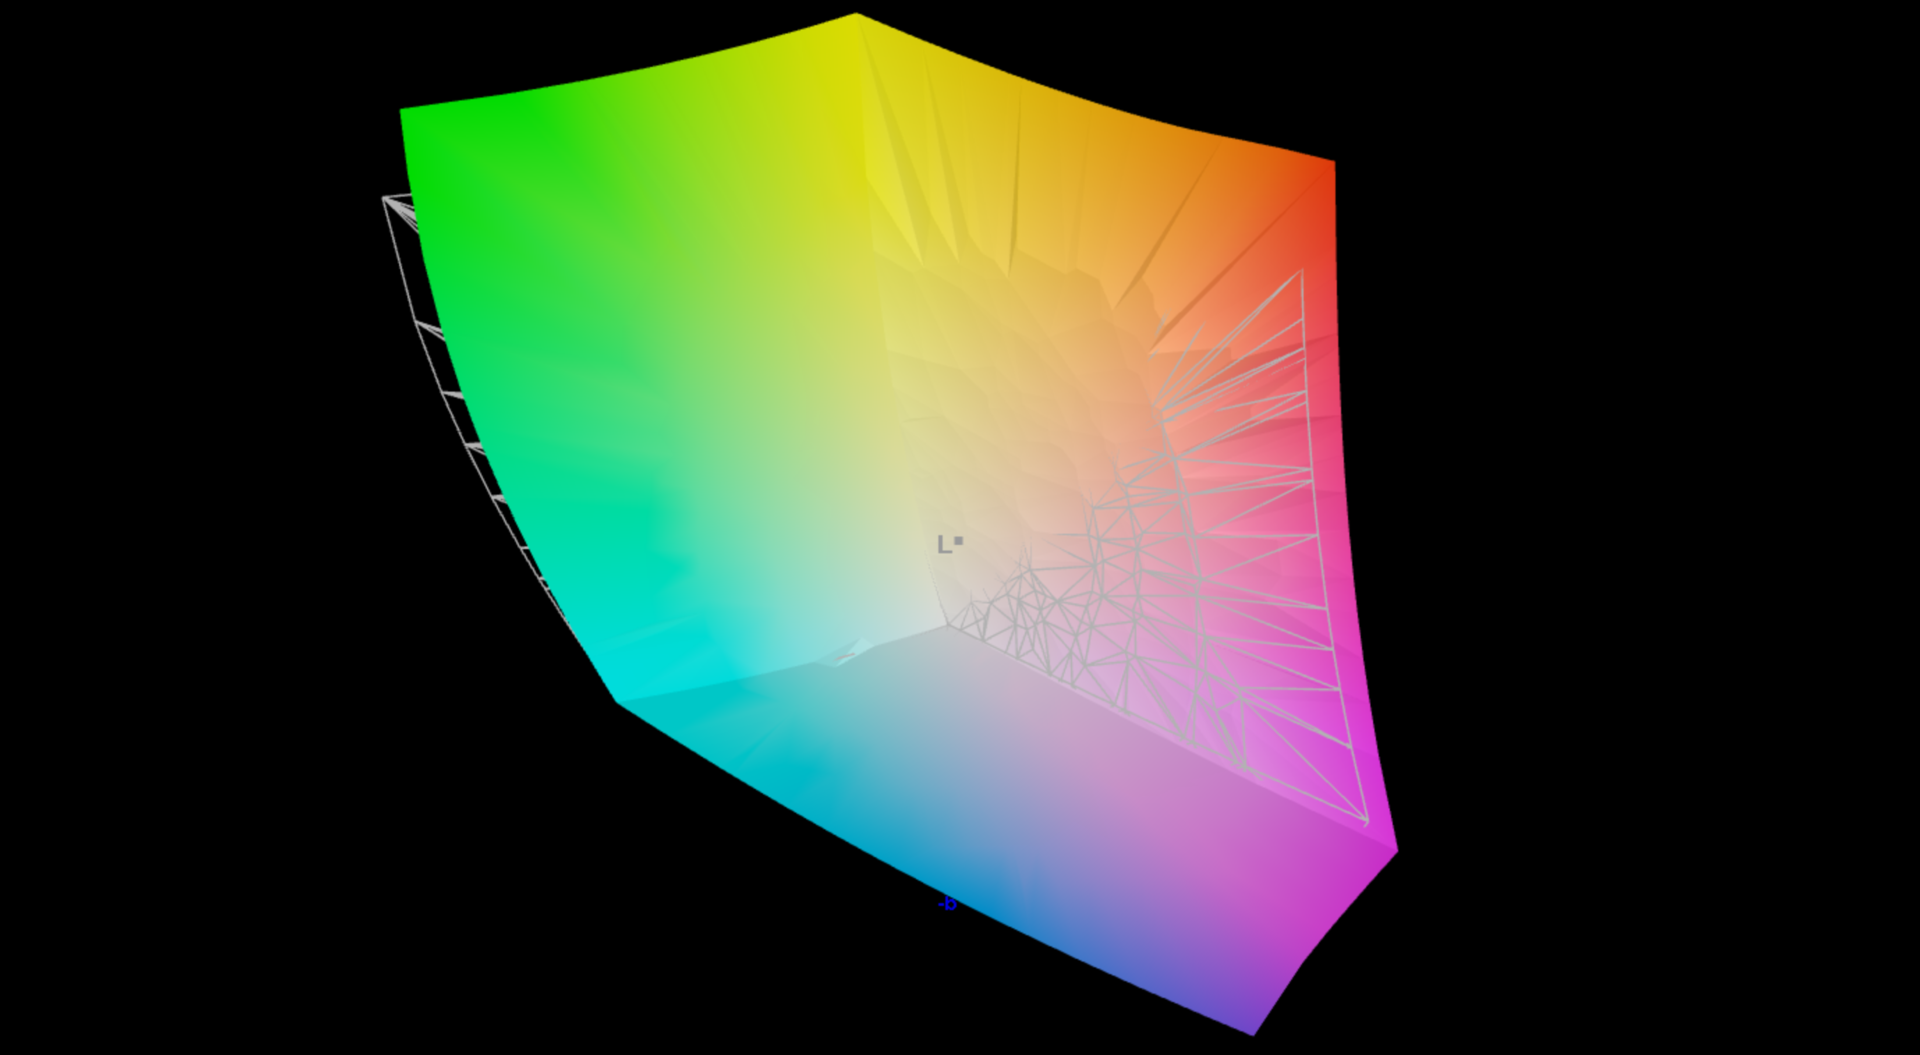
Display - 2,8K OLED utan touch
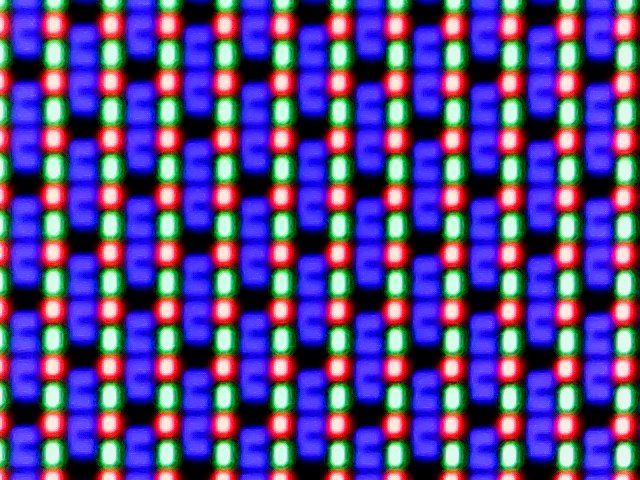
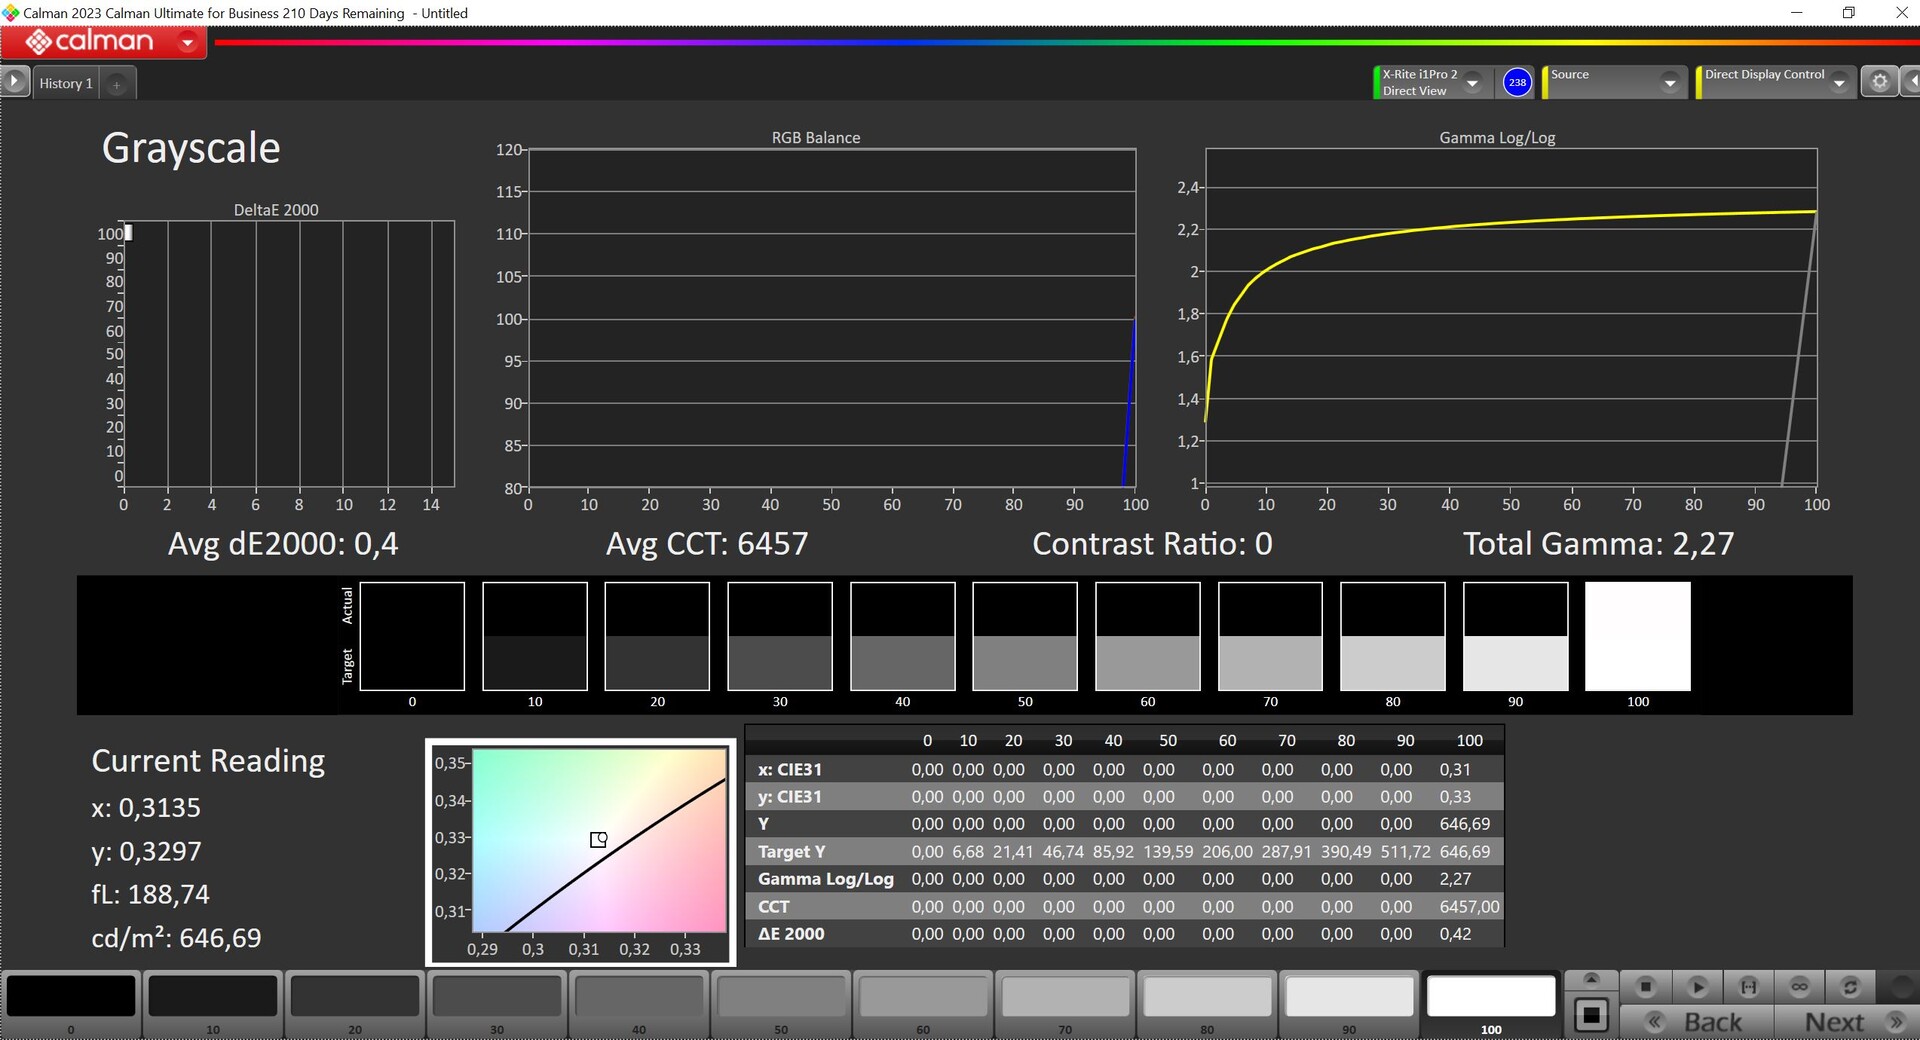
MSI har installerat en reflekterande 16:10 13,3-tums OLED-panel med en upplösning på 2 880 x 1 800 pixlar i enheten. Subjektivt sett är bildkvaliteten imponerande och färgerna är mycket levande. Dessutom är svarstiderna mycket låga. Den maximala SDR-ljusstyrkan är strax över 400 cd/m² och tack vare det låga svartvärdet har den ett högt kontrastförhållande. Detta bidrar också till den levande bildkvaliteten. Touch-ingångar stöds inte men ljusstyrkan kan justeras automatiskt efter de omgivande ljusförhållandena.
Vid HDR-användning stiger den maximala HDR-ljusstyrkan till upp till 647 cd/m² när små bildutsnitt visas och något över 500 cd/m² när nästan helt vitt visas. Precis som på alla andra bärbara Windows-datorer måste du först aktivera HDR-läget manuellt för att förhindra att färghanteringen inte fungerar korrekt.
| |||||||||||||||||||||||||
Distribution av ljusstyrkan: 98 %
Mitt på batteriet: 405 cd/m²
Kontrast: ∞:1 (Svärta: 0 cd/m²)
ΔE ColorChecker Calman: 2.1 | ∀{0.5-29.43 Ø4.71}
ΔE Greyscale Calman: 1.2 | ∀{0.09-98 Ø4.96}
97.8% AdobeRGB 1998 (Argyll 3D)
100% sRGB (Argyll 3D)
99.9% Display P3 (Argyll 3D)
Gamma: 2.16
CCT: 6465 K
| MSI Prestige 13 AI Evo ATNA33AA07-0, OLED, 2880x1800, 13.3" | Lenovo ThinkPad X1 Nano Gen 3 MND007ZA1-3, IPS, 2160x1350, 13" | Dell Latitude 13 7340 i5-1345U Chi Mei 133JCG, IPS, 1920x1200, 13.3" | HP Dragonfly G4 Chi Mei CMN13C0, IPS, 1920x1280, 13.5" | Asus ZenBook S13 OLED UX5304 SDC417B, OLED, 2880x1800, 13.3" | |
|---|---|---|---|---|---|
| Display | -20% | -23% | -21% | -0% | |
| Display P3 Coverage (%) | 99.9 | 68.5 -31% | 65.9 -34% | 68.4 -32% | 99.7 0% |
| sRGB Coverage (%) | 100 | 99.5 0% | 96.8 -3% | 98.3 -2% | 100 0% |
| AdobeRGB 1998 Coverage (%) | 97.8 | 69.7 -29% | 67.8 -31% | 70.4 -28% | 96.9 -1% |
| Response Times | -2092% | -2565% | -2572% | -21% | |
| Response Time Grey 50% / Grey 80% * (ms) | 1.54 ? | 39.9 ? -2491% | 51 ? -3212% | 48.8 ? -3069% | 2 ? -30% |
| Response Time Black / White * (ms) | 1.44 ? | 25.8 ? -1692% | 29.04 ? -1917% | 31.3 ? -2074% | 1.6 ? -11% |
| PWM Frequency (Hz) | 240 ? | 240 ? | |||
| Screen | -1% | -65% | -14% | 13% | |
| Brightness middle (cd/m²) | 404 | 461.2 14% | 471 17% | 408.8 1% | 361 -11% |
| Brightness (cd/m²) | 407 | 428 5% | 437 7% | 399 -2% | 365 -10% |
| Brightness Distribution (%) | 98 | 86 -12% | 87 -11% | 90 -8% | 98 0% |
| Black Level * (cd/m²) | 0.29 | 0.2033 | 0.32 | ||
| Colorchecker dE 2000 * | 2.1 | 1.79 15% | 3.24 -54% | 2.02 4% | 1.2 43% |
| Colorchecker dE 2000 max. * | 4.3 | 3.3 23% | 7.19 -67% | 3.84 11% | 1.9 56% |
| Greyscale dE 2000 * | 1.2 | 1.8 -50% | 4.6 -283% | 2.3 -92% | 1.2 -0% |
| Gamma | 2.16 102% | 2.24 98% | 2.2 100% | 2.27 97% | |
| CCT | 6465 101% | 6588 99% | 6520 100% | 6203 105% | 6486 100% |
| Contrast (:1) | 1590 | 2317 | 1278 | ||
| Colorchecker dE 2000 calibrated * | 0.47 | 1.08 | 0.61 | ||
| Totalt genomsnitt (program/inställningar) | -704% /
-386% | -884% /
-508% | -869% /
-481% | -3% /
3% |
* ... mindre är bättre
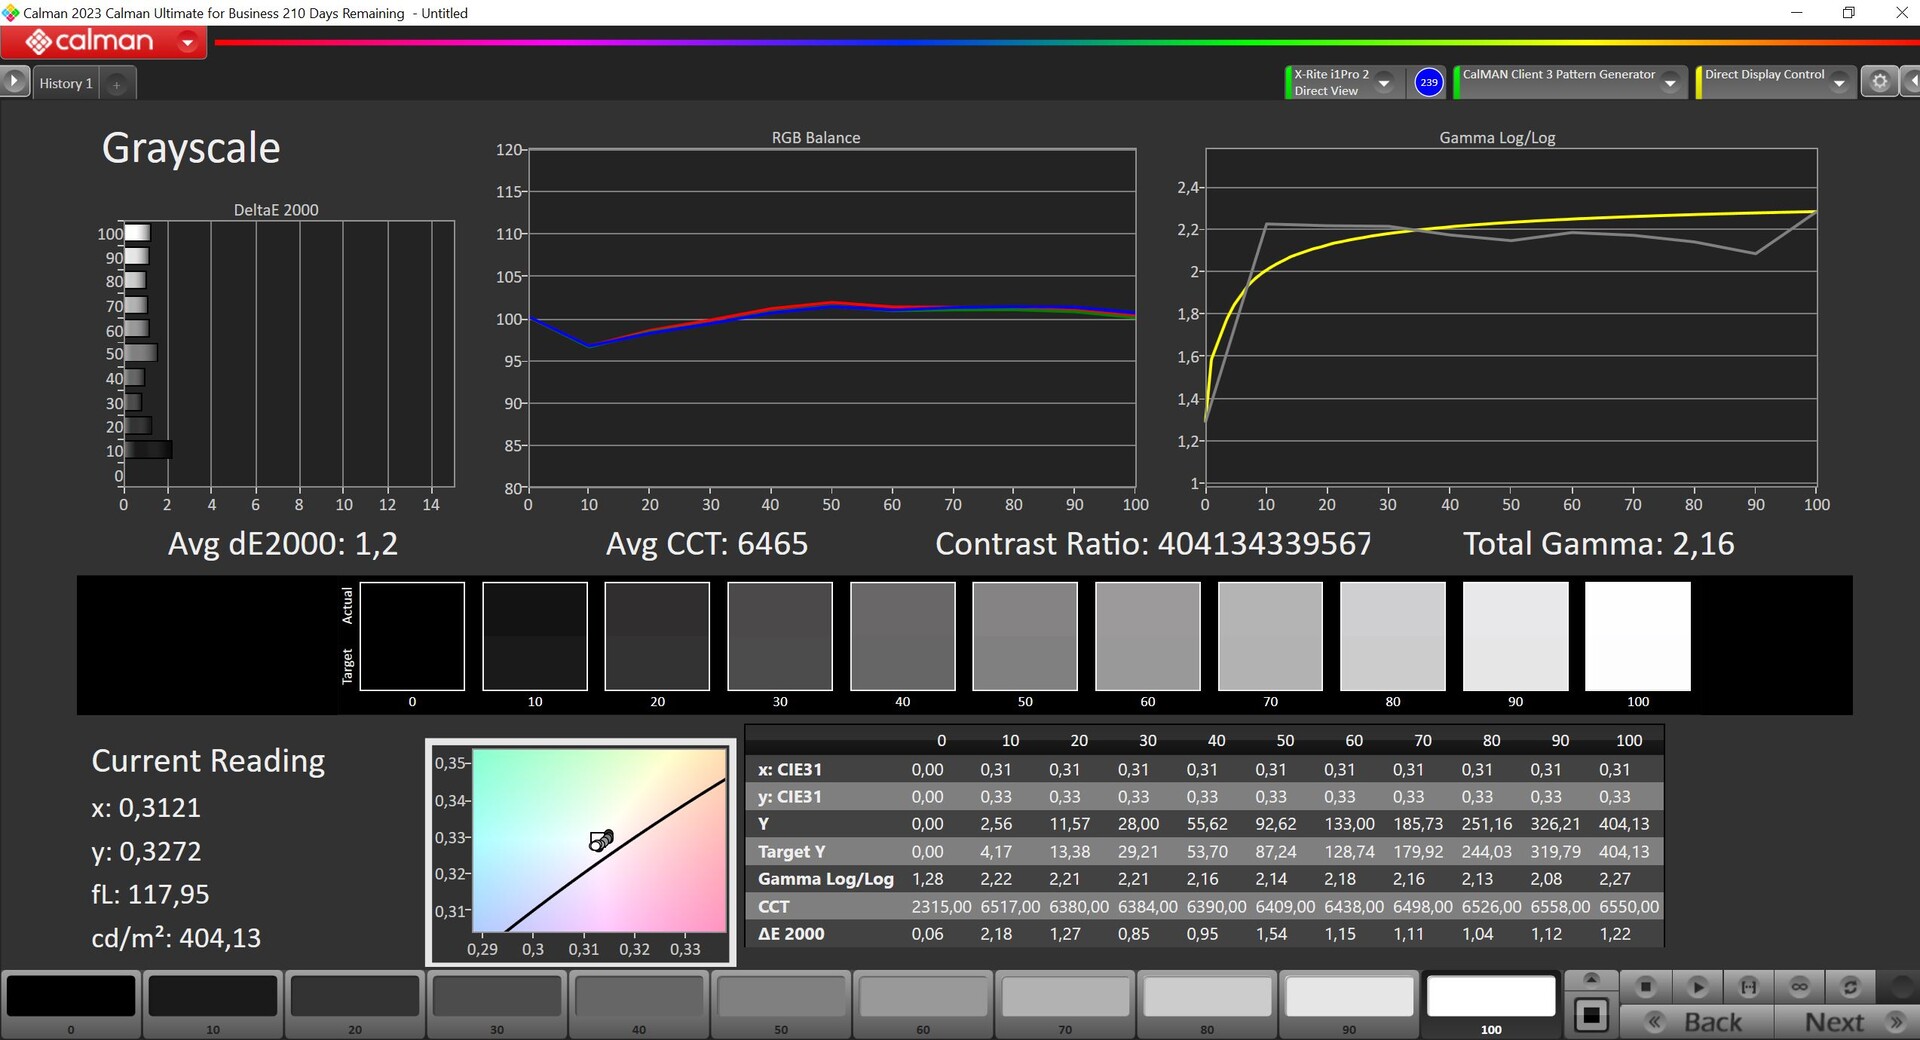
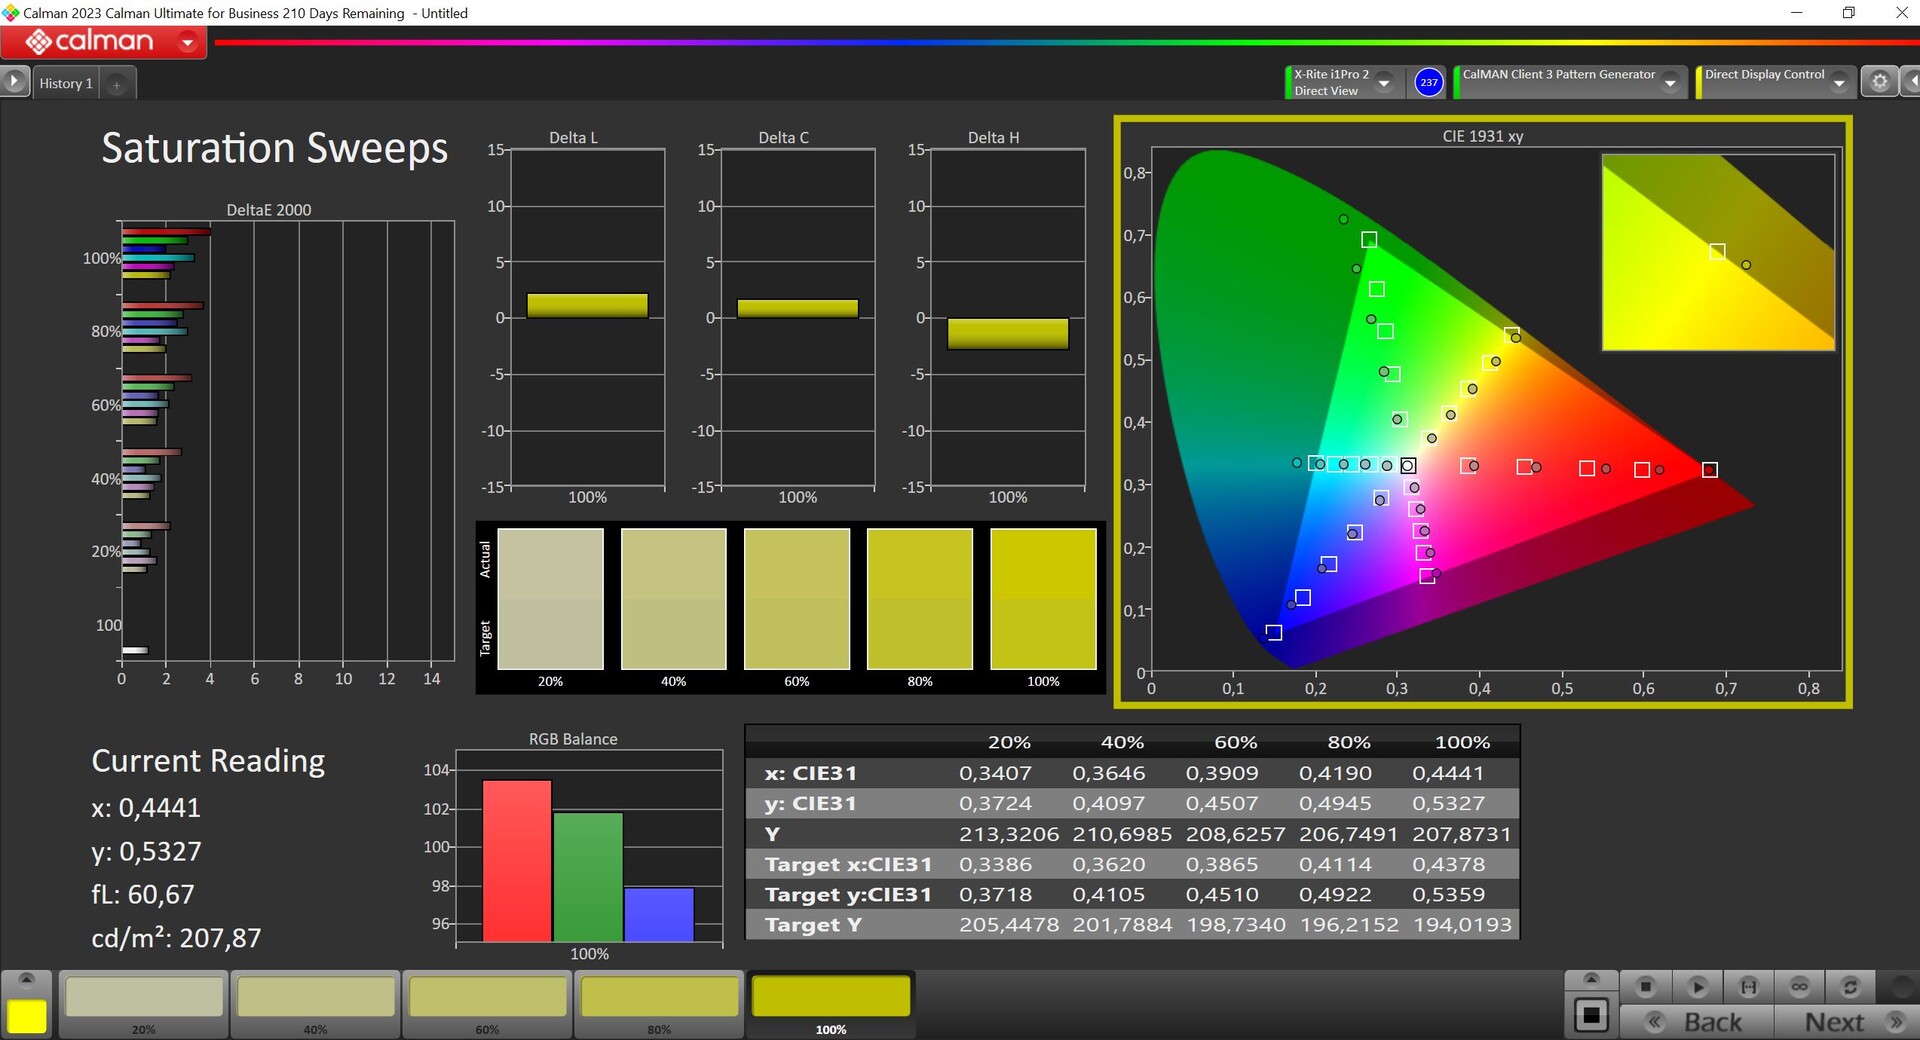
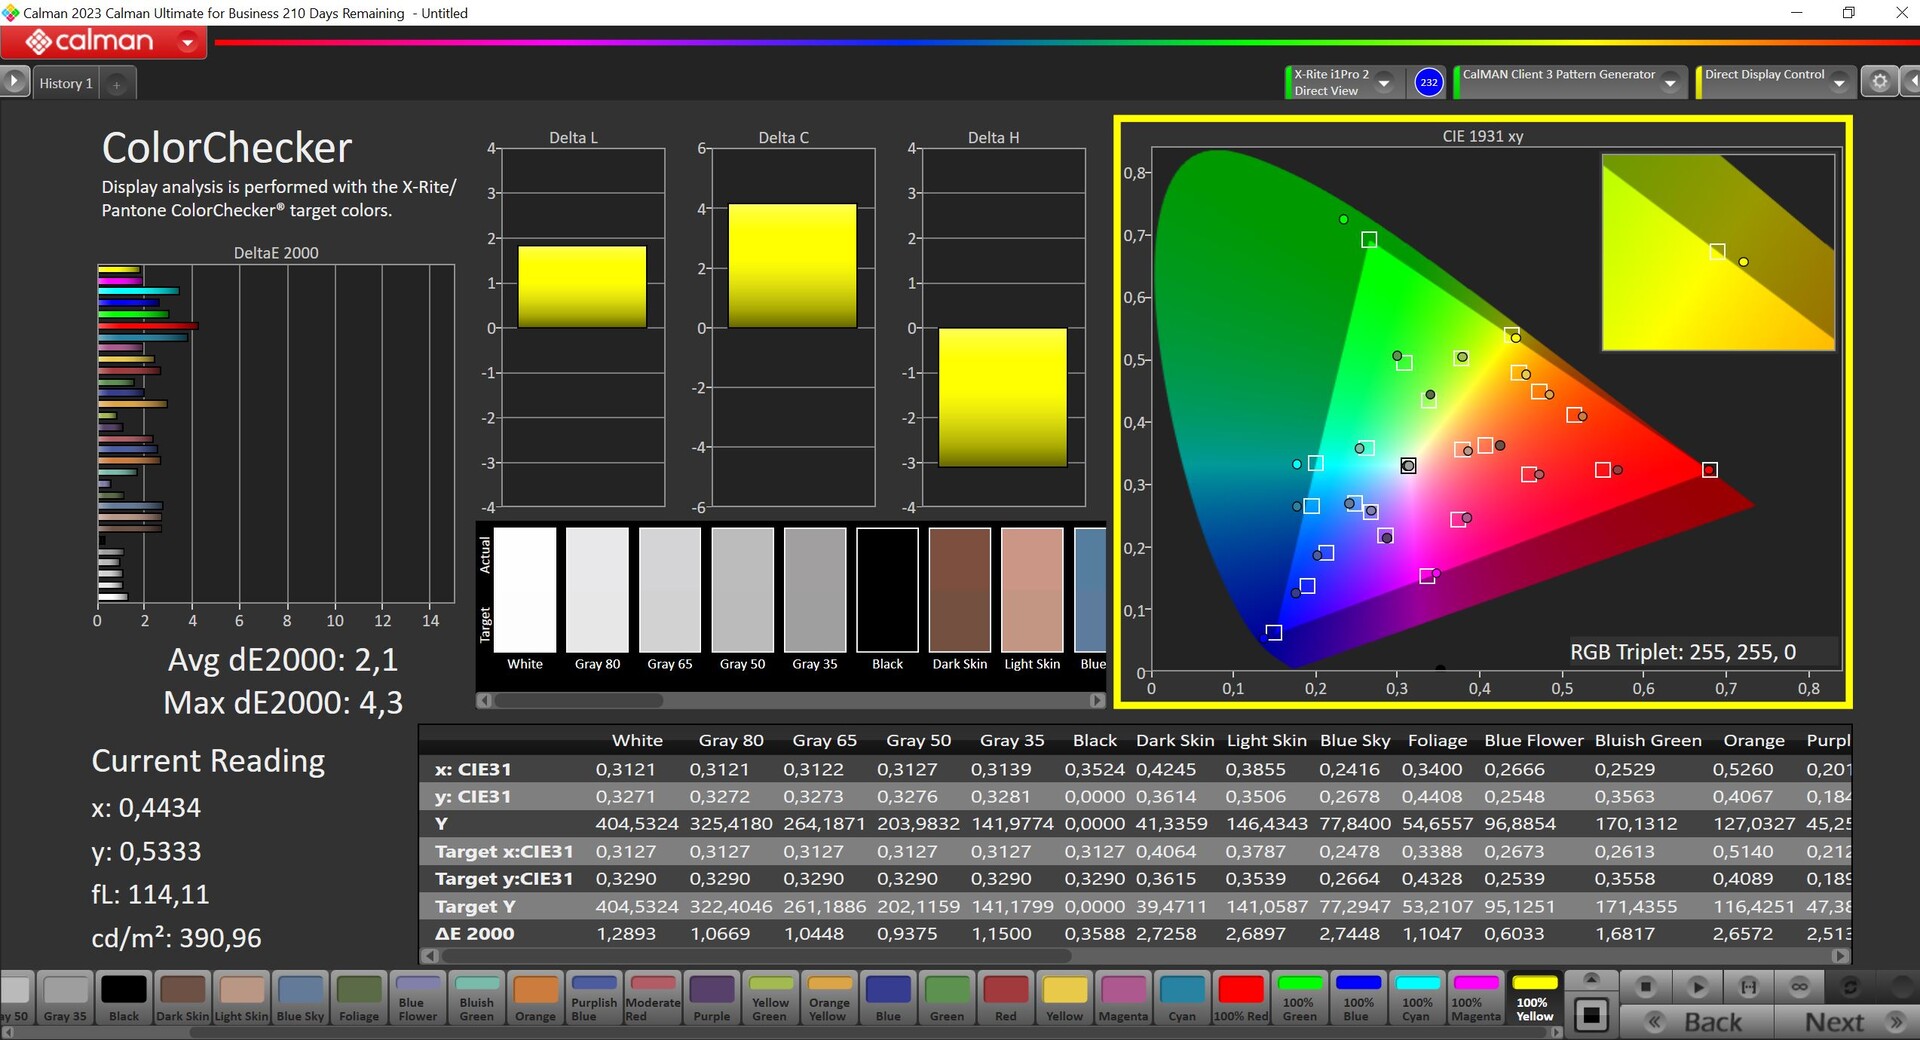
Vi analyserade panelen med den professionella CalMAN-programvaran (X-Rite i1 Pro2) och direkt från start gav den en bra bild. Vi noterade ingen färgton och dess färgtemperatur var också korrekt - endast vissa färger (100 %) låg över den viktiga DeltaE-2000-avvikelsen på 3 (jämfört med P3-referensen). Vi kunde inte korrigera detta genom kalibrering, plus att MSI inte erbjuder en sRGB-profil. Som ett resultat är Prestige 13 inte bäst lämpad för bildredigering.

Visa svarstider
| ↔ Svarstid svart till vitt | ||
|---|---|---|
| 1.44 ms ... stiga ↗ och falla ↘ kombinerat | ↗ 0.73 ms stiga | 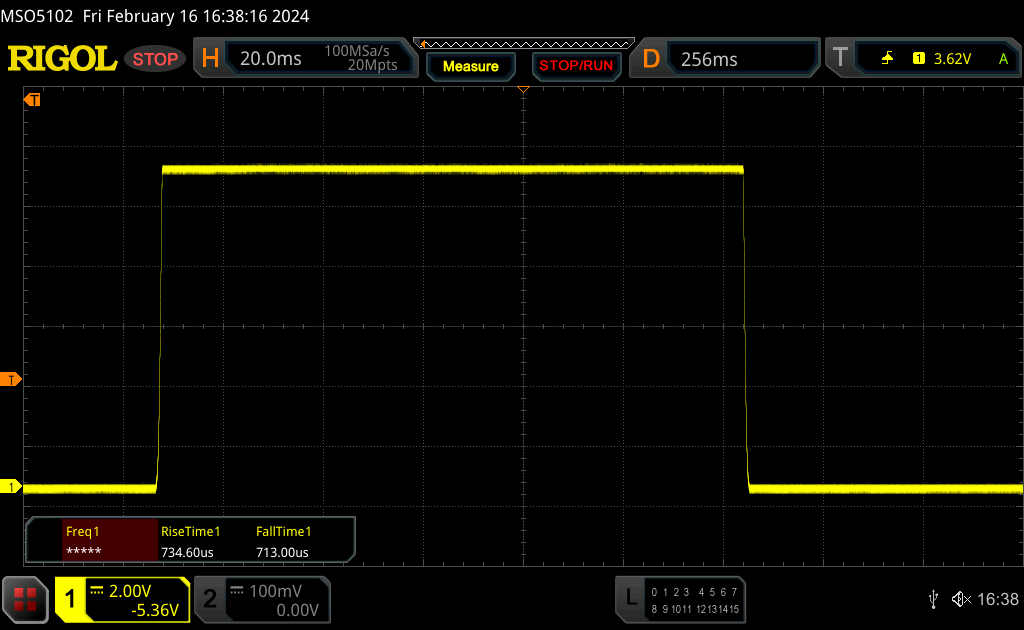 |
| ↘ 0.71 ms hösten | ||
| Skärmen visar väldigt snabba svarsfrekvenser i våra tester och borde vara mycket väl lämpad för fartfyllt spel. I jämförelse sträcker sig alla testade enheter från 0.1 (minst) till 240 (maximalt) ms. » 9 % av alla enheter är bättre. Det betyder att den uppmätta svarstiden är bättre än genomsnittet av alla testade enheter (19.8 ms). | ||
| ↔ Svarstid 50 % grått till 80 % grått | ||
| 1.54 ms ... stiga ↗ och falla ↘ kombinerat | ↗ 0.79 ms stiga | 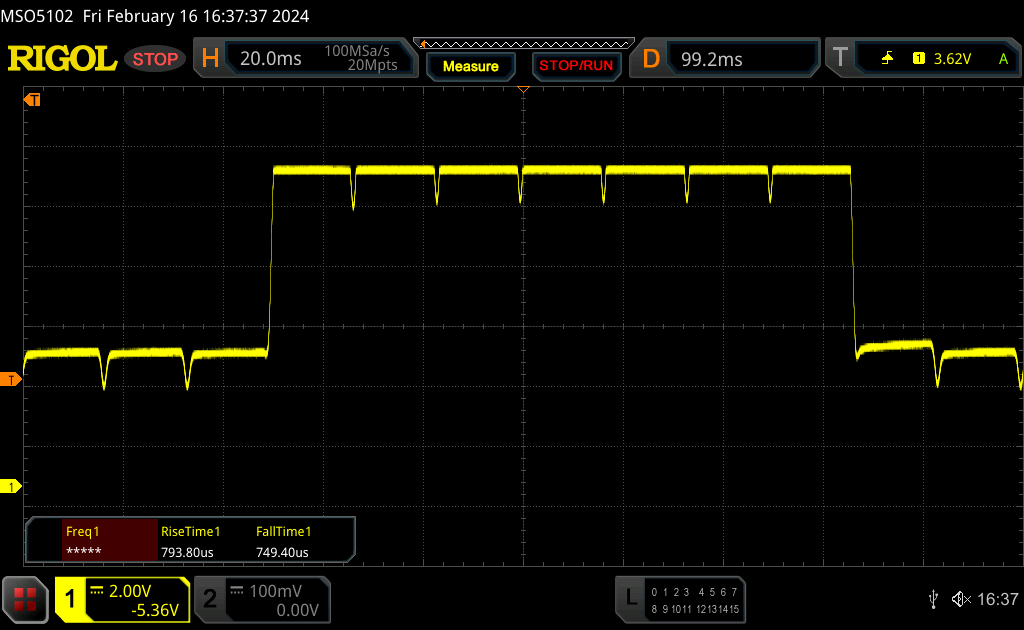 |
| ↘ 0.75 ms hösten | ||
| Skärmen visar väldigt snabba svarsfrekvenser i våra tester och borde vara mycket väl lämpad för fartfyllt spel. I jämförelse sträcker sig alla testade enheter från 0.165 (minst) till 636 (maximalt) ms. » 8 % av alla enheter är bättre. Det betyder att den uppmätta svarstiden är bättre än genomsnittet av alla testade enheter (31 ms). | ||
Skärmflimmer / PWM (Puls-Width Modulation)
| Skärmflimmer / PWM upptäckt | 240 Hz | ≤ 42 % ljusstyrka inställning | 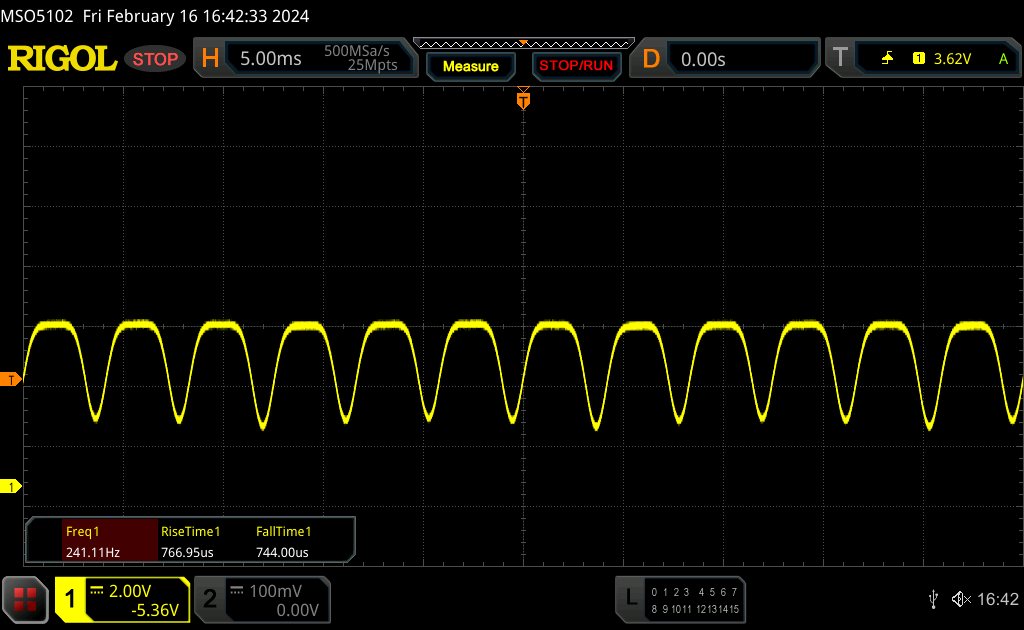 |
Displayens bakgrundsbelysning flimrar vid 240 Hz (i värsta fall, t.ex. med PWM) Flimrande upptäckt vid en ljusstyrkeinställning på 42 % och lägre. Det ska inte finnas något flimmer eller PWM över denna ljusstyrkeinställning. Frekvensen för 240 Hz är relativt låg, så känsliga användare kommer sannolikt att märka flimmer och uppleva ansträngda ögon vid den angivna ljusstyrkeinställningen och nedan. Som jämförelse: 52 % av alla testade enheter använder inte PWM för att dämpa skärmen. Om PWM upptäcktes mättes ett medelvärde av 7757 (minst: 5 - maximum: 343500) Hz. | |||

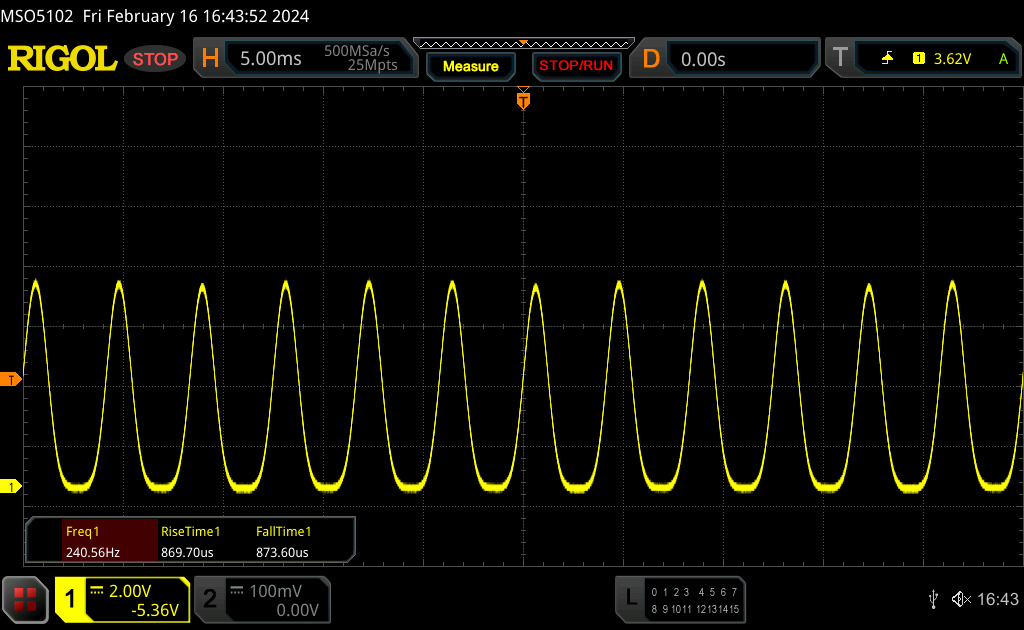
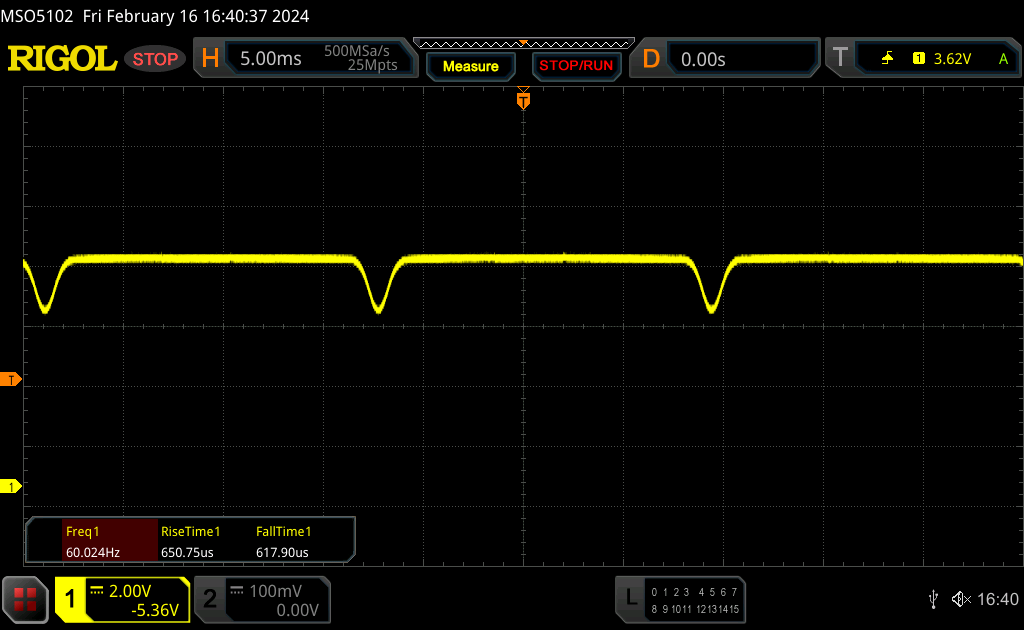
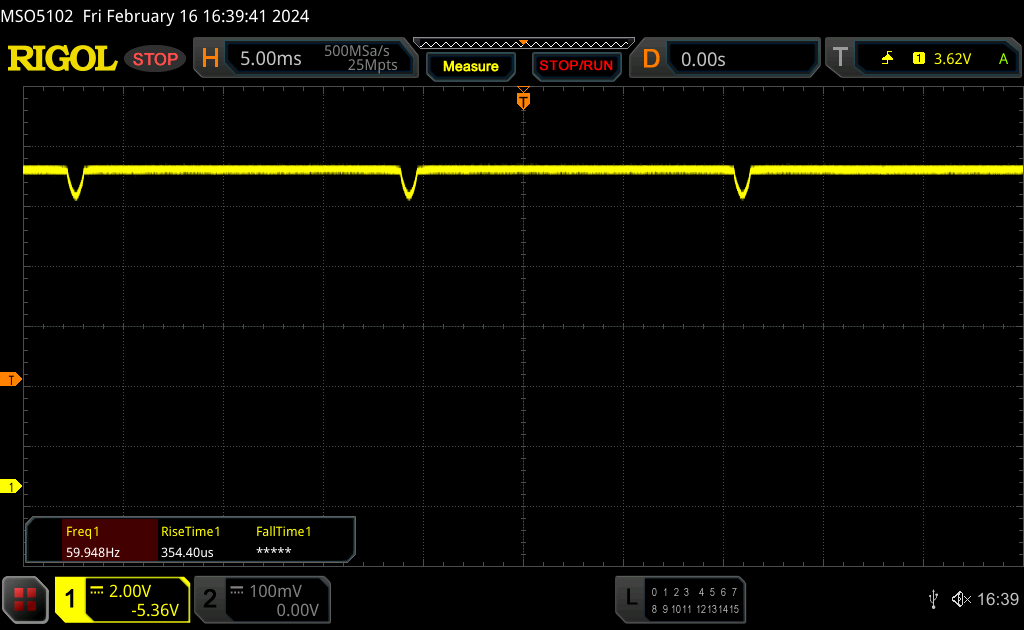
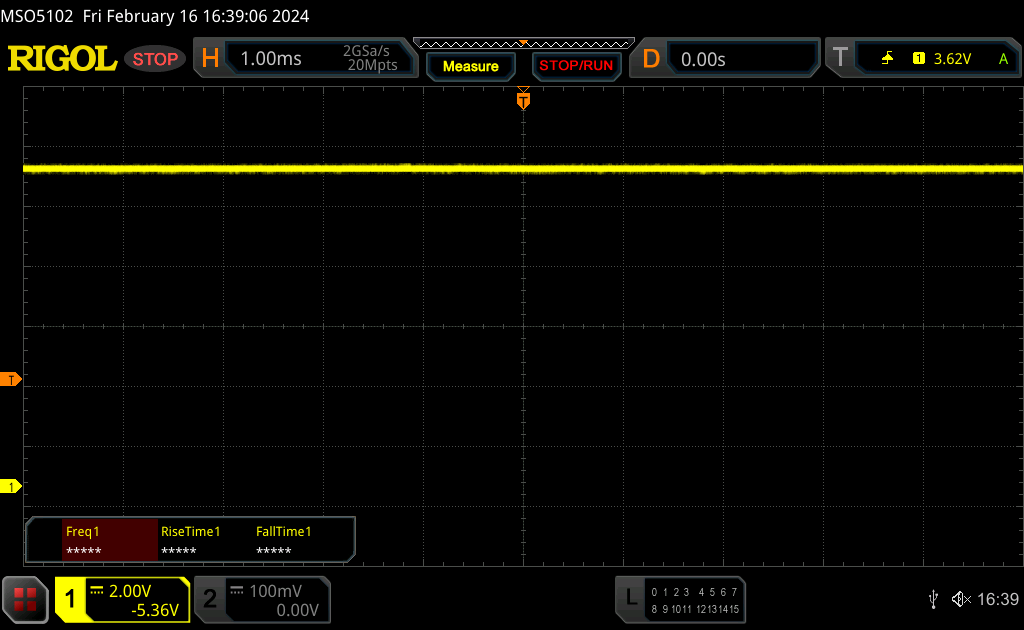
När PWM används uppmätte vi DC-dimning vid 60 Hz inom ljusstyrkeområdet 43-84 %; vid 42 % eller mindre börjar den potentiellt mer skadliga PWM-flimringen vid 240 Hz att spela in.
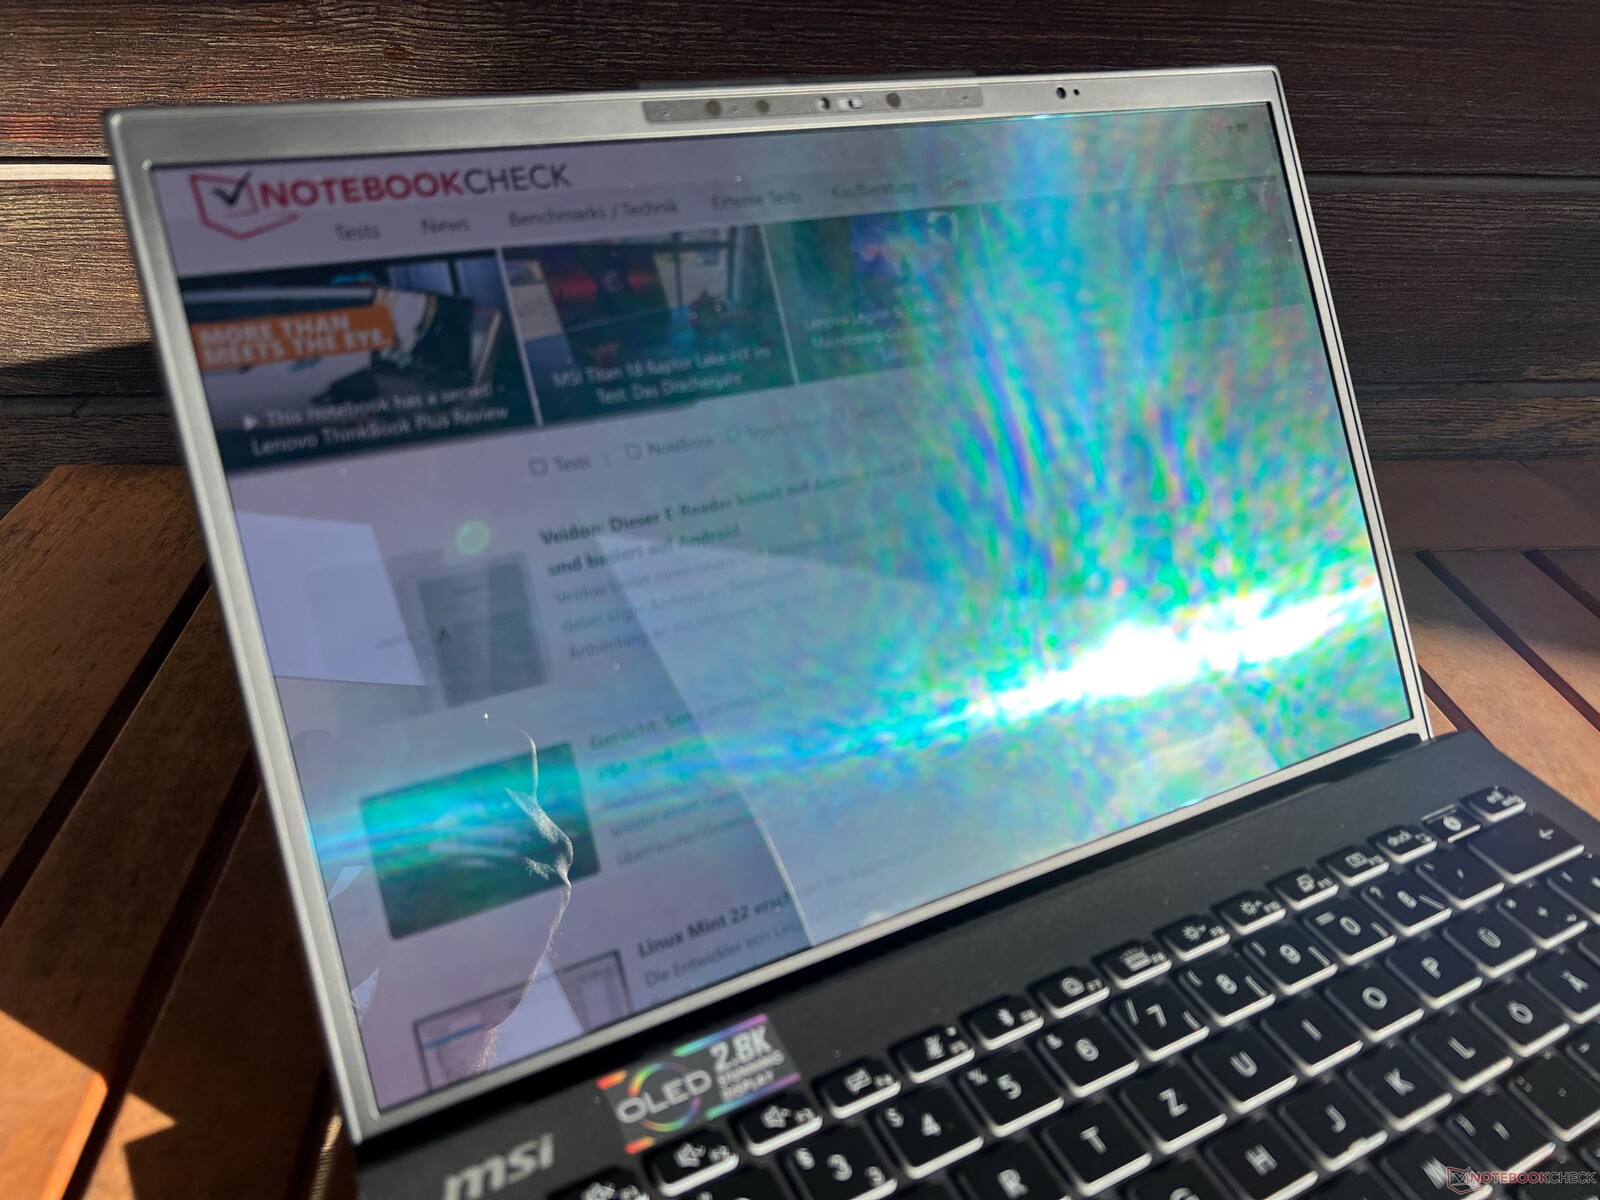
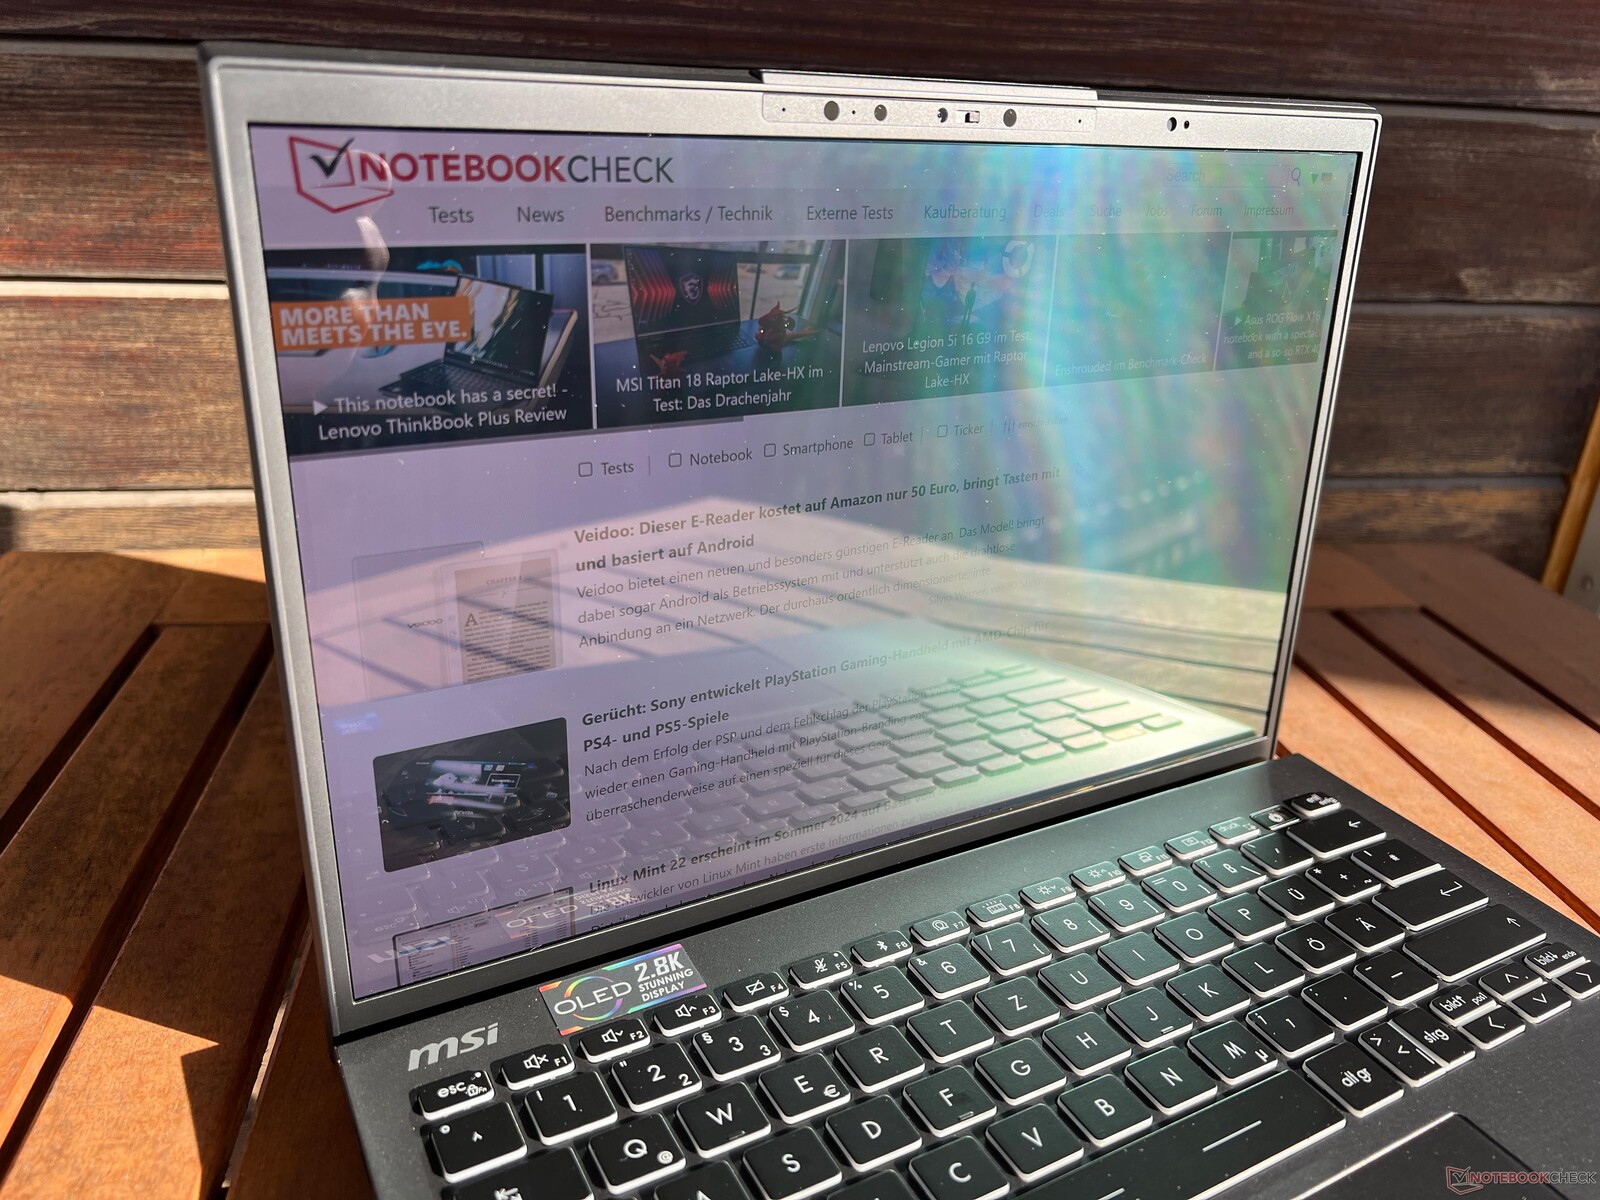
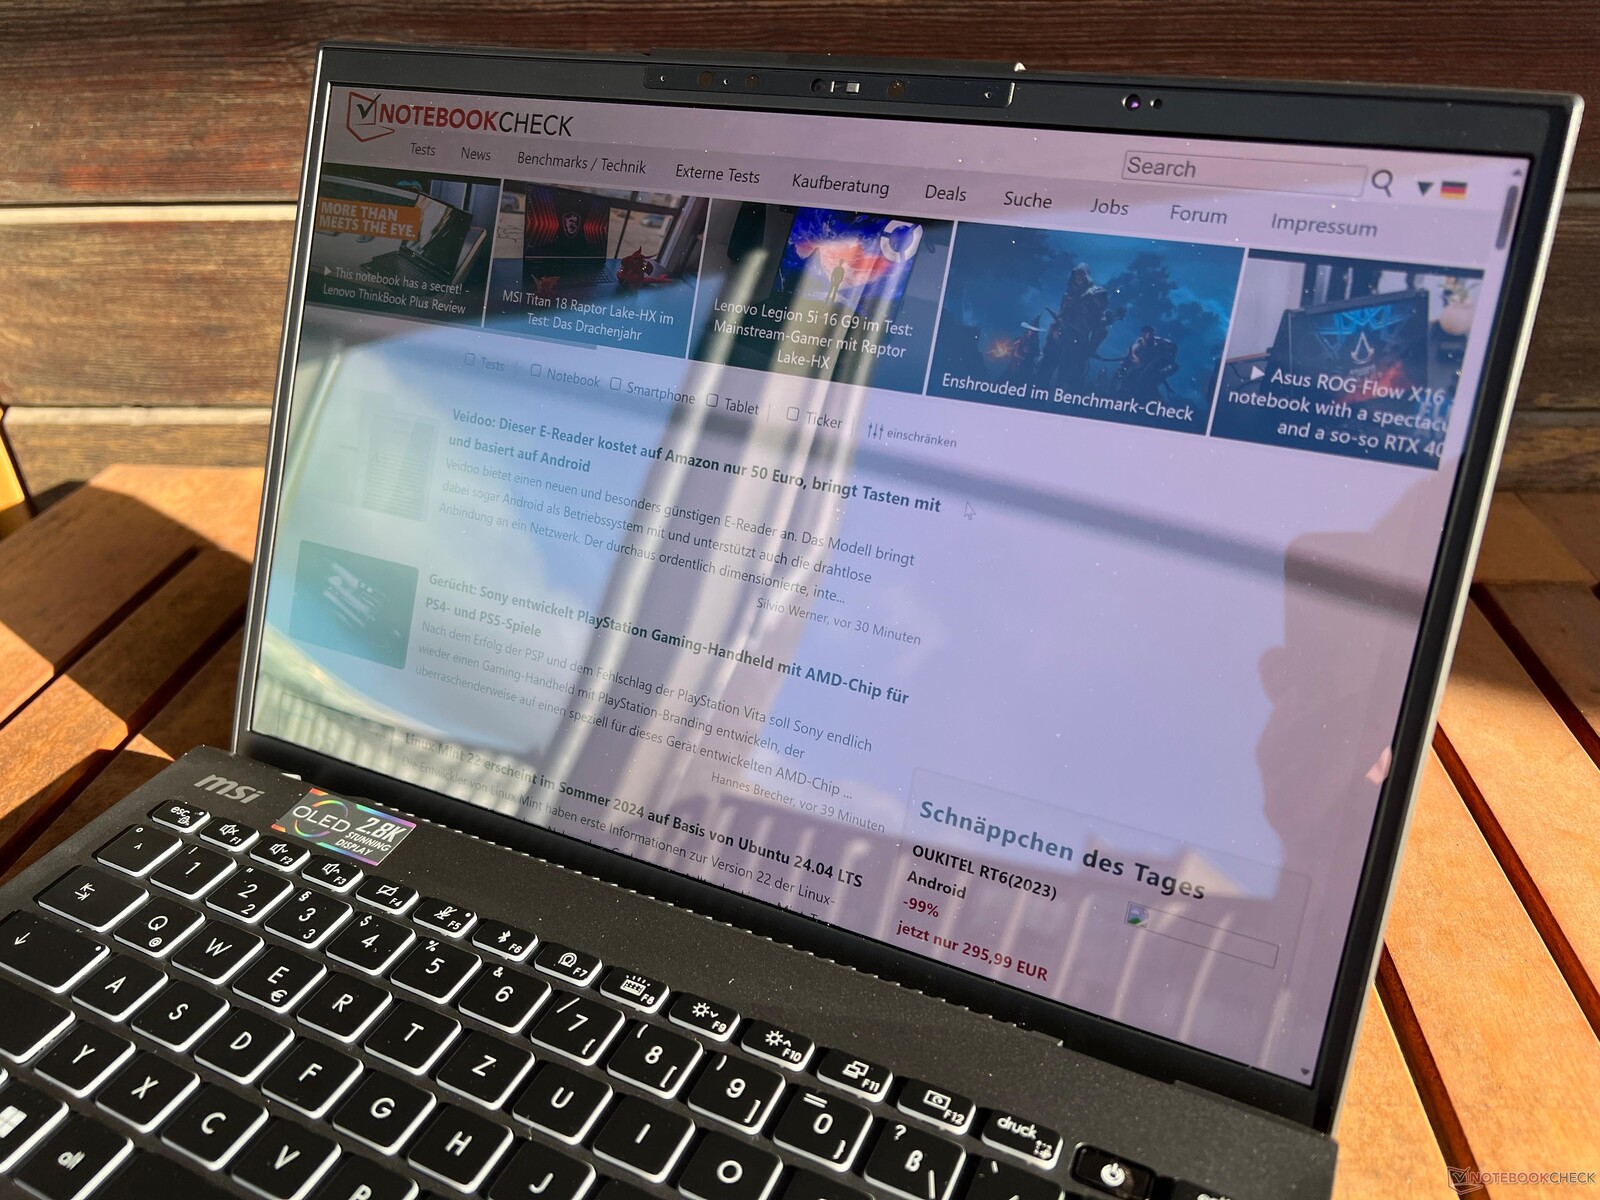
I ljusa miljöer blir reflexer snabbt ett problem på den blanka displayen. Betraktningsvinkelstabiliteten är mycket bra - endast extrema vinklar resulterar i det OLED-typiska blå skimret.

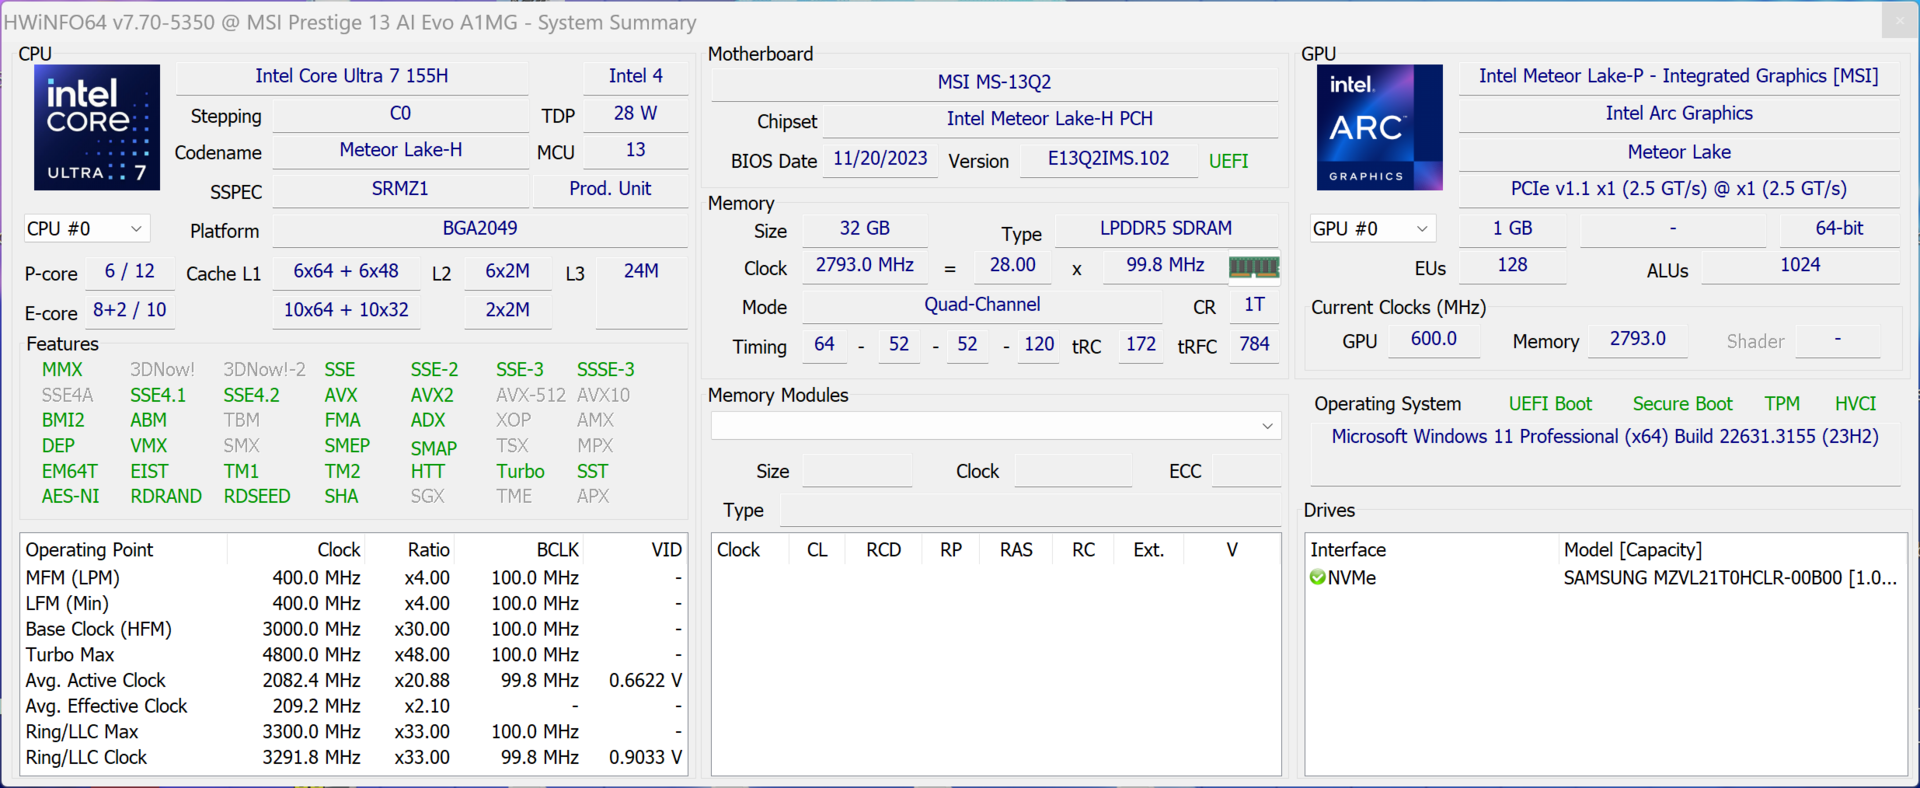
Prestanda - Meteor Lake-H vid 20 watt
Villkor för testning
Det förinstallerade MSI Center erbjuder flera energiprofiler, varvid vi inte noterade några stora skillnader mellan de enskilda profilerna (med undantag för tyst läge). Därefter utförde vi följande riktmärken och mätningar med läget MSI AI Engine, som också är inställt som standard.
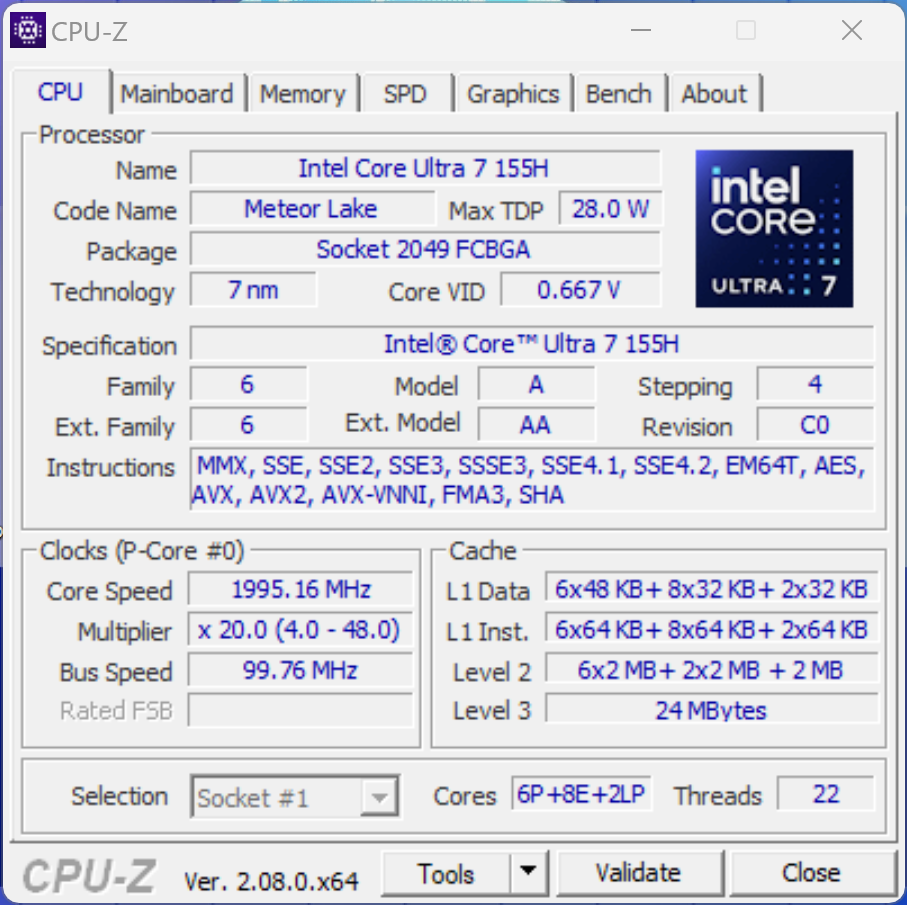
Processor - Core Ultra 7 155H
MSI har utrustat den bärbara datorn med den nya Meteor-Lake Core Ultra 7 155H från Intel, som kan användas i ett TDP-område mellan 28 och 115 watt. När det gäller Prestige 13 noterade vi ett maximum på 64 watt i cirka 30 sekunder när enheten var sval, varefter förbrukningen sjönk till 20 watt. En processor i U-serien skulle sannolikt ha varit ett bättre val, men eftersom dessa processorer endast har 2 snabba P-kärnor är deras prestanda ganska blygsamma. Under kortvarig belastning (vilket är mycket mer troligt på en subnotebook) är dess flerkärniga prestanda naturligtvis mycket bra. Dess single-core prestanda är okej men i denna aspekt visar inte Meteor-Lake-processorerna någon fördel jämfört med de gamla Raptor-Lake-modellerna. Vid batterianvändning förblir CPU-prestandan konstant. Ytterligare CPU-riktmärken kan hittas här.
Cinebench R15 Multi continuous test
Cinebench R23: Multi Core | Single Core
Cinebench R20: CPU (Multi Core) | CPU (Single Core)
Cinebench R15: CPU Multi 64Bit | CPU Single 64Bit
Blender: v2.79 BMW27 CPU
7-Zip 18.03: 7z b 4 | 7z b 4 -mmt1
Geekbench 6.7: Multi-Core | Single-Core
Geekbench 5.5: Multi-Core | Single-Core
HWBOT x265 Benchmark v2.2: 4k Preset
LibreOffice : 20 Documents To PDF
R Benchmark 2.5: Overall mean
| CPU Performance rating | |
| Genomsnitt Intel Core Ultra 7 155H | |
| Genomsnitt av klass Subnotebook | |
| MSI Prestige 13 AI Evo | |
| Lenovo ThinkPad X1 Nano Gen 3 | |
| HP Dragonfly G4 -2! | |
| Asus ZenBook S13 OLED UX5304 -2! | |
| Dell Latitude 13 7340 i5-1345U -2! | |
| Cinebench R23 / Multi Core | |
| Genomsnitt Intel Core Ultra 7 155H (9769 - 19007, n=52) | |
| Genomsnitt av klass Subnotebook (1555 - 21812, n=60, senaste 2 åren) | |
| MSI Prestige 13 AI Evo | |
| Lenovo ThinkPad X1 Nano Gen 3 | |
| Dell Latitude 13 7340 i5-1345U | |
| HP Dragonfly G4 | |
| Asus ZenBook S13 OLED UX5304 | |
| Cinebench R23 / Single Core | |
| HP Dragonfly G4 | |
| Genomsnitt av klass Subnotebook (358 - 2213, n=61, senaste 2 åren) | |
| Asus ZenBook S13 OLED UX5304 | |
| Genomsnitt Intel Core Ultra 7 155H (1496 - 1815, n=52) | |
| Dell Latitude 13 7340 i5-1345U | |
| Lenovo ThinkPad X1 Nano Gen 3 | |
| MSI Prestige 13 AI Evo | |
| Cinebench R20 / CPU (Multi Core) | |
| Genomsnitt Intel Core Ultra 7 155H (3798 - 7409, n=50) | |
| Genomsnitt av klass Subnotebook (579 - 8541, n=57, senaste 2 åren) | |
| MSI Prestige 13 AI Evo | |
| Lenovo ThinkPad X1 Nano Gen 3 | |
| Dell Latitude 13 7340 i5-1345U | |
| HP Dragonfly G4 | |
| Asus ZenBook S13 OLED UX5304 | |
| Cinebench R20 / CPU (Single Core) | |
| HP Dragonfly G4 | |
| Asus ZenBook S13 OLED UX5304 | |
| Lenovo ThinkPad X1 Nano Gen 3 | |
| Genomsnitt Intel Core Ultra 7 155H (601 - 696, n=50) | |
| Dell Latitude 13 7340 i5-1345U | |
| Genomsnitt av klass Subnotebook (128 - 832, n=57, senaste 2 åren) | |
| MSI Prestige 13 AI Evo | |
| Cinebench R15 / CPU Multi 64Bit | |
| Genomsnitt Intel Core Ultra 7 155H (1932 - 2880, n=56) | |
| MSI Prestige 13 AI Evo | |
| Genomsnitt av klass Subnotebook (327 - 3345, n=57, senaste 2 åren) | |
| Lenovo ThinkPad X1 Nano Gen 3 | |
| Asus ZenBook S13 OLED UX5304 | |
| HP Dragonfly G4 | |
| Dell Latitude 13 7340 i5-1345U | |
| Cinebench R15 / CPU Single 64Bit | |
| Genomsnitt av klass Subnotebook (72.4 - 322, n=57, senaste 2 åren) | |
| HP Dragonfly G4 | |
| Genomsnitt Intel Core Ultra 7 155H (99.6 - 268, n=52) | |
| Asus ZenBook S13 OLED UX5304 | |
| MSI Prestige 13 AI Evo | |
| Dell Latitude 13 7340 i5-1345U | |
| Lenovo ThinkPad X1 Nano Gen 3 | |
| Blender / v2.79 BMW27 CPU | |
| Dell Latitude 13 7340 i5-1345U | |
| Asus ZenBook S13 OLED UX5304 | |
| Asus ZenBook S13 OLED UX5304 | |
| HP Dragonfly G4 | |
| Lenovo ThinkPad X1 Nano Gen 3 | |
| Genomsnitt av klass Subnotebook (159 - 2271, n=58, senaste 2 åren) | |
| MSI Prestige 13 AI Evo | |
| Genomsnitt Intel Core Ultra 7 155H (175 - 381, n=47) | |
| 7-Zip 18.03 / 7z b 4 | |
| Genomsnitt Intel Core Ultra 7 155H (41739 - 70254, n=50) | |
| Genomsnitt av klass Subnotebook (11668 - 77867, n=57, senaste 2 åren) | |
| MSI Prestige 13 AI Evo | |
| HP Dragonfly G4 | |
| Lenovo ThinkPad X1 Nano Gen 3 | |
| Asus ZenBook S13 OLED UX5304 | |
| Dell Latitude 13 7340 i5-1345U | |
| 7-Zip 18.03 / 7z b 4 -mmt1 | |
| HP Dragonfly G4 | |
| Lenovo ThinkPad X1 Nano Gen 3 | |
| Asus ZenBook S13 OLED UX5304 | |
| Genomsnitt av klass Subnotebook (2643 - 6699, n=59, senaste 2 åren) | |
| MSI Prestige 13 AI Evo | |
| Genomsnitt Intel Core Ultra 7 155H (4594 - 5621, n=50) | |
| Dell Latitude 13 7340 i5-1345U | |
| Geekbench 6.7 / Multi-Core | |
| Genomsnitt av klass Subnotebook (2244 - 20325, n=63, senaste 2 åren) | |
| Genomsnitt Intel Core Ultra 7 155H (7732 - 13656, n=55) | |
| Lenovo ThinkPad X1 Nano Gen 3 | |
| MSI Prestige 13 AI Evo | |
| Geekbench 6.7 / Single-Core | |
| Genomsnitt av klass Subnotebook (960 - 4195, n=62, senaste 2 åren) | |
| Lenovo ThinkPad X1 Nano Gen 3 | |
| MSI Prestige 13 AI Evo | |
| Genomsnitt Intel Core Ultra 7 155H (1901 - 2473, n=52) | |
| Geekbench 5.5 / Multi-Core | |
| Genomsnitt Intel Core Ultra 7 155H (10017 - 13556, n=52) | |
| Genomsnitt av klass Subnotebook (2557 - 17218, n=48, senaste 2 åren) | |
| MSI Prestige 13 AI Evo | |
| Lenovo ThinkPad X1 Nano Gen 3 | |
| HP Dragonfly G4 | |
| Asus ZenBook S13 OLED UX5304 | |
| Dell Latitude 13 7340 i5-1345U | |
| Geekbench 5.5 / Single-Core | |
| Genomsnitt av klass Subnotebook (726 - 2224, n=48, senaste 2 åren) | |
| HP Dragonfly G4 | |
| Lenovo ThinkPad X1 Nano Gen 3 | |
| Asus ZenBook S13 OLED UX5304 | |
| MSI Prestige 13 AI Evo | |
| Genomsnitt Intel Core Ultra 7 155H (1462 - 1824, n=52) | |
| Dell Latitude 13 7340 i5-1345U | |
| HWBOT x265 Benchmark v2.2 / 4k Preset | |
| Genomsnitt Intel Core Ultra 7 155H (9.93 - 21.2, n=50) | |
| Genomsnitt av klass Subnotebook (0.97 - 25.1, n=57, senaste 2 åren) | |
| MSI Prestige 13 AI Evo | |
| Lenovo ThinkPad X1 Nano Gen 3 | |
| HP Dragonfly G4 | |
| Asus ZenBook S13 OLED UX5304 | |
| Dell Latitude 13 7340 i5-1345U | |
| LibreOffice / 20 Documents To PDF | |
| Genomsnitt av klass Subnotebook (39.9 - 220, n=56, senaste 2 åren) | |
| Lenovo ThinkPad X1 Nano Gen 3 | |
| Genomsnitt Intel Core Ultra 7 155H (37.5 - 79.2, n=49) | |
| Asus ZenBook S13 OLED UX5304 | |
| HP Dragonfly G4 | |
| MSI Prestige 13 AI Evo | |
| Dell Latitude 13 7340 i5-1345U | |
| R Benchmark 2.5 / Overall mean | |
| Genomsnitt av klass Subnotebook (0.4024 - 1.456, n=58, senaste 2 åren) | |
| Dell Latitude 13 7340 i5-1345U | |
| Lenovo ThinkPad X1 Nano Gen 3 | |
| Genomsnitt Intel Core Ultra 7 155H (0.4457 - 0.53, n=49) | |
| Asus ZenBook S13 OLED UX5304 | |
| MSI Prestige 13 AI Evo | |
| HP Dragonfly G4 | |
* ... mindre är bättre
AIDA64: FP32 Ray-Trace | FPU Julia | CPU SHA3 | CPU Queen | FPU SinJulia | FPU Mandel | CPU AES | CPU ZLib | FP64 Ray-Trace | CPU PhotoWorxx
| Performance rating | |
| Genomsnitt Intel Core Ultra 7 155H | |
| Genomsnitt av klass Subnotebook | |
| MSI Prestige 13 AI Evo | |
| Lenovo ThinkPad X1 Nano Gen 3 | |
| HP Dragonfly G4 | |
| Asus ZenBook S13 OLED UX5304 | |
| Dell Latitude 13 7340 i5-1345U | |
| AIDA64 / FP32 Ray-Trace | |
| Genomsnitt av klass Subnotebook (1135 - 32888, n=58, senaste 2 åren) | |
| Genomsnitt Intel Core Ultra 7 155H (6670 - 18470, n=50) | |
| Lenovo ThinkPad X1 Nano Gen 3 | |
| HP Dragonfly G4 | |
| MSI Prestige 13 AI Evo | |
| Asus ZenBook S13 OLED UX5304 | |
| Dell Latitude 13 7340 i5-1345U | |
| AIDA64 / FPU Julia | |
| Genomsnitt Intel Core Ultra 7 155H (40905 - 93181, n=50) | |
| Genomsnitt av klass Subnotebook (5218 - 123315, n=58, senaste 2 åren) | |
| MSI Prestige 13 AI Evo | |
| Lenovo ThinkPad X1 Nano Gen 3 | |
| HP Dragonfly G4 | |
| Asus ZenBook S13 OLED UX5304 | |
| Dell Latitude 13 7340 i5-1345U | |
| AIDA64 / CPU SHA3 | |
| Genomsnitt Intel Core Ultra 7 155H (1940 - 4436, n=50) | |
| Genomsnitt av klass Subnotebook (444 - 5287, n=58, senaste 2 åren) | |
| MSI Prestige 13 AI Evo | |
| Lenovo ThinkPad X1 Nano Gen 3 | |
| HP Dragonfly G4 | |
| Asus ZenBook S13 OLED UX5304 | |
| Dell Latitude 13 7340 i5-1345U | |
| AIDA64 / CPU Queen | |
| Lenovo ThinkPad X1 Nano Gen 3 | |
| Genomsnitt Intel Core Ultra 7 155H (64698 - 94181, n=50) | |
| HP Dragonfly G4 | |
| Asus ZenBook S13 OLED UX5304 | |
| MSI Prestige 13 AI Evo | |
| Dell Latitude 13 7340 i5-1345U | |
| Genomsnitt av klass Subnotebook (10579 - 95002, n=49, senaste 2 åren) | |
| AIDA64 / FPU SinJulia | |
| Genomsnitt Intel Core Ultra 7 155H (5639 - 10647, n=50) | |
| Genomsnitt av klass Subnotebook (744 - 18418, n=58, senaste 2 åren) | |
| MSI Prestige 13 AI Evo | |
| Lenovo ThinkPad X1 Nano Gen 3 | |
| HP Dragonfly G4 | |
| Asus ZenBook S13 OLED UX5304 | |
| Dell Latitude 13 7340 i5-1345U | |
| AIDA64 / FPU Mandel | |
| Genomsnitt Intel Core Ultra 7 155H (18236 - 47685, n=50) | |
| Genomsnitt av klass Subnotebook (3341 - 65433, n=58, senaste 2 åren) | |
| MSI Prestige 13 AI Evo | |
| Lenovo ThinkPad X1 Nano Gen 3 | |
| HP Dragonfly G4 | |
| Asus ZenBook S13 OLED UX5304 | |
| Dell Latitude 13 7340 i5-1345U | |
| AIDA64 / CPU AES | |
| Genomsnitt Intel Core Ultra 7 155H (45713 - 152179, n=50) | |
| Genomsnitt av klass Subnotebook (638 - 96917, n=58, senaste 2 åren) | |
| MSI Prestige 13 AI Evo | |
| Lenovo ThinkPad X1 Nano Gen 3 | |
| HP Dragonfly G4 | |
| Asus ZenBook S13 OLED UX5304 | |
| Dell Latitude 13 7340 i5-1345U | |
| AIDA64 / CPU ZLib | |
| Genomsnitt Intel Core Ultra 7 155H (557 - 1250, n=50) | |
| Genomsnitt av klass Subnotebook (164.9 - 1379, n=58, senaste 2 åren) | |
| MSI Prestige 13 AI Evo | |
| Lenovo ThinkPad X1 Nano Gen 3 | |
| HP Dragonfly G4 | |
| Asus ZenBook S13 OLED UX5304 | |
| Dell Latitude 13 7340 i5-1345U | |
| AIDA64 / FP64 Ray-Trace | |
| Genomsnitt av klass Subnotebook (610 - 17495, n=58, senaste 2 åren) | |
| Genomsnitt Intel Core Ultra 7 155H (3569 - 9802, n=50) | |
| Lenovo ThinkPad X1 Nano Gen 3 | |
| MSI Prestige 13 AI Evo | |
| HP Dragonfly G4 | |
| Asus ZenBook S13 OLED UX5304 | |
| Dell Latitude 13 7340 i5-1345U | |
| AIDA64 / CPU PhotoWorxx | |
| Genomsnitt av klass Subnotebook (6569 - 85600, n=58, senaste 2 åren) | |
| Genomsnitt Intel Core Ultra 7 155H (32719 - 54223, n=50) | |
| Lenovo ThinkPad X1 Nano Gen 3 | |
| MSI Prestige 13 AI Evo | |
| Asus ZenBook S13 OLED UX5304 | |
| HP Dragonfly G4 | |
| Dell Latitude 13 7340 i5-1345U | |
Systemets prestanda
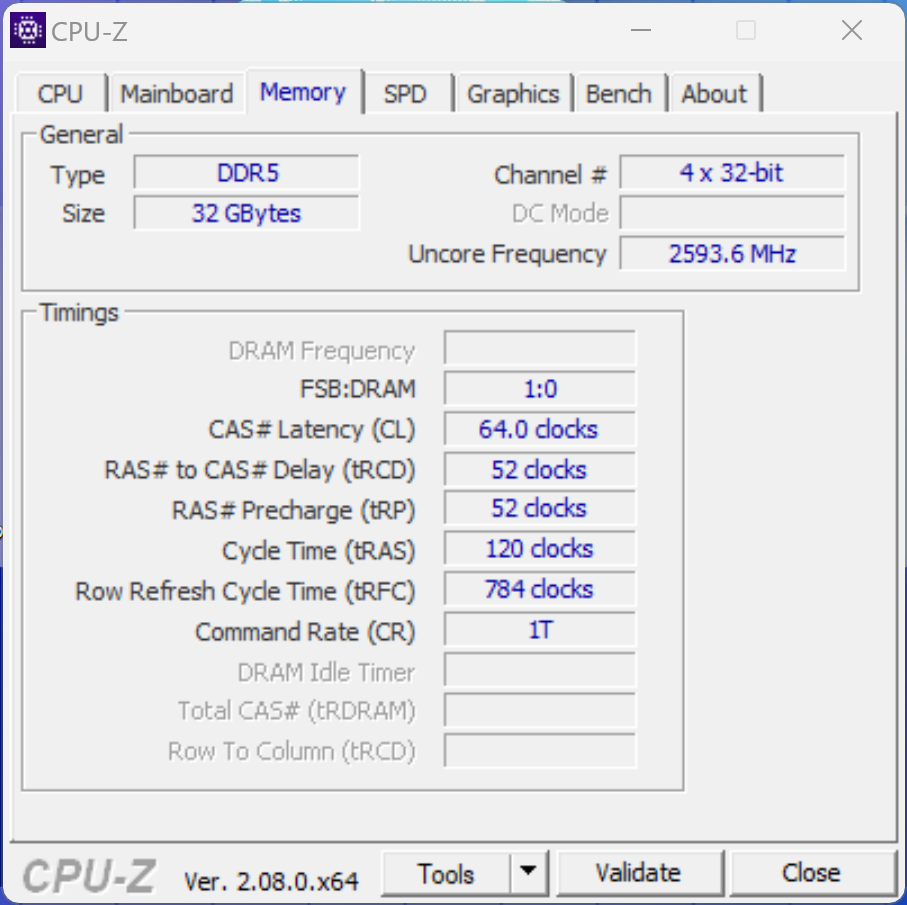
I vardagen är den kompakta Prestige 13 en snabb och snabbreagerande följeslagare, vilket delvis beror på dess SSD-lagring. RAM-konfigurationen för vårt testexemplar är 32 GB, vilket bör vara mer än tillräckligt för användare under de kommande åren. Under våra tester hade vi aldrig några problem med systemets stabilitet.
CrossMark: Overall | Productivity | Creativity | Responsiveness
WebXPRT 3: Overall
WebXPRT 4: Overall
Mozilla Kraken 1.1: Total
| PCMark 10 / Score | |
| Genomsnitt av klass Subnotebook (4920 - 9939, n=45, senaste 2 åren) | |
| Genomsnitt Intel Core Ultra 7 155H, Intel Arc 8-Core iGPU (4809 - 7529, n=34) | |
| MSI Prestige 13 AI Evo | |
| Lenovo ThinkPad X1 Nano Gen 3 | |
| HP Dragonfly G4 | |
| Asus ZenBook S13 OLED UX5304 | |
| Dell Latitude 13 7340 i5-1345U | |
| PCMark 10 / Essentials | |
| HP Dragonfly G4 | |
| Lenovo ThinkPad X1 Nano Gen 3 | |
| Asus ZenBook S13 OLED UX5304 | |
| Genomsnitt Intel Core Ultra 7 155H, Intel Arc 8-Core iGPU (7605 - 11289, n=34) | |
| Genomsnitt av klass Subnotebook (8552 - 11646, n=45, senaste 2 åren) | |
| Dell Latitude 13 7340 i5-1345U | |
| MSI Prestige 13 AI Evo | |
| PCMark 10 / Productivity | |
| Genomsnitt av klass Subnotebook (5435 - 16606, n=45, senaste 2 åren) | |
| Genomsnitt Intel Core Ultra 7 155H, Intel Arc 8-Core iGPU (6042 - 10591, n=34) | |
| MSI Prestige 13 AI Evo | |
| Lenovo ThinkPad X1 Nano Gen 3 | |
| HP Dragonfly G4 | |
| Asus ZenBook S13 OLED UX5304 | |
| Dell Latitude 13 7340 i5-1345U | |
| PCMark 10 / Digital Content Creation | |
| Genomsnitt av klass Subnotebook (5722 - 13779, n=45, senaste 2 åren) | |
| Genomsnitt Intel Core Ultra 7 155H, Intel Arc 8-Core iGPU (4985 - 10709, n=34) | |
| MSI Prestige 13 AI Evo | |
| Lenovo ThinkPad X1 Nano Gen 3 | |
| HP Dragonfly G4 | |
| Asus ZenBook S13 OLED UX5304 | |
| Dell Latitude 13 7340 i5-1345U | |
| CrossMark / Overall | |
| Lenovo ThinkPad X1 Nano Gen 3 | |
| Genomsnitt av klass Subnotebook (365 - 2356, n=60, senaste 2 åren) | |
| Genomsnitt Intel Core Ultra 7 155H, Intel Arc 8-Core iGPU (1366 - 1903, n=34) | |
| HP Dragonfly G4 | |
| Asus ZenBook S13 OLED UX5304 | |
| Dell Latitude 13 7340 i5-1345U | |
| MSI Prestige 13 AI Evo | |
| CrossMark / Productivity | |
| Lenovo ThinkPad X1 Nano Gen 3 | |
| HP Dragonfly G4 | |
| Genomsnitt Intel Core Ultra 7 155H, Intel Arc 8-Core iGPU (1291 - 1798, n=33) | |
| Genomsnitt av klass Subnotebook (364 - 2277, n=60, senaste 2 åren) | |
| Asus ZenBook S13 OLED UX5304 | |
| Dell Latitude 13 7340 i5-1345U | |
| MSI Prestige 13 AI Evo | |
| CrossMark / Creativity | |
| Lenovo ThinkPad X1 Nano Gen 3 | |
| Genomsnitt av klass Subnotebook (372 - 2743, n=60, senaste 2 åren) | |
| Genomsnitt Intel Core Ultra 7 155H, Intel Arc 8-Core iGPU (1519 - 1929, n=33) | |
| HP Dragonfly G4 | |
| Asus ZenBook S13 OLED UX5304 | |
| Dell Latitude 13 7340 i5-1345U | |
| MSI Prestige 13 AI Evo | |
| CrossMark / Responsiveness | |
| Lenovo ThinkPad X1 Nano Gen 3 | |
| Genomsnitt Intel Core Ultra 7 155H, Intel Arc 8-Core iGPU (939 - 1802, n=33) | |
| Asus ZenBook S13 OLED UX5304 | |
| HP Dragonfly G4 | |
| Genomsnitt av klass Subnotebook (312 - 1854, n=60, senaste 2 åren) | |
| Dell Latitude 13 7340 i5-1345U | |
| MSI Prestige 13 AI Evo | |
| WebXPRT 3 / Overall | |
| Genomsnitt av klass Subnotebook (156 - 530, n=56, senaste 2 åren) | |
| Lenovo ThinkPad X1 Nano Gen 3 | |
| HP Dragonfly G4 | |
| Asus ZenBook S13 OLED UX5304 | |
| Genomsnitt Intel Core Ultra 7 155H, Intel Arc 8-Core iGPU (252 - 299, n=34) | |
| MSI Prestige 13 AI Evo | |
| WebXPRT 4 / Overall | |
| Genomsnitt av klass Subnotebook (132 - 378, n=61, senaste 2 åren) | |
| Lenovo ThinkPad X1 Nano Gen 3 | |
| HP Dragonfly G4 | |
| Asus ZenBook S13 OLED UX5304 | |
| Genomsnitt Intel Core Ultra 7 155H, Intel Arc 8-Core iGPU (166.4 - 309, n=29) | |
| MSI Prestige 13 AI Evo | |
| Mozilla Kraken 1.1 / Total | |
| Dell Latitude 13 7340 i5-1345U | |
| MSI Prestige 13 AI Evo | |
| Genomsnitt Intel Core Ultra 7 155H, Intel Arc 8-Core iGPU (517 - 614, n=35) | |
| Asus ZenBook S13 OLED UX5304 | |
| Lenovo ThinkPad X1 Nano Gen 3 | |
| HP Dragonfly G4 | |
| Genomsnitt av klass Subnotebook (234 - 1104, n=61, senaste 2 åren) | |
* ... mindre är bättre
| PCMark 10 Score | 5952 poäng | |
Hjälp | ||
| AIDA64 / Memory Copy | |
| Genomsnitt av klass Subnotebook (14554 - 131023, n=58, senaste 2 åren) | |
| Genomsnitt Intel Core Ultra 7 155H (62397 - 96791, n=50) | |
| MSI Prestige 13 AI Evo | |
| Lenovo ThinkPad X1 Nano Gen 3 | |
| Asus ZenBook S13 OLED UX5304 | |
| HP Dragonfly G4 | |
| Dell Latitude 13 7340 i5-1345U | |
| AIDA64 / Memory Read | |
| Genomsnitt av klass Subnotebook (15948 - 127174, n=58, senaste 2 åren) | |
| Genomsnitt Intel Core Ultra 7 155H (60544 - 90647, n=50) | |
| MSI Prestige 13 AI Evo | |
| Lenovo ThinkPad X1 Nano Gen 3 | |
| Asus ZenBook S13 OLED UX5304 | |
| HP Dragonfly G4 | |
| Dell Latitude 13 7340 i5-1345U | |
| AIDA64 / Memory Write | |
| Lenovo ThinkPad X1 Nano Gen 3 | |
| Genomsnitt av klass Subnotebook (15709 - 135141, n=58, senaste 2 åren) | |
| MSI Prestige 13 AI Evo | |
| Genomsnitt Intel Core Ultra 7 155H (58692 - 93451, n=50) | |
| Asus ZenBook S13 OLED UX5304 | |
| Dell Latitude 13 7340 i5-1345U | |
| HP Dragonfly G4 | |
| AIDA64 / Memory Latency | |
| MSI Prestige 13 AI Evo | |
| Genomsnitt Intel Core Ultra 7 155H (116.2 - 233, n=50) | |
| Dell Latitude 13 7340 i5-1345U | |
| Genomsnitt av klass Subnotebook (6.1 - 159.9, n=56, senaste 2 åren) | |
| Lenovo ThinkPad X1 Nano Gen 3 | |
| HP Dragonfly G4 | |
| Asus ZenBook S13 OLED UX5304 | |
* ... mindre är bättre
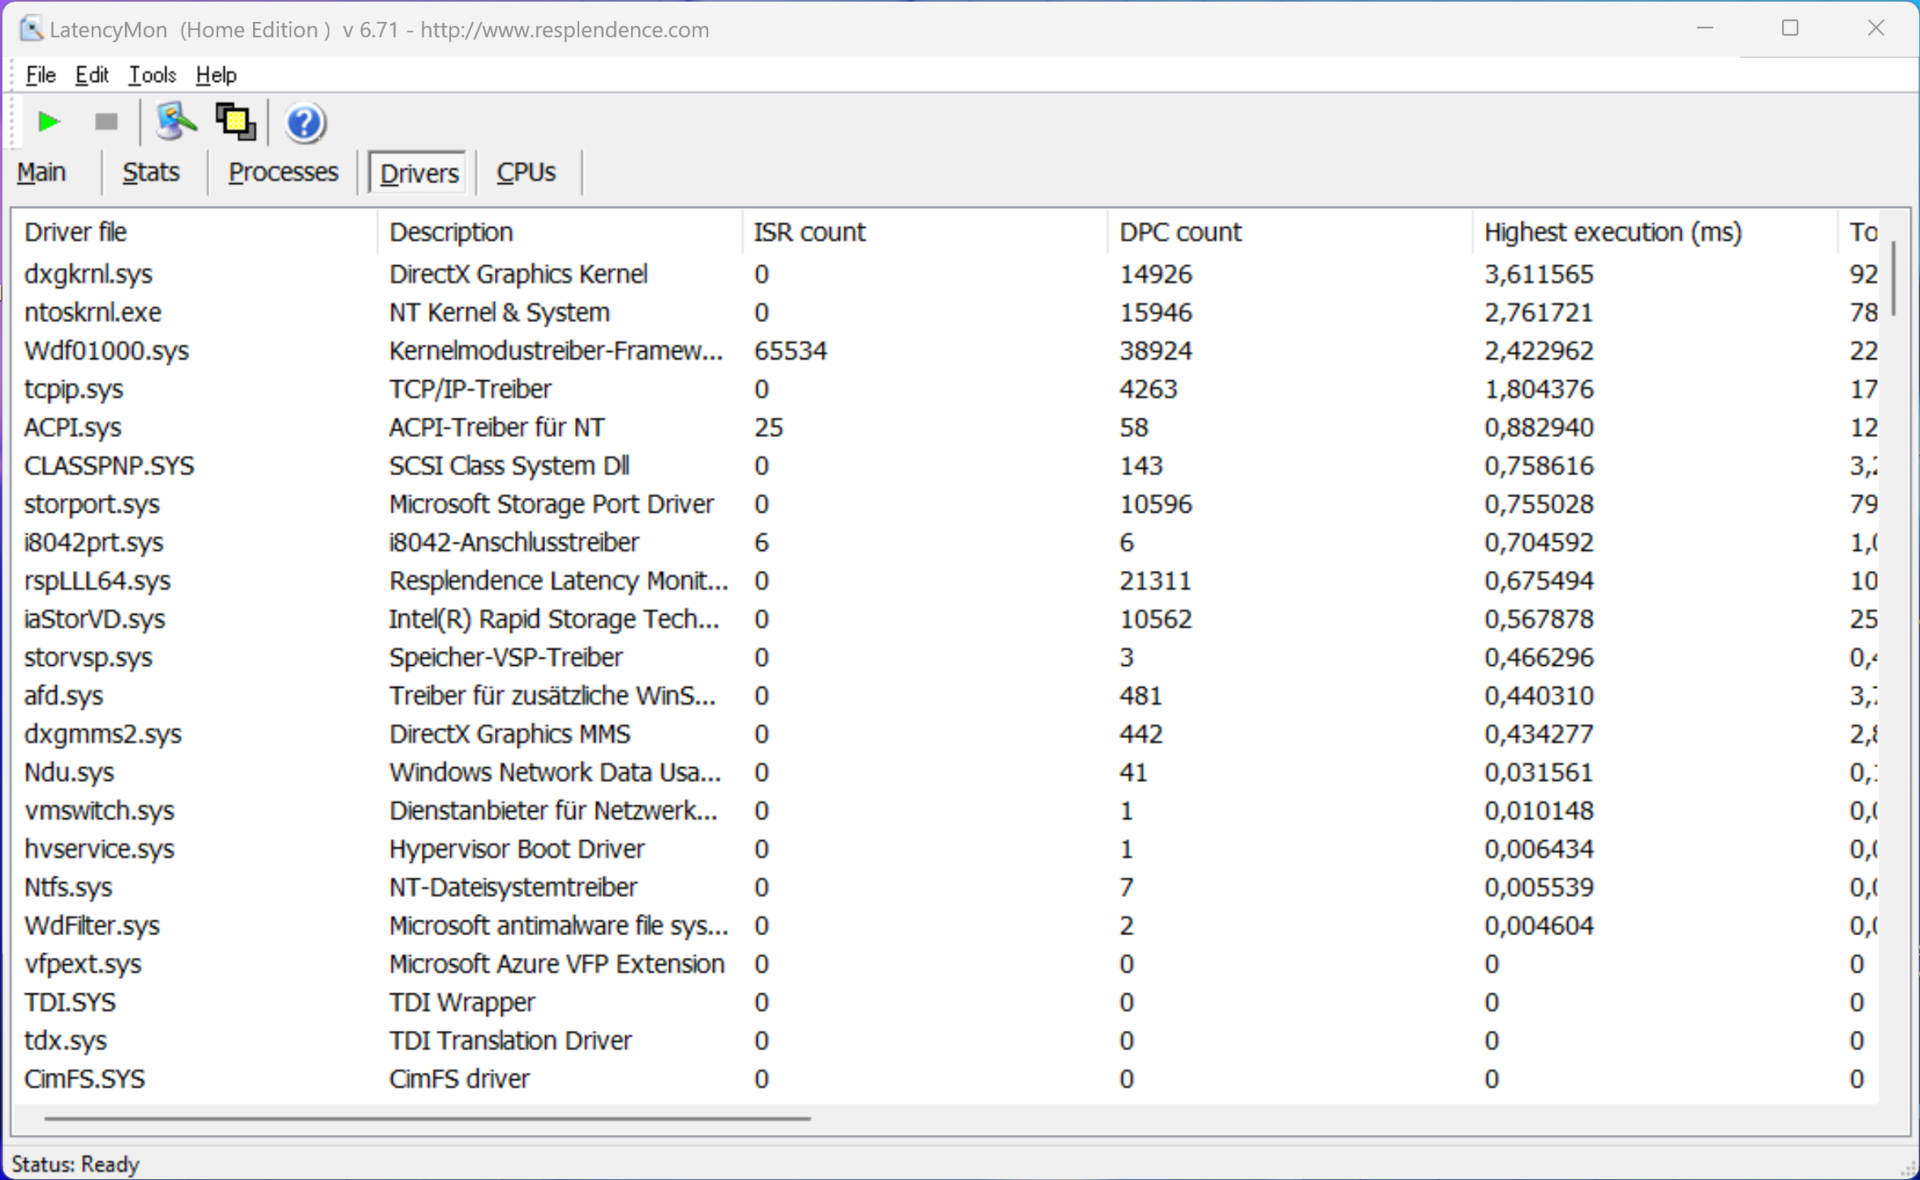
DPC-fördröjning
I vårt standardiserade latens-test (surfa på webben, 4K YouTube-uppspelning, CPU-belastning) visade testenheten med den aktuella BIOS-versionen vissa begränsningar vid användning av ljudapplikationer i realtid.
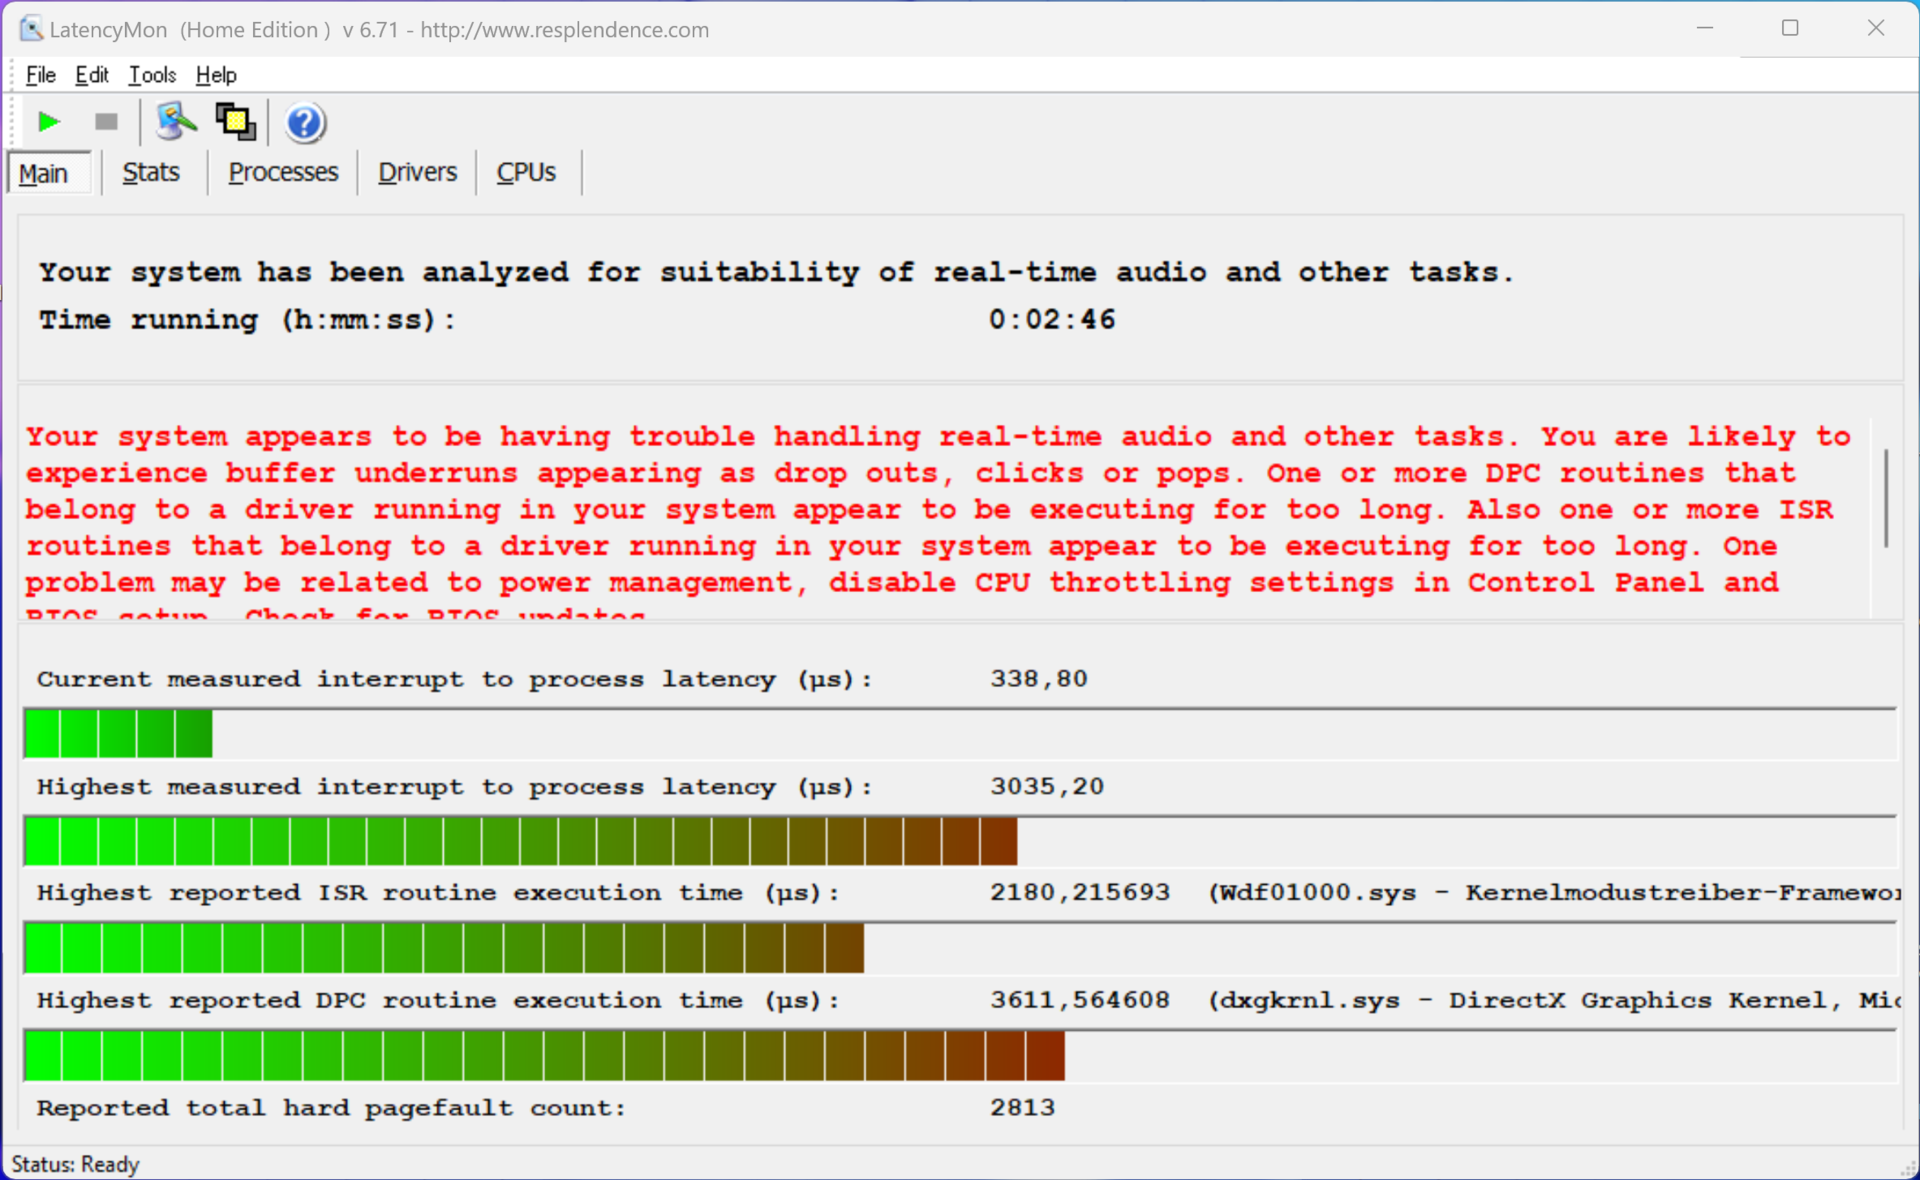
| DPC Latencies / LatencyMon - interrupt to process latency (max), Web, Youtube, Prime95 | |
| MSI Prestige 13 AI Evo | |
| Lenovo ThinkPad X1 Nano Gen 3 | |
| Dell Latitude 13 7340 i5-1345U | |
| Asus ZenBook S13 OLED UX5304 | |
| HP Dragonfly G4 | |
* ... mindre är bättre
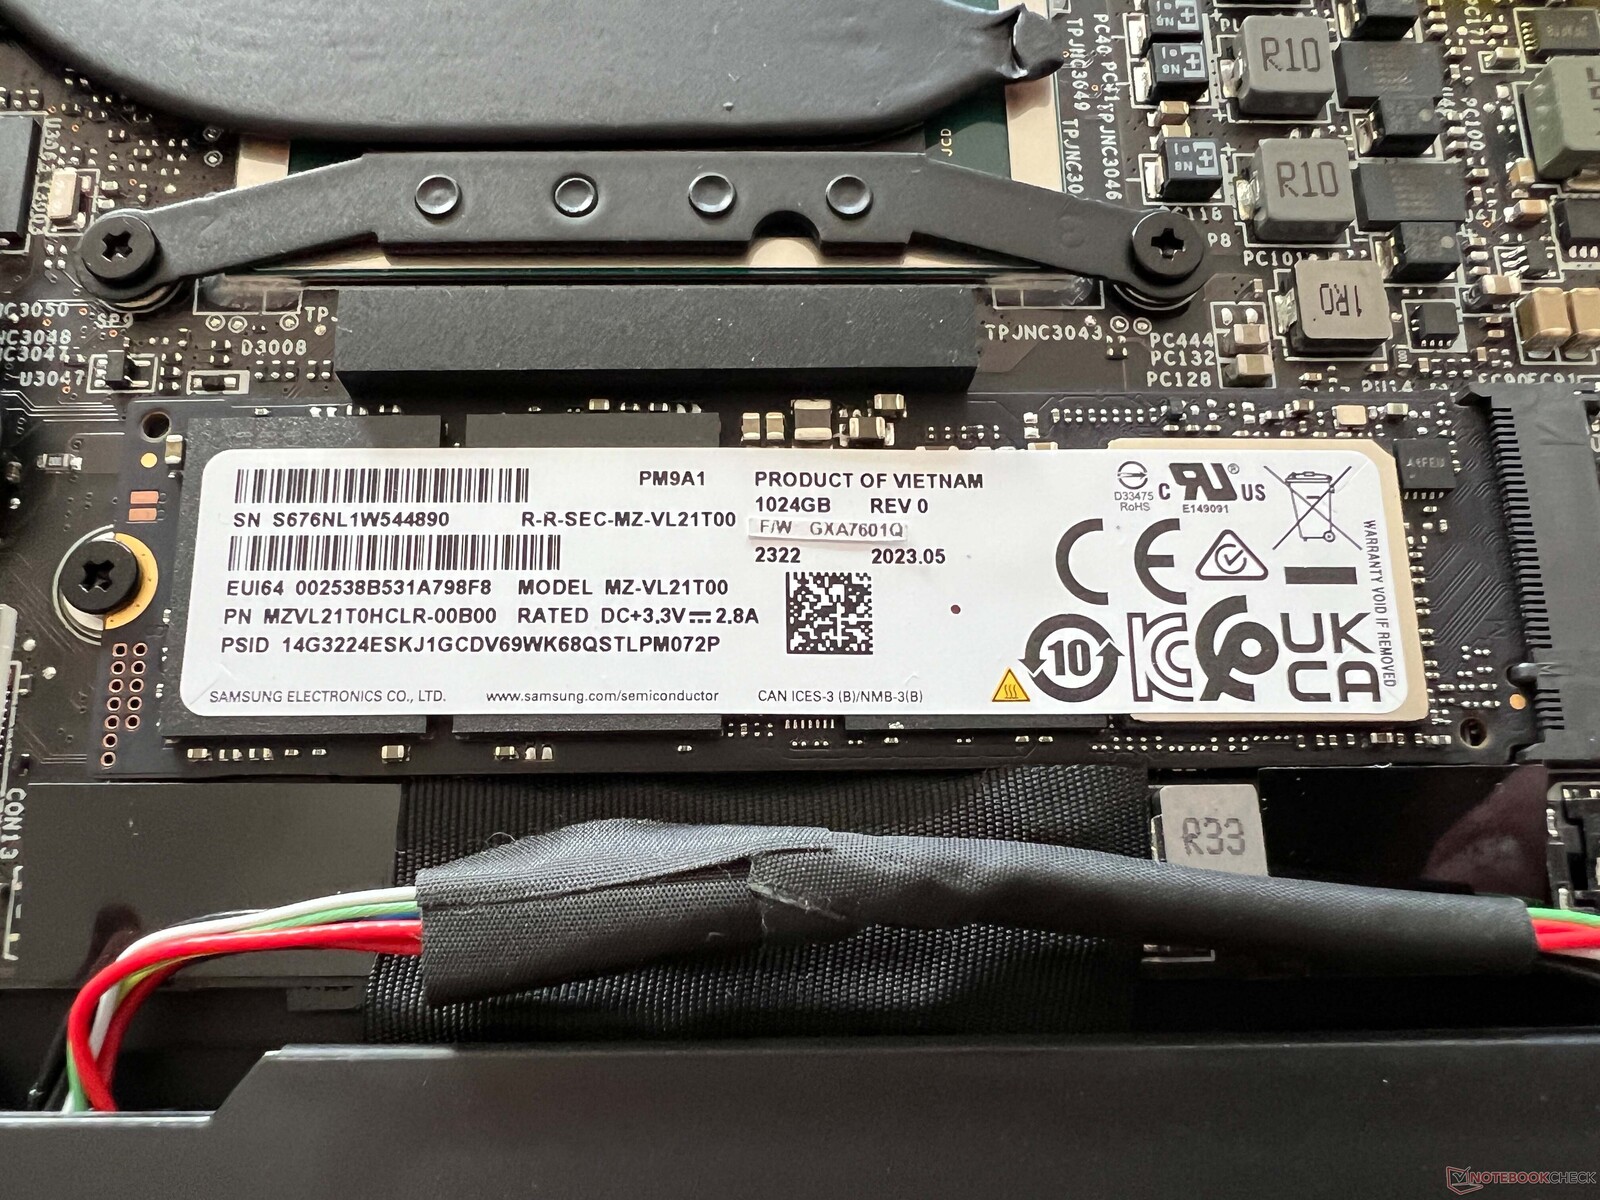
Lagringsenheter
Vår testenhet är utrustad med 1-TB-versionen av Samsung PM9A1 (OEM-versionen av 980 Pro), vilket är en mycket snabb lagringsenhet. Dess prestanda förblir dock inte konstant under permanent belastning, men detta bör inte utgöra några problem under daglig användning. Efter den första uppstarten av enheten har användarna 864 GB fritt att använda. Ytterligare SSD-riktmärken kan hittas här.

* ... mindre är bättre
Reading continuous performance: DiskSpd Read Loop, Queue Depth 8
Grafikkort
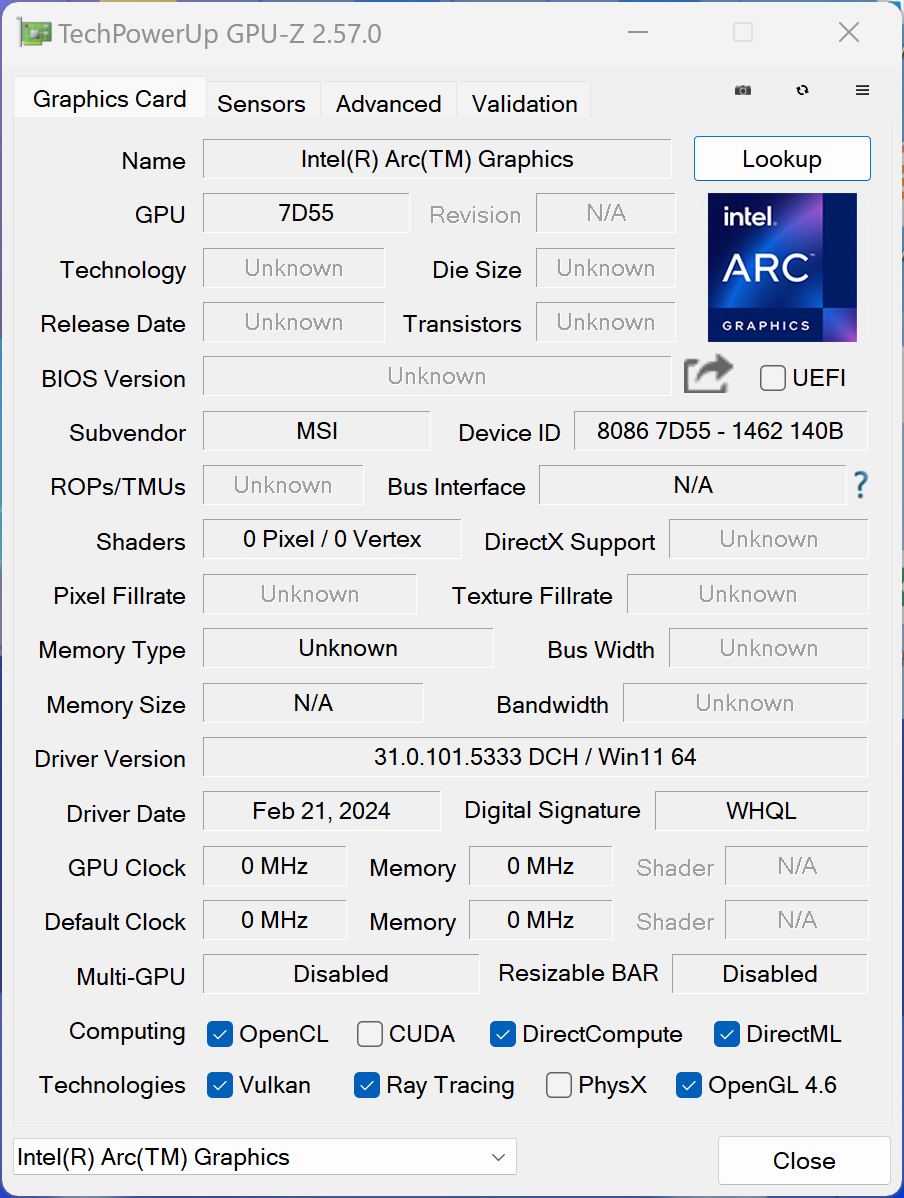
I kombination med Core Ultra 7 155H, den nya Intel Arc Graphics erbjuder 8 Xe-kärnor, men dess totala grafikprestanda inom MSI Prestige 13 var den sämsta av alla nya bärbara datorer från Meteor-Lake som vi har testat hittills (-32 % jämfört med genomsnittet i vår databas). Även under de syntetiska riktmärkena kom MSI bara något före den gamla Iris Xe Graphics G7. När det gäller vardagliga uppgifter som att spela upp högupplösta videor har MSI inga problem, men det kan helt enkelt inte använda den nya iGPU:n till sin fulla potential.
Vi vill nämna en positiv sak, nämligen att MSI inte drabbades av samma ramförluster under speltesterna som till exempel Zenbook 14 eller HP Spectre x360 14 gjorde. Dess spelprestanda är ganska låg i allmänhet, men den är åtminstone stabil. Vid batterianvändning förblir dess prestanda också konstant och ytterligare riktmärken kan hittas här.
| 3DMark 11 Performance | 8505 poäng | |
| 3DMark Fire Strike Score | 5203 poäng | |
| 3DMark Time Spy Score | 2178 poäng | |
Hjälp | ||
| Blender / v3.3 Classroom CPU | |
| Dell Latitude 13 7340 i5-1345U | |
| Asus ZenBook S13 OLED UX5304 | |
| HP Dragonfly G4 | |
| Lenovo ThinkPad X1 Nano Gen 3 | |
| MSI Prestige 13 AI Evo | |
| Genomsnitt av klass Subnotebook (241 - 861, n=60, senaste 2 åren) | |
| Genomsnitt Intel Arc 8-Core iGPU (294 - 692, n=43) | |
* ... mindre är bättre
| Performance rating - Percent | |
| Genomsnitt av klass Subnotebook | |
| MSI Prestige 13 AI Evo | |
| HP Dragonfly G4 | |
| Lenovo ThinkPad X1 Nano Gen 3 -1! | |
| Asus ZenBook S13 OLED UX5304 | |
| Dell Latitude 13 7340 i5-1345U | |
| The Witcher 3 - 1920x1080 Ultra Graphics & Postprocessing (HBAO+) | |
| Genomsnitt av klass Subnotebook (13.9 - 34.6, n=13, senaste 2 åren) | |
| HP Dragonfly G4 | |
| MSI Prestige 13 AI Evo | |
| Lenovo ThinkPad X1 Nano Gen 3 | |
| Asus ZenBook S13 OLED UX5304 | |
| Dell Latitude 13 7340 i5-1345U | |
| GTA V - 1920x1080 Highest AA:4xMSAA + FX AF:16x | |
| Genomsnitt av klass Subnotebook (10.7 - 43.7, n=56, senaste 2 åren) | |
| HP Dragonfly G4 | |
| MSI Prestige 13 AI Evo | |
| Asus ZenBook S13 OLED UX5304 | |
| Dell Latitude 13 7340 i5-1345U | |
| Final Fantasy XV Benchmark - 1920x1080 High Quality | |
| Genomsnitt av klass Subnotebook (11.6 - 54.5, n=54, senaste 2 åren) | |
| MSI Prestige 13 AI Evo | |
| HP Dragonfly G4 | |
| Asus ZenBook S13 OLED UX5304 | |
| Lenovo ThinkPad X1 Nano Gen 3 | |
| Dell Latitude 13 7340 i5-1345U | |
| Strange Brigade - 1920x1080 ultra AA:ultra AF:16 | |
| Genomsnitt av klass Subnotebook (19 - 101.3, n=50, senaste 2 åren) | |
| MSI Prestige 13 AI Evo | |
| HP Dragonfly G4 | |
| Asus ZenBook S13 OLED UX5304 | |
| Dell Latitude 13 7340 i5-1345U | |
| Lenovo ThinkPad X1 Nano Gen 3 | |
| Dota 2 Reborn - 1920x1080 ultra (3/3) best looking | |
| Genomsnitt av klass Subnotebook (13 - 97, n=61, senaste 2 åren) | |
| HP Dragonfly G4 | |
| MSI Prestige 13 AI Evo | |
| Asus ZenBook S13 OLED UX5304 | |
| Dell Latitude 13 7340 i5-1345U | |
| Lenovo ThinkPad X1 Nano Gen 3 | |
| X-Plane 11.11 - 1920x1080 high (fps_test=3) | |
| Genomsnitt av klass Subnotebook (20.7 - 50.5, n=53, senaste 2 åren) | |
| MSI Prestige 13 AI Evo | |
| Lenovo ThinkPad X1 Nano Gen 3 | |
| HP Dragonfly G4 | |
| Asus ZenBook S13 OLED UX5304 | |
| Dell Latitude 13 7340 i5-1345U | |
Witcher 3 FPS diagram
| låg | med. | hög | ultra | |
|---|---|---|---|---|
| GTA V (2015) | 99.1 | 93.8 | 26.2 | 9.97 |
| The Witcher 3 (2015) | 92 | 59 | 36 | 14.5 |
| Dota 2 Reborn (2015) | 89.9 | 75.9 | 57.7 | 53.3 |
| Final Fantasy XV Benchmark (2018) | 43.8 | 28 | 17 | |
| X-Plane 11.11 (2018) | 47.4 | 37.7 | 32.1 | |
| Far Cry 5 (2018) | 47 | 33 | 31 | 28 |
| Strange Brigade (2018) | 121 | 53 | 41 | 32 |
| F1 2021 (2021) | 94.8 | 50.8 | 41.3 | 20.3 |
| F1 22 (2022) | 59.1 | 49.6 | 36.8 | 9.33 |
| F1 23 (2023) | 44.1 | 36.3 | 27.1 | 7.45 |
Utsläpp - svaga talare
Utsläpp av buller
MSI-laptopen har en kylenhet som består av ett värmerör och en fläkt som tyvärr ofta körs på låg hastighet även när enheten är på tomgång. Även om det surrande ljudet inte är irriterande, kan du definitivt höra det i tystare omgivningar. Under belastning kom fläkten snabbt upp i 32 dB(A) och under stresstestet noterade vi 40 dB(A). Detta är allt annat än tyst och som det visade sig var vårt testexemplar det mest högljudda i jämförelsefältet. Med CoolerBooster-funktionen nådde den lilla fläkten till och med 51 dB(A). Vi noterade inga ytterligare elektroniska ljud.
Ljudnivå
| Låg belastning |
| 23.4 / 26.9 / 26.9 dB(A) |
| Hög belastning |
| 32 / 40.3 dB(A) |
 | ||
30 dB tyst 40 dB(A) hörbar 50 dB(A) högt ljud |
||
min: | ||
| MSI Prestige 13 AI Evo Arc 8-Core, Ultra 7 155H, Samsung PM9A1 MZVL21T0HCLR | Lenovo ThinkPad X1 Nano Gen 3 Iris Xe G7 96EUs, i7-1360P, Lenovo UMIS AM6A0 RPJTJ512MKP1QDQ | Dell Latitude 13 7340 i5-1345U Iris Xe G7 80EUs, i5-1345U, Kioxia BG5 KBG50ZNS512G | HP Dragonfly G4 Iris Xe G7 96EUs, i7-1365U, Micron 3400 MTFDKBA512TFH 512GB | Asus ZenBook S13 OLED UX5304 Iris Xe G7 96EUs, i7-1355U, Samsung PM9A1 MZVL21T0HCLR | |
|---|---|---|---|---|---|
| Noise | 3% | -1% | 6% | -2% | |
| av / miljö * (dB) | 23.4 | 22.9 2% | 25.02 -7% | 23.3 -0% | 23.3 -0% |
| Idle Minimum * (dB) | 23.4 | 23 2% | 25.02 -7% | 23.5 -0% | 23.3 -0% |
| Idle Average * (dB) | 26.9 | 23 14% | 25.02 7% | 23.5 13% | 23.3 13% |
| Idle Maximum * (dB) | 26.9 | 23 14% | 25.02 7% | 26.8 -0% | 23.3 13% |
| Load Average * (dB) | 32 | 32.8 -2% | 35.07 -10% | 27.2 15% | 37.7 -18% |
| Witcher 3 ultra * (dB) | 32 | 36.9 -15% | 32.7 -2% | 40.1 -25% | |
| Load Maximum * (dB) | 40.3 | 36.9 8% | 38.2 5% | 35 13% | 40.1 -0% |
* ... mindre är bättre
Temperatur
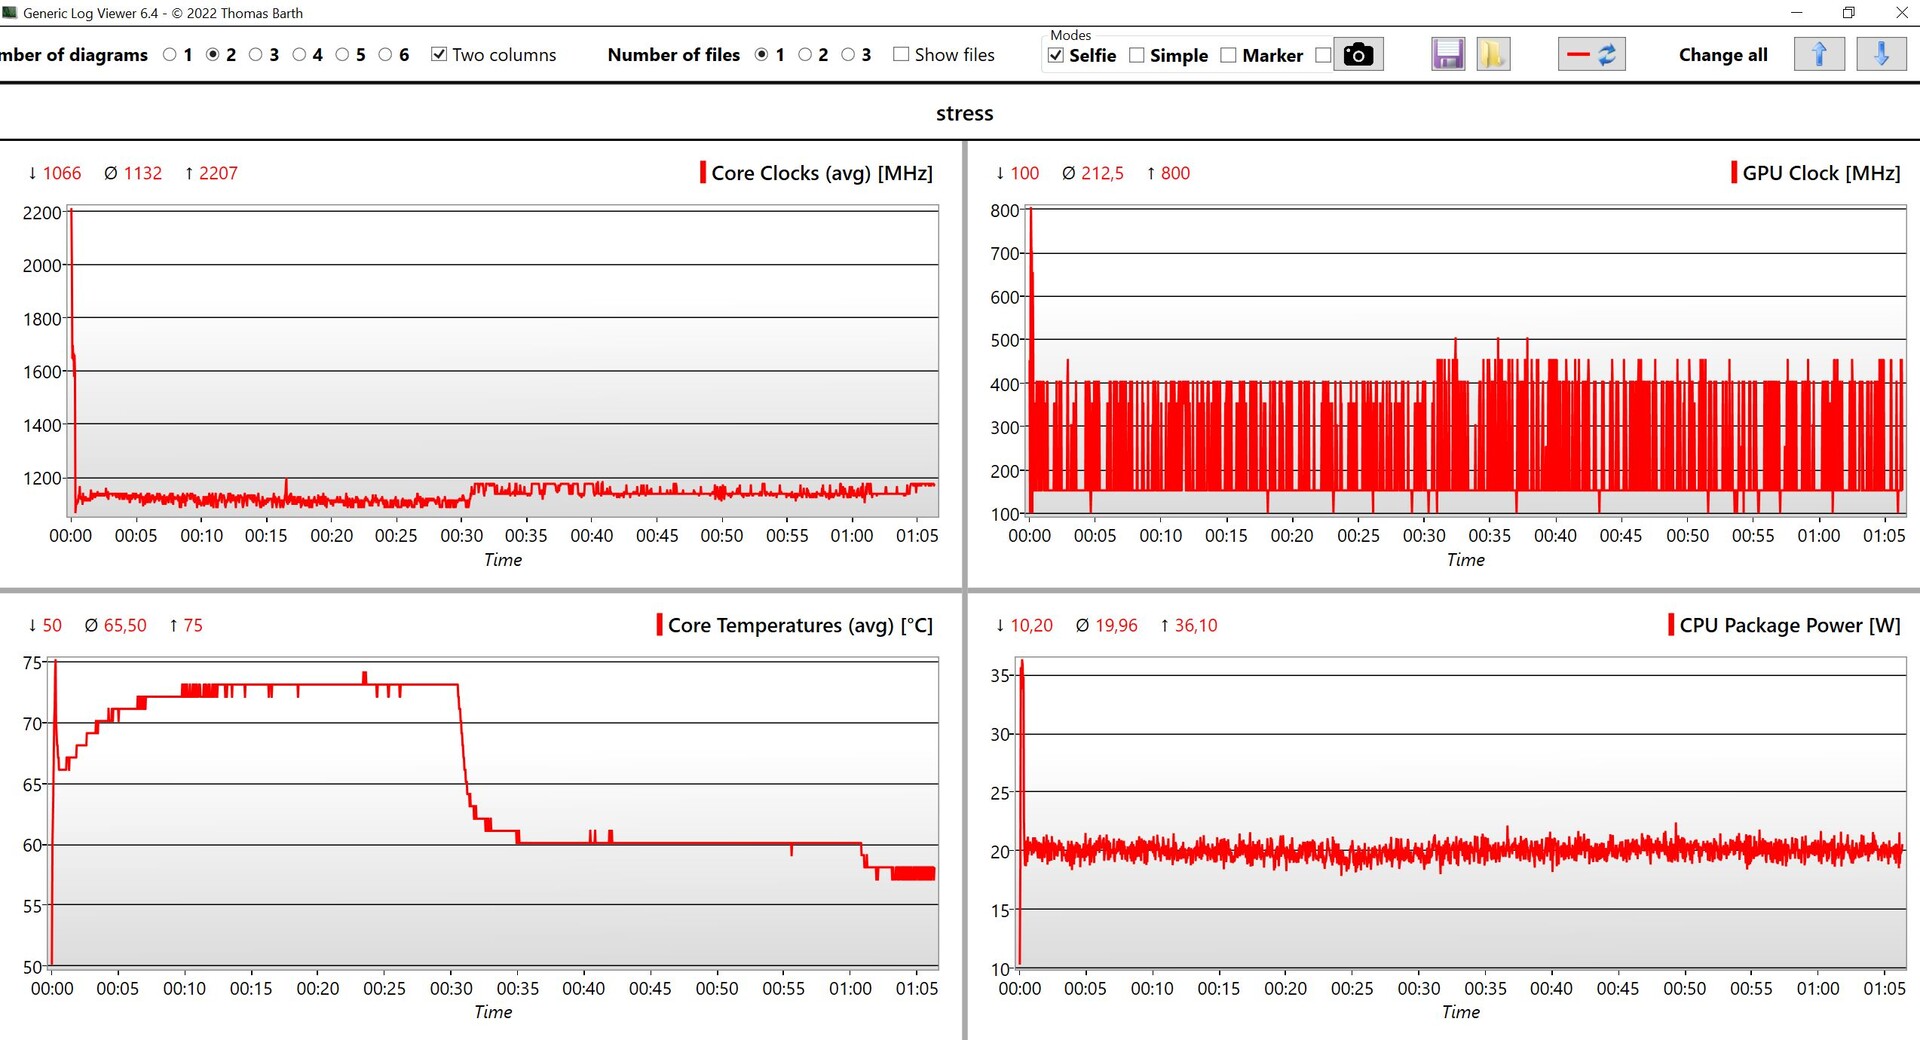
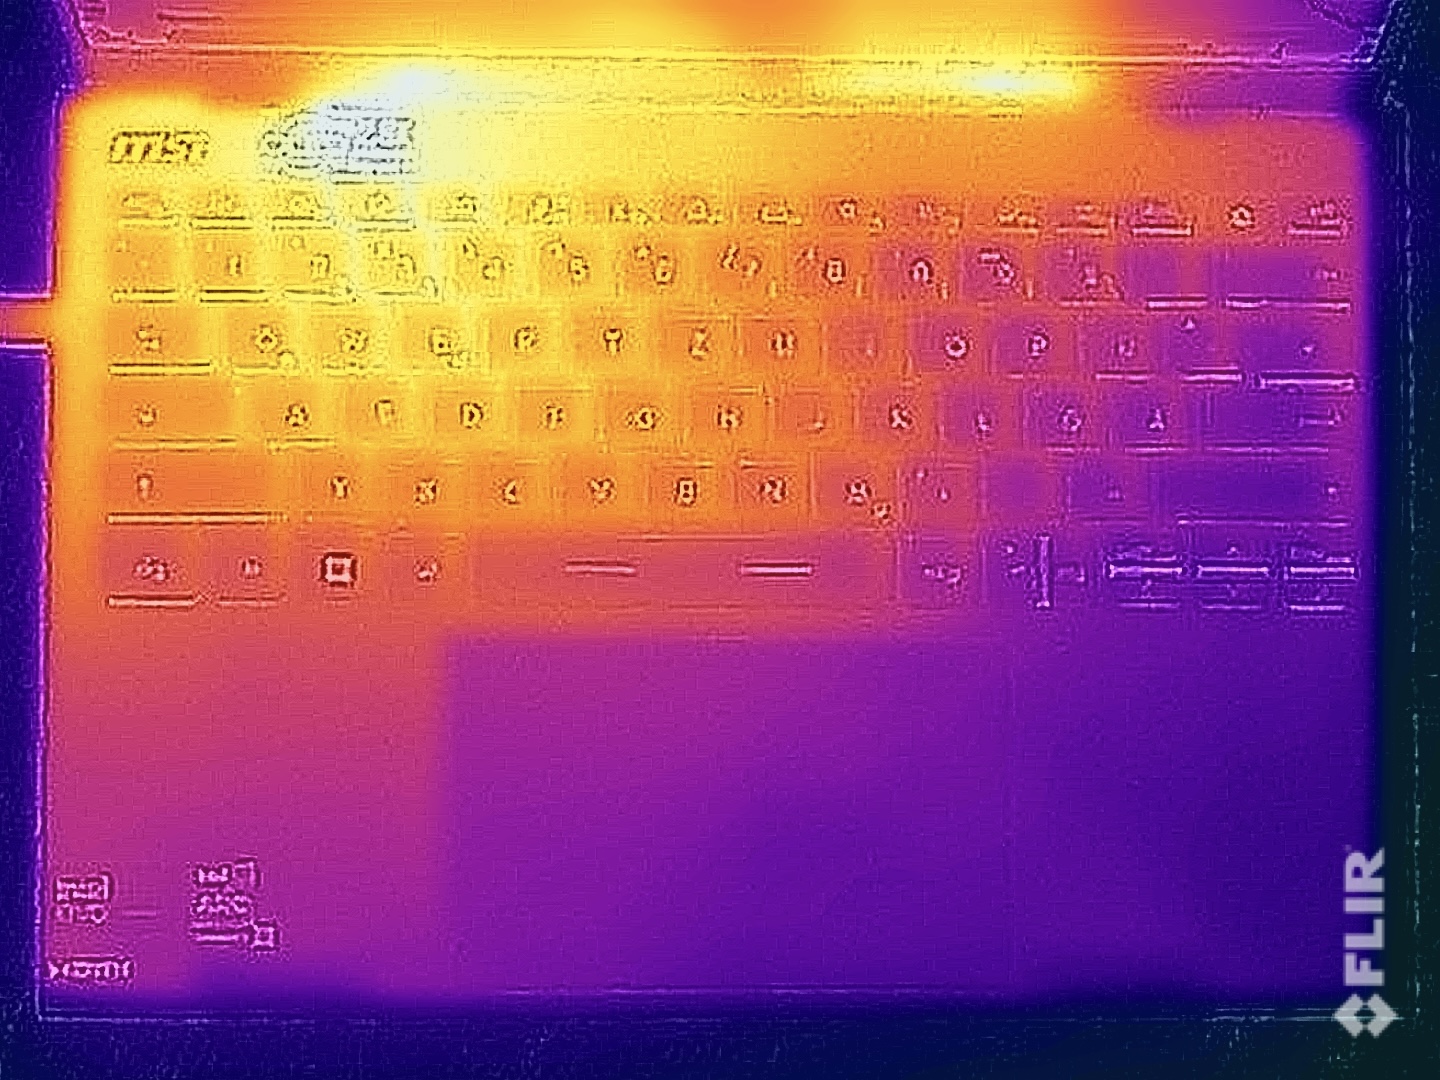
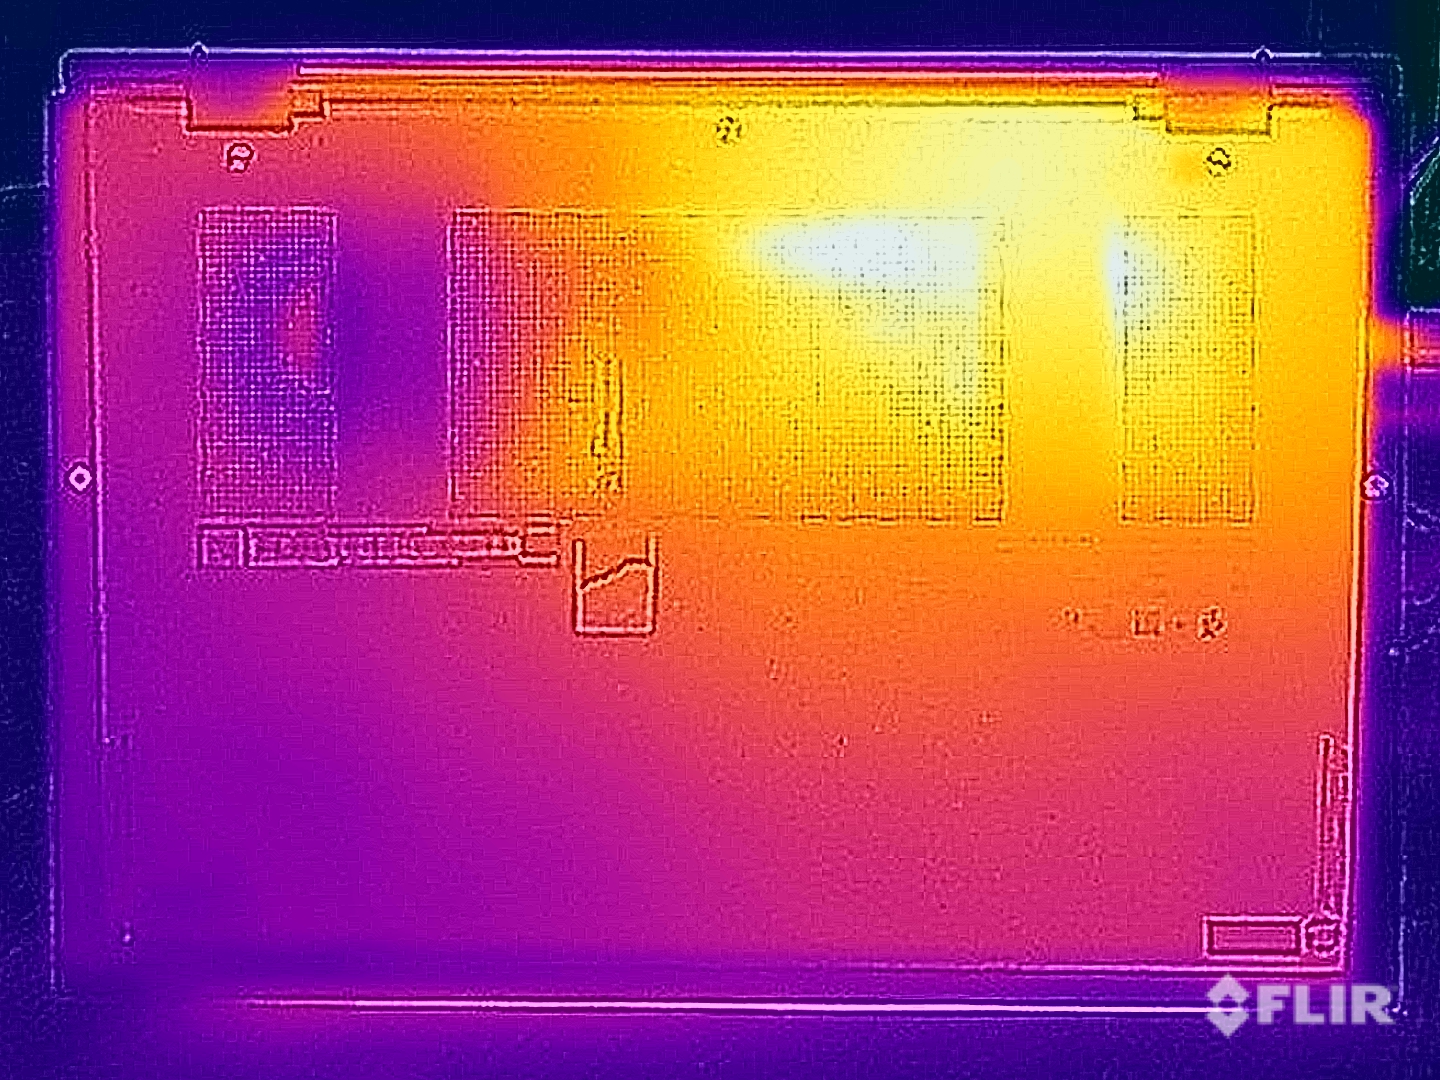
Vid daglig användning håller sig Prestige 13 mestadels sval och även under stresstestet uppmätte vi maximalt 40 °C på toppen och botten av basenheten. Kylaren är placerad på vänster sida, vilket är anledningen till att detta område värms upp mest. Under stresstestet balanserade CPU:ns strömförbrukning snabbt ut på 20 watt och stannade sedan på denna nivå.
(±) Den maximala temperaturen på ovansidan är 40.9 °C / 106 F, jämfört med genomsnittet av 35.9 °C / 97 F , allt från 21.4 till 59 °C för klassen Subnotebook.
(±) Botten värms upp till maximalt 40.4 °C / 105 F, jämfört med genomsnittet av 39.2 °C / 103 F
(+) Vid tomgångsbruk är medeltemperaturen för ovansidan 23.3 °C / 74 F, jämfört med enhetsgenomsnittet på 30.8 °C / ### class_avg_f### F.
(+) När du spelar The Witcher 3 är medeltemperaturen för ovansidan 30.9 °C / 88 F, jämfört med enhetsgenomsnittet på 30.8 °C / ## #class_avg_f### F.
(+) Handledsstöden och pekplattan är kallare än hudtemperaturen med maximalt 27.9 °C / 82.2 F och är därför svala att ta på.
(±) Medeltemperaturen för handledsstödsområdet på liknande enheter var 28.2 °C / 82.8 F (+0.3 °C / 0.6 F).
| MSI Prestige 13 AI Evo Intel Core Ultra 7 155H, Intel Arc 8-Core iGPU | Lenovo ThinkPad X1 Nano Gen 3 Intel Core i7-1360P, Intel Iris Xe Graphics G7 96EUs | Dell Latitude 13 7340 i5-1345U Intel Core i5-1345U, Intel Iris Xe Graphics G7 80EUs | HP Dragonfly G4 Intel Core i7-1365U, Intel Iris Xe Graphics G7 96EUs | Asus ZenBook S13 OLED UX5304 Intel Core i7-1355U, Intel Iris Xe Graphics G7 96EUs | |
|---|---|---|---|---|---|
| Heat | -4% | -1% | -5% | -9% | |
| Maximum Upper Side * (°C) | 40.9 | 44 -8% | 34.3 16% | 38.6 6% | 43.1 -5% |
| Maximum Bottom * (°C) | 40.4 | 43.2 -7% | 37.6 7% | 40.4 -0% | 45 -11% |
| Idle Upper Side * (°C) | 25 | 25.6 -2% | 28.4 -14% | 28.2 -13% | 27.3 -9% |
| Idle Bottom * (°C) | 25.5 | 25.6 -0% | 28.8 -13% | 29 -14% | 27.8 -9% |
* ... mindre är bättre
Högtalare
Stereohögtalarna hör till de svagare aspekterna av den kompakta subnotebook. Deras maximala volym kan vara anständig, men deras ljud i sig har inte mycket dimension och de saknar helt klart vad många av enhetens konkurrenter kan erbjuda.
MSI Prestige 13 AI Evo ljudanalys
(±) | högtalarljudstyrkan är genomsnittlig men bra (81.8 dB)
Bas 100 - 315 Hz
(-) | nästan ingen bas - i genomsnitt 20.5% lägre än medianen
(±) | linjäriteten för basen är genomsnittlig (8.4% delta till föregående frekvens)
Mellan 400 - 2000 Hz
(±) | högre mellan - i genomsnitt 6.1% högre än median
(+) | mids är linjära (5.9% delta till föregående frekvens)
Högsta 2 - 16 kHz
(+) | balanserade toppar - endast 4.7% från medianen
(+) | toppar är linjära (5.4% delta till föregående frekvens)
Totalt 100 - 16 000 Hz
(±) | linjäriteten för det totala ljudet är genomsnittlig (19% skillnad mot median)
Jämfört med samma klass
» 58% av alla testade enheter i den här klassen var bättre, 6% liknande, 36% sämre
» Den bästa hade ett delta på 5%, genomsnittet var 18%, sämst var 53%
Jämfört med alla testade enheter
» 45% av alla testade enheter var bättre, 7% liknande, 48% sämre
» Den bästa hade ett delta på 4%, genomsnittet var 23%, sämst var 134%
Dell Latitude 13 7340 i5-1345U ljudanalys
(+) | högtalare kan spela relativt högt (83 dB)
Bas 100 - 315 Hz
(±) | reducerad bas - i genomsnitt 6.2% lägre än medianen
(±) | linjäriteten för basen är genomsnittlig (9.6% delta till föregående frekvens)
Mellan 400 - 2000 Hz
(+) | balanserad mellan - endast 2.3% från medianen
(+) | mids är linjära (5.1% delta till föregående frekvens)
Högsta 2 - 16 kHz
(±) | högre toppar - i genomsnitt 5.6% högre än medianen
(±) | linjäriteten för toppar är genomsnittlig (7.9% delta till föregående frekvens)
Totalt 100 - 16 000 Hz
(+) | det totala ljudet är linjärt (9% skillnad mot median)
Jämfört med samma klass
» 4% av alla testade enheter i den här klassen var bättre, 1% liknande, 95% sämre
» Den bästa hade ett delta på 5%, genomsnittet var 18%, sämst var 53%
Jämfört med alla testade enheter
» 3% av alla testade enheter var bättre, 1% liknande, 96% sämre
» Den bästa hade ett delta på 4%, genomsnittet var 23%, sämst var 134%
HP Dragonfly G4 ljudanalys
(+) | högtalare kan spela relativt högt (84.4 dB)
Bas 100 - 315 Hz
(±) | reducerad bas - i genomsnitt 8.4% lägre än medianen
(±) | linjäriteten för basen är genomsnittlig (11.6% delta till föregående frekvens)
Mellan 400 - 2000 Hz
(+) | balanserad mellan - endast 2.3% från medianen
(+) | mids är linjära (4.8% delta till föregående frekvens)
Högsta 2 - 16 kHz
(+) | balanserade toppar - endast 3.2% från medianen
(+) | toppar är linjära (4.6% delta till föregående frekvens)
Totalt 100 - 16 000 Hz
(+) | det totala ljudet är linjärt (9.1% skillnad mot median)
Jämfört med samma klass
» 4% av alla testade enheter i den här klassen var bättre, 1% liknande, 95% sämre
» Den bästa hade ett delta på 5%, genomsnittet var 18%, sämst var 53%
Jämfört med alla testade enheter
» 3% av alla testade enheter var bättre, 1% liknande, 96% sämre
» Den bästa hade ett delta på 4%, genomsnittet var 23%, sämst var 134%
Energihantering - Bra uthållighet med ett 75-Wh-batteri
Strömförbrukning
Vi noterade inga obetydliga avvikelser under mätningarna och den bärbara datorns maximala tomgångsförbrukning är cirka 9 watt. Som är fallet med alla OLED-paneler bör du se till att ställa in mörkare bakgrundsbilder och använda Windows mörka läge för att minimera strömförbrukningen. Under belastning når strömförsörjningen sin gräns på 65 watt under en kort period, sedan balanseras den snabbt till 33 watt och under stresstestet låg den kvar på denna nivå.
| Av/Standby | |
| Låg belastning | |
| Hög belastning |
|
Förklaring:
min: | |
| MSI Prestige 13 AI Evo Ultra 7 155H, Arc 8-Core, Samsung PM9A1 MZVL21T0HCLR, OLED, 2880x1800, 13.3" | Lenovo ThinkPad X1 Nano Gen 3 i7-1360P, Iris Xe G7 96EUs, Lenovo UMIS AM6A0 RPJTJ512MKP1QDQ, IPS, 2160x1350, 13" | Dell Latitude 13 7340 i5-1345U i5-1345U, Iris Xe G7 80EUs, Kioxia BG5 KBG50ZNS512G, IPS, 1920x1200, 13.3" | HP Dragonfly G4 i7-1365U, Iris Xe G7 96EUs, Micron 3400 MTFDKBA512TFH 512GB, IPS, 1920x1280, 13.5" | Asus ZenBook S13 OLED UX5304 i7-1355U, Iris Xe G7 96EUs, Samsung PM9A1 MZVL21T0HCLR, OLED, 2880x1800, 13.3" | Genomsnitt Intel Arc 8-Core iGPU | Genomsnitt av klass Subnotebook | |
|---|---|---|---|---|---|---|---|
| Power Consumption | 6% | 3% | -1% | -3% | -28% | 5% | |
| Idle Minimum * (Watt) | 4.5 | 3.3 27% | 2.37 47% | 4.1 9% | 5.8 -29% | 5.31 ? -18% | 3.76 ? 16% |
| Idle Average * (Watt) | 8 | 6.5 19% | 6.19 23% | 7.5 6% | 8.5 -6% | 8.56 ? -7% | 6.54 ? 18% |
| Idle Maximum * (Watt) | 8.7 | 7.1 18% | 14.1 -62% | 8.2 6% | 8.8 -1% | 11.9 ? -37% | 7.89 ? 9% |
| Load Average * (Watt) | 36.1 | 40.7 -13% | 36.3 -1% | 35.5 2% | 35.1 3% | 53.6 ? -48% | 42 ? -16% |
| Witcher 3 ultra * (Watt) | 29.7 | 37 -25% | 24.9 16% | 37.5 -26% | 27.6 7% | ||
| Load Maximum * (Watt) | 65 | 58.6 10% | 69.13 -6% | 66.5 -2% | 59.5 8% | 84.2 ? -30% | 64.8 ? -0% |
* ... mindre är bättre
Power consumption Witcher 3 / stress test
Power consumption with external monitor
Körtider
Trots sin låga vikt har MSI installerat ett 75-Wh-batteri, vilket ger bra körtider trots den bärbara datorns OLED-panel. Även om dess IPS-motsvarigheter i allmänhet körs ännu längre, kunde den slå Zenbook S13 OLED från Asus med ett kort avstånd. Under vårt WLAN-test vid 150 cd/m² (57 % av enhetens maximala SDR-ljusstyrka) kördes testexemplaret i ~11,5 timmar, och vid full ljusstyrka i ~7,5 timmar. Det är möjligt att spela upp videor i 16,5 timmar (150 cd/m²), medan en HDR-video med full ljusstyrka kan köras i 6 timmar. En full laddning tar 220 minuter med enheten påslagen, varvid 80 % av kapaciteten är tillgänglig efter 114 minuter.
| MSI Prestige 13 AI Evo Ultra 7 155H, Arc 8-Core, 75 Wh | Lenovo ThinkPad X1 Nano Gen 3 i7-1360P, Iris Xe G7 96EUs, 49.5 Wh | Dell Latitude 13 7340 i5-1345U i5-1345U, Iris Xe G7 80EUs, 57 Wh | HP Dragonfly G4 i7-1365U, Iris Xe G7 96EUs, 68 Wh | Asus ZenBook S13 OLED UX5304 i7-1355U, Iris Xe G7 96EUs, 63 Wh | Genomsnitt av klass Subnotebook | |
|---|---|---|---|---|---|---|
| Batteridrifttid | -33% | 17% | 26% | -11% | -6% | |
| H.264 (h) | 16.7 | 13.8 -17% | 15.4 ? -8% | |||
| WiFi v1.3 (h) | 11.6 | 7.8 -33% | 15 29% | 15.9 37% | 11.3 -3% | 14 ? 21% |
| Load (h) | 2.8 | 2.9 4% | 3.2 14% | 2.4 -14% | 1.969 ? -30% |
För
Emot
Omdöme - MSI Prestige 13 imponerar med sin låga vikt och OLED-panel

Fokus för den nya MSI Prestige 13 AI Evo ligger tydligt på portabilitet och i denna aspekt visar sig vår testenhet med sin lätta konstruktion och bra körtider vara en framgång. Dessutom erbjuder dess OLED-panel exceptionell bildkvalitet inklusive vissa fördelar jämfört med många IPS-modeller - den är dock inte på något sätt perfekt om ditt mål är att redigera foton. Om du ofta arbetar på språng kan den blanka panelens reflektioner också vara i vägen.
Dess tekniska data i form av den nya Core Ultra 7 155H lovar massor av prestanda men i verkligheten är detta den långsammaste Meteor-Lake-H-modellen vi har testat hittills. För daglig användning bör det vara tillräckligt i många fall, men du bör inte glömma hur långt bort enheten är från sin faktiska prestandapotential (CPU och GPU). RAM-minnet kan inte uppgraderas men trots det bör 32 GB vara mer än tillräckligt för de flesta användare (det här är trots allt inte en arbetsstation).
MSI Prestige 13 AI Evo väger mindre än 1 kg och trots det behöver du inte göra avkall på bra körtider, massor av portar och en OLED-panel. Trots sin Meteor Lake-processor är enhetens prestanda fortfarande inte den bästa - dessutom är dess kylare nästan alltid aktiv vid daglig användning.
När det gäller den bärbara datorns portar och anslutningsmöjligheter, inklusive Wi-Fi 7 och en snabb kortläsare, har vi inte mycket att klaga på, även om det kompakta höljet också kräver att vissa kompromisser görs. Detta inkluderar dess kylenhet som endast består av en enda fläkt som också nästan alltid är aktiv, vilket gör en riktigt tyst enhet till en sällsynthet. Dessutom känns tangentbordet lite trångt, även om mekaniken i sig är bra. Slutligen lämnar de svaga högtalarna mer att önska och konkurrensen erbjuder några tydliga fördelar i detta avseende.
Den HP Dragonfly G4 är sannolikt Prestige 13:s största konkurrent och bortsett från dess bättre högtalare har den också ett bättre tangentbord och längre drifttider - men i gengäld har den en IPS-panel (utan PWM) med lägre upplösning och subjektivt sämre bildkvalitet. Dess MRSP är högre men du kanske kan hitta den för lägre online vid det här laget.
Pris och tillgänglighet
MSI Prestige 13 AI Evo finns för närvarande på Amazon för 1 280,71 USD.
MSI Prestige 13 AI Evo
- 03/06/2024 v7 (old)
Andreas Osthoff
Genomskinlighet
Valet av enheter som ska granskas görs av vår redaktion. Testprovet gavs till författaren som ett lån av tillverkaren eller återförsäljaren för denna recension. Långivaren hade inget inflytande på denna recension och inte heller fick tillverkaren en kopia av denna recension innan publiceringen. Det fanns ingen skyldighet att publicera denna recension. Som ett oberoende medieföretag är Notebookcheck inte föremål för auktoritet från tillverkare, återförsäljare eller förlag.
This is how Notebookcheck is testingEvery year, Notebookcheck independently reviews hundreds of laptops and smartphones using standardized procedures to ensure that all results are comparable. We have continuously developed our test methods for around 20 years and set industry standards in the process. In our test labs, high-quality measuring equipment is utilized by experienced technicians and editors. These tests involve a multi-stage validation process. Our complex rating system is based on hundreds of well-founded measurements and benchmarks, which maintains objectivity.
Price comparison

