BOSGAME M1 mini PC recension: Ryzen 7 7840HS är fortfarande ett odjur

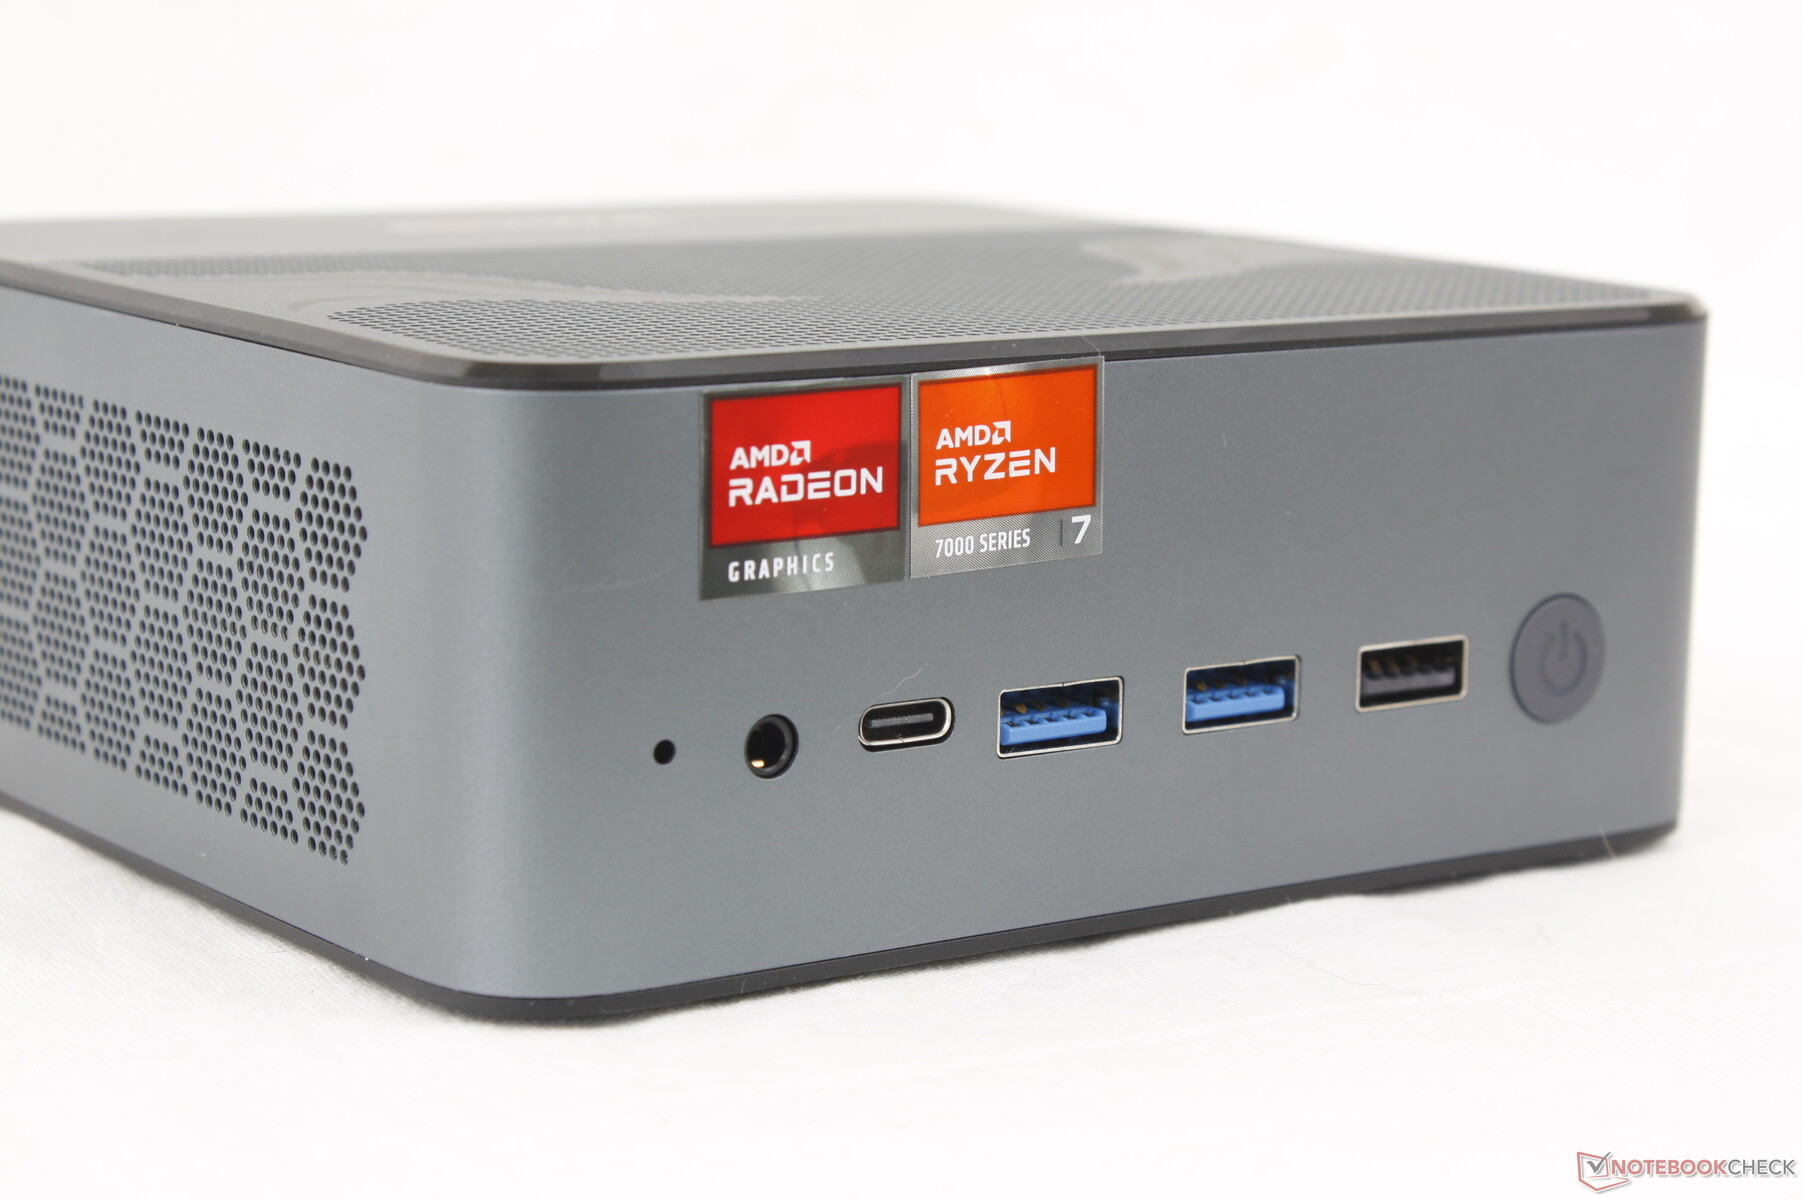
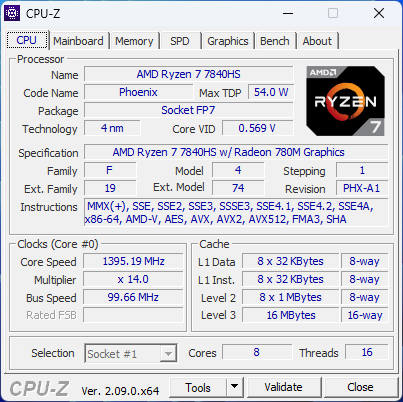
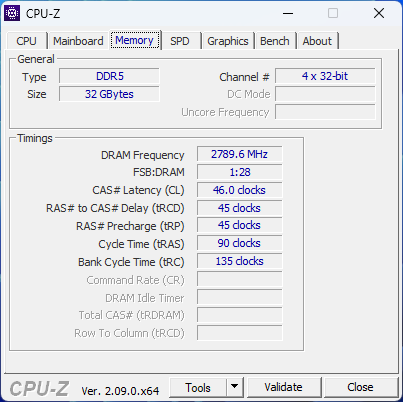
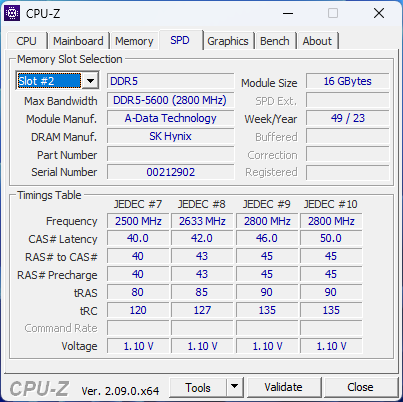
Medan Bosgame N95 riktar sig till budget-HTPC-användare riktar sig M1 till kontors- och kraftanvändare som behöver mer prestanda från sina minidatorer. Modellen har en Ryzen 7 7840HS CPU i spelklass med integrerad Radeon 780M-grafik, 1 TB NVMe SSD och 32 GB flyttbart RAM-minne för cirka 690 USD. M1 är anmärkningsvärd för sina integrerade stereohögtalare, medan de allra flesta mini-datorer förlitar sig på externa högtalare istället.
Alternativ till Bosgame M1 inkluderar andra minidatorer i NUC-storlek som GMK NucBox K6,Intel NUC 13 Proeller Beelink SER7.
Fler recensioner av Bosgame:
Potentiella konkurrenter i jämförelse
Gradering | Datum | Modell | Vikt | Höjd | Storlek | Upplösning | Pris |
|---|---|---|---|---|---|---|---|
| 84.5 % v7 (old) | 05/2024 | BOSGAME M1 R7 7840HS, Radeon 780M | 766 g | 51 mm | x | ||
| 78.9 % v7 (old) | 04/2024 | GMK NucBox M5 R7 5700U, Vega 8 | 505 g | 48 mm | x | ||
| 83.6 % v7 (old) | 04/2024 | GMK NucBox K6 R7 7840HS, Radeon 780M | 514 g | 47 mm | x | ||
| 80.8 % v7 (old) | 04/2023 | Intel NUC 13 Pro Kit NUC13ANK i7-1360P, Iris Xe G7 96EUs | 538 g | 37 mm | x | ||
| 86.6 % v7 (old) | 09/2023 | Beelink SER7 R7 7840HS, Radeon 780M | 640 g | 49 mm | x | ||
v (old) | 11/2022 | Beelink GTR6 R9 6900HX, Radeon 680M | 815 g | 43 mm | x |
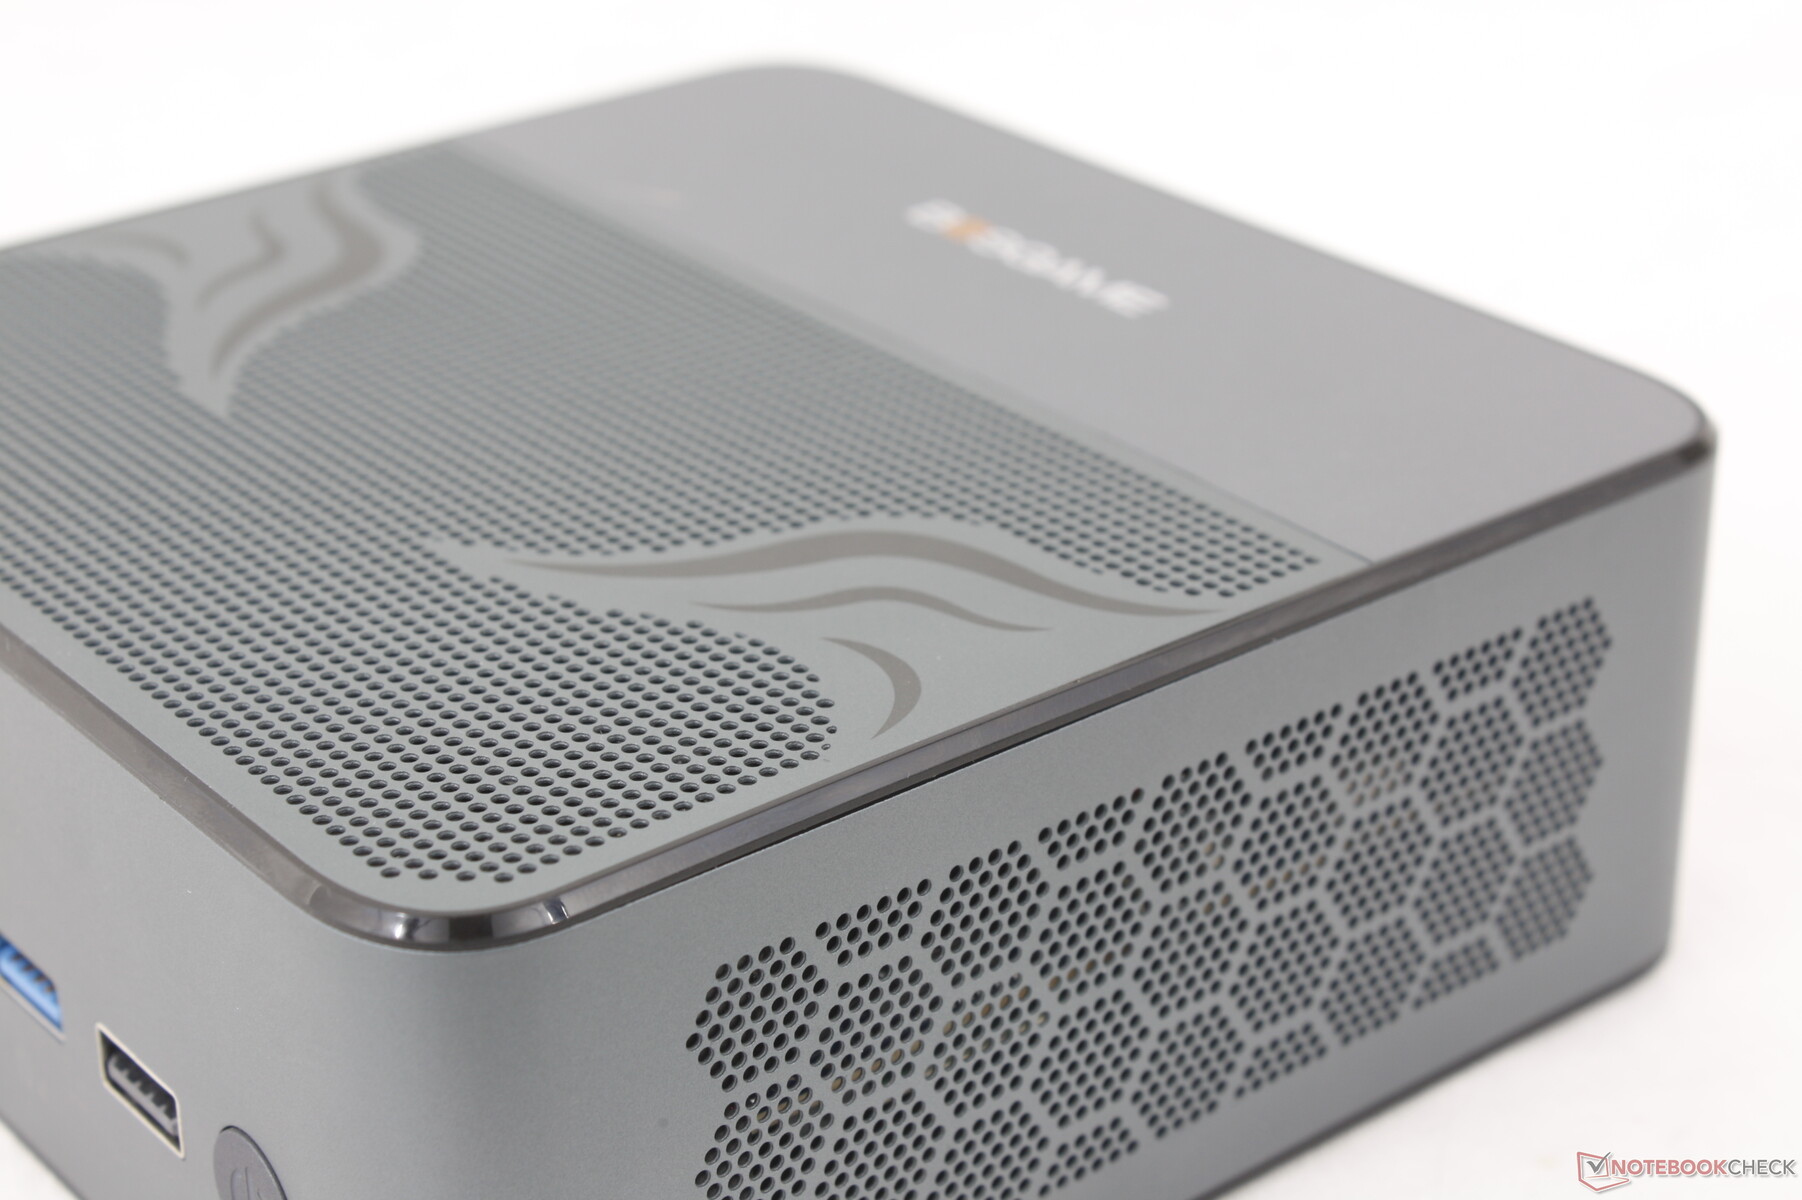
Fodral - robust och tungt
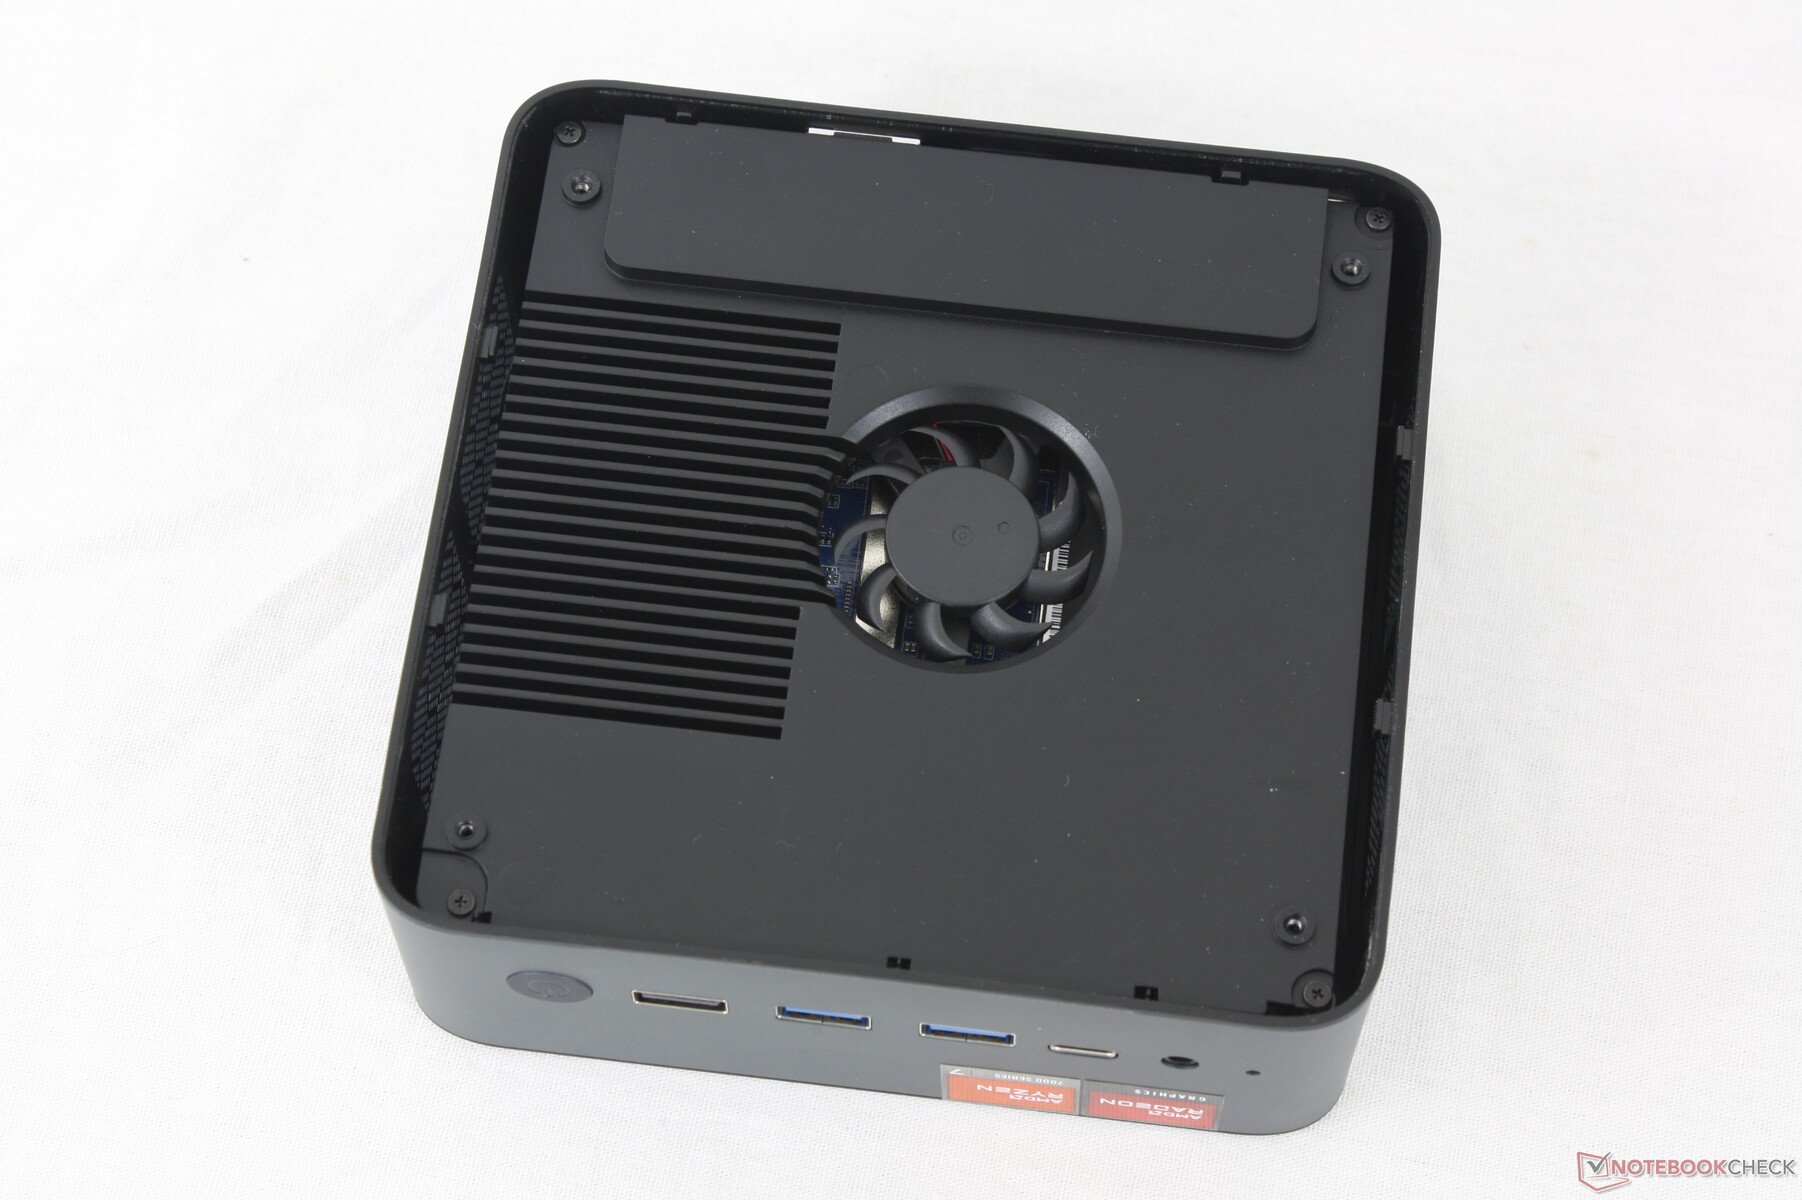
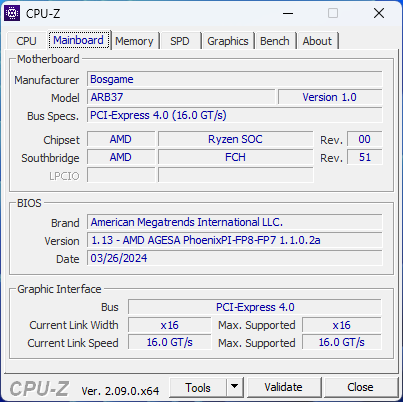
Bortsett från den löstagbara metallplattan på undersidan är resten av chassit i ett stycke metall för en solid konstruktion och känsla som kan mäta sig med NUC-serien. Detta står i kontrast till vissa Beelink-designs som har plast- eller mesh-toppar för ett något billigare utseende. Den största nackdelen är bristen på färg- och anpassningsalternativ, men vi tycker inte att det är ett problem.
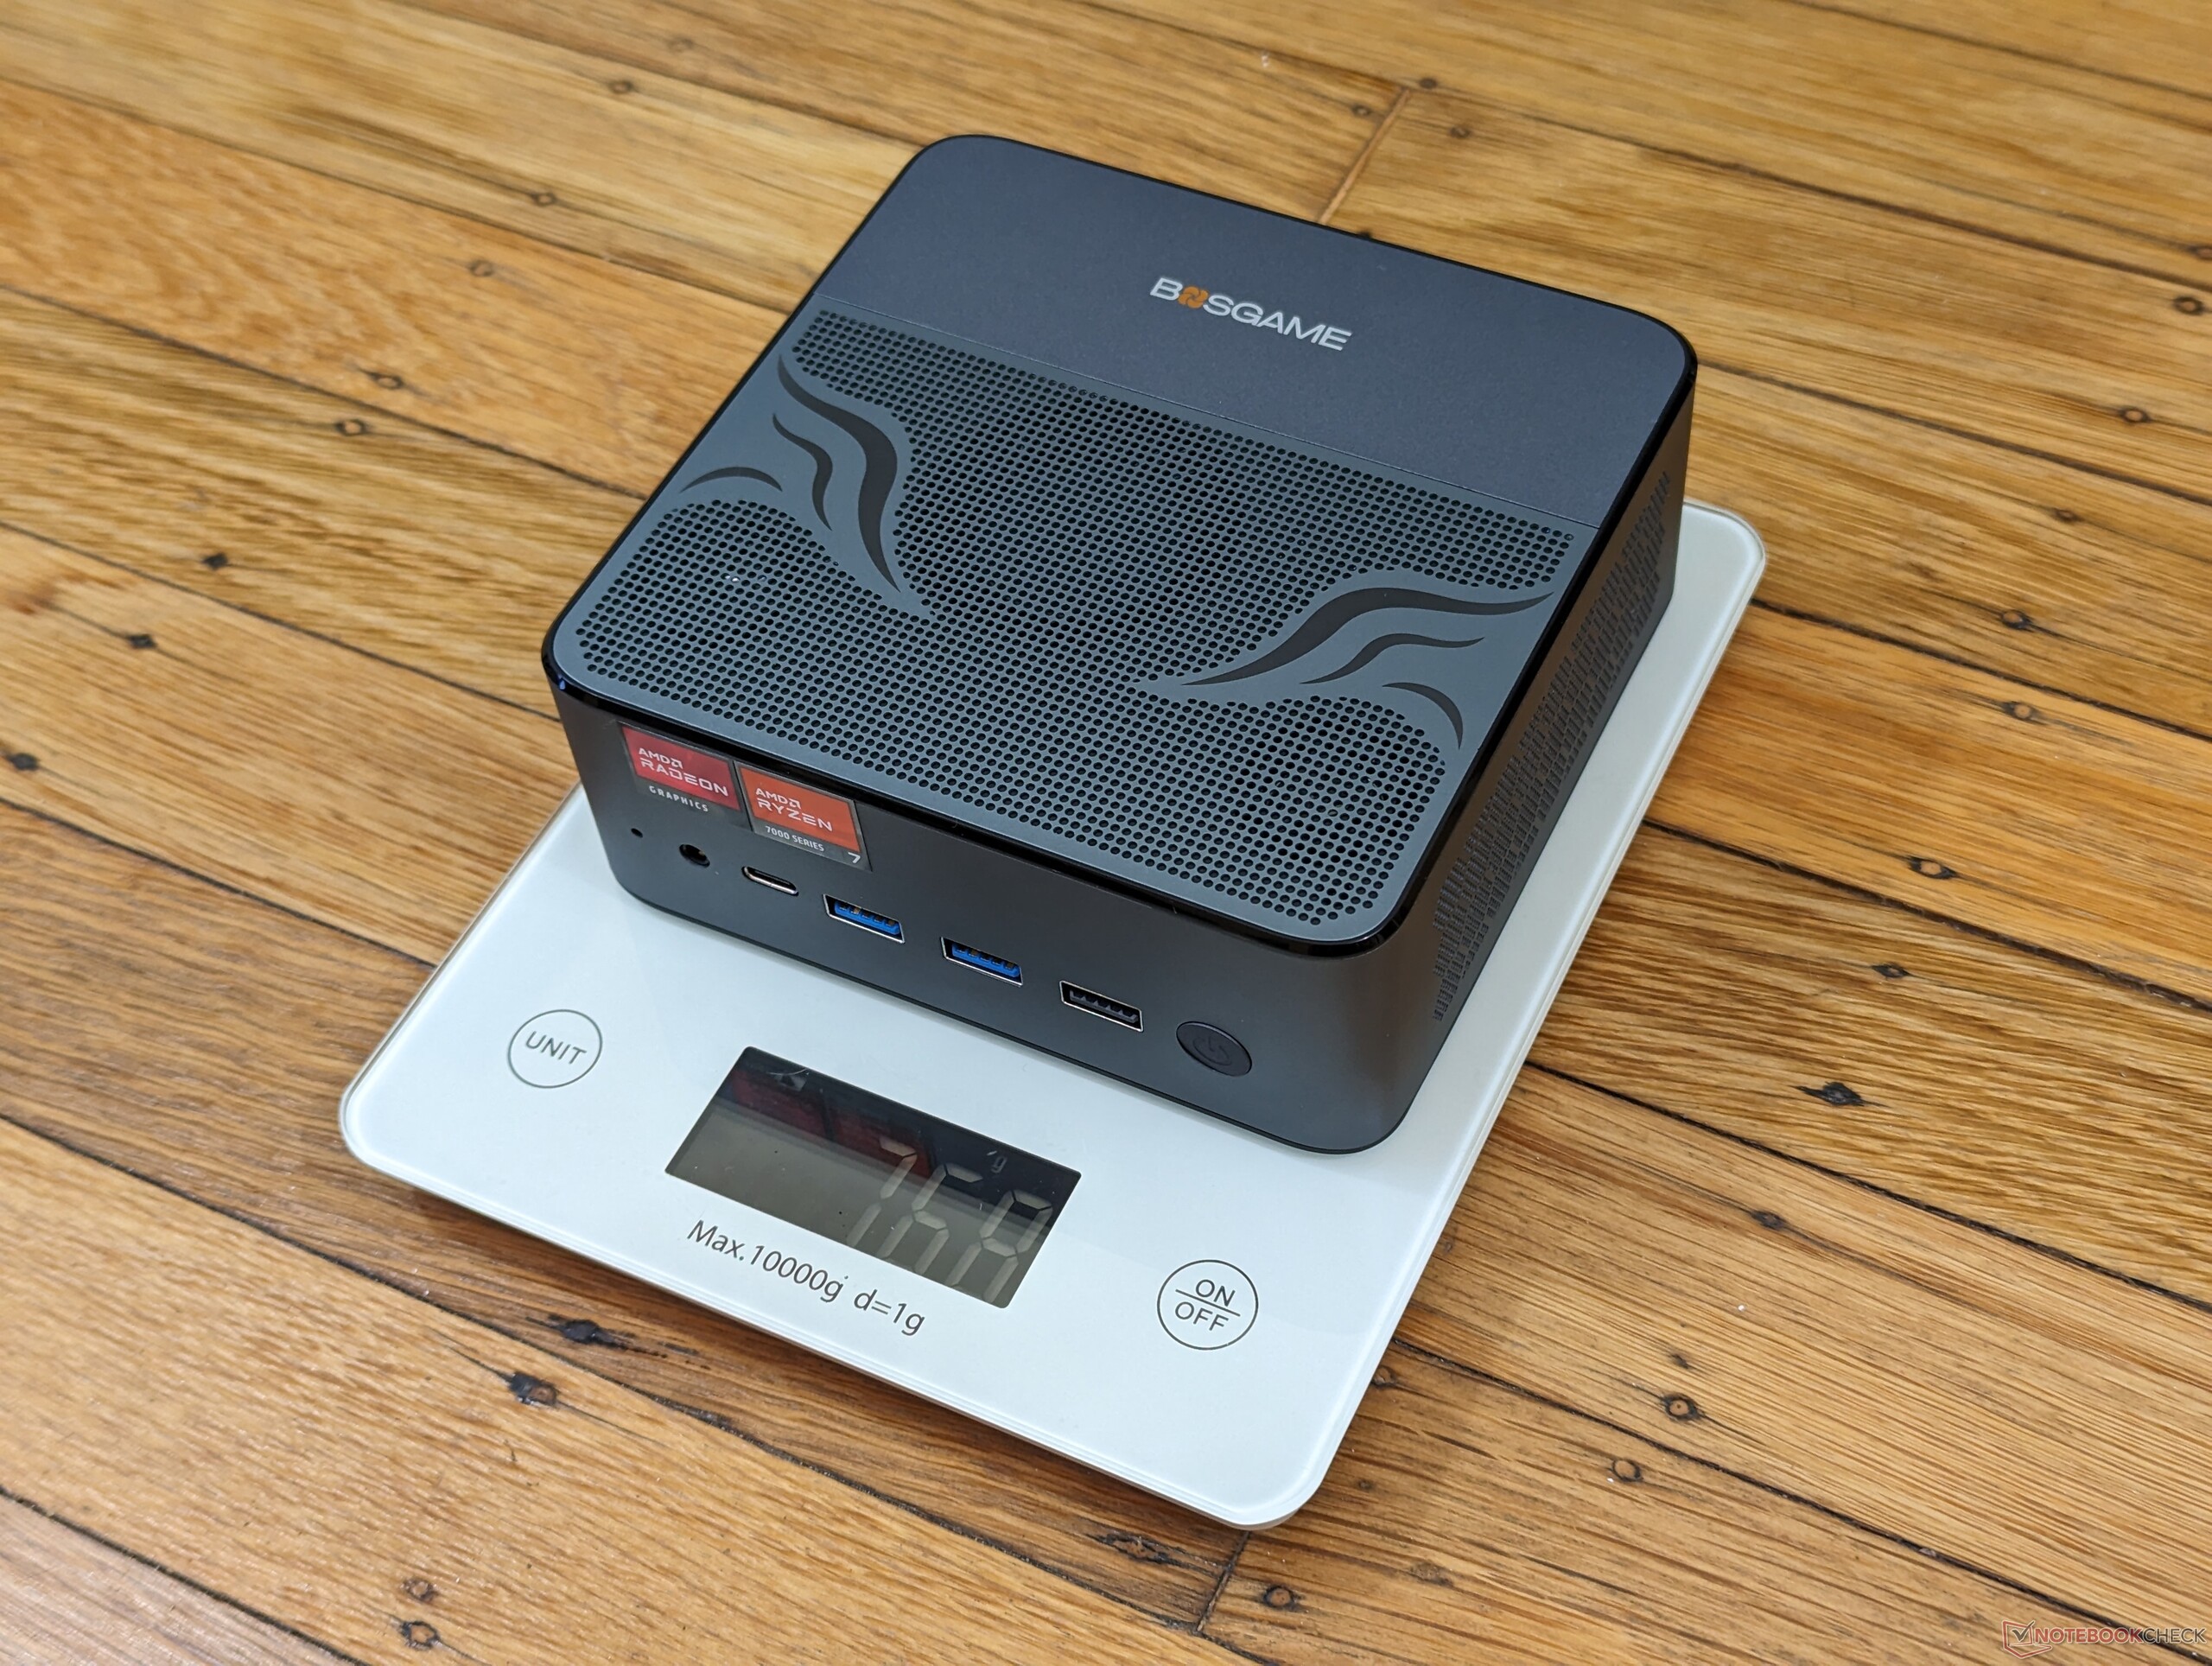
Även om dess övergripande design bäst beskrivs som "NUC-liknande" är M1 faktiskt större och tyngre än många andra minidatorer i NUC-klassen på marknaden, inklusive NUC 13 Pro och GMK NucBox K6. Detta kan delvis tillskrivas de integrerade högtalarna som de flesta andra minidatorer saknar. Den mer omfångsrika designen har dock sina fördelar, vilket våra prestandasektioner nedan kommer att visa.
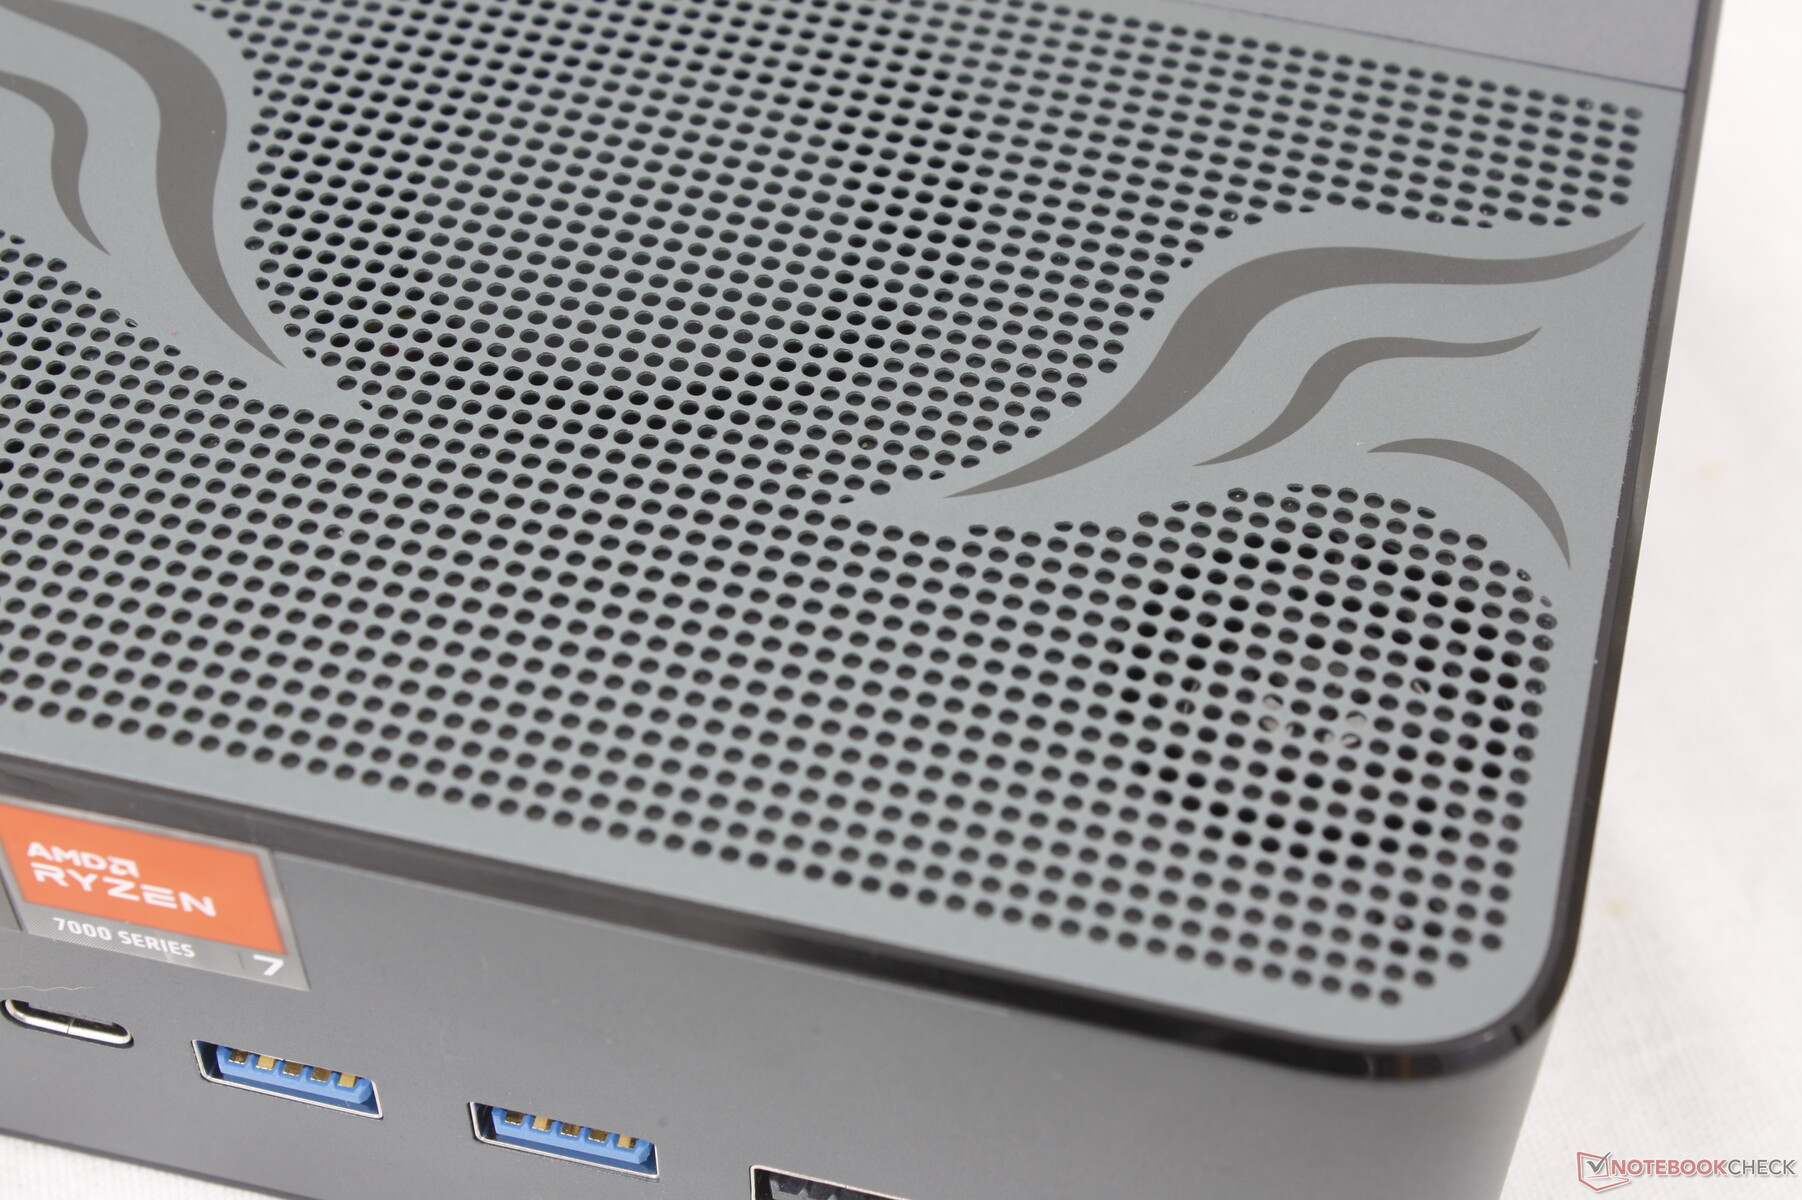
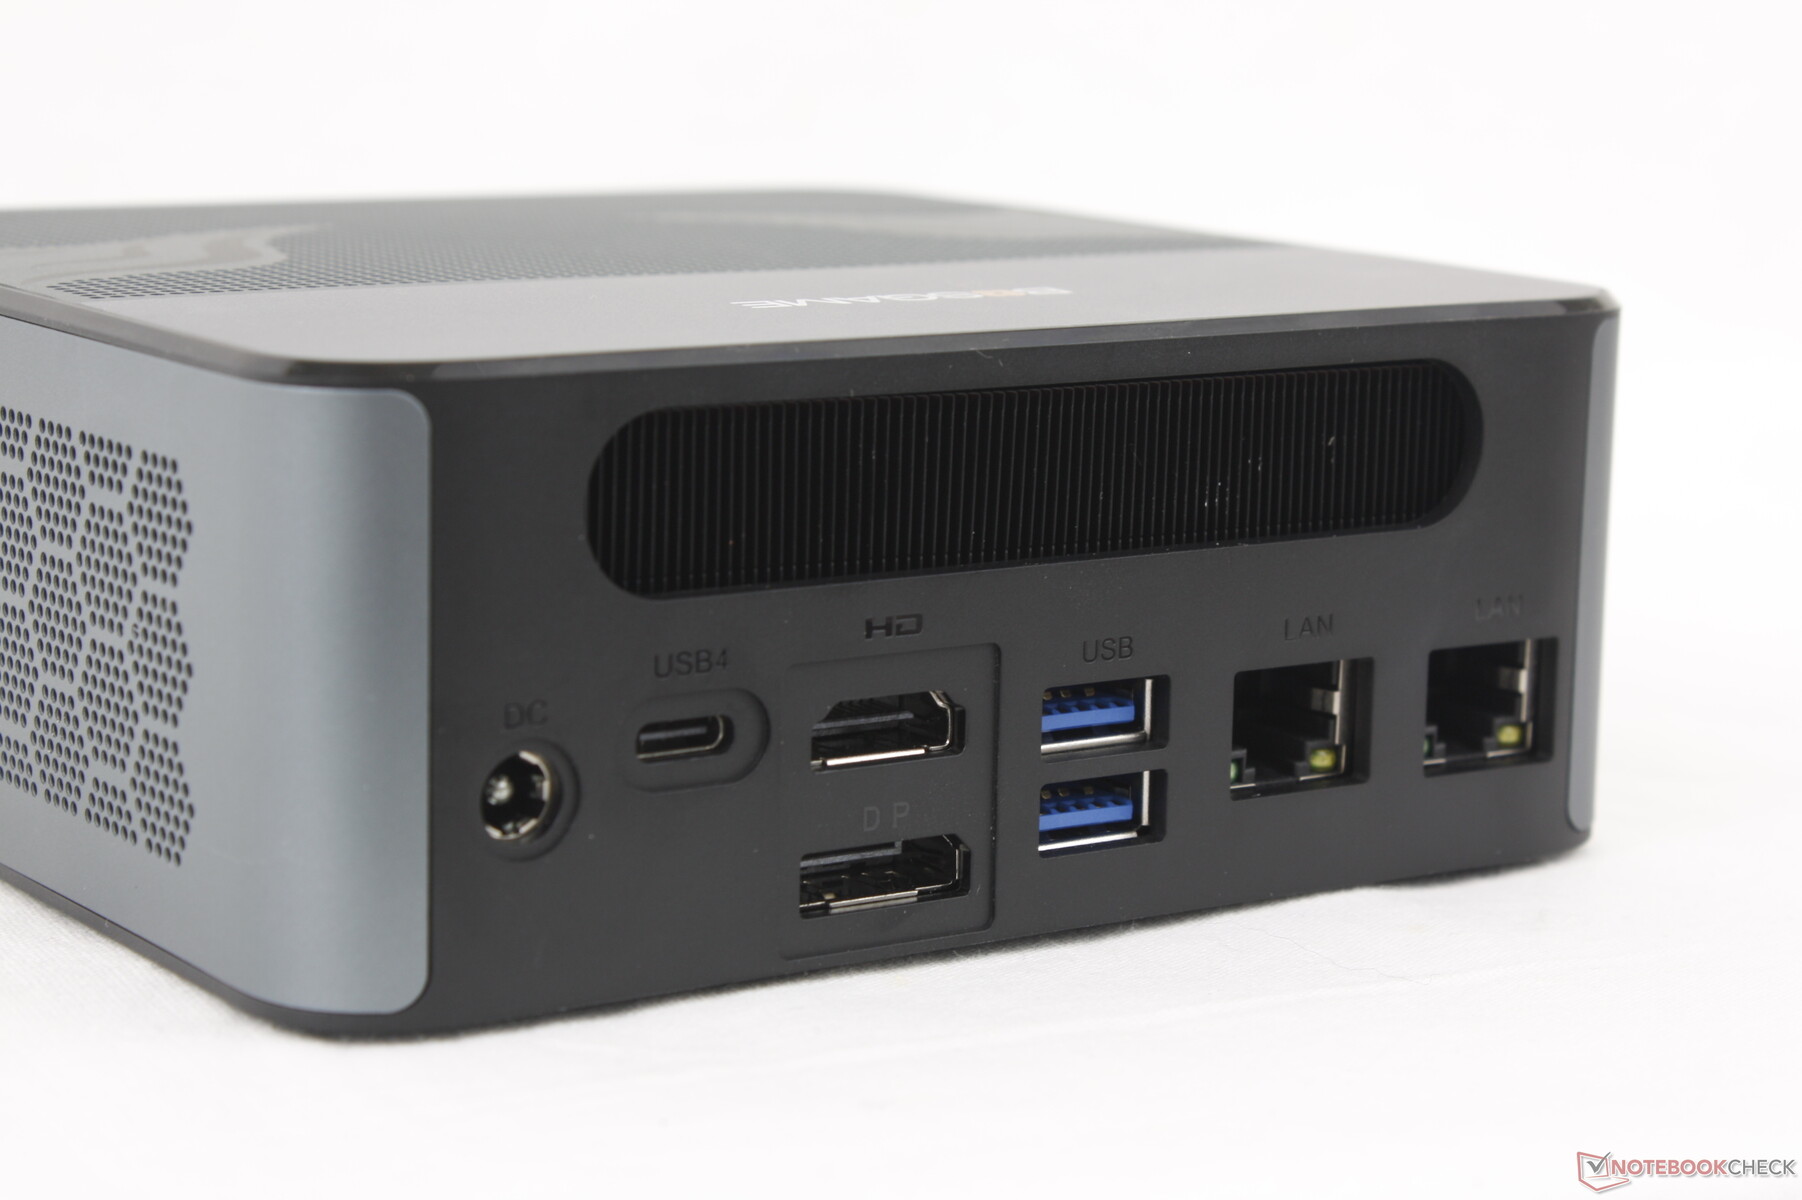
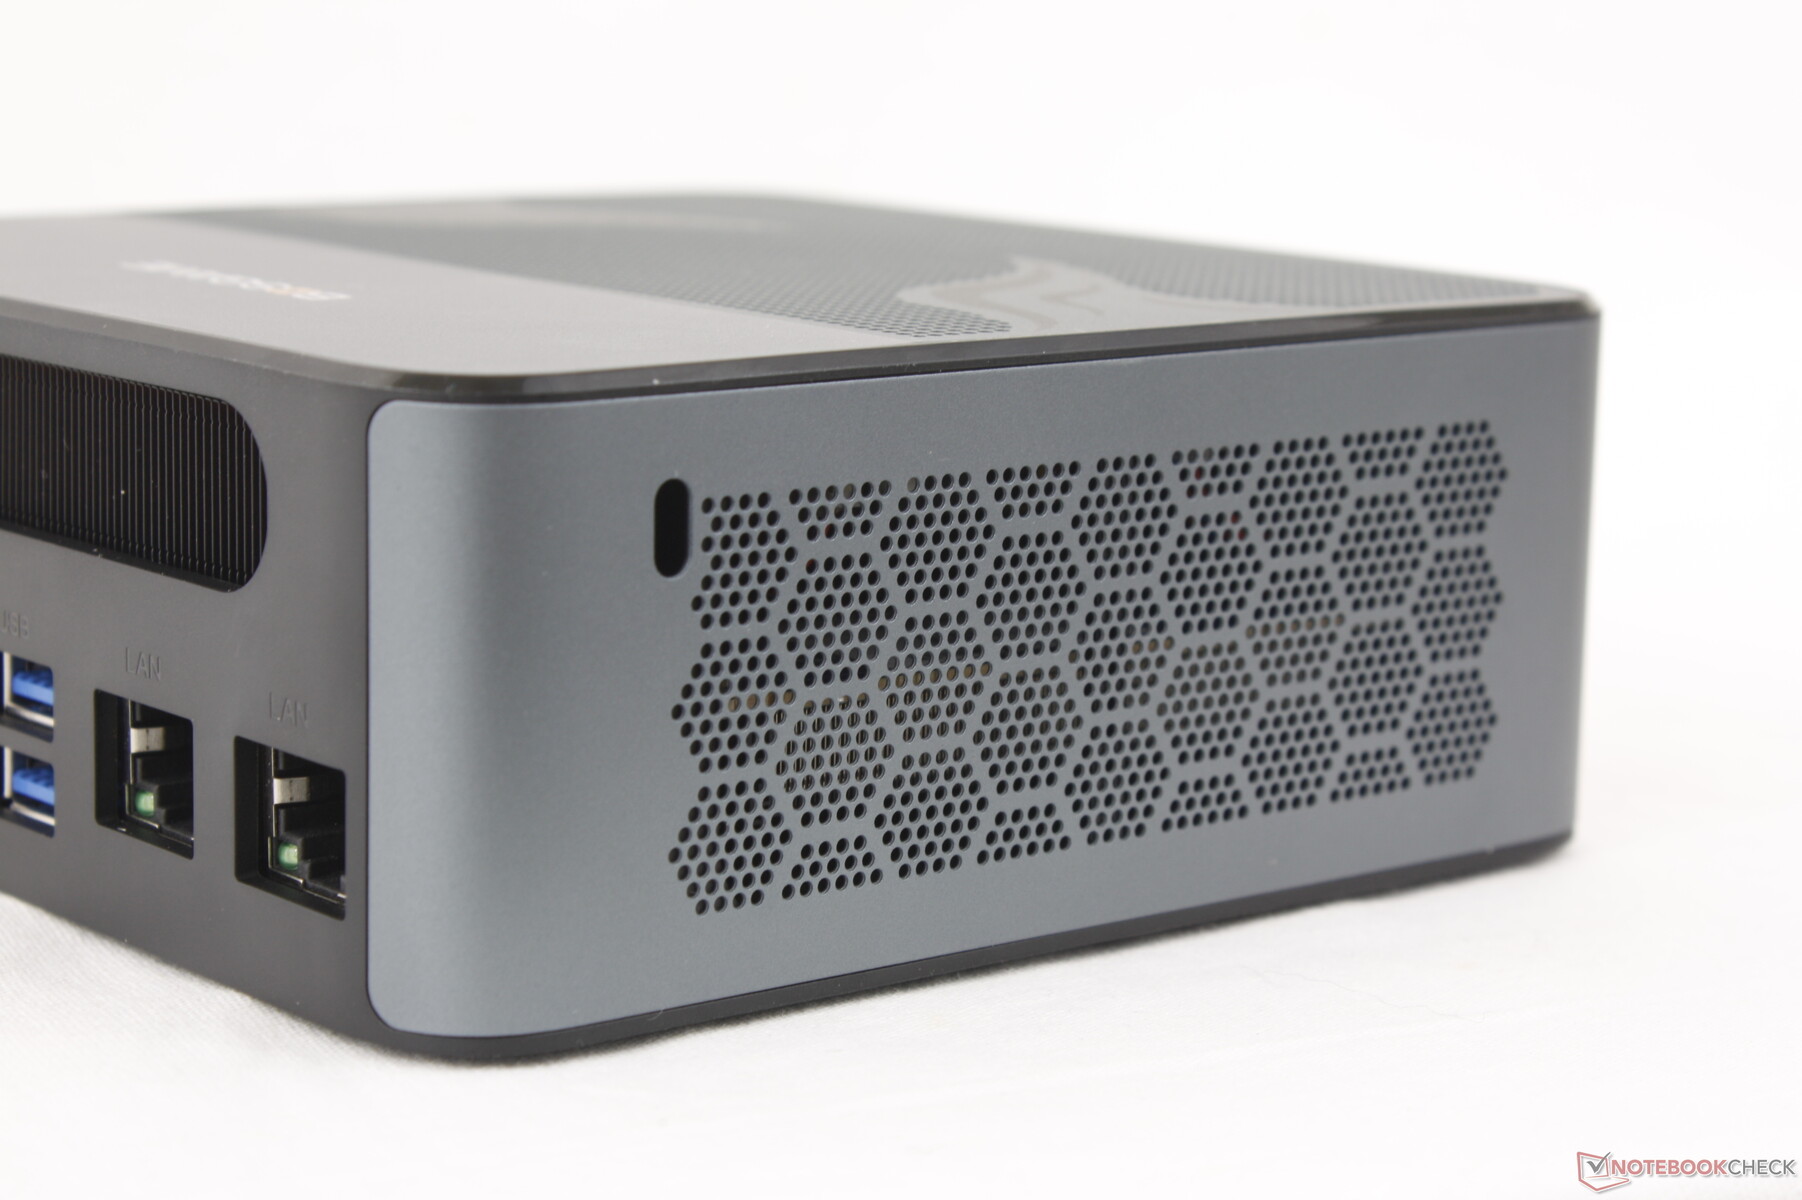
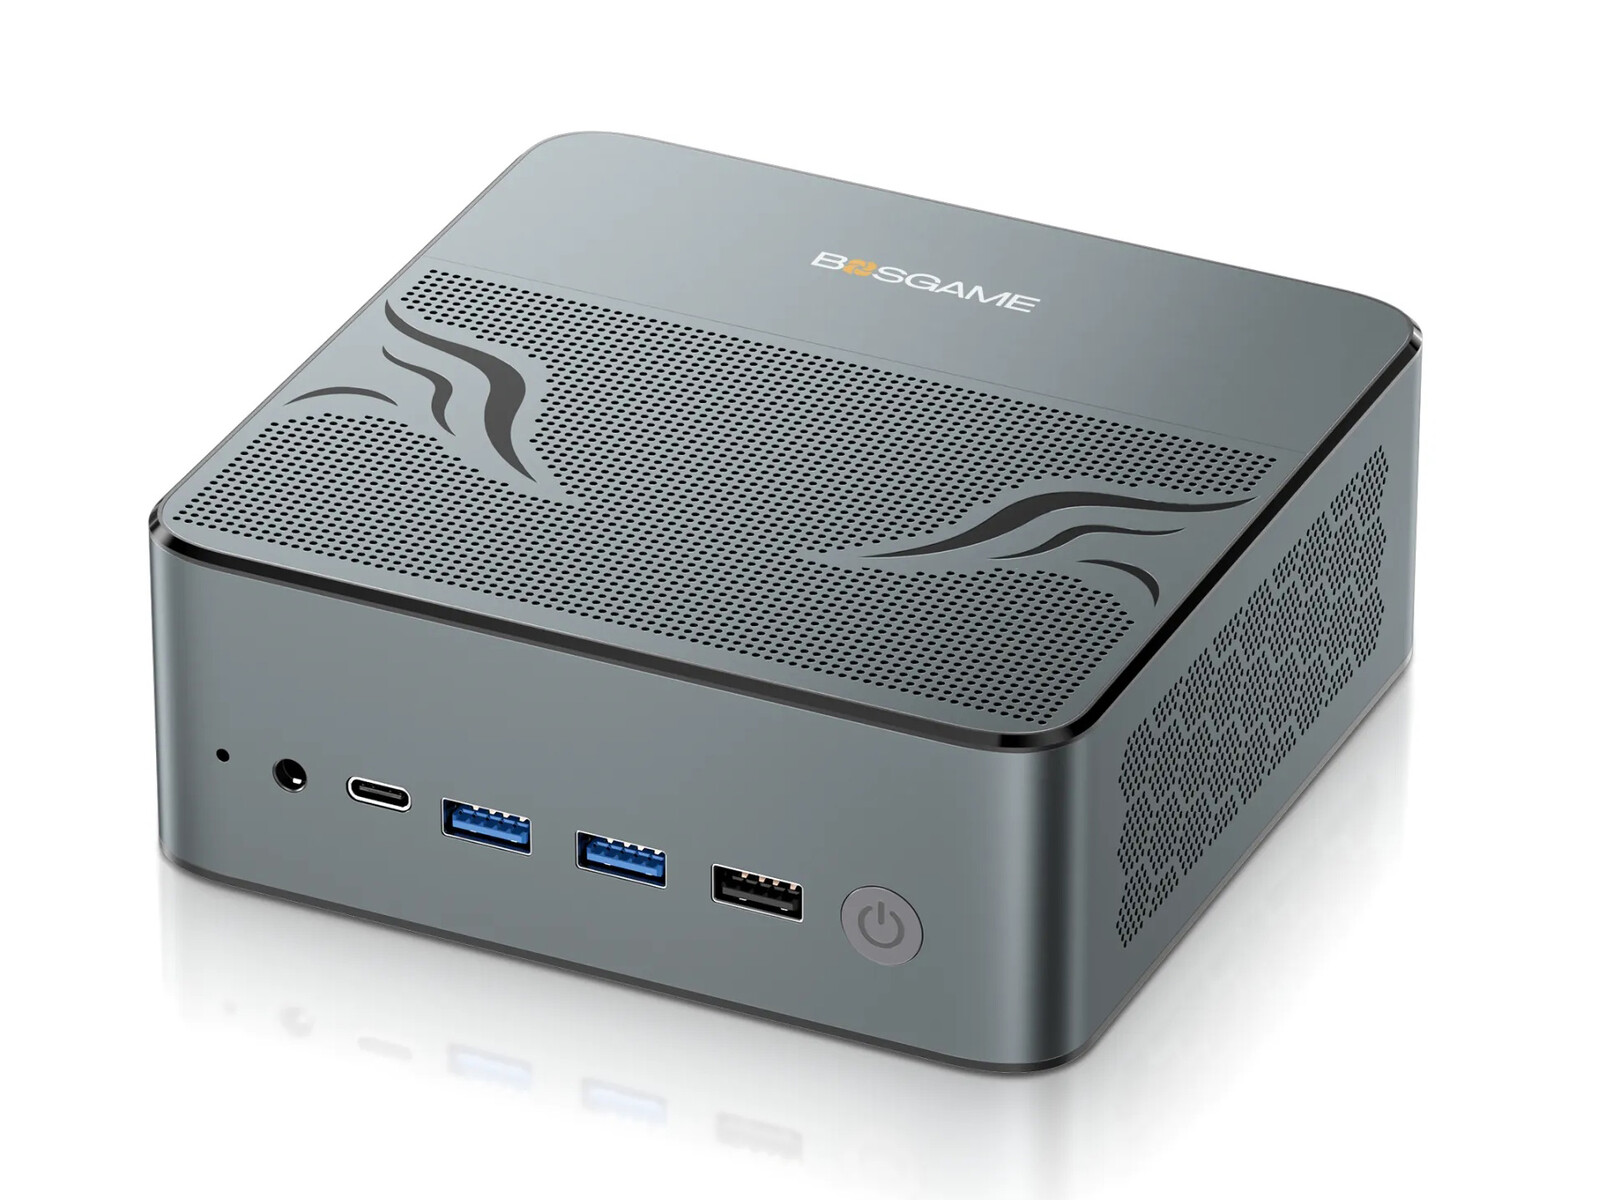
Anslutningsmöjligheter
Portalternativen är breda och varierade som man kan förvänta sig av en mini-dator. De portar som sticker ut på M1 inkluderar DisplayPort i full storlek och dubbla USB-C 4.0-portar för ett dockningsvänligt system. Observera att USB-C-portarna också är kompatibla med strömförsörjning på upp till 100 W; om du någonsin tappar bort den egenutvecklade nätadaptern som levereras med systemet, kan universella USB-C-växeladaptrar från tredje part användas för att driva modellen istället. Vår 135 W USB-C Lenovo-adapter är till exempel kompatibel med Bosgame M1. Förhoppningsvis kommer tillverkaren helt enkelt att släppa den speciella AC-fatadaptern helt och hållet till förmån för universella USB-C-adaptrar på framtida modeller.
Kommunikation
MediaTek MT7922 levereras som standard med Wi-Fi 6E och Bluetooth 5.2-anslutning. Överföringshastigheterna är både stabila och utmärkta när de kopplas till vårt Wi-Fi 6 eller 6E-nätverk.
| Networking | |
| iperf3 transmit AXE11000 | |
| BOSGAME M1 | |
| GMK NucBox M5 | |
| Beelink SER7 | |
| Beelink GTR6 | |
| Intel NUC 13 Pro Kit NUC13ANK | |
| GMK NucBox K6 | |
| iperf3 receive AXE11000 | |
| BOSGAME M1 | |
| GMK NucBox M5 | |
| GMK NucBox K6 | |
| Beelink SER7 | |
| Intel NUC 13 Pro Kit NUC13ANK | |
| Beelink GTR6 | |
| iperf3 transmit AXE11000 6GHz | |
| Intel NUC 13 Pro Kit NUC13ANK | |
| GMK NucBox M5 | |
| BOSGAME M1 | |
| Beelink GTR6 | |
| GMK NucBox K6 | |
| iperf3 receive AXE11000 6GHz | |
| Intel NUC 13 Pro Kit NUC13ANK | |
| GMK NucBox M5 | |
| BOSGAME M1 | |
| GMK NucBox K6 | |
| Beelink GTR6 | |
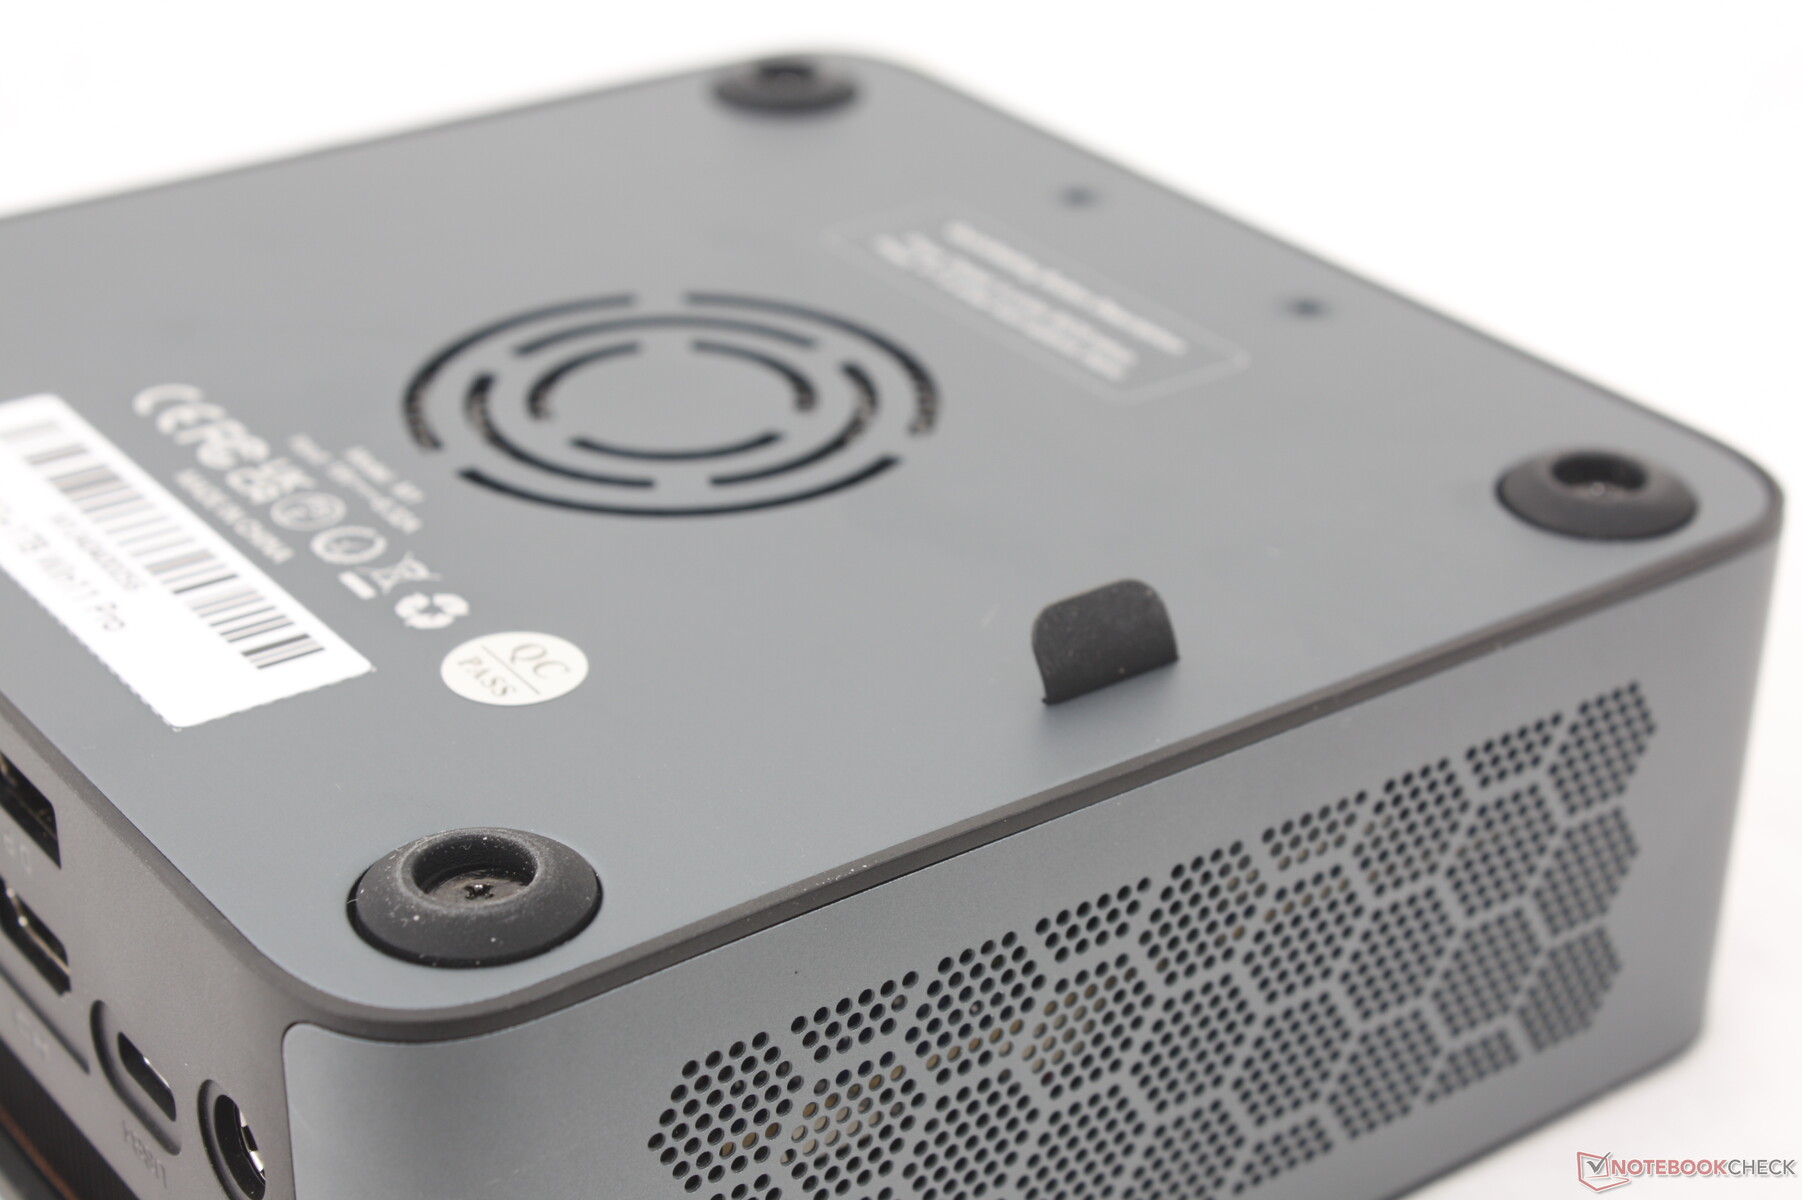
Underhåll
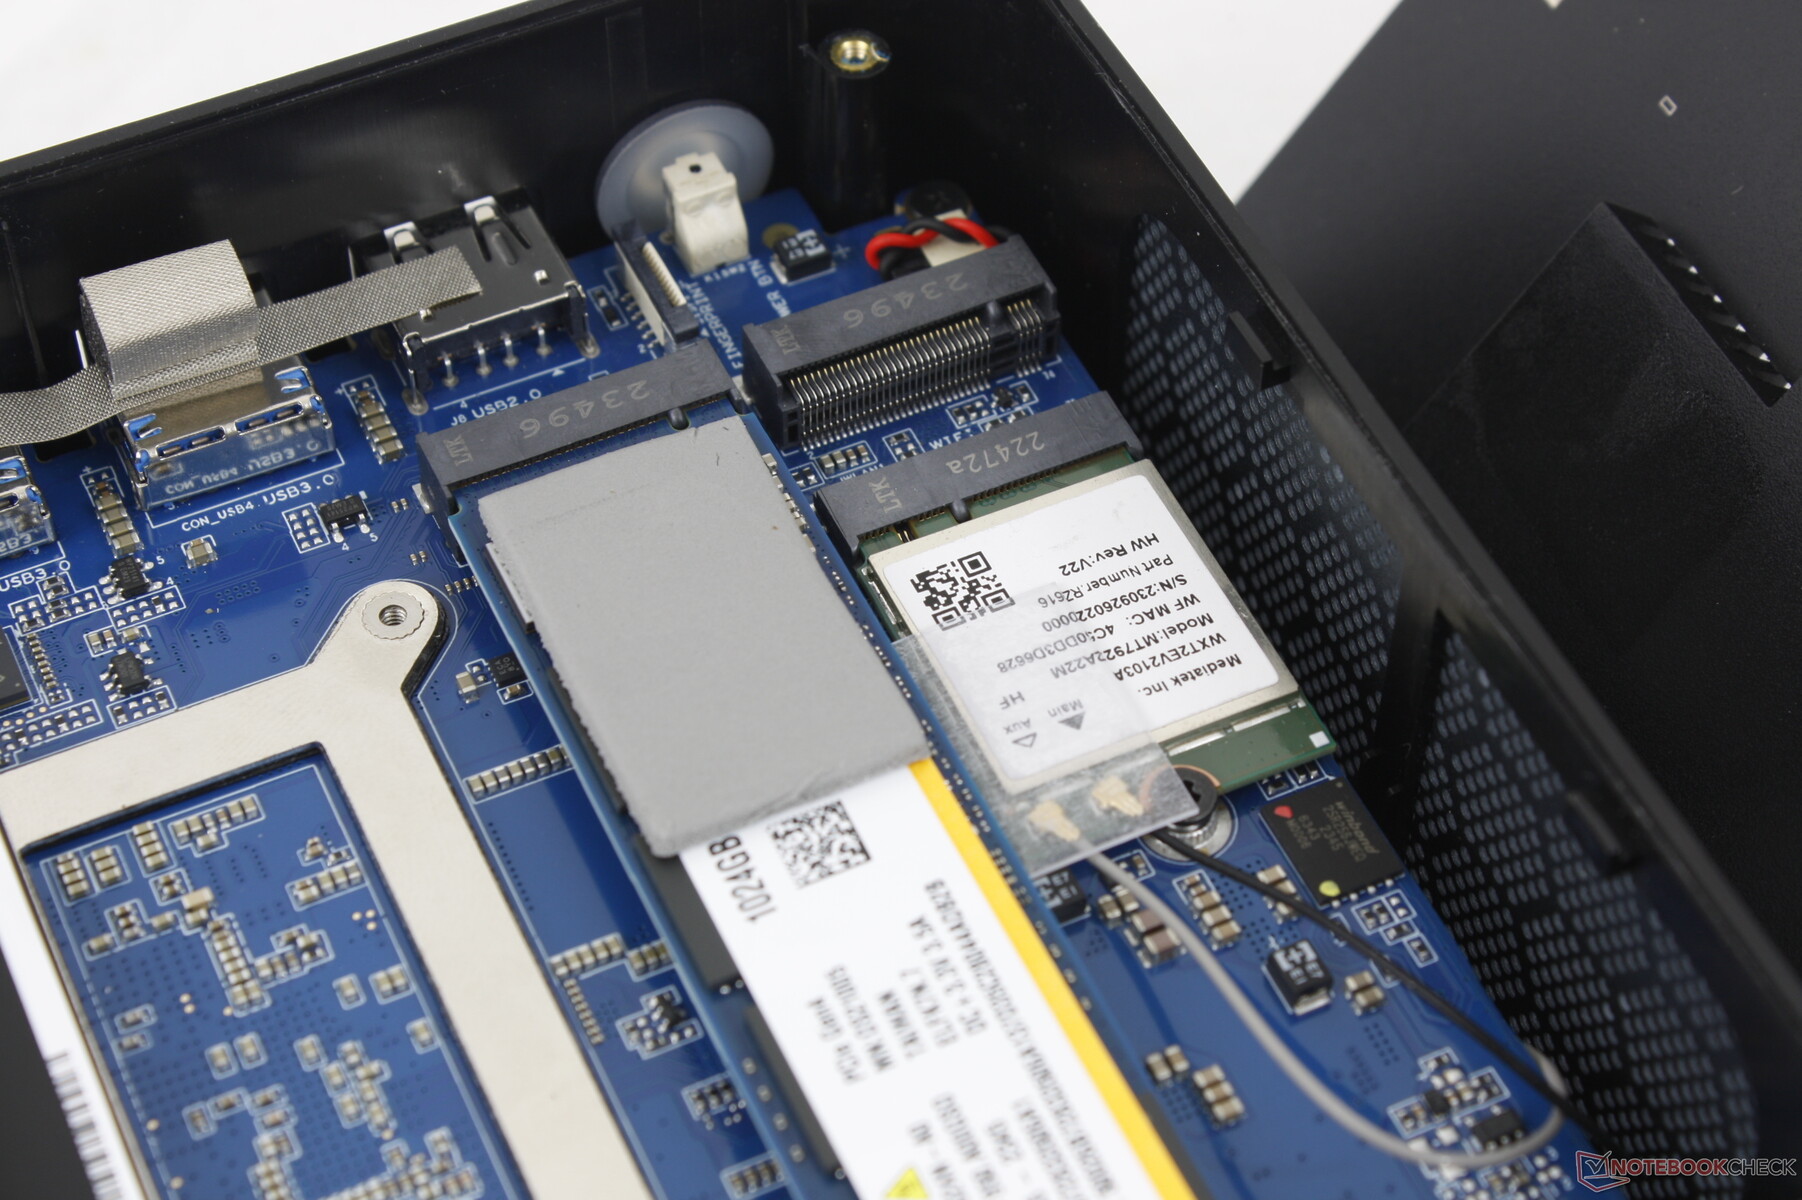
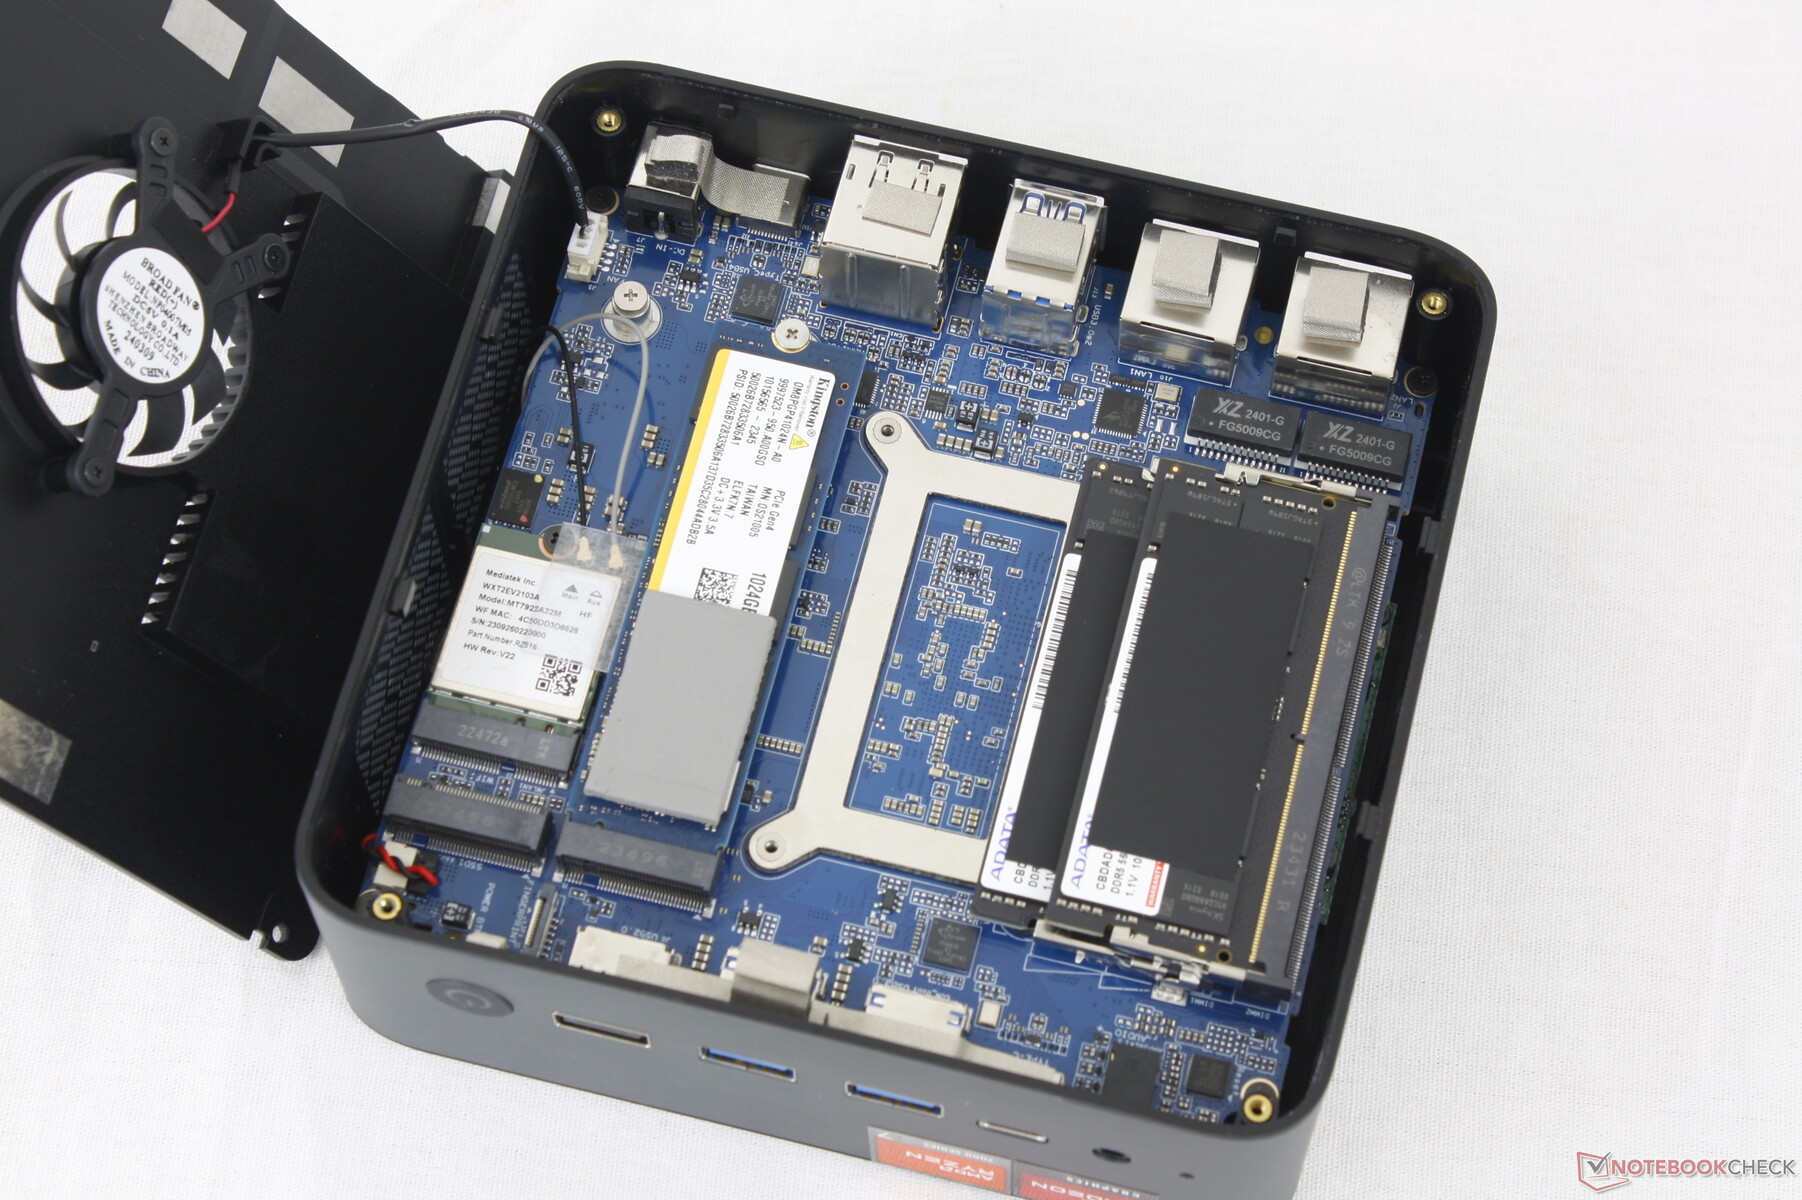
Service är en tvåstegsprocess eftersom moderkortet sitter under både kylanordningen och den löstagbara bottenplattan. Lyckligtvis krävs endast en stjärnskruvmejsel för att ta bort dessa två delar. Ägare har tillgång till 2x SODIMM-platser, 2x M.2 2280 PCIe4 x4-platser och den löstagbara WLAN-modulen som visas nedan.
För att komma åt den andra sidan av moderkortet krävs att moderkortet tas bort helt från chassit. Att rengöra den andra fläkten ovanpå moderkortet är därför mycket mer komplicerat än att rengöra den första fläkten under moderkortet.
Tillbehör och garanti
I förpackningen ingår ett löstagbart VESA-fäste med skruvar, HDMI-kabel och den vanliga nätadaptern samt pappersdokument. En ettårig begränsad tillverkargaranti gäller om den köps i USA.
Prestanda - Radeon 7 7840HS gör underverk för mini-datorer
Testförhållanden
Vi ställde in Windows i prestandaläge innan vi körde nedanstående benchmarks. Det finns inga specialiserade förinstallerade applikationer för en ren Windows-upplevelse.
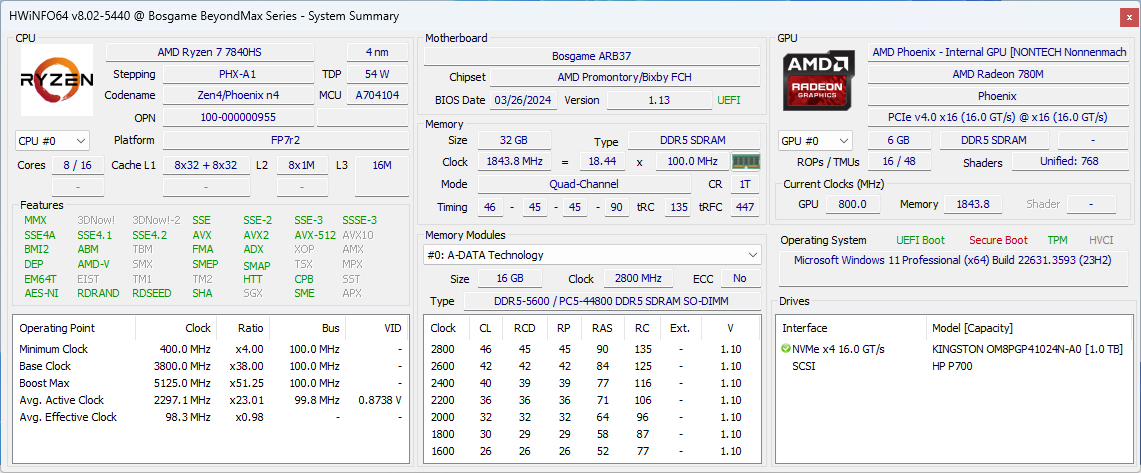
Processor
Den ett år gamla Ryzen 7 7840HS är fortfarande kraftfull och kan jämföras med nyare Meteor Lake-H- och Hawk Point-HS-processorer från Intel respektive AMD. Den nya Core Ultra 9 185H i den mycket dyrare Minisforum AtomMan X7 Tiär till exempel bara 10 till 15 procent snabbare och ger sämre prestanda per dollar än vårt Bosgame.
Att hålla fast vid den äldre Ryzen 7 7840HS kommer att innebära att du missar den integrerade NPU för Ryzen 7 8840HS eller Intel Meteor Lake-serien. Användare som inte har något intresse av lokal AI-acceleration kan dock tycka att Ryzen 7 7840HS är fördelaktigt eftersom det ofta kan överträffa Ryzen 7 8840HS när det gäller icke-AI-applikationer.
Cinebench R15 Multi Loop
Cinebench R23: Multi Core | Single Core
Cinebench R20: CPU (Multi Core) | CPU (Single Core)
Cinebench R15: CPU Multi 64Bit | CPU Single 64Bit
Blender: v2.79 BMW27 CPU
7-Zip 18.03: 7z b 4 | 7z b 4 -mmt1
Geekbench 6.7: Multi-Core | Single-Core
Geekbench 5.5: Multi-Core | Single-Core
HWBOT x265 Benchmark v2.2: 4k Preset
LibreOffice : 20 Documents To PDF
R Benchmark 2.5: Overall mean
| Geekbench 6.7 / Multi-Core | |
| Geekom A8, R9 8945HS | |
| Minisforum AtomMan X7 Ti | |
| BOSGAME M1 | |
| Genomsnitt AMD Ryzen 7 7840HS (11804 - 13538, n=21) | |
| Beelink SER7 | |
| Minisforum MS-01 | |
| Acemagic F2A | |
| Minisforum Venus Series NAB9 | |
| Geekom XT12 Pro | |
| Minisforum Mercury Series EM780 | |
| Geekom Mini IT12 | |
| Maxtang MTN-FP750 | |
| GMK NucBox M5 | |
| Geekbench 6.7 / Single-Core | |
| Geekom A8, R9 8945HS | |
| Genomsnitt AMD Ryzen 7 7840HS (2585 - 2721, n=21) | |
| Beelink SER7 | |
| BOSGAME M1 | |
| Minisforum MS-01 | |
| Minisforum Venus Series NAB9 | |
| Minisforum AtomMan X7 Ti | |
| Geekom XT12 Pro | |
| Acemagic F2A | |
| Geekom Mini IT12 | |
| Maxtang MTN-FP750 | |
| Minisforum Mercury Series EM780 | |
| GMK NucBox M5 | |
Cinebench R23: Multi Core | Single Core
Cinebench R20: CPU (Multi Core) | CPU (Single Core)
Cinebench R15: CPU Multi 64Bit | CPU Single 64Bit
Blender: v2.79 BMW27 CPU
7-Zip 18.03: 7z b 4 | 7z b 4 -mmt1
Geekbench 6.7: Multi-Core | Single-Core
Geekbench 5.5: Multi-Core | Single-Core
HWBOT x265 Benchmark v2.2: 4k Preset
LibreOffice : 20 Documents To PDF
R Benchmark 2.5: Overall mean
* ... mindre är bättre
AIDA64: FP32 Ray-Trace | FPU Julia | CPU SHA3 | CPU Queen | FPU SinJulia | FPU Mandel | CPU AES | CPU ZLib | FP64 Ray-Trace | CPU PhotoWorxx
| Performance rating | |
| BOSGAME M1 | |
| GMK NucBox K6 | |
| Beelink SER7 | |
| Genomsnitt AMD Ryzen 7 7840HS | |
| Beelink GTR6 | |
| Intel NUC 13 Pro Kit NUC13ANK | |
| GMK NucBox M5 | |
| AIDA64 / FP32 Ray-Trace | |
| Genomsnitt AMD Ryzen 7 7840HS (22845 - 28921, n=21) | |
| BOSGAME M1 | |
| Beelink SER7 | |
| GMK NucBox K6 | |
| Beelink GTR6 | |
| Intel NUC 13 Pro Kit NUC13ANK | |
| GMK NucBox M5 | |
| AIDA64 / FPU Julia | |
| Genomsnitt AMD Ryzen 7 7840HS (97164 - 123167, n=21) | |
| BOSGAME M1 | |
| Beelink SER7 | |
| GMK NucBox K6 | |
| Beelink GTR6 | |
| Intel NUC 13 Pro Kit NUC13ANK | |
| GMK NucBox M5 | |
| AIDA64 / CPU SHA3 | |
| BOSGAME M1 | |
| Beelink SER7 | |
| Genomsnitt AMD Ryzen 7 7840HS (4293 - 5155, n=21) | |
| GMK NucBox K6 | |
| Beelink GTR6 | |
| Intel NUC 13 Pro Kit NUC13ANK | |
| GMK NucBox M5 | |
| AIDA64 / CPU Queen | |
| BOSGAME M1 | |
| Genomsnitt AMD Ryzen 7 7840HS (102271 - 125820, n=21) | |
| Beelink SER7 | |
| GMK NucBox K6 | |
| Beelink GTR6 | |
| Intel NUC 13 Pro Kit NUC13ANK | |
| GMK NucBox M5 | |
| AIDA64 / FPU SinJulia | |
| BOSGAME M1 | |
| Genomsnitt AMD Ryzen 7 7840HS (13767 - 15525, n=21) | |
| GMK NucBox K6 | |
| Beelink SER7 | |
| Beelink GTR6 | |
| GMK NucBox M5 | |
| Intel NUC 13 Pro Kit NUC13ANK | |
| AIDA64 / FPU Mandel | |
| Genomsnitt AMD Ryzen 7 7840HS (52084 - 65812, n=21) | |
| BOSGAME M1 | |
| Beelink SER7 | |
| GMK NucBox K6 | |
| Beelink GTR6 | |
| Intel NUC 13 Pro Kit NUC13ANK | |
| GMK NucBox M5 | |
| AIDA64 / CPU AES | |
| BOSGAME M1 | |
| GMK NucBox K6 | |
| Beelink SER7 | |
| Genomsnitt AMD Ryzen 7 7840HS (67389 - 177158, n=21) | |
| Beelink GTR6 | |
| Intel NUC 13 Pro Kit NUC13ANK | |
| GMK NucBox M5 | |
| AIDA64 / CPU ZLib | |
| Genomsnitt AMD Ryzen 7 7840HS (944 - 1123, n=21) | |
| BOSGAME M1 | |
| GMK NucBox K6 | |
| Beelink SER7 | |
| Intel NUC 13 Pro Kit NUC13ANK | |
| Beelink GTR6 | |
| GMK NucBox M5 | |
| AIDA64 / FP64 Ray-Trace | |
| Genomsnitt AMD Ryzen 7 7840HS (12248 - 15599, n=21) | |
| Beelink SER7 | |
| BOSGAME M1 | |
| GMK NucBox K6 | |
| Beelink GTR6 | |
| Intel NUC 13 Pro Kit NUC13ANK | |
| GMK NucBox M5 | |
| AIDA64 / CPU PhotoWorxx | |
| BOSGAME M1 | |
| Beelink SER7 | |
| GMK NucBox K6 | |
| Genomsnitt AMD Ryzen 7 7840HS (17615 - 41516, n=21) | |
| Beelink GTR6 | |
| Intel NUC 13 Pro Kit NUC13ANK | |
| GMK NucBox M5 | |
Stresstest
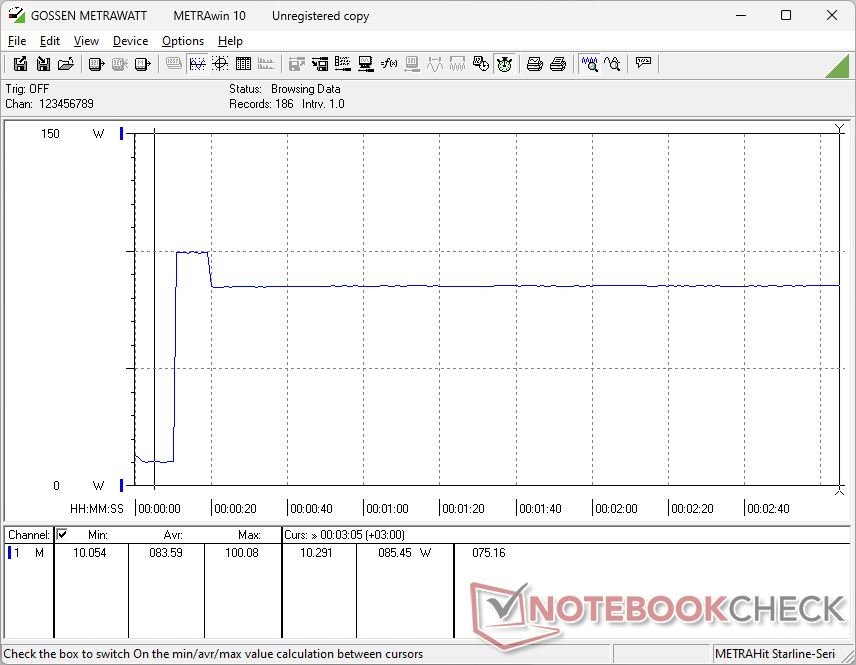
Prime95-stress gör att processorn ökar till 4,3 GHz och 65 W under de första sekunderna innan den stabiliseras på 4 GHz, 54 W och 80 C. Upprepas detta test på Beelink SER7 med exakt samma Ryzen 7-processor skulle ge mycket liknande resultat, även om vår M1 är märkbart större och tyngre än Beelink.
GPU-klockfrekvens och temperatur vid körning Witcher 3 för att representera spelstress skulle stabiliseras vid 2700 MHz respektive 67 C, jämfört med ~ 2500 MHz på Beelink SER7 eller GMK NucBox K6 som alla är utrustade med samma AMD-processor. Den något högre GPU-klockfrekvensen i vårt Bosgame korrelerar med den något högre grafikprestandan i avsnittet GPU-prestanda nedan.
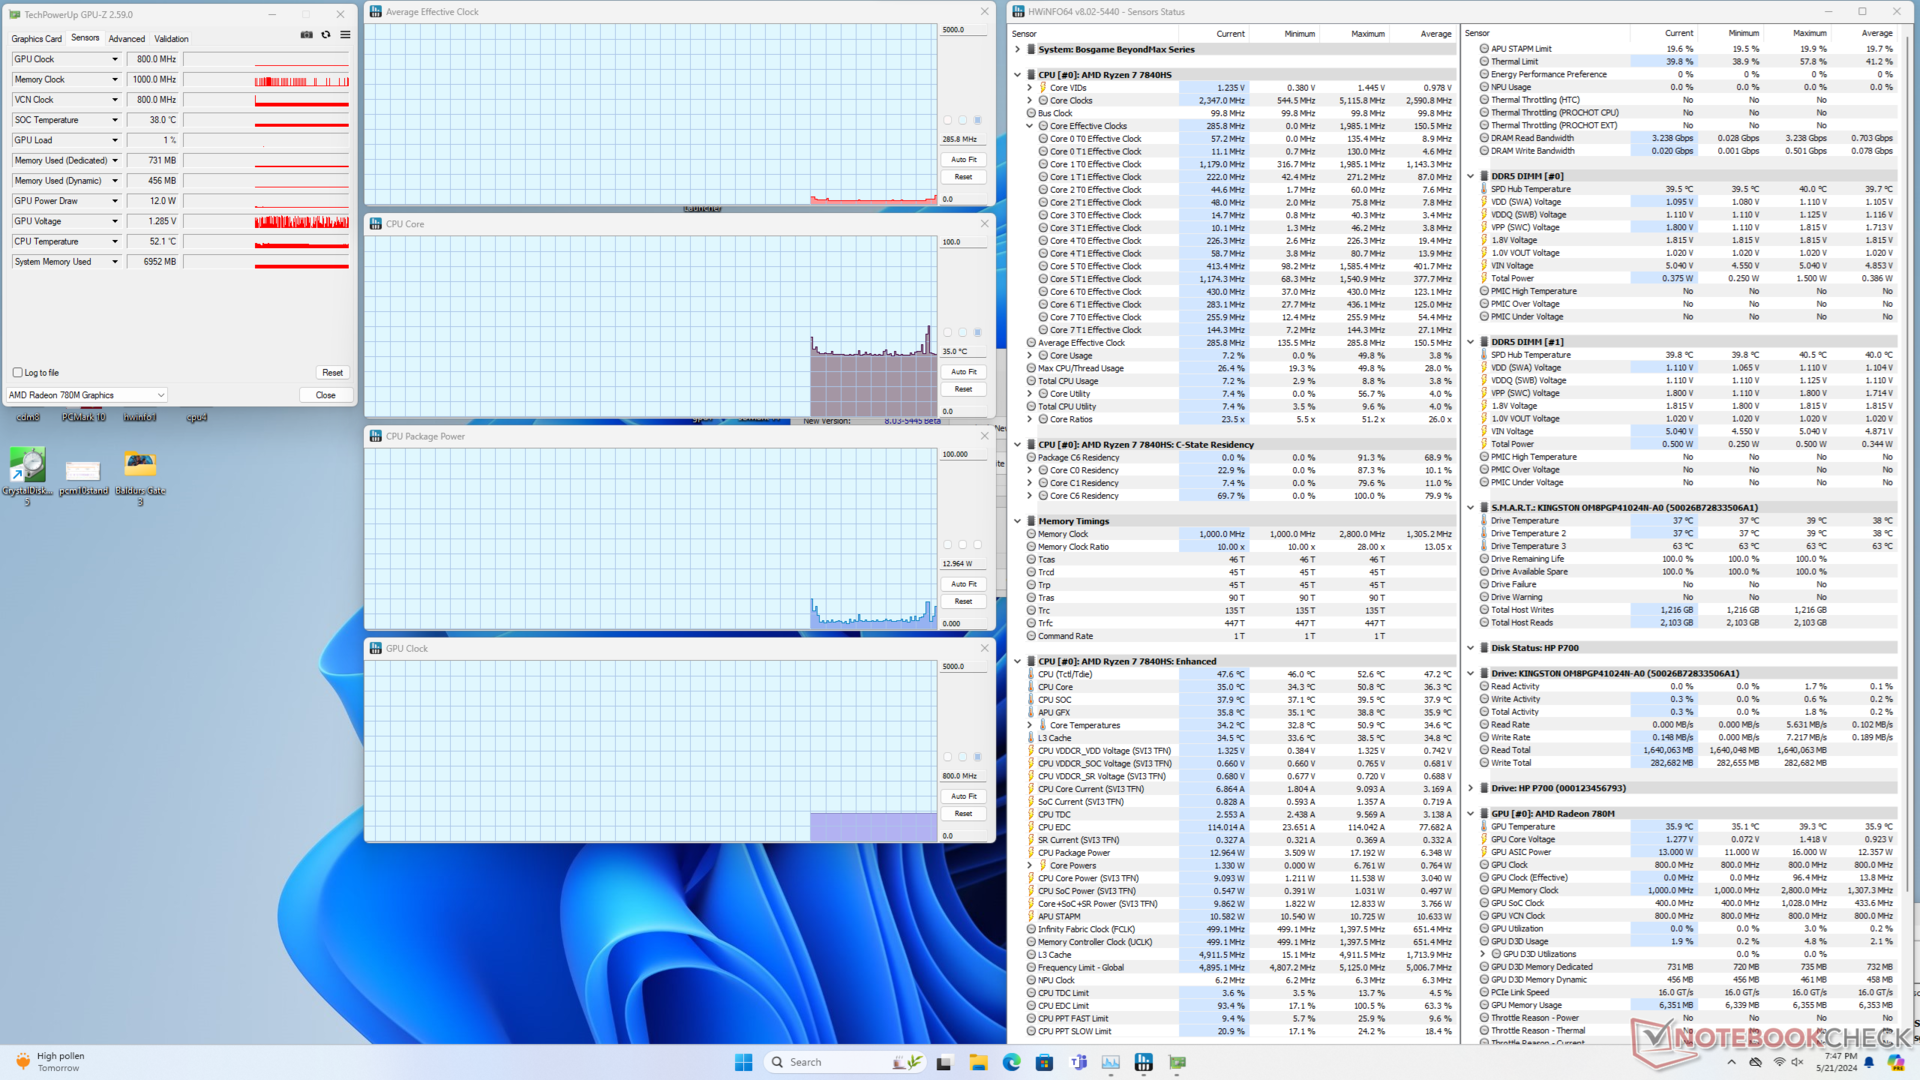
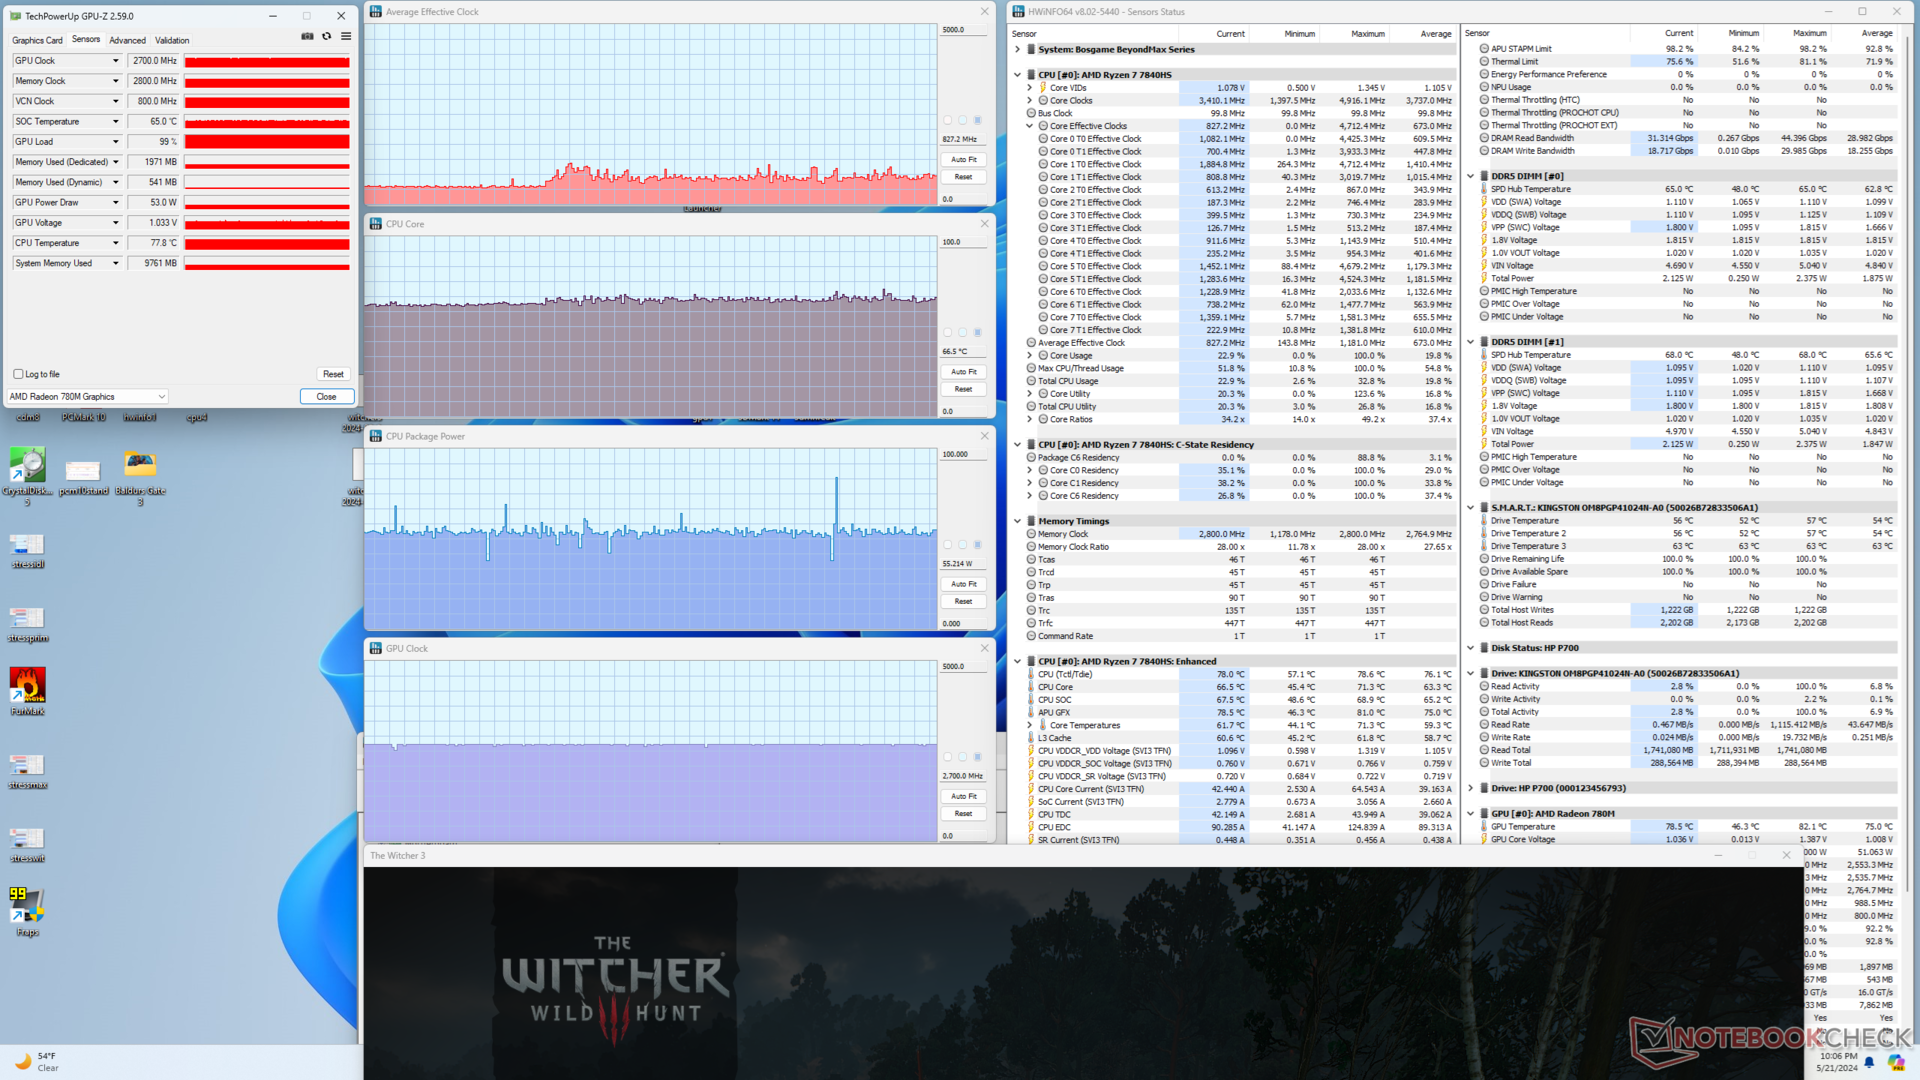
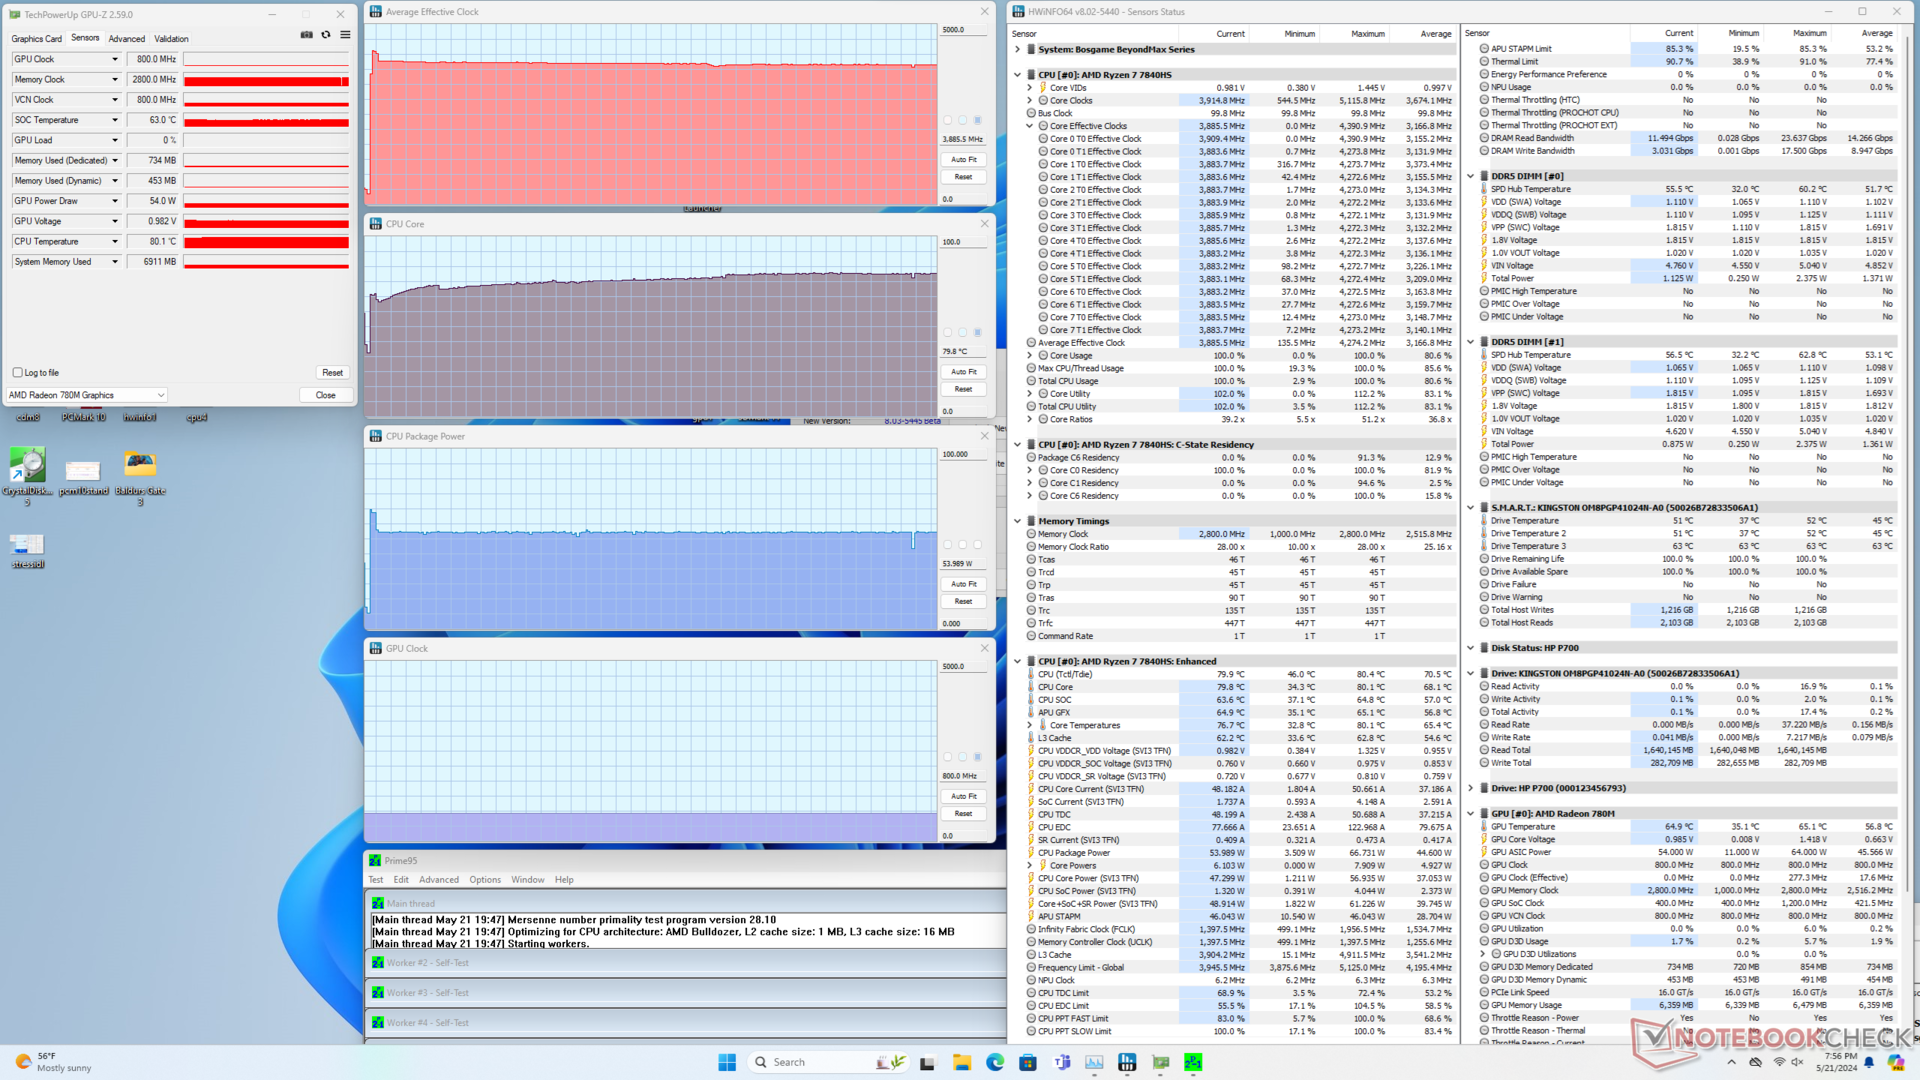
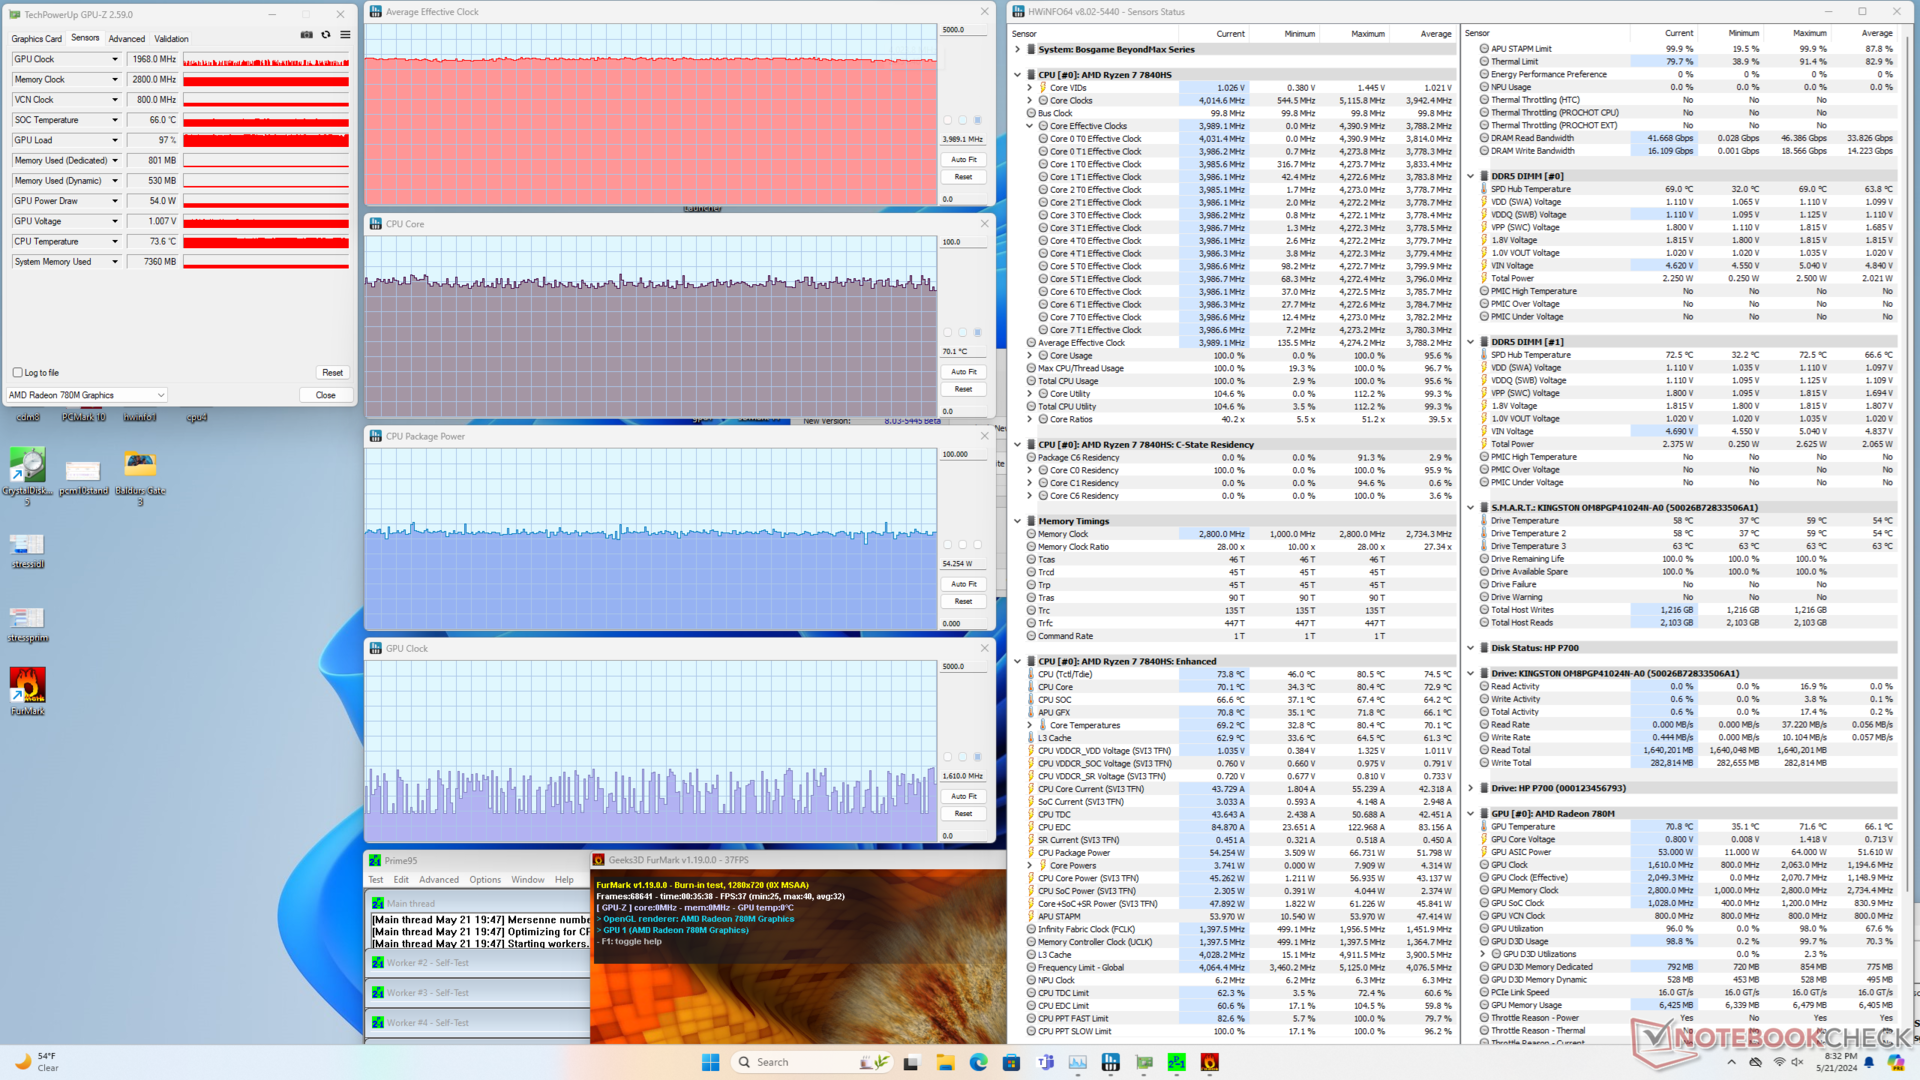
| Genomsnittlig CPU-klocka (GHz) | GPU-klocka (MHz) | Genomsnittlig CPU-temperatur (°C) | |
| System i viloläge | -- | -- | 35 |
| Prime95 Stress | 3.9 | -- | 80 |
| Prime95 + FurMark Stress | 4.0 | 833 - 2100 | 70 |
| Witcher 3 Stress | ~0,8 | 2700 | 67 |
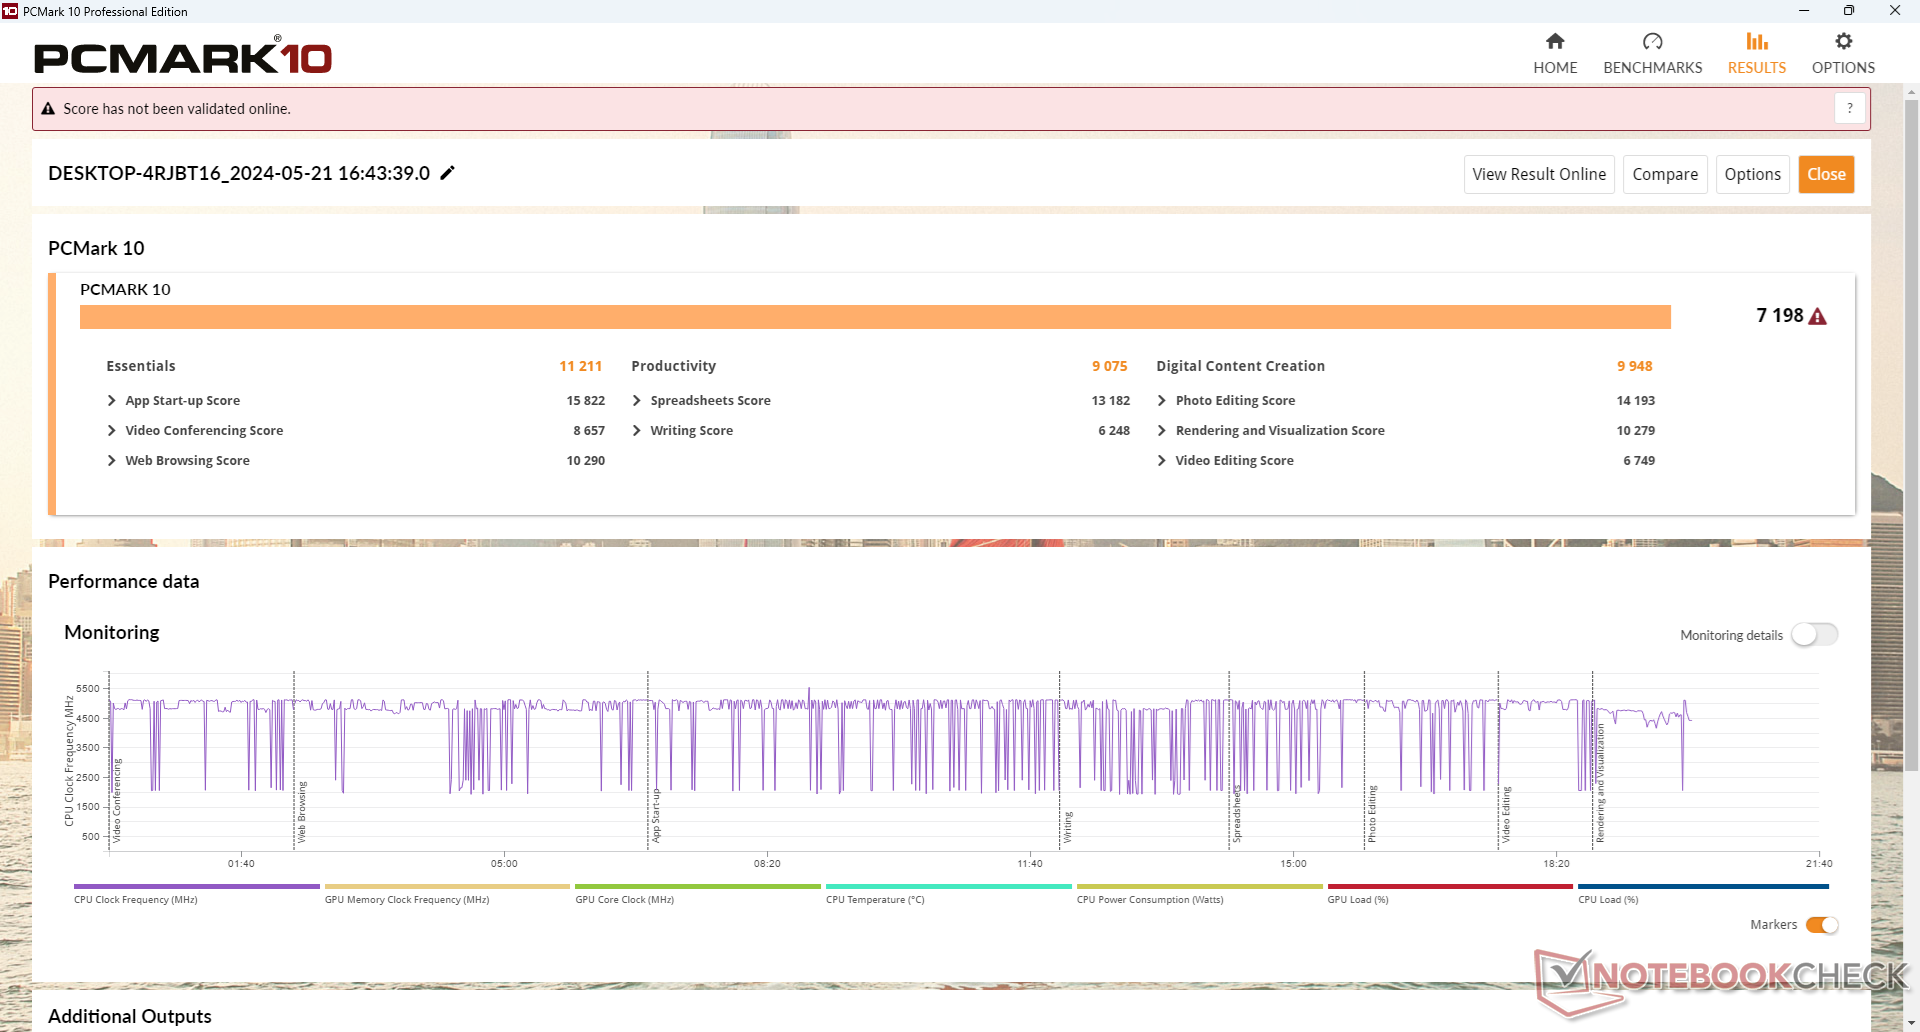
Systemets prestanda
PCMark-resultaten är jämförbara med andra avancerade minidatorer som GMK NucBox K6 eller Beelink SER7. Särskilt dess delresultat för skapande av digitalt innehåll är mycket högre än någon annan minidator som körs på äldre Iris Xe- eller RX Vega-hårdvara.
Vi upplevde inga större problem på vår testenhet, men systemet gav ifrån sig ett irriterande pip varje minut eller så vid uppstart när Bluetooth-högtalarna aktivt sökte. Om du kopplar bort högtalarna via Bluetooth-menyn kommer pipet att sluta.
CrossMark: Overall | Productivity | Creativity | Responsiveness
WebXPRT 3: Overall
WebXPRT 4: Overall
Mozilla Kraken 1.1: Total
| PCMark 10 / Score | |
| GMK NucBox K6 | |
| Genomsnitt AMD Ryzen 7 7840HS, AMD Radeon 780M (6914 - 7651, n=10) | |
| Beelink SER7 | |
| BOSGAME M1 | |
| Beelink GTR6 | |
| Intel NUC 13 Pro Kit NUC13ANK | |
| GMK NucBox M5 | |
| PCMark 10 / Essentials | |
| Intel NUC 13 Pro Kit NUC13ANK | |
| Beelink GTR6 | |
| GMK NucBox K6 | |
| BOSGAME M1 | |
| Genomsnitt AMD Ryzen 7 7840HS, AMD Radeon 780M (10519 - 11214, n=10) | |
| Beelink SER7 | |
| GMK NucBox M5 | |
| PCMark 10 / Productivity | |
| GMK NucBox K6 | |
| Beelink SER7 | |
| Beelink GTR6 | |
| Genomsnitt AMD Ryzen 7 7840HS, AMD Radeon 780M (9075 - 10970, n=10) | |
| BOSGAME M1 | |
| GMK NucBox M5 | |
| Intel NUC 13 Pro Kit NUC13ANK | |
| PCMark 10 / Digital Content Creation | |
| BOSGAME M1 | |
| GMK NucBox K6 | |
| Genomsnitt AMD Ryzen 7 7840HS, AMD Radeon 780M (9052 - 9987, n=10) | |
| Beelink SER7 | |
| Beelink GTR6 | |
| Intel NUC 13 Pro Kit NUC13ANK | |
| GMK NucBox M5 | |
| CrossMark / Overall | |
| BOSGAME M1 | |
| GMK NucBox K6 | |
| Intel NUC 13 Pro Kit NUC13ANK | |
| Genomsnitt AMD Ryzen 7 7840HS, AMD Radeon 780M (1566 - 1891, n=10) | |
| Beelink SER7 | |
| Beelink GTR6 | |
| GMK NucBox M5 | |
| CrossMark / Productivity | |
| BOSGAME M1 | |
| GMK NucBox K6 | |
| Intel NUC 13 Pro Kit NUC13ANK | |
| Beelink GTR6 | |
| Genomsnitt AMD Ryzen 7 7840HS, AMD Radeon 780M (1535 - 1823, n=10) | |
| Beelink SER7 | |
| GMK NucBox M5 | |
| CrossMark / Creativity | |
| BOSGAME M1 | |
| GMK NucBox K6 | |
| Intel NUC 13 Pro Kit NUC13ANK | |
| Beelink SER7 | |
| Genomsnitt AMD Ryzen 7 7840HS, AMD Radeon 780M (1556 - 2040, n=10) | |
| Beelink GTR6 | |
| GMK NucBox M5 | |
| CrossMark / Responsiveness | |
| BOSGAME M1 | |
| GMK NucBox K6 | |
| Beelink GTR6 | |
| Intel NUC 13 Pro Kit NUC13ANK | |
| Genomsnitt AMD Ryzen 7 7840HS, AMD Radeon 780M (1293 - 1749, n=10) | |
| Beelink SER7 | |
| GMK NucBox M5 | |
| WebXPRT 3 / Overall | |
| Beelink SER7 | |
| GMK NucBox K6 | |
| Genomsnitt AMD Ryzen 7 7840HS, AMD Radeon 780M (297 - 339, n=10) | |
| BOSGAME M1 | |
| Intel NUC 13 Pro Kit NUC13ANK | |
| Beelink GTR6 | |
| GMK NucBox M5 | |
| WebXPRT 4 / Overall | |
| Intel NUC 13 Pro Kit NUC13ANK | |
| GMK NucBox K6 | |
| Genomsnitt AMD Ryzen 7 7840HS, AMD Radeon 780M (245 - 319, n=9) | |
| Beelink SER7 | |
| BOSGAME M1 | |
| Beelink GTR6 | |
| GMK NucBox M5 | |
| Mozilla Kraken 1.1 / Total | |
| GMK NucBox M5 | |
| Beelink GTR6 | |
| GMK NucBox K6 | |
| BOSGAME M1 | |
| Beelink SER7 | |
| Genomsnitt AMD Ryzen 7 7840HS, AMD Radeon 780M (485 - 544, n=10) | |
| Intel NUC 13 Pro Kit NUC13ANK | |
* ... mindre är bättre
| PCMark 10 Score | 7198 poäng | |
Hjälp | ||
| AIDA64 / Memory Copy | |
| BOSGAME M1 | |
| Beelink SER7 | |
| GMK NucBox K6 | |
| Genomsnitt AMD Ryzen 7 7840HS (30937 - 72158, n=21) | |
| Beelink GTR6 | |
| Intel NUC 13 Pro Kit NUC13ANK | |
| GMK NucBox M5 | |
| AIDA64 / Memory Read | |
| Beelink SER7 | |
| BOSGAME M1 | |
| GMK NucBox K6 | |
| Genomsnitt AMD Ryzen 7 7840HS (30497 - 62147, n=21) | |
| Beelink GTR6 | |
| GMK NucBox M5 | |
| Intel NUC 13 Pro Kit NUC13ANK | |
| AIDA64 / Memory Write | |
| Beelink SER7 | |
| BOSGAME M1 | |
| GMK NucBox K6 | |
| Genomsnitt AMD Ryzen 7 7840HS (34590 - 93323, n=21) | |
| Beelink GTR6 | |
| GMK NucBox M5 | |
| Intel NUC 13 Pro Kit NUC13ANK | |
| AIDA64 / Memory Latency | |
| GMK NucBox M5 | |
| Intel NUC 13 Pro Kit NUC13ANK | |
| Genomsnitt AMD Ryzen 7 7840HS (85.1 - 112, n=21) | |
| BOSGAME M1 | |
| GMK NucBox K6 | |
| Beelink SER7 | |
| Beelink GTR6 | |
* ... mindre är bättre
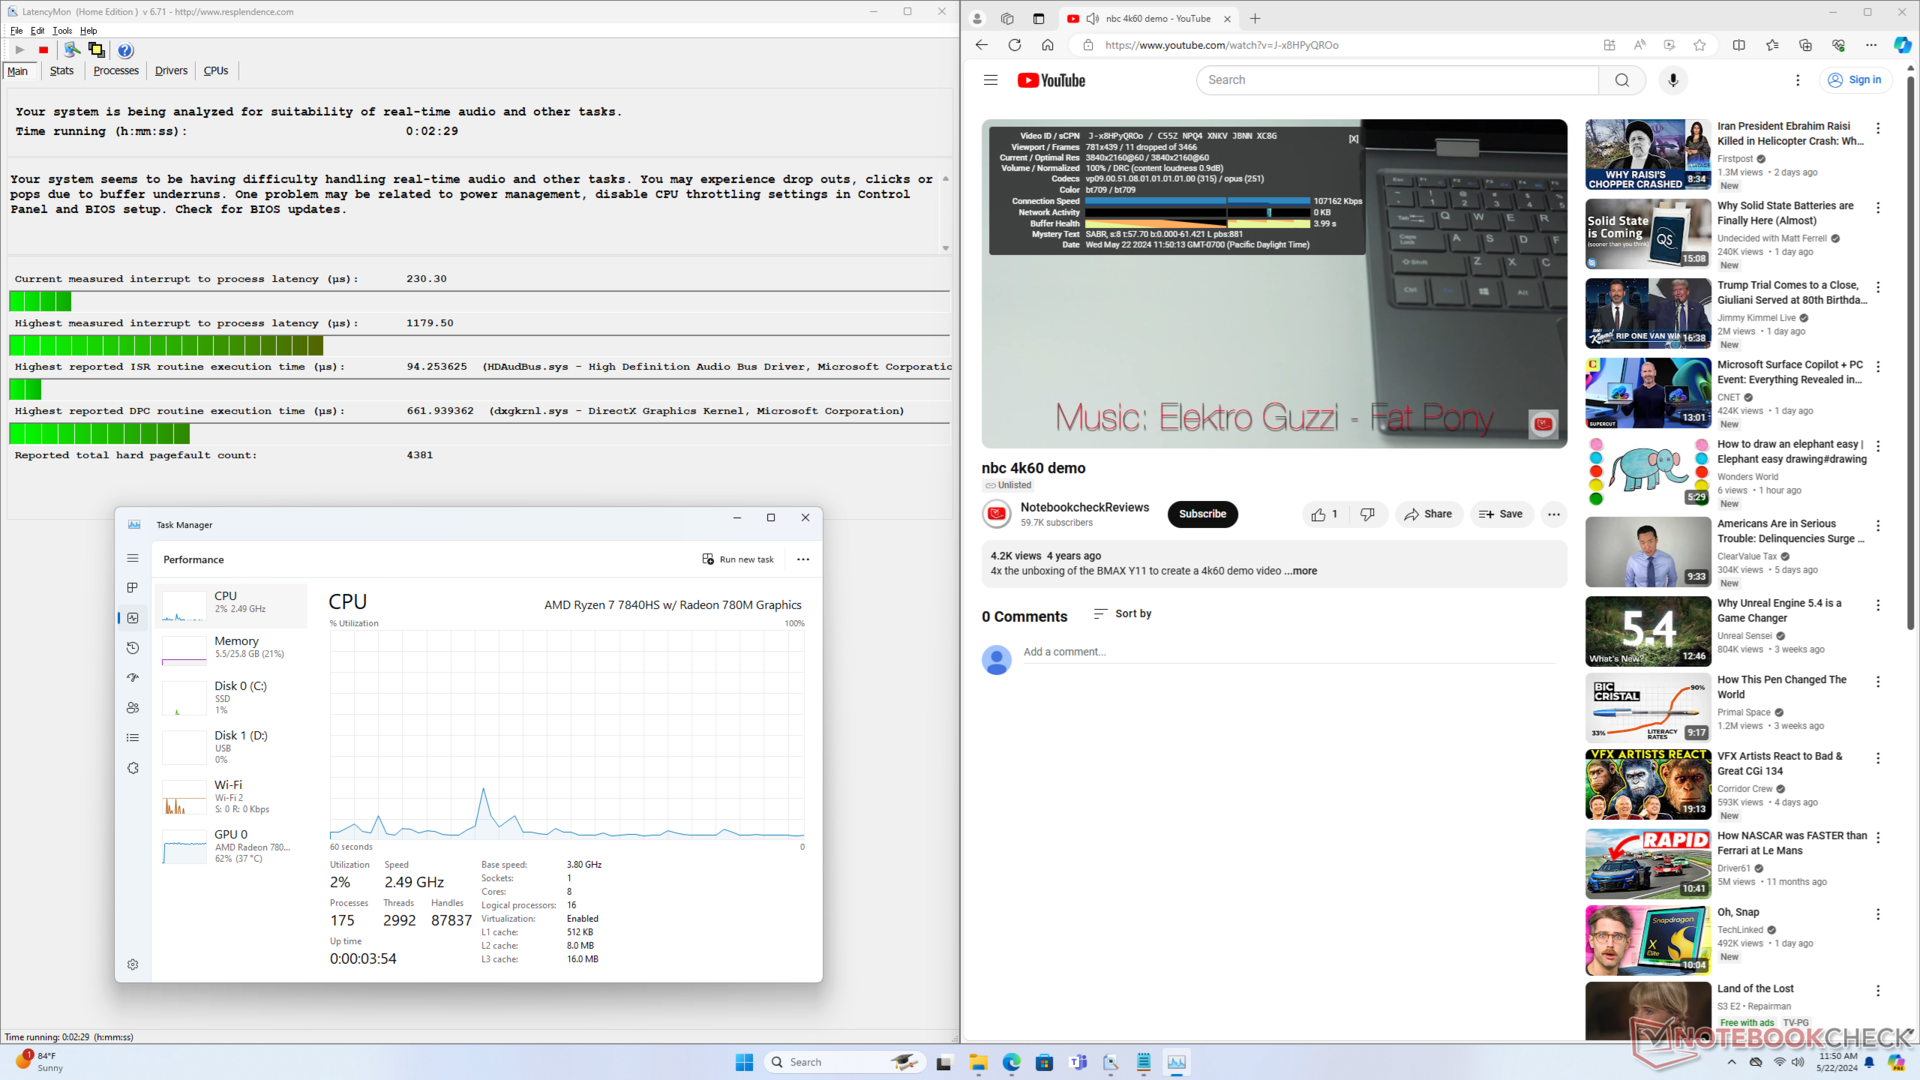
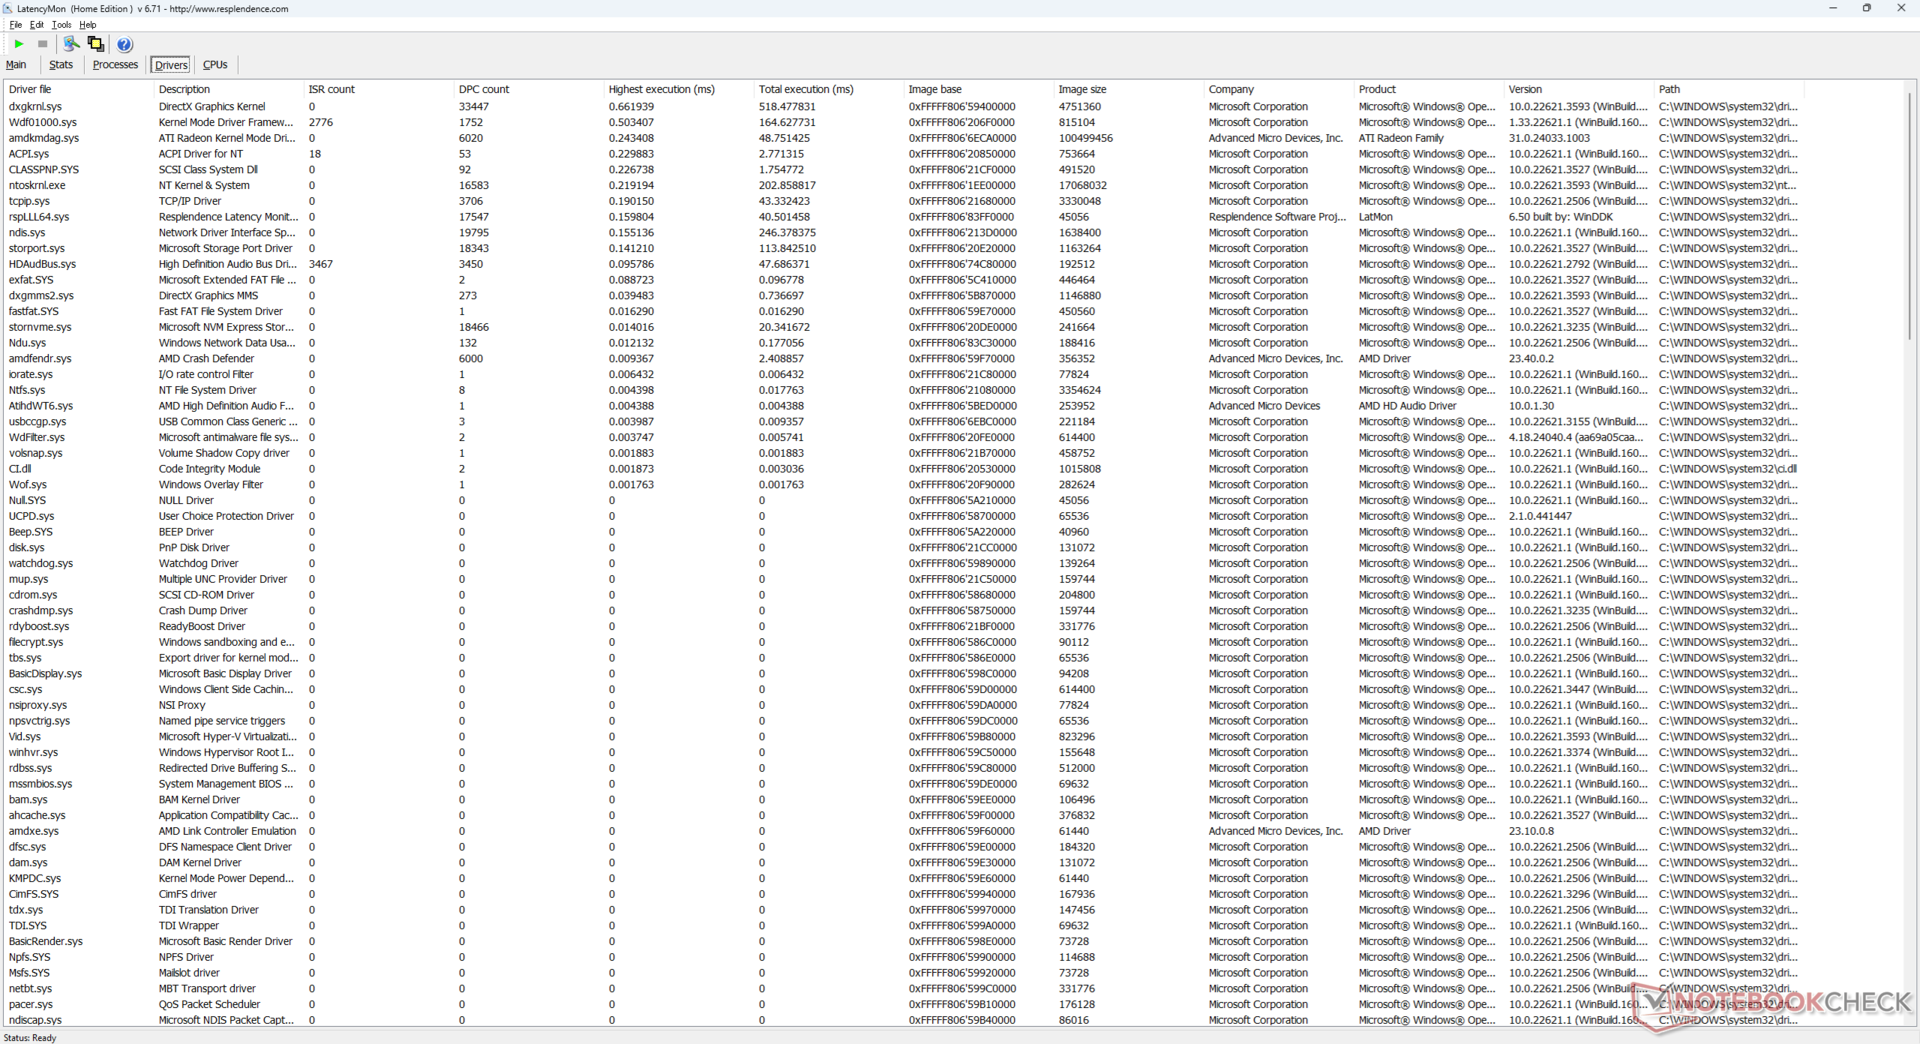
DPC-fördröjning
LatencyMon avslöjar bara mindre DPC-problem när du öppnar flera webbläsarflikar på vår hemsida. 4K-videouppspelning med 60 FPS är dock tyvärr ofullständig med 11 tappade bildrutor inspelade under en 60-sekunders tidsperiod. Det borde helst inte finnas några tappade bildrutor alls med tanke på hur kraftfull Zen 4-processorn är. Det är här Intel-baserade datorer har visat sig vara konsekvent bättre när det gäller videouppspelning.
| DPC Latencies / LatencyMon - interrupt to process latency (max), Web, Youtube, Prime95 | |
| GMK NucBox K6 | |
| GMK NucBox M5 | |
| BOSGAME M1 | |
| Intel NUC 13 Pro Kit NUC13ANK | |
| Beelink SER7 | |
| Beelink GTR6 | |
* ... mindre är bättre
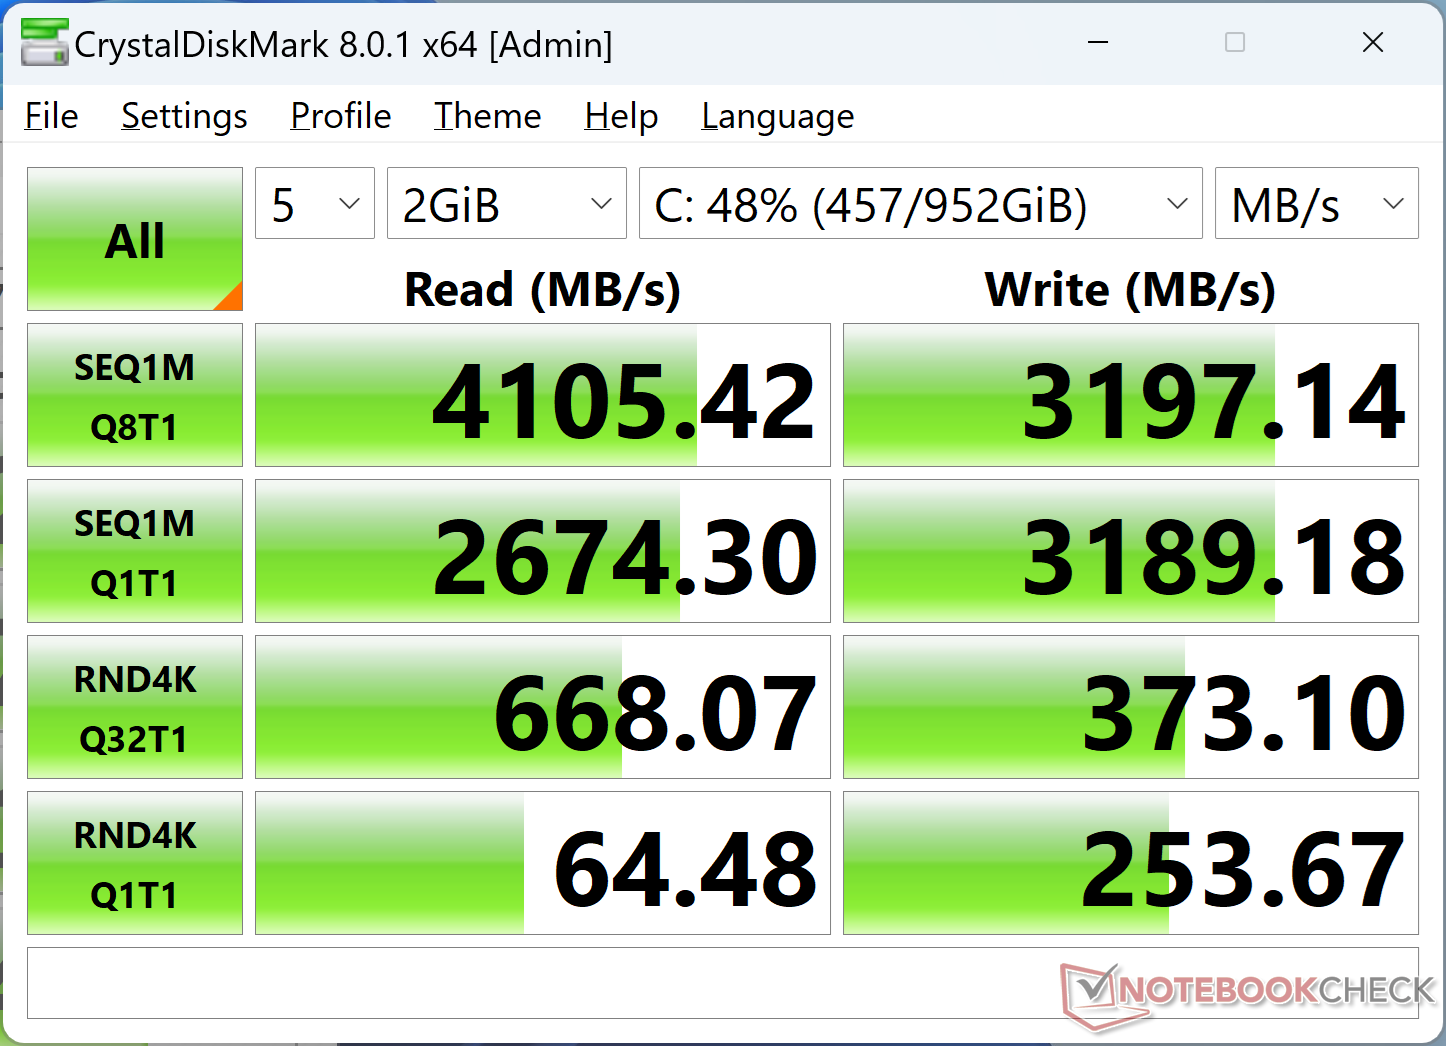
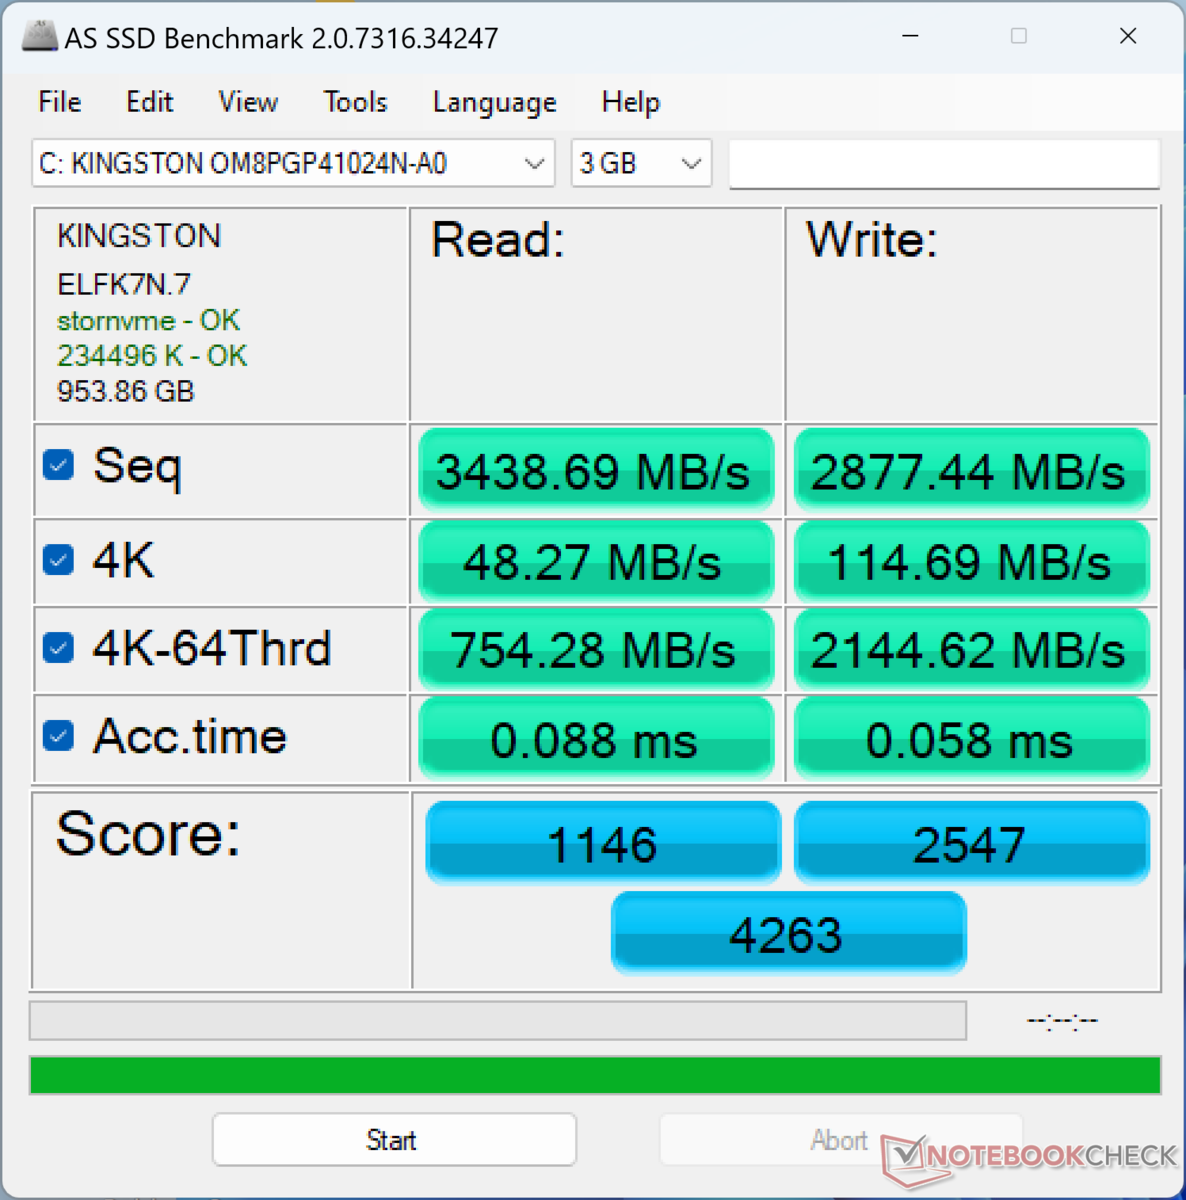
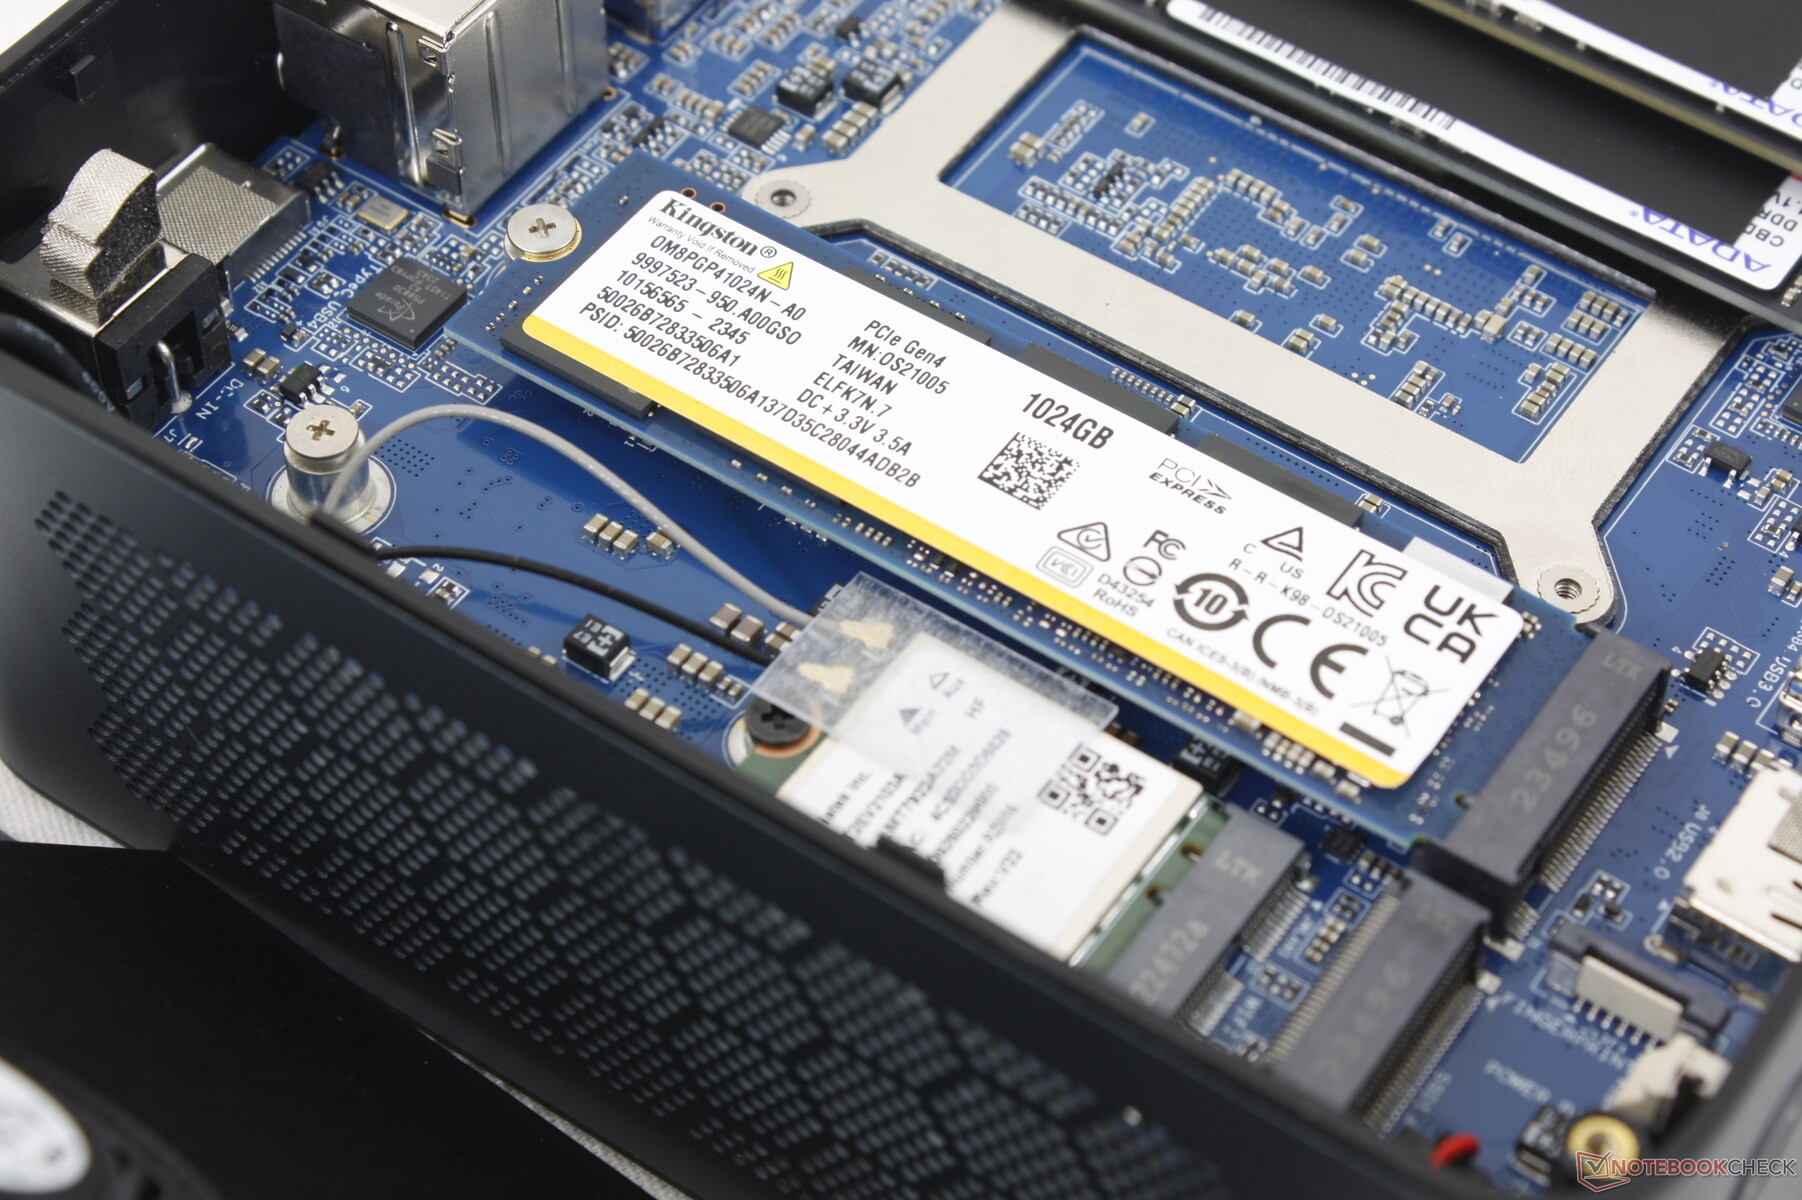
Lagringsenheter
Vår enhet levereras med mellanklassmodellen Kingston OM8SEP41024N-A0 PCIe4 x4 NVMe SSD som erbjuder överföringshastigheter på cirka 4000 MB/s jämfört med >6500 MB/s på avancerade PCIe4-enheter. Vi tackar aldrig nej till en snabbare enhet, men Kingston-enheten passar bra ihop med den här processorklassen och prisklassen.
En kylplatta medföljer för att avleda värme till metallfläkten under bottenkåpan. Du måste dock leverera din egen kylplatta om du installerar en andra SSD.

| Drive Performance rating - Percent | |
| GMK NucBox K6 | |
| Beelink GTR6 | |
| Intel NUC 13 Pro Kit NUC13ANK | |
| BOSGAME M1 | |
| GMK NucBox M5 | |
| Beelink SER7 | |
* ... mindre är bättre
Disk Throttling: DiskSpd Read Loop, Queue Depth 8
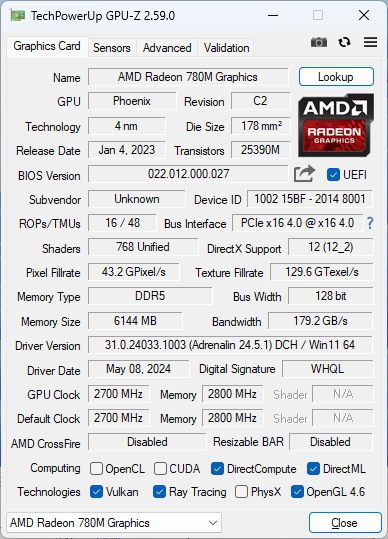
GPU-prestanda
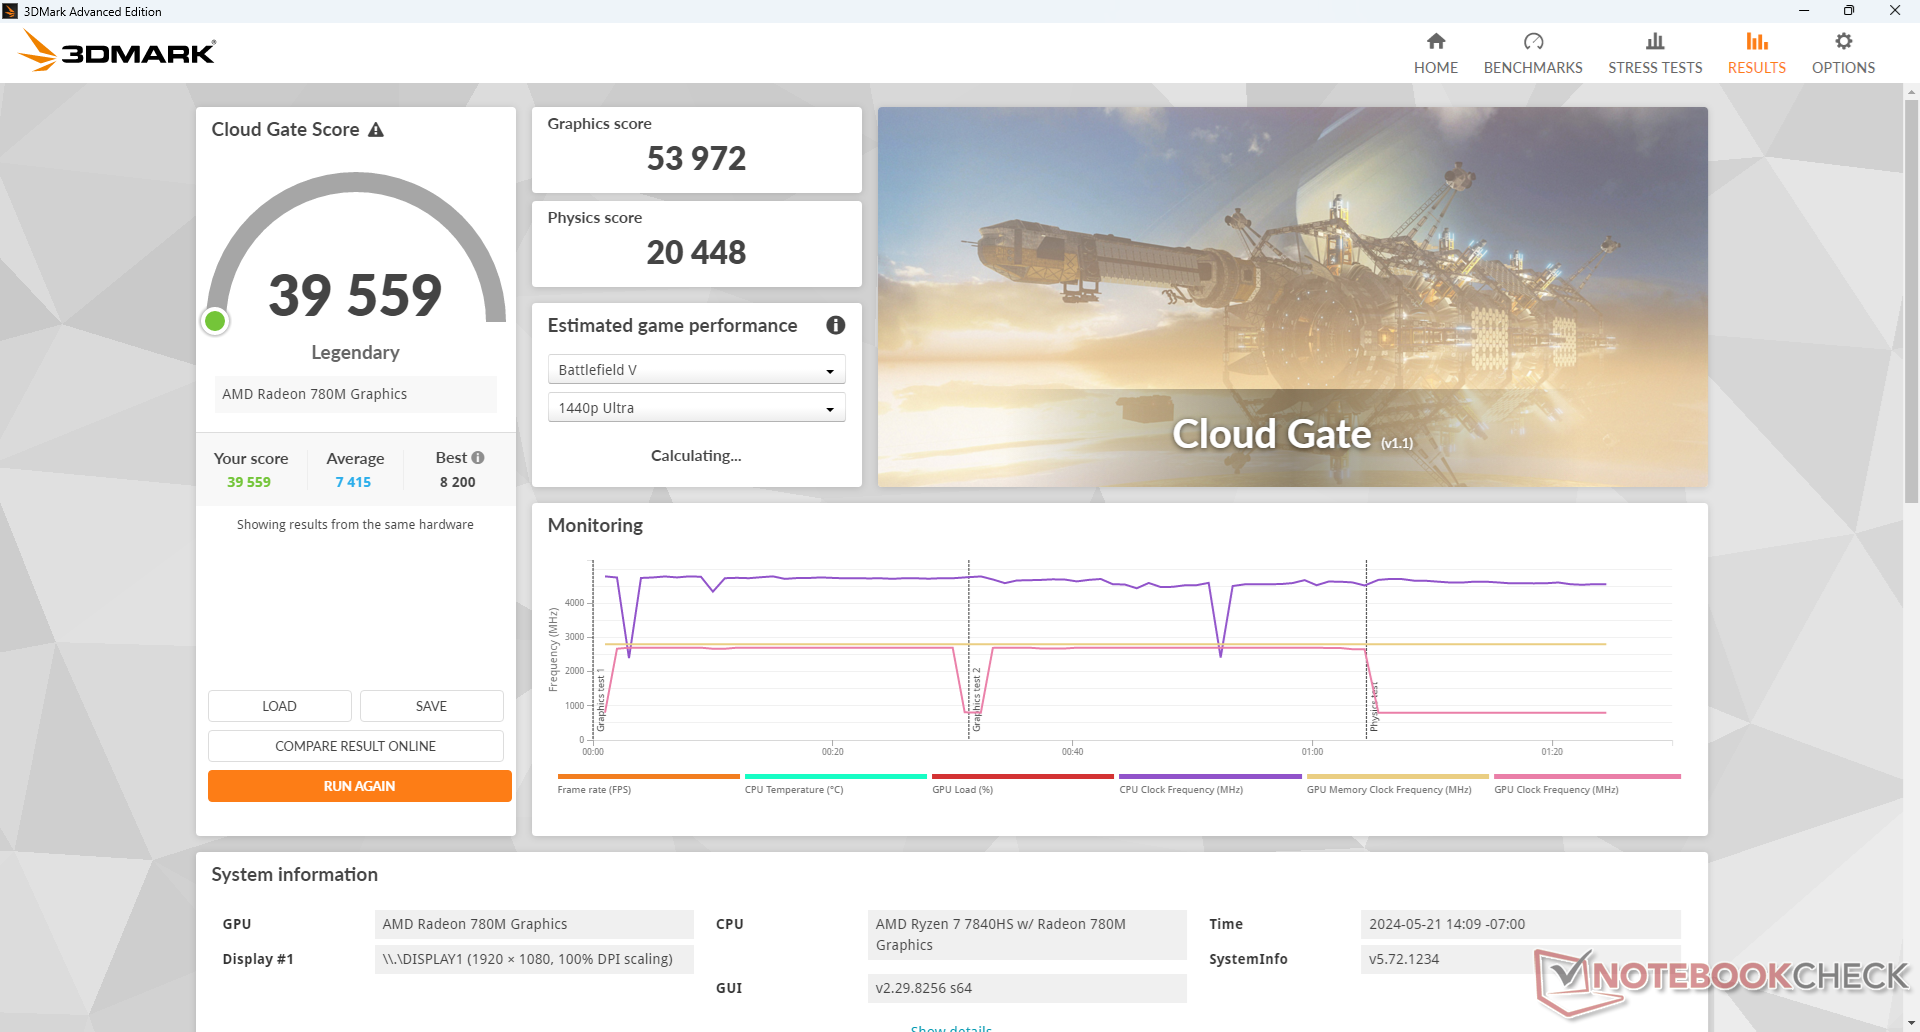
Radeon 780M Radeon 780M är en av de snabbaste integrerade GPU:erna som finns och den är ännu snabbare på en minidatorplattform jämfört med de flesta bärbara datorer. I det här fallet är iGPU:n i vår Bosgame 15 till 20 procent snabbare än den genomsnittliga bärbara datorn som körs med samma Radeon 780M. Detta delta är tillräckligt för att matcha eller till och med överträffa de senaste minidatorerna som körs på Intel Arc 8 som till exempel på de dyrare Acemagic F2A.
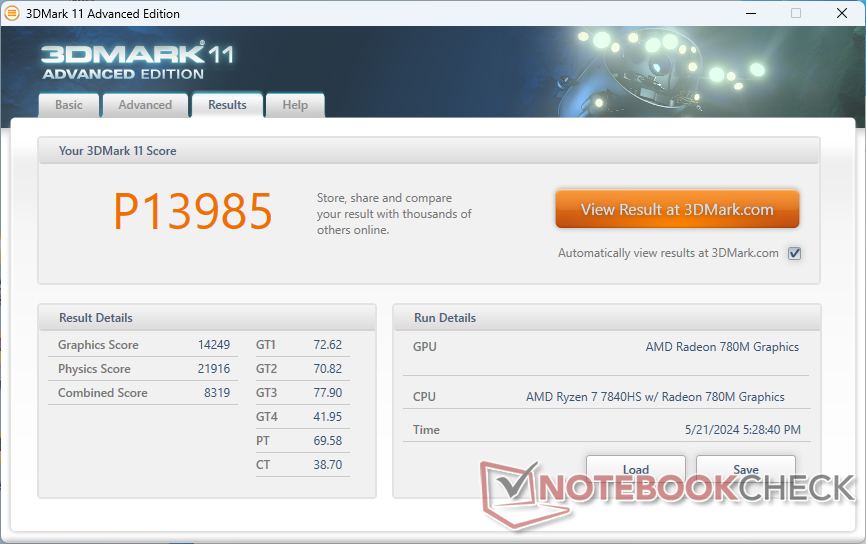
| 3DMark 11 Performance | 13985 poäng | |
| 3DMark Cloud Gate Standard Score | 39559 poäng | |
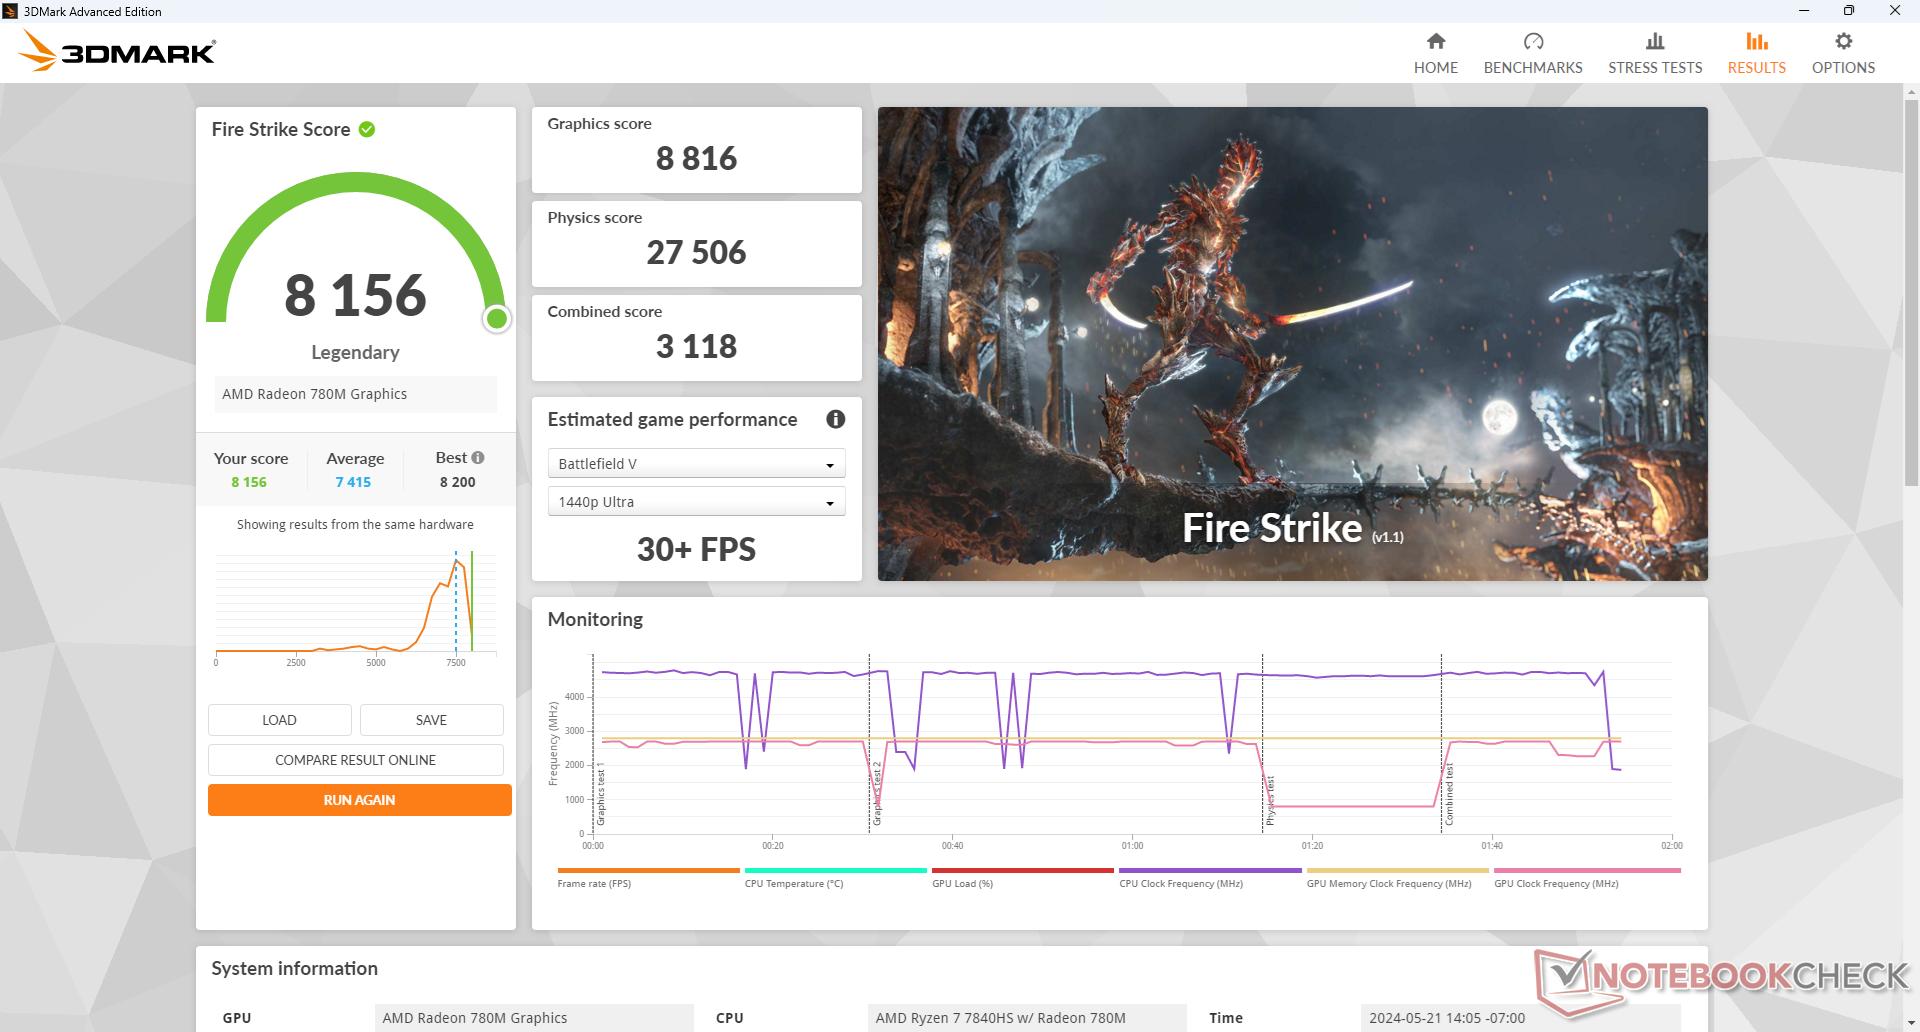
| 3DMark Fire Strike Score | 8156 poäng | |
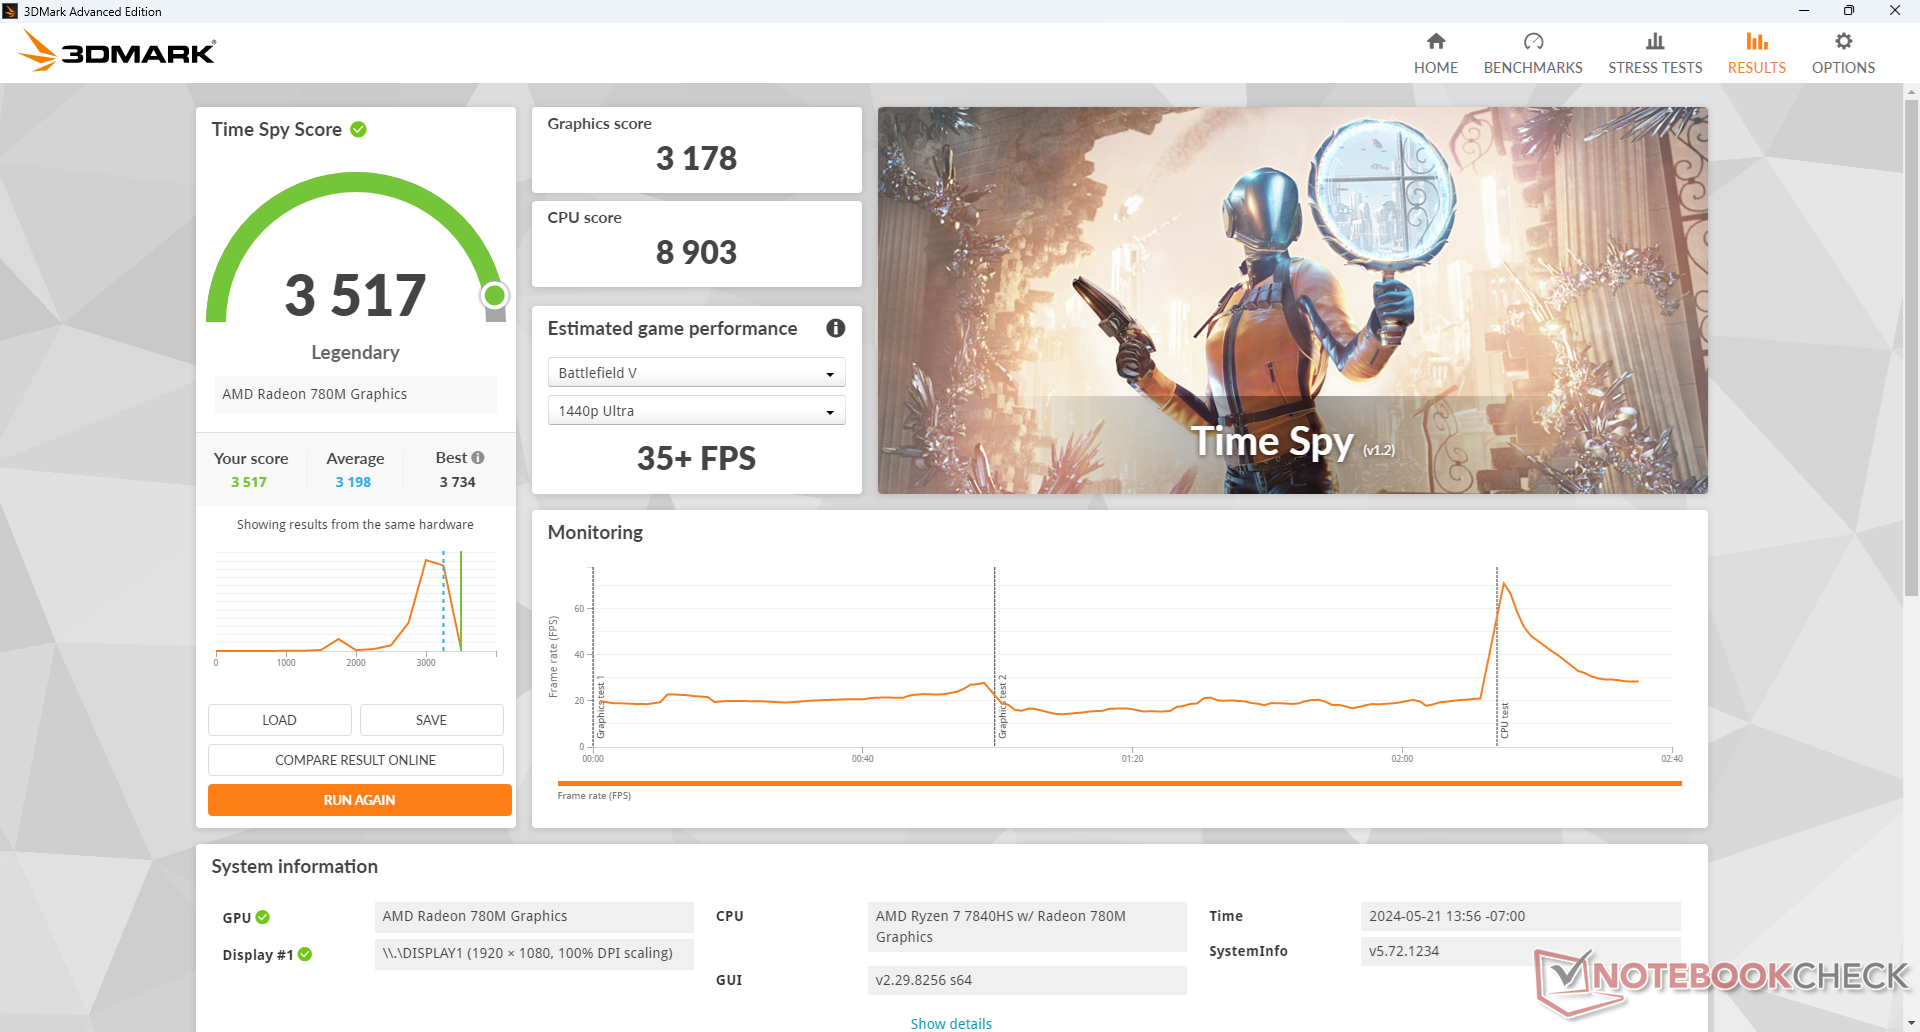
| 3DMark Time Spy Score | 3517 poäng | |
Hjälp | ||
* ... mindre är bättre
Spelprestanda - grafik på Playstation 4-nivå
De utmärkta 3DMark-poängen ovan översätts väl till faktiska spel eftersom Bosgame M1 gav högre bildfrekvenser än genomsnittet i alla testade spel. Minidatorn är tillräckligt kraftfull för att köra Cyberpunk 2077 Phantom Liberty på 1080p Medium-inställningar med en stabil 30 FPS eller F1 22 på 1080p High-inställningar med en stabil 60 FPS. En skärm med adaptiv synkronisering skulle följaktligen passa mycket bra ihop med Bosgame för speländamål.
Användare som uppgraderar från en äldre Iris Xe 96 EUs PC kan förvänta sig över 2x så hög spelprestanda.
| Performance rating - Percent | |
| BOSGAME M1 | |
| GMK NucBox K6 | |
| Beelink SER7 | |
| Beelink GTR6 -1! | |
| Intel NUC 13 Pro Kit NUC13ANK -2! | |
| GMK NucBox M5 | |
| The Witcher 3 - 1920x1080 Ultra Graphics & Postprocessing (HBAO+) | |
| BOSGAME M1 | |
| GMK NucBox K6 | |
| Beelink SER7 | |
| Beelink GTR6 | |
| Intel NUC 13 Pro Kit NUC13ANK | |
| GMK NucBox M5 | |
| Final Fantasy XV Benchmark - 1920x1080 High Quality | |
| BOSGAME M1 | |
| GMK NucBox K6 | |
| Beelink SER7 | |
| Beelink GTR6 | |
| GMK NucBox M5 | |
| Strange Brigade - 1920x1080 ultra AA:ultra AF:16 | |
| BOSGAME M1 | |
| GMK NucBox K6 | |
| Beelink SER7 | |
| Beelink GTR6 | |
| Intel NUC 13 Pro Kit NUC13ANK | |
| GMK NucBox M5 | |
| Dota 2 Reborn - 1920x1080 ultra (3/3) best looking | |
| BOSGAME M1 | |
| GMK NucBox K6 | |
| Beelink SER7 | |
| Beelink GTR6 | |
| Intel NUC 13 Pro Kit NUC13ANK | |
| GMK NucBox M5 | |
| X-Plane 11.11 - 1920x1080 high (fps_test=3) | |
| Beelink GTR6 | |
| GMK NucBox K6 | |
| BOSGAME M1 | |
| Beelink SER7 | |
| GMK NucBox M5 | |
| Far Cry 5 - 1920x1080 Ultra Preset AA:T | |
| BOSGAME M1 | |
| Beelink SER7 | |
| GMK NucBox K6 | |
| Intel NUC 13 Pro Kit NUC13ANK | |
| GMK NucBox M5 | |
| Baldur's Gate 3 | |
| 1280x720 Low Preset AA:SM | |
| Geekom A8, R9 8945HS | |
| BOSGAME M1 | |
| Genomsnitt AMD Radeon 780M (30.7 - 67.6, n=34) | |
| Minisforum AtomMan X7 Ti | |
| GMK NucBox M5 | |
| 1920x1080 Low Preset AA:SM | |
| BOSGAME M1 | |
| Geekom A8, R9 8945HS | |
| Genomsnitt AMD Radeon 780M (20.2 - 44.1, n=47) | |
| Minisforum AtomMan X7 Ti | |
| GMK NucBox M5 | |
| 1920x1080 Medium Preset AA:T | |
| BOSGAME M1 | |
| Genomsnitt AMD Radeon 780M (15.7 - 36.8, n=50) | |
| Geekom A8, R9 8945HS | |
| Minisforum AtomMan X7 Ti | |
| 1920x1080 High Preset AA:T | |
| BOSGAME M1 | |
| Genomsnitt AMD Radeon 780M (13.3 - 30.6, n=50) | |
| Minisforum AtomMan X7 Ti | |
| Geekom A8, R9 8945HS | |
| 1920x1080 Ultra Preset AA:T | |
| BOSGAME M1 | |
| Genomsnitt AMD Radeon 780M (12.8 - 29.6, n=49) | |
| Minisforum AtomMan X7 Ti | |
| Geekom A8, R9 8945HS | |
Witcher 3 FPS Chart
| låg | med. | hög | ultra | |
|---|---|---|---|---|
| The Witcher 3 (2015) | 160.7 | 103.8 | 52.2 | 33.3 |
| Dota 2 Reborn (2015) | 159.5 | 126.5 | 98.8 | 88.5 |
| Final Fantasy XV Benchmark (2018) | 84.5 | 40.9 | 30.8 | |
| X-Plane 11.11 (2018) | 64.2 | 46.3 | 38.7 | |
| Far Cry 5 (2018) | 88 | 54 | 49 | 47 |
| Strange Brigade (2018) | 175.9 | 70.9 | 60.6 | 52.1 |
| Tiny Tina's Wonderlands (2022) | 77.7 | 55.9 | 37.9 | 30.3 |
| F1 22 (2022) | 109.9 | 95 | 70.6 | 19.2 |
| Baldur's Gate 3 (2023) | 43.9 | 36.8 | 29.9 | 29.2 |
| Cyberpunk 2077 (2023) | 47.9 | 37.5 | 29.6 | 25.8 |
Utsläpp
Systemljud - hörbart, men inte alltför högt
Modellen har två integrerade fläktar, en på ovansidan av moderkortet och en på undersidan. Fläktarna är alltid aktiva oavsett belastningen på skärmen, vilket ger ett lågt surr på 32 dB(A) när man kör krävande belastningar som surfning eller videostreaming. Detta är typiskt för de flesta minidatorer och vi är glada att se att fläktarna i M1 generellt är slöa och inte har något irriterande pulserande beteende.
Fläktljudet vid högre belastning, som spel, ger ett stadigt fläktljud på 42 dB(A). Detta är tystare än på både GMK NucBox K6 och Beelink SER7, alla med samma Ryzen 7 7840HS CPU. Vi tycker inte att fläktljudet är tillräckligt högt för att vara störande, särskilt eftersom användare är mer benägna att sitta längre bort från sina minidatorer än sina bärbara datorer.
Ljudnivå
| Låg belastning |
| 32 / 32 / 32 dB(A) |
| Hög belastning |
| 38.7 / 42 dB(A) |
 | ||
30 dB tyst 40 dB(A) hörbar 50 dB(A) högt ljud |
||
min: | ||
| BOSGAME M1 Radeon 780M, R7 7840HS, Kingston OM8PGP41024N-A0 | GMK NucBox M5 Vega 8, R7 5700U, Lexar 1024GB LNM6A1X001T-HNNNG | GMK NucBox K6 Radeon 780M, R7 7840HS, MasonSemi 1TB MC7000 | Intel NUC 13 Pro Kit NUC13ANK Iris Xe G7 96EUs, i7-1360P, Samsung PM9A1 MZVL2512HCJQ | Beelink SER7 Radeon 780M, R7 7840HS, Crucial P3 Plus CT1000P3PSSD8 | Beelink GTR6 Radeon 680M, R9 6900HX, Kingston KC3000 512G SKC3000S512G | |
|---|---|---|---|---|---|---|
| Noise | 2% | -6% | -3% | 11% | 5% | |
| av / miljö * (dB) | 23.2 | 23.4 -1% | 23.2 -0% | 29.8 -28% | 24.5 -6% | 23.2 -0% |
| Idle Minimum * (dB) | 32 | 33.8 -6% | 31.3 2% | 30.2 6% | 25.1 22% | 23.6 26% |
| Idle Average * (dB) | 32 | 33.8 -6% | 31.3 2% | 31.1 3% | 25.1 22% | 23.8 26% |
| Idle Maximum * (dB) | 32 | 33.8 -6% | 33.4 -4% | 31.9 -0% | 25.1 22% | 36.2 -13% |
| Load Average * (dB) | 38.7 | 36.5 6% | 47.5 -23% | 40 -3% | 35.9 7% | 39.7 -3% |
| Witcher 3 ultra * (dB) | 41.7 | 36.8 12% | 43.6 -5% | 35.6 15% | 41 2% | |
| Load Maximum * (dB) | 42 | 36.9 12% | 47.7 -14% | 40.5 4% | 45.4 -8% | 43 -2% |
* ... mindre är bättre
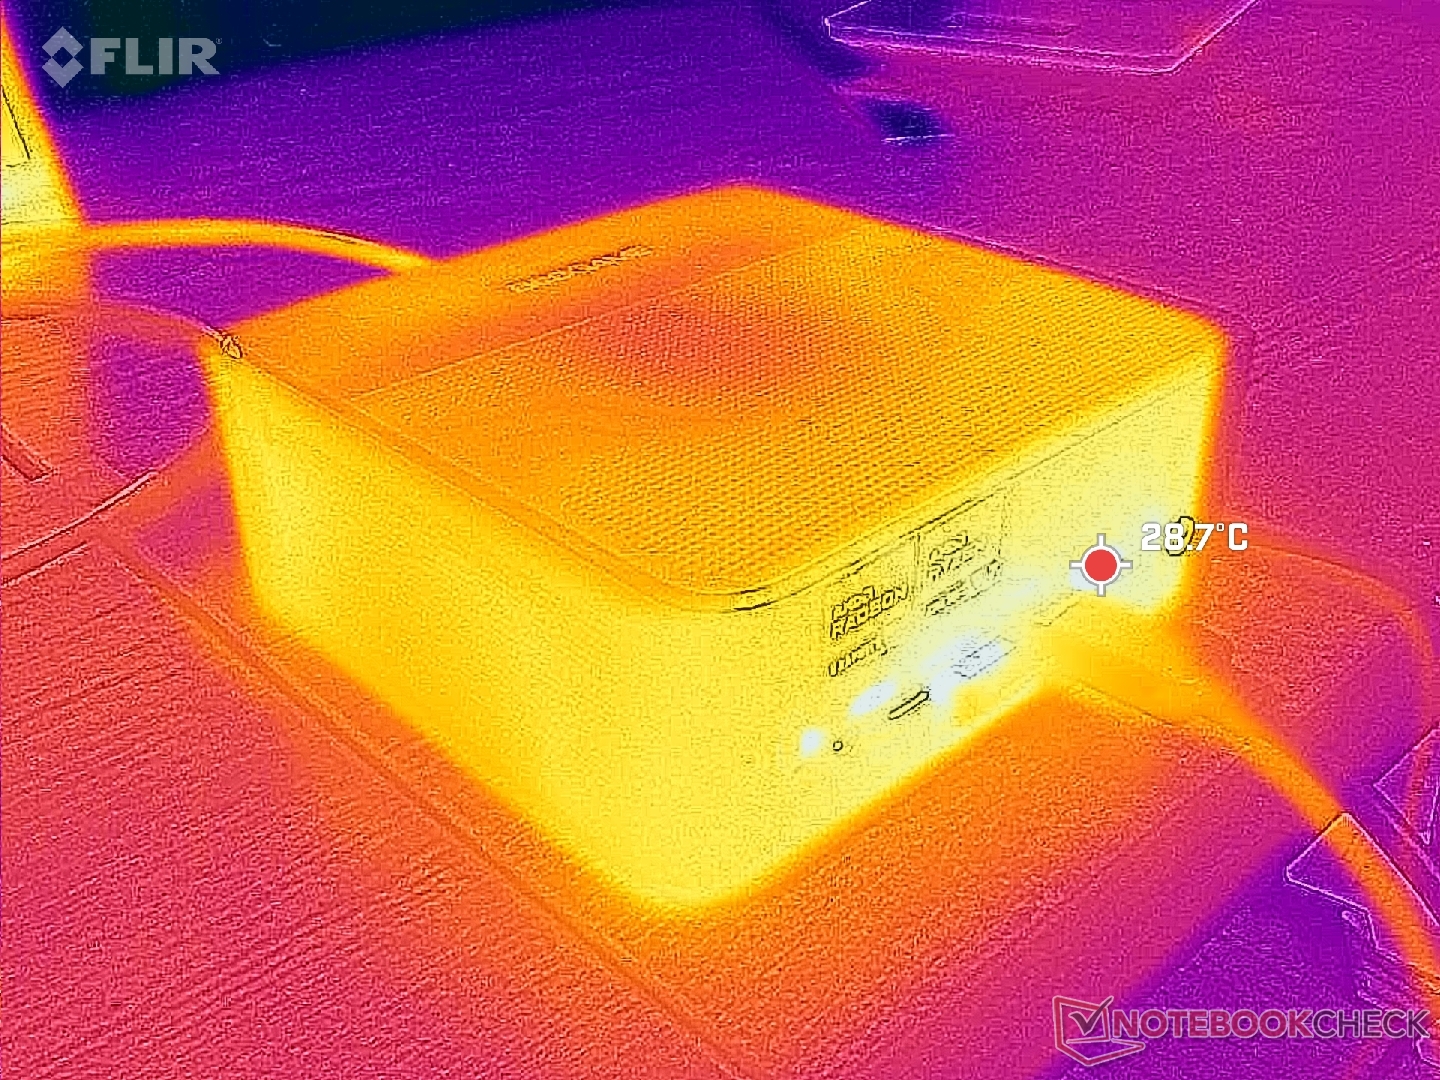
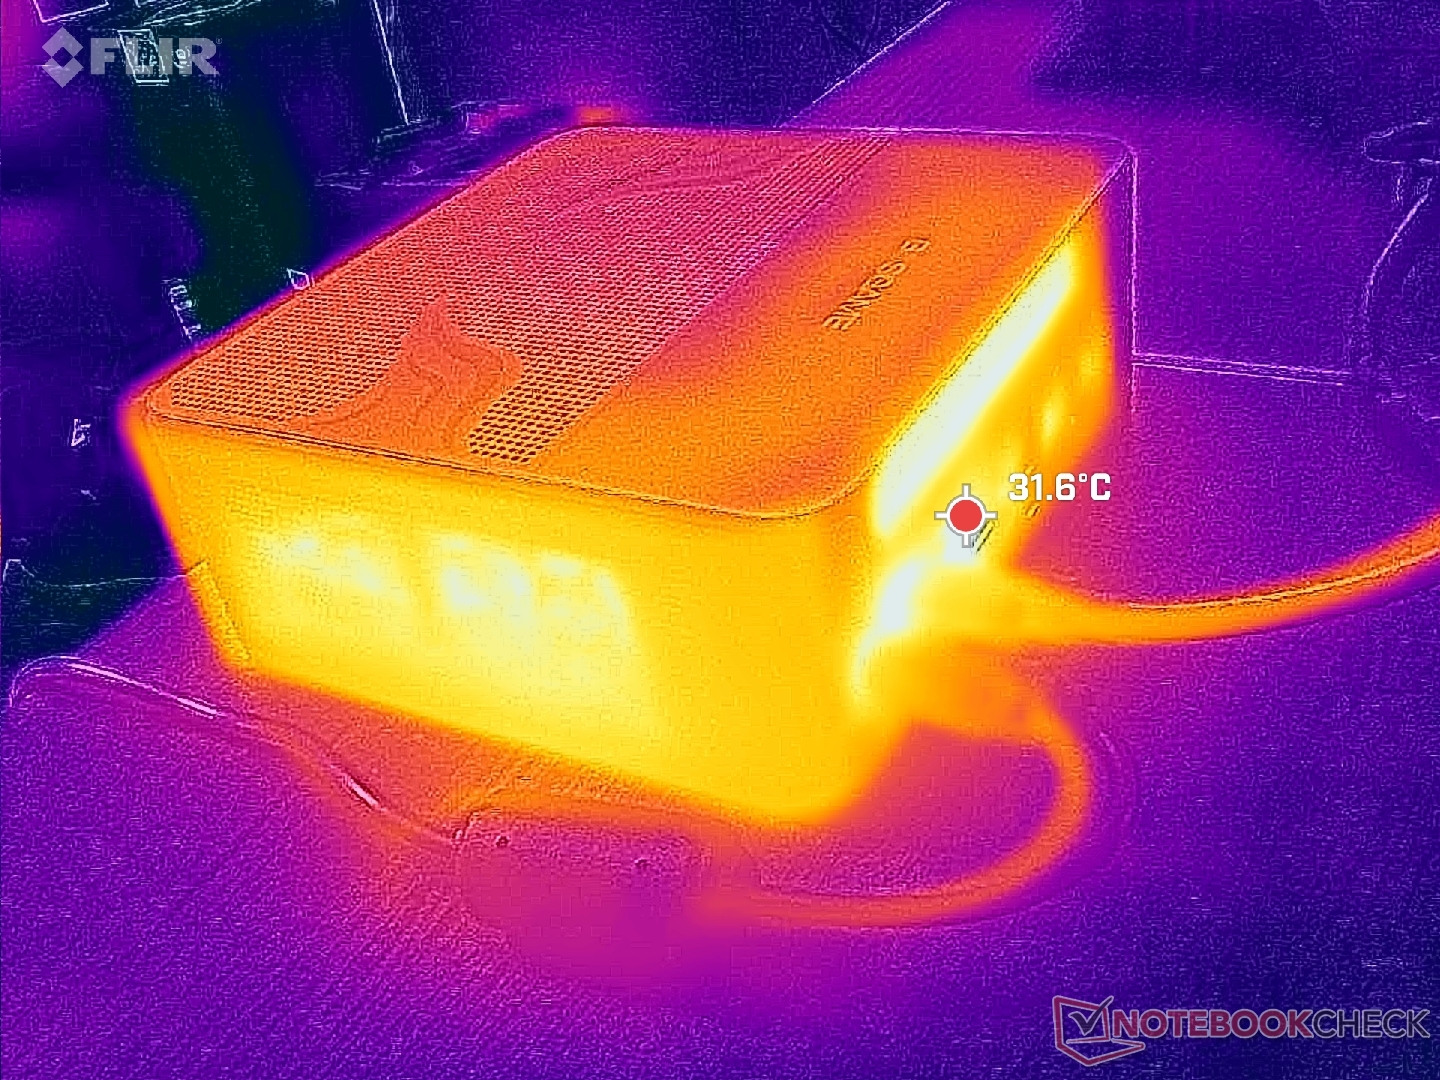
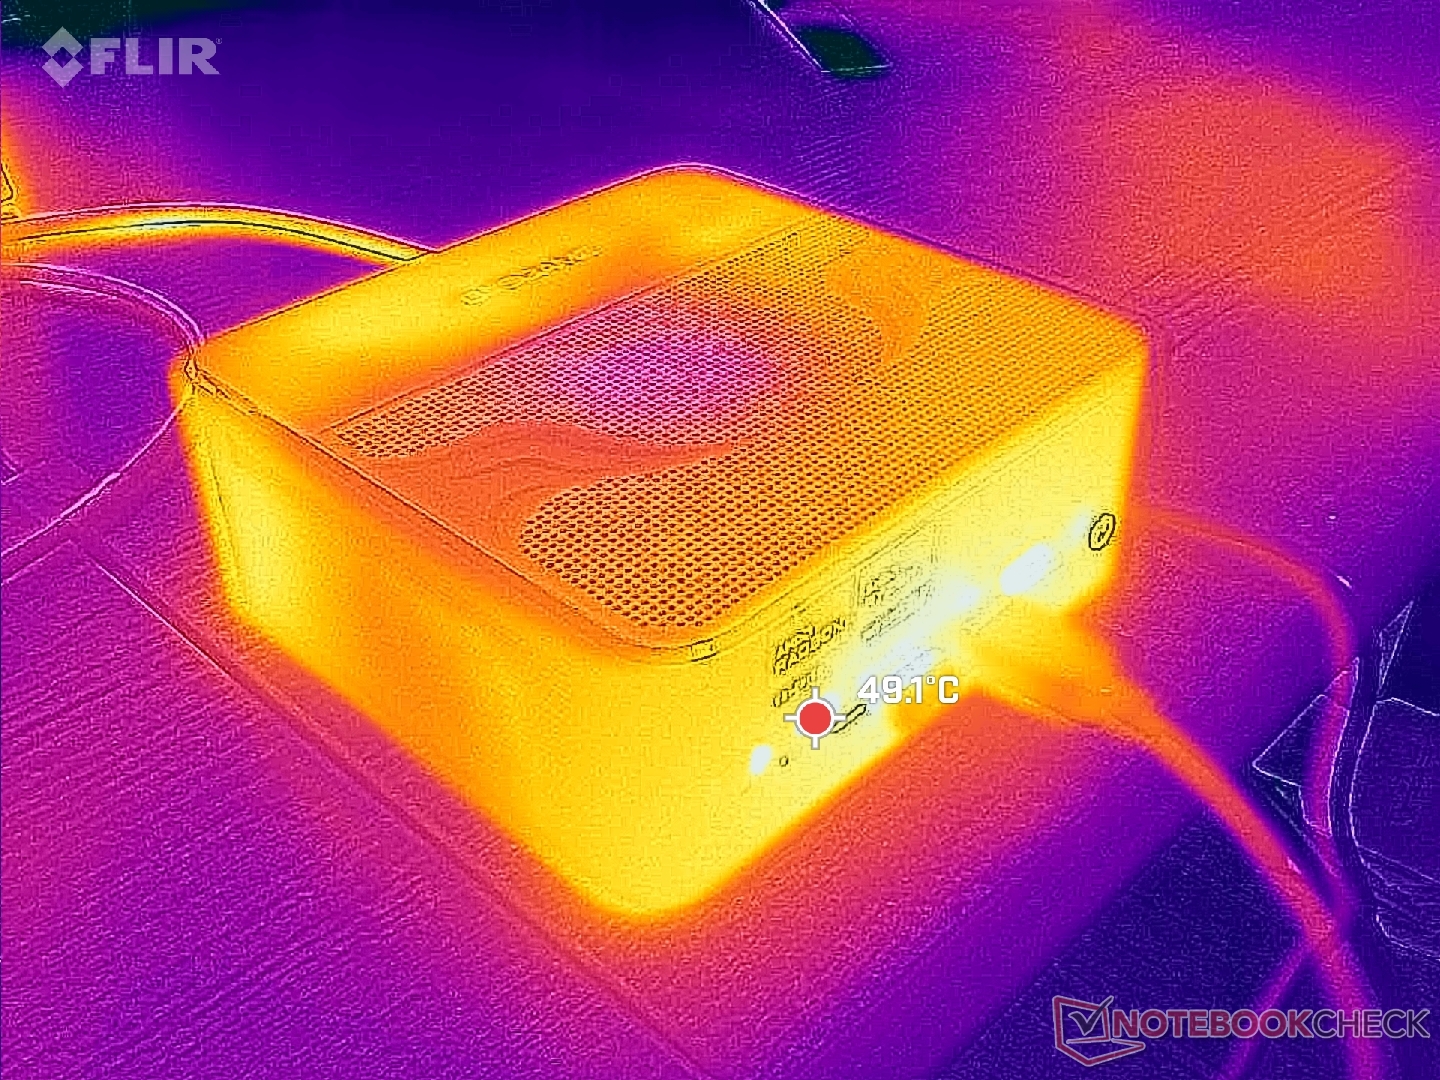
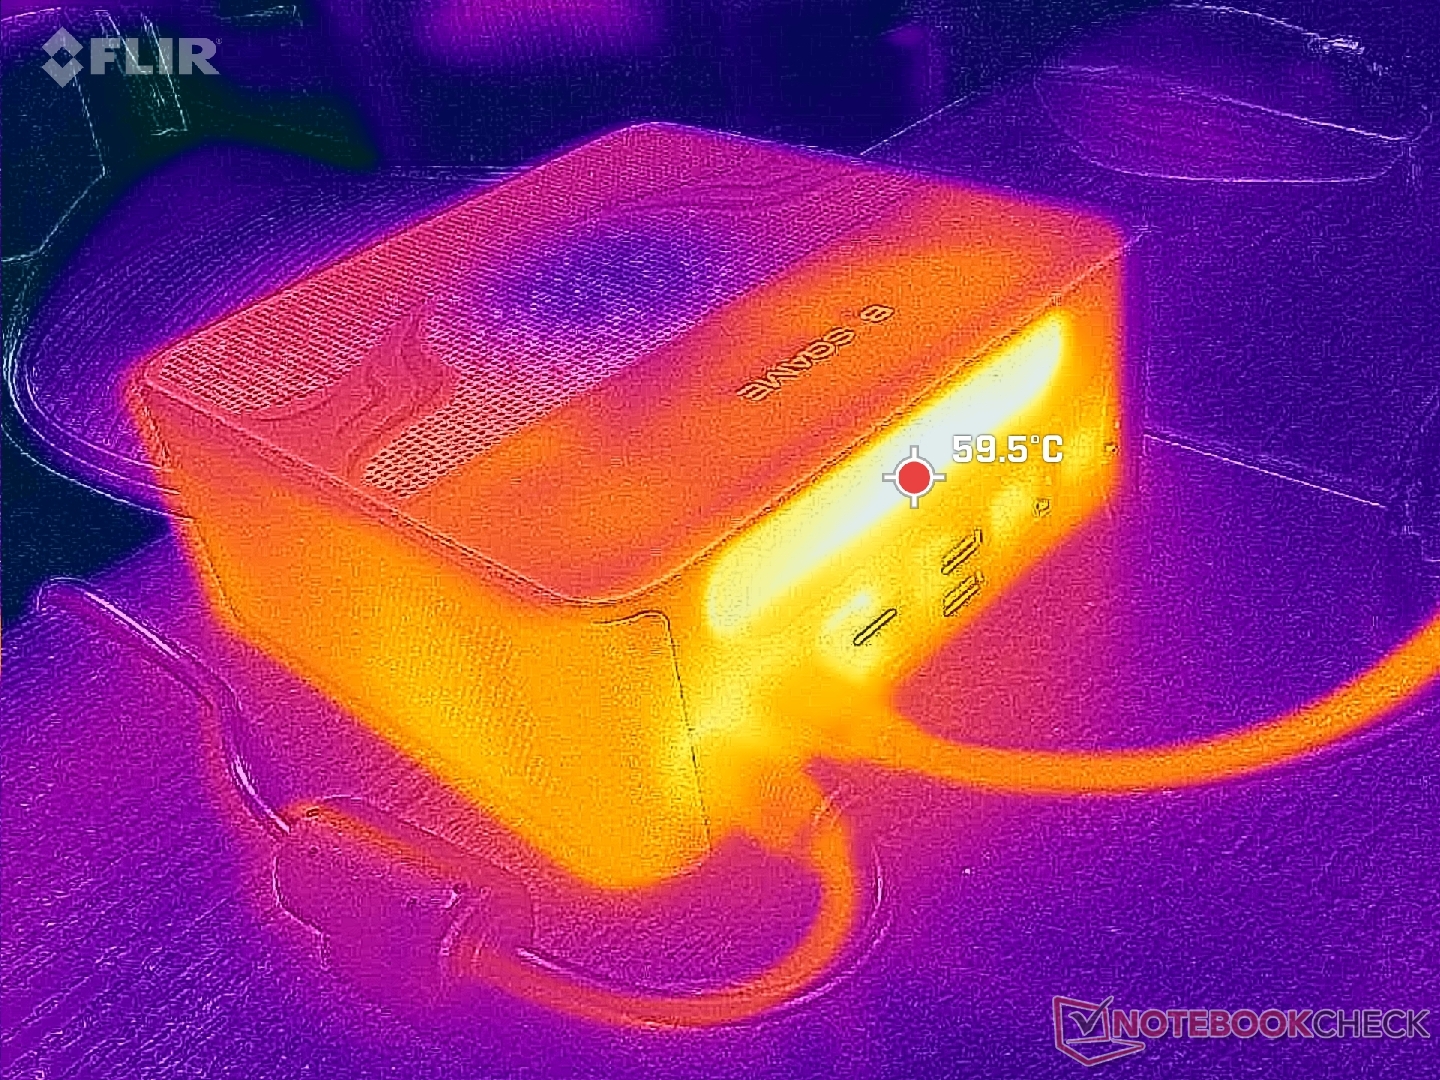
Temperatur
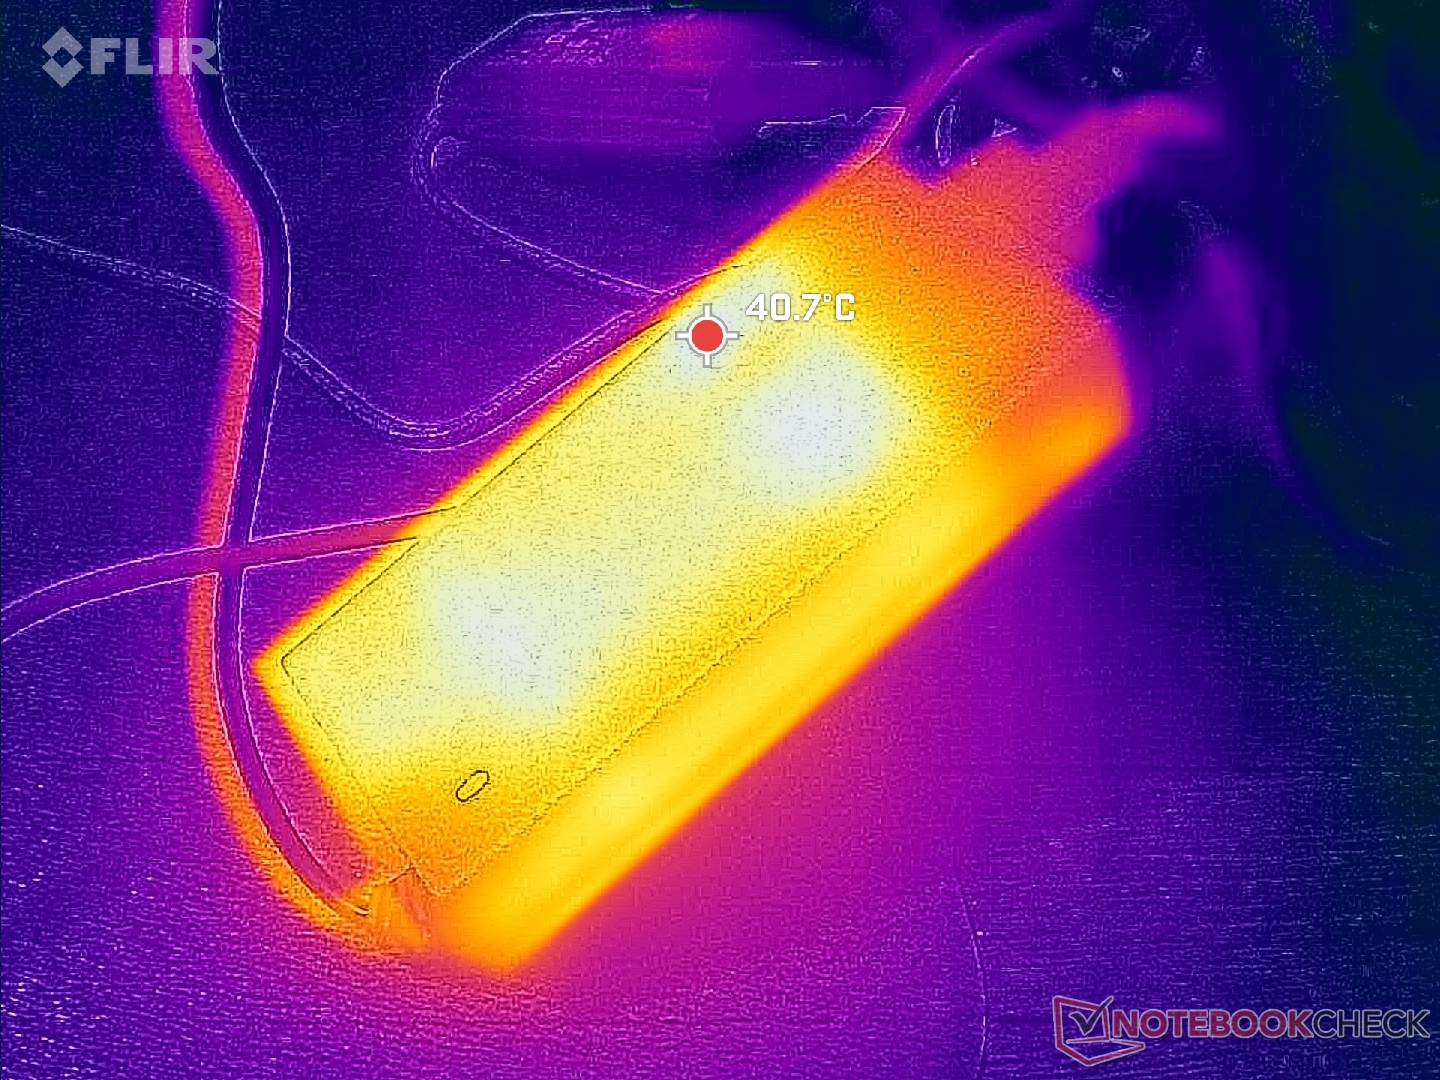
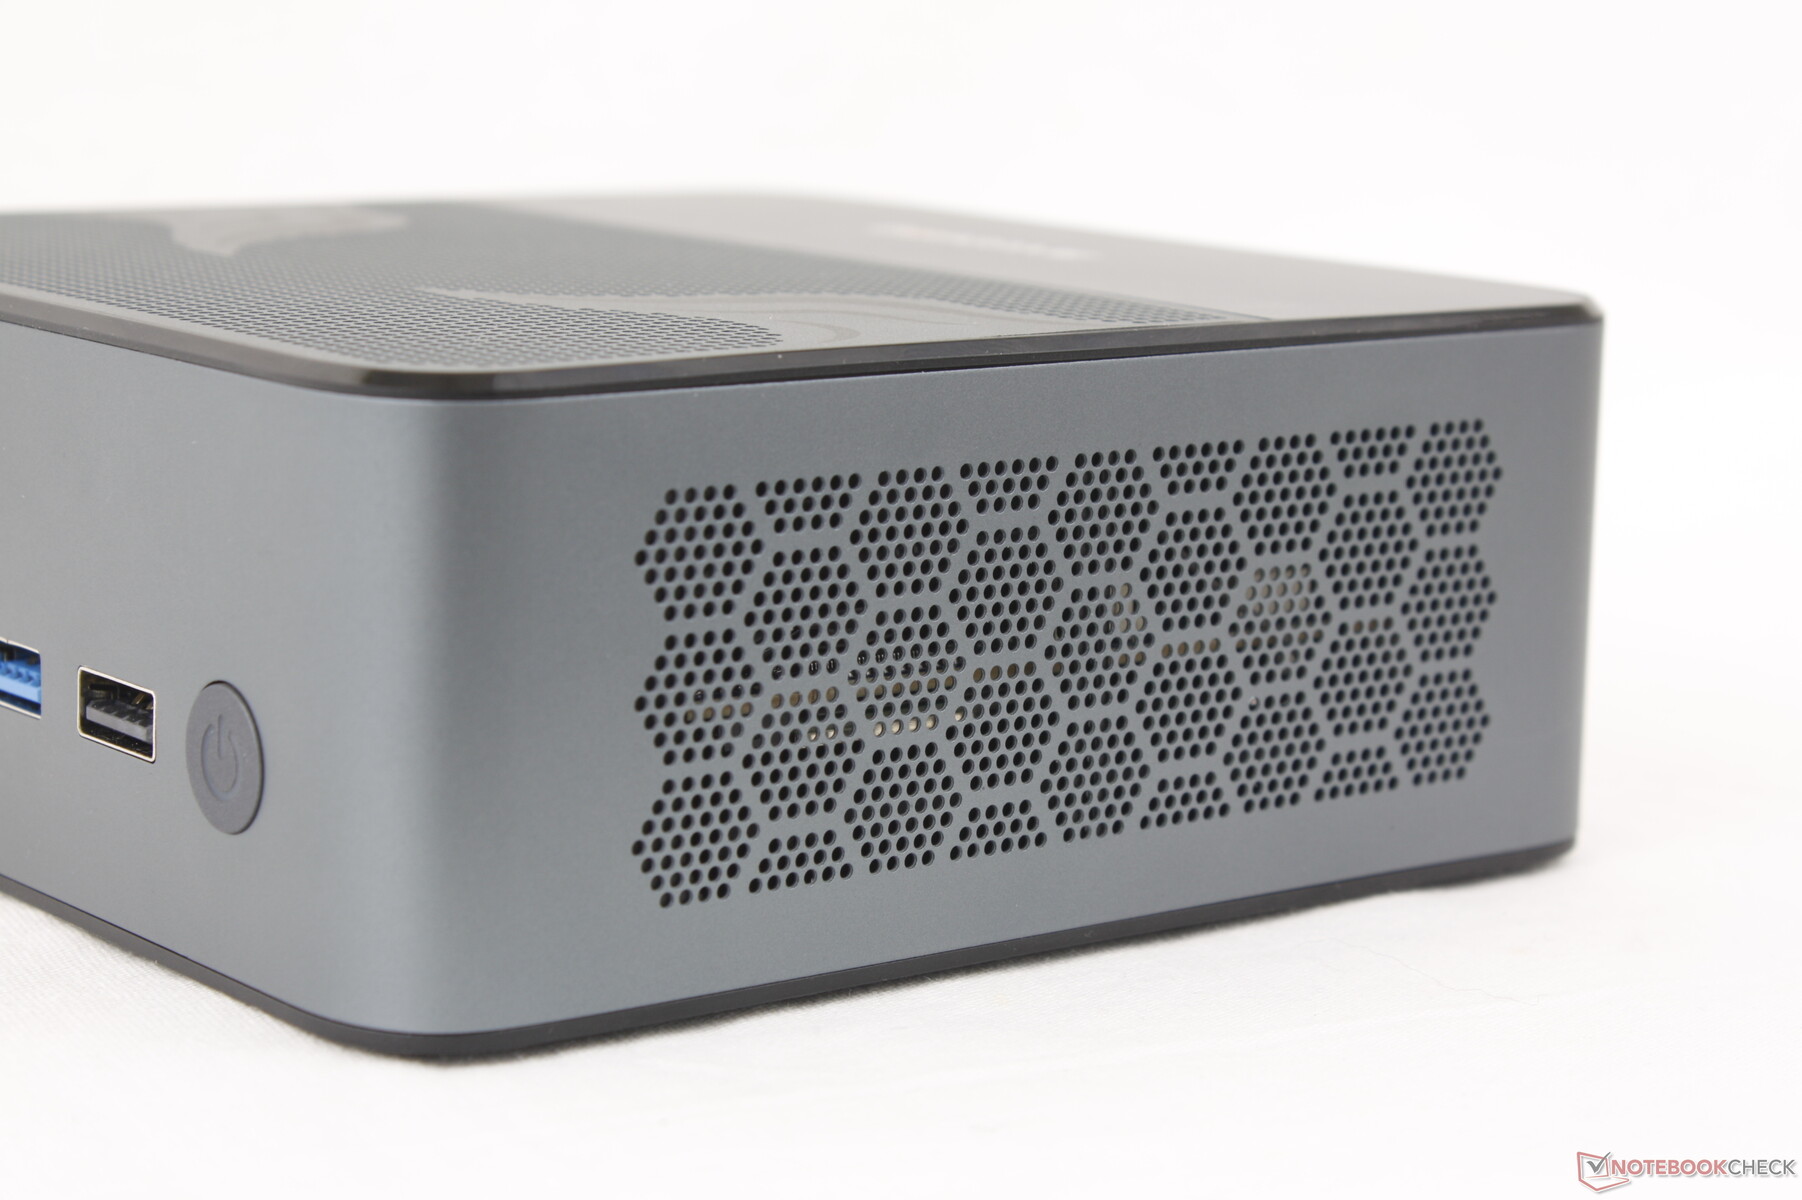
Yttemperaturerna är varmast längs enhetens framsida och baksida, vilket framgår av temperaturkartorna nedan. Frisk luft sugs in från ovansidan medan spillvärme finns på baksidan. Att placera föremål ovanpå enheten rekommenderas därför inte eftersom luftflödet kommer att hindras.
GMK NucBox K6-design är förmodligen mer användarvänlig när det gäller temperaturkontroll. Istället för att dra in luft från ovansidan drar GMK-systemet istället in luft genom slitsar längs sidorna. Denna metod möjliggör mer frihet för positionering jämfört med Bosgame M1-designen.
Högtalare
De integrerade 26 mm stereohögtalarna hjälper till att skilja M1 från de flesta andra mini-pc:er. Om ditt utrymme är begränsat eller minimalistiskt, till exempel, kan du helt enkelt använda de integrerade högtalarna istället för att förlita dig på externa lösningar.
Tyvärr är de integrerade högtalarna mer av en "plan B"-lösning på grund av deras genomsnittliga ljudkvalitet, genomsnittliga volym och lilla ljudfördröjning. De måste paras ihop med Windows via Bluetooth och vi kan märka en fördröjning på en halv sekund jämfört med externa 3,5 mm-högtalare. Denna fördröjning kan förbises för musik och de flesta vanliga videouppspelningar, men vi kan verkligen märka det när vi kör spel eller tittar på videor där rösterna inte synkroniseras perfekt.
Samtidigt är ljudkvalitet och volym inget speciellt. Vissa bärbara datorer, till exempel HP Spectre x360 16, har högre och skarpare integrerade högtalare än Bosgame M1. M1-högtalarna är tillräckligt anständiga för kontor eller konferensrum, men de saknar oomph för HTPC-miljöer i vardagsrummet.
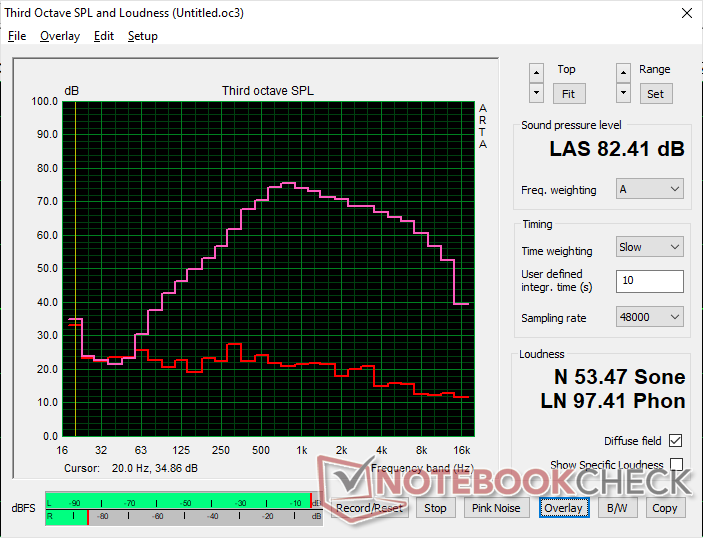
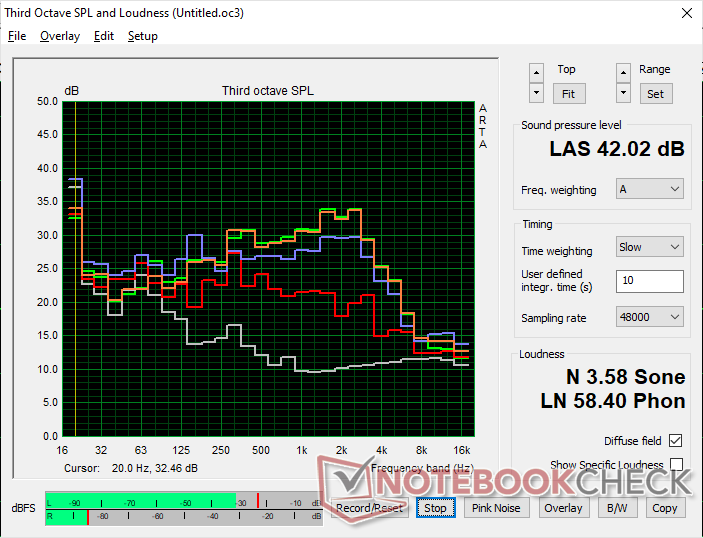
BOSGAME M1 ljudanalys
(+) | högtalare kan spela relativt högt (82.4 dB)
Bas 100 - 315 Hz
(±) | reducerad bas - i genomsnitt 13.6% lägre än medianen
(±) | linjäriteten för basen är genomsnittlig (9.2% delta till föregående frekvens)
Mellan 400 - 2000 Hz
(±) | högre mellan - i genomsnitt 6.8% högre än median
(+) | mids är linjära (5.2% delta till föregående frekvens)
Högsta 2 - 16 kHz
(+) | balanserade toppar - endast 3.2% från medianen
(+) | toppar är linjära (4.6% delta till föregående frekvens)
Totalt 100 - 16 000 Hz
(±) | linjäriteten för det totala ljudet är genomsnittlig (20.4% skillnad mot median)
Jämfört med samma klass
» 29% av alla testade enheter i den här klassen var bättre, 25% liknande, 46% sämre
» Den bästa hade ett delta på 13%, genomsnittet var 24%, sämst var 64%
Jämfört med alla testade enheter
» 53% av alla testade enheter var bättre, 8% liknande, 39% sämre
» Den bästa hade ett delta på 4%, genomsnittet var 24%, sämst var 134%
Apple MacBook Pro 16 2021 M1 Pro ljudanalys
(+) | högtalare kan spela relativt högt (84.7 dB)
Bas 100 - 315 Hz
(+) | bra bas - bara 3.8% från medianen
(+) | basen är linjär (5.2% delta till föregående frekvens)
Mellan 400 - 2000 Hz
(+) | balanserad mellan - endast 1.3% från medianen
(+) | mids är linjära (2.1% delta till föregående frekvens)
Högsta 2 - 16 kHz
(+) | balanserade toppar - endast 1.9% från medianen
(+) | toppar är linjära (2.7% delta till föregående frekvens)
Totalt 100 - 16 000 Hz
(+) | det totala ljudet är linjärt (4.6% skillnad mot median)
Jämfört med samma klass
» 0% av alla testade enheter i den här klassen var bättre, 0% liknande, 100% sämre
» Den bästa hade ett delta på 5%, genomsnittet var 17%, sämst var 45%
Jämfört med alla testade enheter
» 0% av alla testade enheter var bättre, 0% liknande, 100% sämre
» Den bästa hade ett delta på 4%, genomsnittet var 24%, sämst var 134%
Energiförvaltning
Strömförbrukning
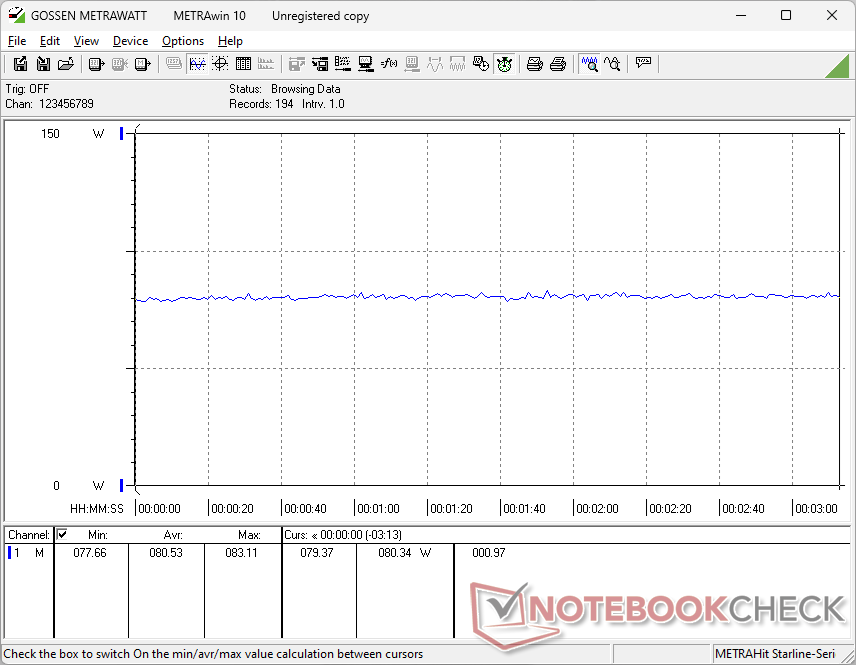
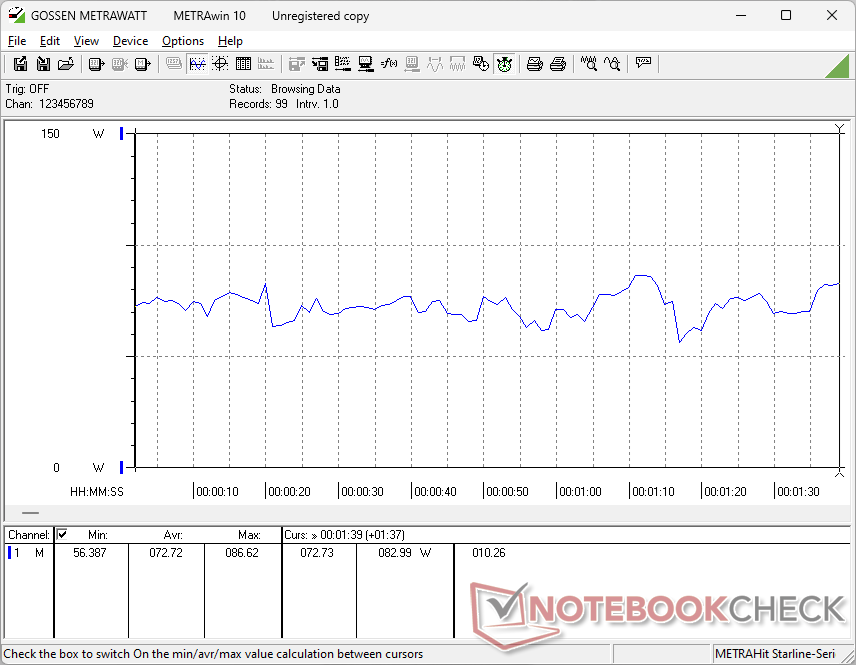
Tomgångskörning på skrivbordet förbrukar mindre än 9 W i genomsnitt och är något mer effektiv än Beelink SER7 och GMK NucBox K6 med bara ett par watt. När du kör spel kommer Bosgame dock att kräva några watt mer i genomsnitt, troligen på grund av dess tidigare nämnda högre klockade Radeon 780M.
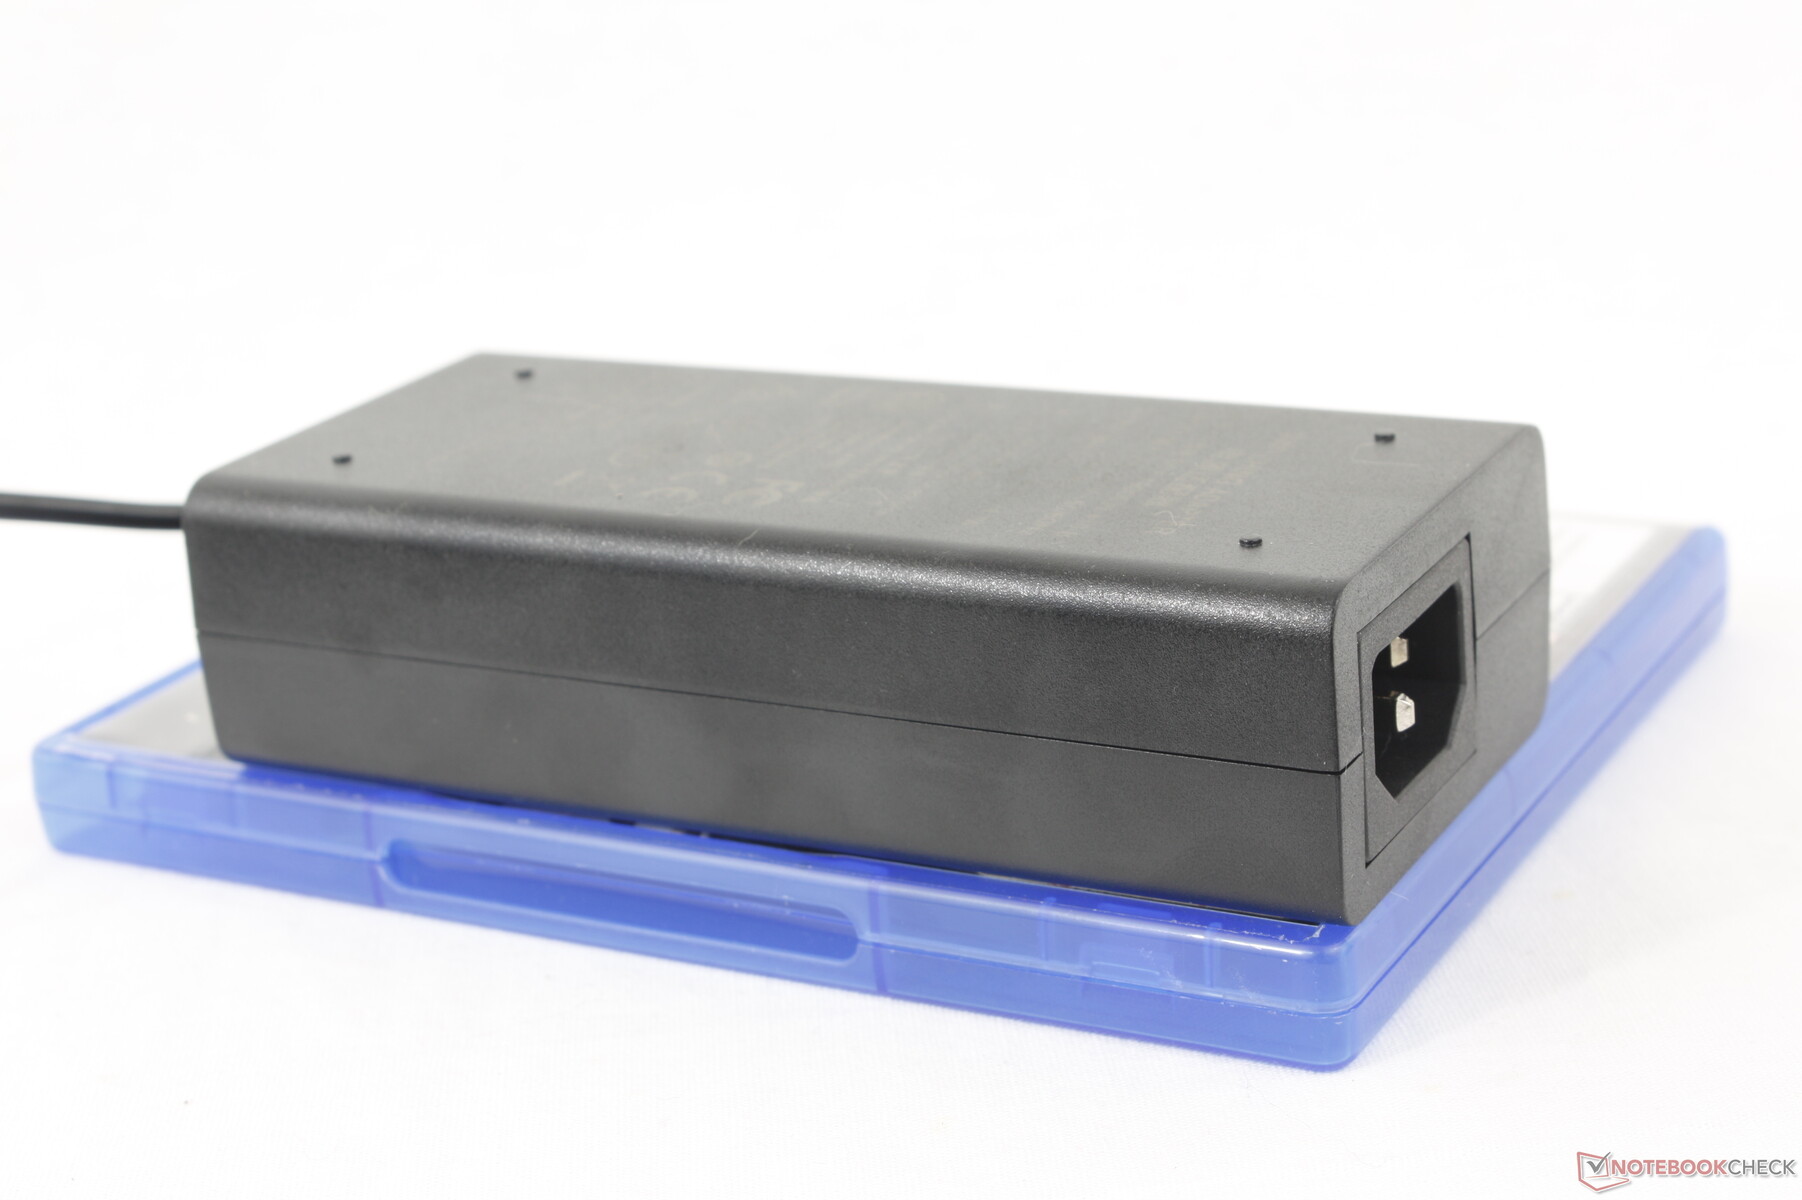
Vi kan registrera ett maximalt uttag på 99 W från den medelstora (~ 13,9 x 6,3 x 3,5 cm) 120 W AC-adaptern när CPU: n utnyttjas till 100 procent. Detta kan komma väl till pass när man ansluter externa USB-enheter eller hårddiskar.

| Av/Standby | |
| Låg belastning | |
| Hög belastning |
|
Förklaring:
min: | |
| BOSGAME M1 R7 7840HS, Radeon 780M, Kingston OM8PGP41024N-A0, , x, | GMK NucBox M5 R7 5700U, Vega 8, Lexar 1024GB LNM6A1X001T-HNNNG, , x, | GMK NucBox K6 R7 7840HS, Radeon 780M, MasonSemi 1TB MC7000, , x, | Intel NUC 13 Pro Kit NUC13ANK i7-1360P, Iris Xe G7 96EUs, Samsung PM9A1 MZVL2512HCJQ, , x, | Beelink SER7 R7 7840HS, Radeon 780M, Crucial P3 Plus CT1000P3PSSD8, , x, | Beelink GTR6 R9 6900HX, Radeon 680M, Kingston KC3000 512G SKC3000S512G, , x, | |
|---|---|---|---|---|---|---|
| Power Consumption | 43% | 7% | 5% | -1% | -4% | |
| Idle Minimum * (Watt) | 7.3 | 5.9 19% | 6.7 8% | 5.1 30% | 6.7 8% | 7.6 -4% |
| Idle Average * (Watt) | 7.3 | 6.2 15% | 7 4% | 5.8 21% | 7.3 -0% | 9.9 -36% |
| Idle Maximum * (Watt) | 8.4 | 6.4 24% | 7.6 10% | 10.2 -21% | 11.6 -38% | 10.6 -26% |
| Load Average * (Watt) | 72.7 | 28.2 61% | 74.3 -2% | 68.1 6% | 64.1 12% | 64 12% |
| Witcher 3 ultra * (Watt) | 80.5 | 27.5 66% | 75 7% | 75.8 6% | 69 14% | |
| Load Maximum * (Watt) | 99.1 | 29.5 70% | 85.7 14% | 108.3 -9% | 94.8 4% | 80.4 19% |
* ... mindre är bättre
Power Consumption Witcher 3 / Stresstest
Power Consumption external Monitor
För
Emot
Bedömning - Bra alternativ även utan de integrerade högtalarna
De integrerade stereohögtalarna är ett unikt försäljningsargument för Bosgame M1. Även om de verkligen kan vara praktiska när inga externa alternativ finns tillgängliga, lämnar deras ljudkvalitet mycket att önska för ändamål utanför kontoret eller konferensrummet. Det är fortfarande bättre att använda externa högtalare för multimediauppspelning eller om du befinner dig i ett större rum.
Lyckligtvis slår M1 ut det ur parken när det gäller allt annat. Metallchassit är av hög kvalitet, anslutningsmöjligheterna är utmärkta med flera USB-C 4.0-portar, servicen är relativt enkel och prestandan är snabbare än väntat. Casual-spelare kommer att älska att den kan köra de flesta spel i 1080p medan hardcore-spelare kan uppskatta dess eGPU-stöd. Prispunkten på <700 USD är också ganska rimlig med tanke på att den levereras fulladdad med 32 GB RAM, 1 TB lagringsutrymme och en Windows 11 Pro-licens. Ett barebones-alternativ skulle ha gjort M1 ännu billigare och konkurrenskraftigt mot många Beelink alternativ.
Bosgame M1 är ett starkt NUC-alternativ med prestandanivåer som konkurrerar med avancerade Intel-baserade alternativ. Den är en aning större och tyngre än de flesta, men prestandan och kvaliteten kompenserar mer än väl för den större storleken.
De största nackdelarna förutom de något underväldigande högtalarna är den något större chassistorleken, den skrymmande 120 W AC-adaptern och några tappade bildrutor under 4K60-videouppspelning. De är alla relativt små ändå och de försämrar inte det övergripande värdet eller byggkvaliteten hos modellen.
Pris och tillgänglighet
Bosgame M1 är nu tillgänglig på Amazon för $ 690 med 32 GB RAM, 1 TB SSD och Windows 11 Pro som granskats. Alternativt kan användare köpa direkt från tillverkaren för samma pris.
BOSGAME M1
- 05/25/2024 v7 (old)
Allen Ngo
Genomskinlighet
Valet av enheter som ska granskas görs av vår redaktion. Testprovet gavs till författaren som ett lån av tillverkaren eller återförsäljaren för denna recension. Långivaren hade inget inflytande på denna recension och inte heller fick tillverkaren en kopia av denna recension innan publiceringen. Det fanns ingen skyldighet att publicera denna recension. Som ett oberoende medieföretag är Notebookcheck inte föremål för auktoritet från tillverkare, återförsäljare eller förlag.
This is how Notebookcheck is testingEvery year, Notebookcheck independently reviews hundreds of laptops and smartphones using standardized procedures to ensure that all results are comparable. We have continuously developed our test methods for around 20 years and set industry standards in the process. In our test labs, high-quality measuring equipment is utilized by experienced technicians and editors. These tests involve a multi-stage validation process. Our complex rating system is based on hundreds of well-founded measurements and benchmarks, which maintains objectivity.
Price comparison

