Test: Samsung Galaxy S20+ - En mobil som kan spela in 8K-video (Sammanfattning)
Enhetsjämförelse
Gradering | Datum | Modell | Vikt | Enheten | Storlek | Upplösning | Pris |
|---|---|---|---|---|---|---|---|
| 87.7 % v7 (old) | 04/2020 | Samsung Galaxy S20+ Exynos 990, Mali-G77 MP11 | 188 g | 128 GB UFS 3.0 Flash | 6.70" | 3200x1440 | |
| 87.1 % v7 (old) | 10/2019 | Apple iPhone 11 Pro Max A13 Bionic, A13 Bionic GPU | 226 g | 64 GB SSD | 6.50" | 2688x1242 | |
| 89 % v7 (old) | 12/2019 | Huawei Mate 30 Pro Kirin 990, Mali-G76 MP16 | 198 g | 256 GB UFS 3.0 Flash | 6.53" | 2400x1176 | |
| 86.9 % v7 (old) | 11/2019 | OnePlus 7T Pro SD 855+, Adreno 640 | 206 g | 256 GB UFS 3.0 Flash | 6.67" | 3120x1440 | |
| 84.7 % v7 (old) | 02/2025 | Sony Xperia 1 SD 855, Adreno 640 | 178 g | 128 GB UFS 2.1 Flash | 6.50" | 3840x1644 |


| |||||||||||||||||||||||||
Distribution av ljusstyrkan: 94 %
Mitt på batteriet: 740 cd/m²
Kontrast: ∞:1 (Svärta: 0 cd/m²)
ΔE ColorChecker Calman: 2.6 | ∀{0.5-29.43 Ø4.73}
ΔE Greyscale Calman: 1.5 | ∀{0.09-98 Ø4.97}
99.7% sRGB (Calman 2D)
Gamma: 2.269
CCT: 6284 K
| Samsung Galaxy S20+ AMOLED, 3200x1440, 6.7" | Apple iPhone 11 Pro Max OLED, 2688x1242, 6.5" | Huawei Mate 30 Pro OLED, 2400x1176, 6.5" | OnePlus 7T Pro AMOLED, 3120x1440, 6.7" | Sony Xperia 1 OLED, 3840x1644, 6.5" | |
|---|---|---|---|---|---|
| Screen | 10% | -21% | -21% | 17% | |
| Brightness middle (cd/m²) | 740 | 790 7% | 592 -20% | 606 -18% | 541 -27% |
| Brightness (cd/m²) | 747 | 790 6% | 605 -19% | 611 -18% | 543 -27% |
| Brightness Distribution (%) | 94 | 97 3% | 96 2% | 95 1% | 99 5% |
| Black Level * (cd/m²) | |||||
| Colorchecker dE 2000 * | 2.6 | 1.4 46% | 2.5 4% | 3.46 -33% | 0.8 69% |
| Colorchecker dE 2000 max. * | 4.57 | 3.4 26% | 5.5 -20% | 5.64 -23% | 1.7 63% |
| Greyscale dE 2000 * | 1.5 | 1.9 -27% | 2.6 -73% | 2 -33% | 1.2 20% |
| Gamma | 2.269 97% | 2.23 99% | 2.16 102% | 2.258 97% | 2.2 100% |
| CCT | 6284 103% | 6466 101% | 6173 105% | 6779 96% | 6601 98% |
* ... mindre är bättre
Skärmflimmer / PWM (Puls-Width Modulation)
| Skärmflimmer / PWM upptäckt | 214 Hz | 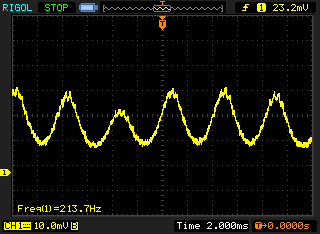 | |
Displayens bakgrundsbelysning flimrar vid 214 Hz (i värsta fall, t.ex. med PWM) . Frekvensen för 214 Hz är relativt låg, så känsliga användare kommer sannolikt att märka flimmer och uppleva ansträngda ögon vid den angivna ljusstyrkeinställningen och nedan. Som jämförelse: 52 % av alla testade enheter använder inte PWM för att dämpa skärmen. Om PWM upptäcktes mättes ett medelvärde av 7798 (minst: 5 - maximum: 343500) Hz. | |||
Visa svarstider
| ↔ Svarstid svart till vitt | ||
|---|---|---|
| 8 ms ... stiga ↗ och falla ↘ kombinerat | ↗ 5 ms stiga | 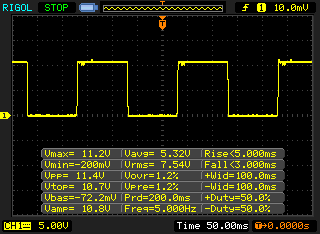 |
| ↘ 3 ms hösten | ||
| Skärmen visar snabba svarsfrekvenser i våra tester och bör passa för spel. I jämförelse sträcker sig alla testade enheter från 0.1 (minst) till 240 (maximalt) ms. » 22 % av alla enheter är bättre. Det betyder att den uppmätta svarstiden är bättre än genomsnittet av alla testade enheter (19.9 ms). | ||
| ↔ Svarstid 50 % grått till 80 % grått | ||
| 10 ms ... stiga ↗ och falla ↘ kombinerat | ↗ 5 ms stiga | 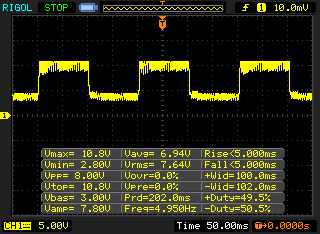 |
| ↘ 5 ms hösten | ||
| Skärmen visar bra svarsfrekvens i våra tester, men kan vara för långsam för konkurrenskraftiga spelare. I jämförelse sträcker sig alla testade enheter från 0.165 (minst) till 636 (maximalt) ms. » 23 % av alla enheter är bättre. Det betyder att den uppmätta svarstiden är bättre än genomsnittet av alla testade enheter (31.1 ms). | ||
| PCMark for Android | |
| Work performance score (sortera efter värde) | |
| Samsung Galaxy S20+ | |
| Huawei Mate 30 Pro | |
| OnePlus 7T Pro | |
| Sony Xperia 1 | |
| Genomsnitt Samsung Exynos 990 (13627 - 14760, n=5) | |
| Work 2.0 performance score (sortera efter värde) | |
| Samsung Galaxy S20+ | |
| Huawei Mate 30 Pro | |
| OnePlus 7T Pro | |
| Sony Xperia 1 | |
| Genomsnitt Samsung Exynos 990 (10008 - 11784, n=5) | |
| AnTuTu v8 - Total Score (sortera efter värde) | |
| Samsung Galaxy S20+ | |
| Apple iPhone 11 Pro Max | |
| Huawei Mate 30 Pro | |
| OnePlus 7T Pro | |
| Genomsnitt Samsung Exynos 990 (296746 - 527820, n=5) | |
| Basemark GPU 1.1 | |
| 1920x1080 Vulkan Medium Offscreen (sortera efter värde) | |
| Samsung Galaxy S20+ | |
| Huawei Mate 30 Pro | |
| OnePlus 7T Pro | |
| Genomsnitt Samsung Exynos 990 (71.4 - 71.6, n=2) | |
| Vulkan Medium Native (sortera efter värde) | |
| Samsung Galaxy S20+ | |
| Huawei Mate 30 Pro | |
| OnePlus 7T Pro | |
| Genomsnitt Samsung Exynos 990 (42.3 - 63, n=2) | |
| 1920x1080 OpenGL Medium Offscreen (sortera efter värde) | |
| Samsung Galaxy S20+ | |
| Huawei Mate 30 Pro | |
| OnePlus 7T Pro | |
| Genomsnitt Samsung Exynos 990 (84.1 - 85.6, n=2) | |
| VRMark - Amber Room (sortera efter värde) | |
| Samsung Galaxy S20+ | |
| Huawei Mate 30 Pro | |
| OnePlus 7T Pro | |
| Genomsnitt Samsung Exynos 990 (4607 - 4957, n=3) | |
| Jetstream 2 - 2.0 Total | |
| Genomsnitt av klass Smartphone (59.7 - 423, n=127, senaste 2 åren) | |
| Apple iPhone 11 Pro Max (Safari Mobile 13.1) | |
| Huawei Mate 30 Pro (Chrome 78) | |
| OnePlus 7T Pro (Chrome 78) | |
| Sony Xperia 1 (Chrome 75) | |
| Genomsnitt Samsung Exynos 990 (50.6 - 56.8, n=5) | |
| Samsung Galaxy S20+ (Chrome 80) | |
| JetStream 1.1 - 1.1 Total | |
| Apple iPhone 11 Pro Max (Safari Mobile 13.1) | |
| Huawei Mate 30 Pro (Chrome 78) | |
| OnePlus 7T Pro (Chrome 78) | |
| Sony Xperia 1 | |
| Genomsnitt Samsung Exynos 990 (89.3 - 96.2, n=5) | |
| Samsung Galaxy S20+ (Chrome 80) | |
| Speedometer 2.0 - Result 2.0 | |
| Genomsnitt av klass Smartphone (49.3 - 733, n=90, senaste 2 åren) | |
| Apple iPhone 11 Pro Max (Safari Mobile 13.1) | |
| Huawei Mate 30 Pro (Chrome 78) | |
| OnePlus 7T Pro (Chome 78) | |
| Sony Xperia 1 (Chrome 75) | |
| Samsung Galaxy S20+ (Chome 80) | |
| Genomsnitt Samsung Exynos 990 (50.8 - 64.4, n=4) | |
| WebXPRT 3 - Overall | |
| Apple iPhone 11 Pro Max (Safari Mobile 13.1) | |
| Genomsnitt av klass Smartphone (104 - 380, n=12, senaste 2 åren) | |
| Huawei Mate 30 Pro (Chrome 78) | |
| Sony Xperia 1 (Chrome 75) | |
| Genomsnitt Samsung Exynos 990 (86 - 102, n=5) | |
| OnePlus 7T Pro (Chrome 78) | |
| Samsung Galaxy S20+ (Chrome 80) | |
| Octane V2 - Total Score | |
| Genomsnitt av klass Smartphone (2800 - 126661, n=157, senaste 2 åren) | |
| Apple iPhone 11 Pro Max (Safari Mobile 13.1) | |
| OnePlus 7T Pro (Chrome 78) | |
| Huawei Mate 30 Pro (Chrome 78) | |
| Sony Xperia 1 (Chrome 75) | |
| Genomsnitt Samsung Exynos 990 (18094 - 20022, n=5) | |
| Samsung Galaxy S20+ (Chrome 80) | |
| Mozilla Kraken 1.1 - Total | |
| Samsung Galaxy S20+ (Chrome 80) | |
| Genomsnitt Samsung Exynos 990 (2294 - 2511, n=5) | |
| OnePlus 7T Pro (Chrome 78) | |
| Sony Xperia 1 (Chrome 75) | |
| Huawei Mate 30 Pro (Chrome 78) | |
| Genomsnitt av klass Smartphone (257 - 28190, n=135, senaste 2 åren) | |
| Apple iPhone 11 Pro Max (Safari Mobile 13.1) | |
* ... mindre är bättre
| Samsung Galaxy S20+ | Huawei Mate 30 Pro | OnePlus 7T Pro | Sony Xperia 1 | Genomsnitt 128 GB UFS 3.0 Flash | Genomsnitt av klass Smartphone | |
|---|---|---|---|---|---|---|
| AndroBench 3-5 | 7% | -38% | -57% | -7% | 83% | |
| Sequential Read 256KB (MB/s) | 1603 | 1781 11% | 1489 -7% | 750 -53% | 1520 ? -5% | 2251 ? 40% |
| Sequential Write 256KB (MB/s) | 694 | 401.8 -42% | 405 -42% | 206.9 -70% | 546 ? -21% | 1932 ? 178% |
| Random Read 4KB (MB/s) | 199.6 | 226.4 13% | 169 -15% | 147.3 -26% | 206 ? 3% | 310 ? 55% |
| Random Write 4KB (MB/s) | 229.8 | 259.2 13% | 26 -89% | 24.16 -89% | 193.9 ? -16% | 362 ? 58% |
| Sequential Read 256KB SDCard (MB/s) | 66.8 ? | 82.5 ? 24% | 31.34 ? -53% | 67.3 ? 1% | ||
| Sequential Write 256KB SDCard (MB/s) | 57.6 ? | 69.2 ? 20% | 27.84 ? -52% | 55.7 ? -3% |
(±) Den maximala temperaturen på ovansidan är 44.8 °C / 113 F, jämfört med genomsnittet av 35.3 °C / 96 F , allt från 21.9 till 247 °C för klassen Smartphone.
(±) Botten värms upp till maximalt 43.6 °C / 110 F, jämfört med genomsnittet av 34 °C / 93 F
(+) Vid tomgångsbruk är medeltemperaturen för ovansidan 31.2 °C / 88 F, jämfört med enhetsgenomsnittet på 32.9 °C / ### class_avg_f### F.
Samsung Galaxy S20+ ljudanalys
(+) | högtalare kan spela relativt högt (85.6 dB)
Bas 100 - 315 Hz
(-) | nästan ingen bas - i genomsnitt 73.2% lägre än medianen
(+) | basen är linjär (0% delta till föregående frekvens)
Mellan 400 - 2000 Hz
(-) | nästan inga mids - i genomsnitt 73.2% lägre än medianen
(+) | mids är linjära (0% delta till föregående frekvens)
Högsta 2 - 16 kHz
(-) | nästan inga toppar - i genomsnitt 73.2% lägre än medianen
(+) | toppar är linjära (0% delta till föregående frekvens)
Totalt 100 - 16 000 Hz
(-) | det totala ljudet är inte linjärt (115.8% skillnad mot median)
Jämfört med samma klass
» 88% av alla testade enheter i den här klassen var bättre, 4% liknande, 8% sämre
» Den bästa hade ett delta på 11%, genomsnittet var 34%, sämst var 134%
Jämfört med alla testade enheter
» 96% av alla testade enheter var bättre, 1% liknande, 3% sämre
» Den bästa hade ett delta på 4%, genomsnittet var 24%, sämst var 134%
Apple iPhone 11 Pro Max ljudanalys
(+) | högtalare kan spela relativt högt (85.8 dB)
Bas 100 - 315 Hz
(-) | nästan ingen bas - i genomsnitt 15.4% lägre än medianen
(±) | linjäriteten för basen är genomsnittlig (10.3% delta till föregående frekvens)
Mellan 400 - 2000 Hz
(±) | högre mellan - i genomsnitt 5.7% högre än median
(+) | mids är linjära (5.9% delta till föregående frekvens)
Högsta 2 - 16 kHz
(±) | högre toppar - i genomsnitt 8.8% högre än medianen
(+) | toppar är linjära (3.5% delta till föregående frekvens)
Totalt 100 - 16 000 Hz
(±) | linjäriteten för det totala ljudet är genomsnittlig (19.4% skillnad mot median)
Jämfört med samma klass
» 28% av alla testade enheter i den här klassen var bättre, 8% liknande, 64% sämre
» Den bästa hade ett delta på 11%, genomsnittet var 34%, sämst var 134%
Jämfört med alla testade enheter
» 48% av alla testade enheter var bättre, 7% liknande, 45% sämre
» Den bästa hade ett delta på 4%, genomsnittet var 24%, sämst var 134%
| Av/Standby | |
| Låg belastning | |
| Hög belastning |
|
Förklaring:
min: | |
| Samsung Galaxy S20+ 4500 mAh | Apple iPhone 11 Pro Max 3969 mAh | Huawei Mate 30 Pro 4500 mAh | OnePlus 7T Pro 4085 mAh | Sony Xperia 1 3330 mAh | Genomsnitt Samsung Exynos 990 | Genomsnitt av klass Smartphone | |
|---|---|---|---|---|---|---|---|
| Power Consumption | -1% | 22% | -40% | 22% | 13% | 8% | |
| Idle Minimum * (Watt) | 1 | 0.92 8% | 0.87 13% | 2.1 -110% | 1 -0% | 0.846 ? 15% | 0.875 ? 12% |
| Idle Average * (Watt) | 1.7 | 2.9 -71% | 1.75 -3% | 3 -76% | 1.48 13% | 1.534 ? 10% | 1.47 ? 14% |
| Idle Maximum * (Watt) | 2.3 | 2.94 -28% | 1.83 20% | 3.5 -52% | 1.56 32% | 1.858 ? 19% | 1.659 ? 28% |
| Load Average * (Watt) | 5.8 | 3.65 37% | 3.85 34% | 5.3 9% | 3.76 35% | 5.14 ? 11% | 6.8 ? -17% |
| Load Maximum * (Watt) | 11.8 | 6.18 48% | 6.64 44% | 8.3 30% | 8.48 28% | 10.7 ? 9% | 11.3 ? 4% |
* ... mindre är bättre
| Samsung Galaxy S20+ 4500 mAh | Apple iPhone 11 Pro Max 3969 mAh | Huawei Mate 30 Pro 4500 mAh | OnePlus 7T Pro 4085 mAh | Sony Xperia 1 3330 mAh | |
|---|---|---|---|---|---|
| Batteridrifttid | 42% | 6% | 11% | -26% | |
| Reader / Idle (h) | 34 | 43.6 28% | 36.2 6% | 33.6 -1% | 17.8 -48% |
| H.264 (h) | 16.3 | 22.4 37% | 18.3 12% | 16 -2% | 11.9 -27% |
| WiFi v1.3 (h) | 13.2 | 15.2 15% | 13.7 4% | 15.2 15% | 7.4 -44% |
| Load (h) | 3.6 | 6.8 89% | 3.7 3% | 4.7 31% | 4.1 14% |
För
Emot
Omdöme - Kamerabrister

Läs den fullständiga versionen av den här recensionen på engelska här.
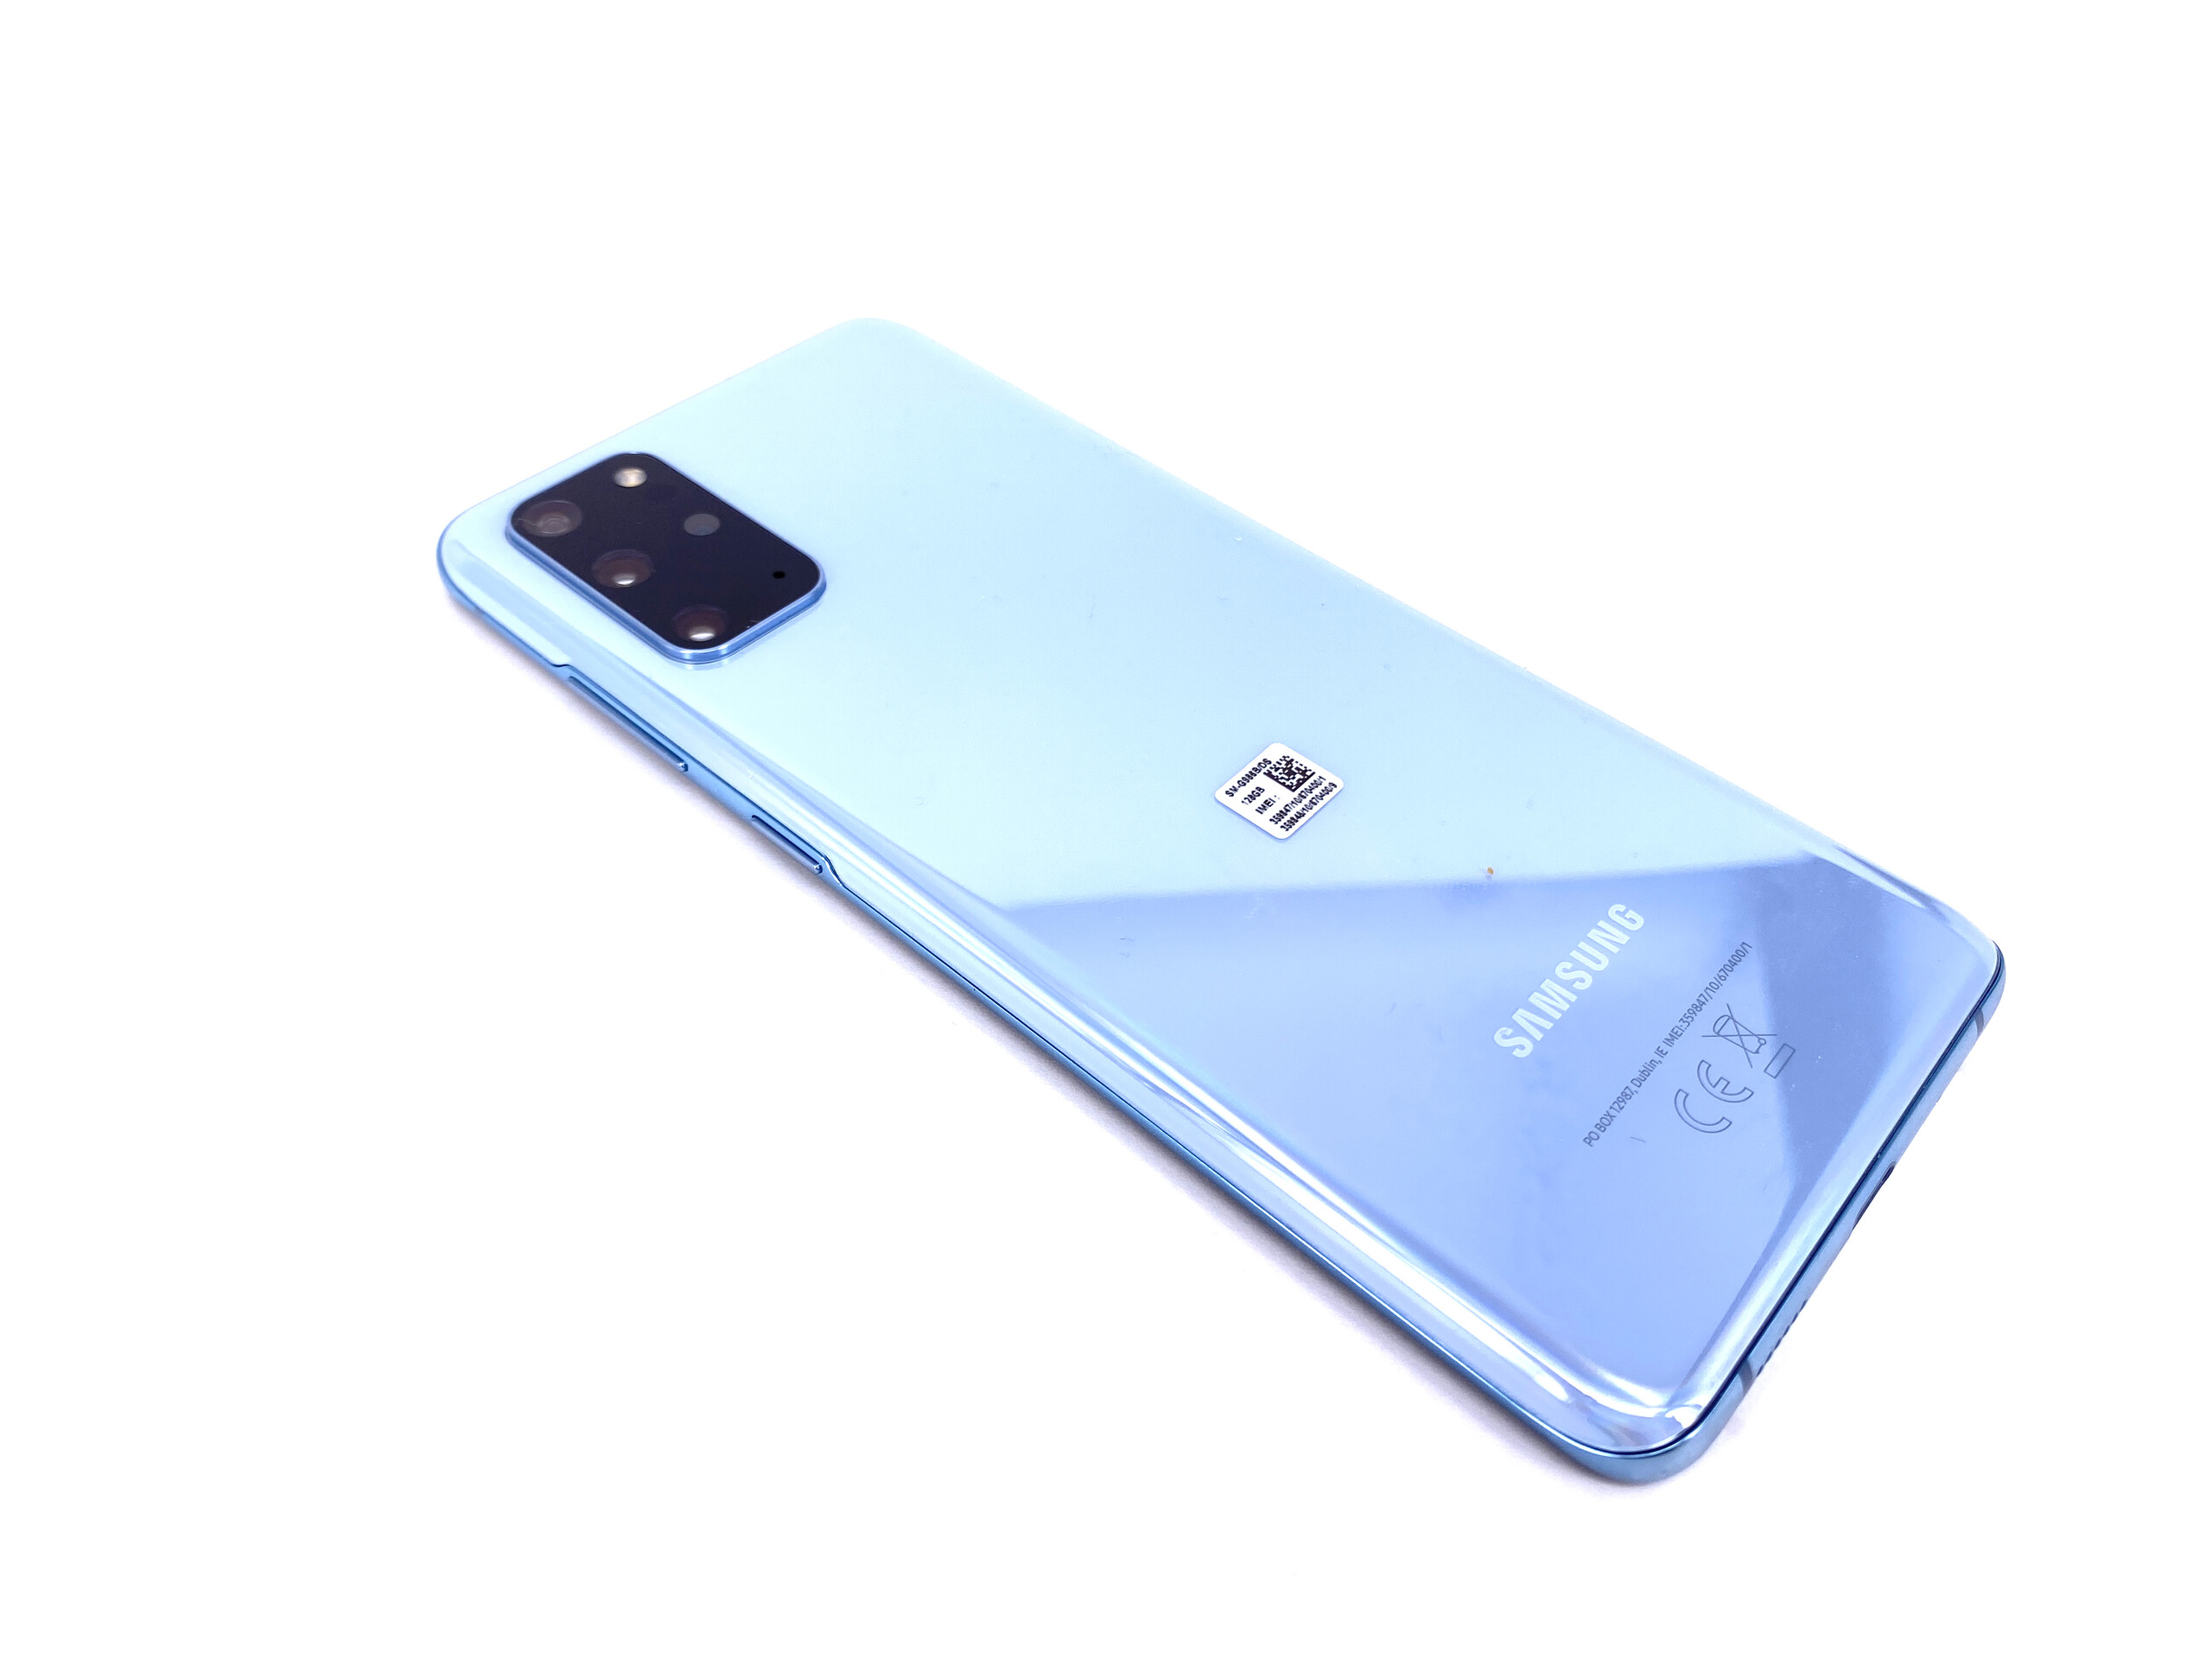
Priset på Galaxy S20+ har redan gått ner betydligt, strax efter att Samsung släppt den för ca 10.000 kronor. Detta är onekligen goda nyheter för intresserade köpare som kan få samma telefon till ett lägre pris. Men många europeiska kunder kommer få en Galaxy S20+ som inte lever upp till sin fulla potential. Detta beror i huvudsak på att Samsung har utrustat enheten med sin egna SoC, Exynos 990, som tyvärr hamnar efter Snapdragon 865 på många områden. I korthet har den europeiska versionen av Galaxy S20+ sämre 5G-anslutbarhet, kraftigare strypning vid belastning och sämre CPU-prestanda än sitt Snapdragon 865-utrustade syskon. Totalt sett är det bättre att köpa den Snapdragon 865-drivna versionen av Galaxy S20+.
Åtminstone börjar batteritiden på Samsungs Exynos SoC nu långsamt närma sig samma nivå som hos konkurrenterna. Exynos 990 är dock jämförelsevis energihungrig vid belastning. Samsung Galaxy S20+ har heller inte den mest avancerade laddningstekniken, det sparar man istället åt Galaxy S20 Ultra. Generellt sett har både Galaxy S20 och Galaxy S20 Plus betydande nedgraderingar jämfört med S20 Ultra.
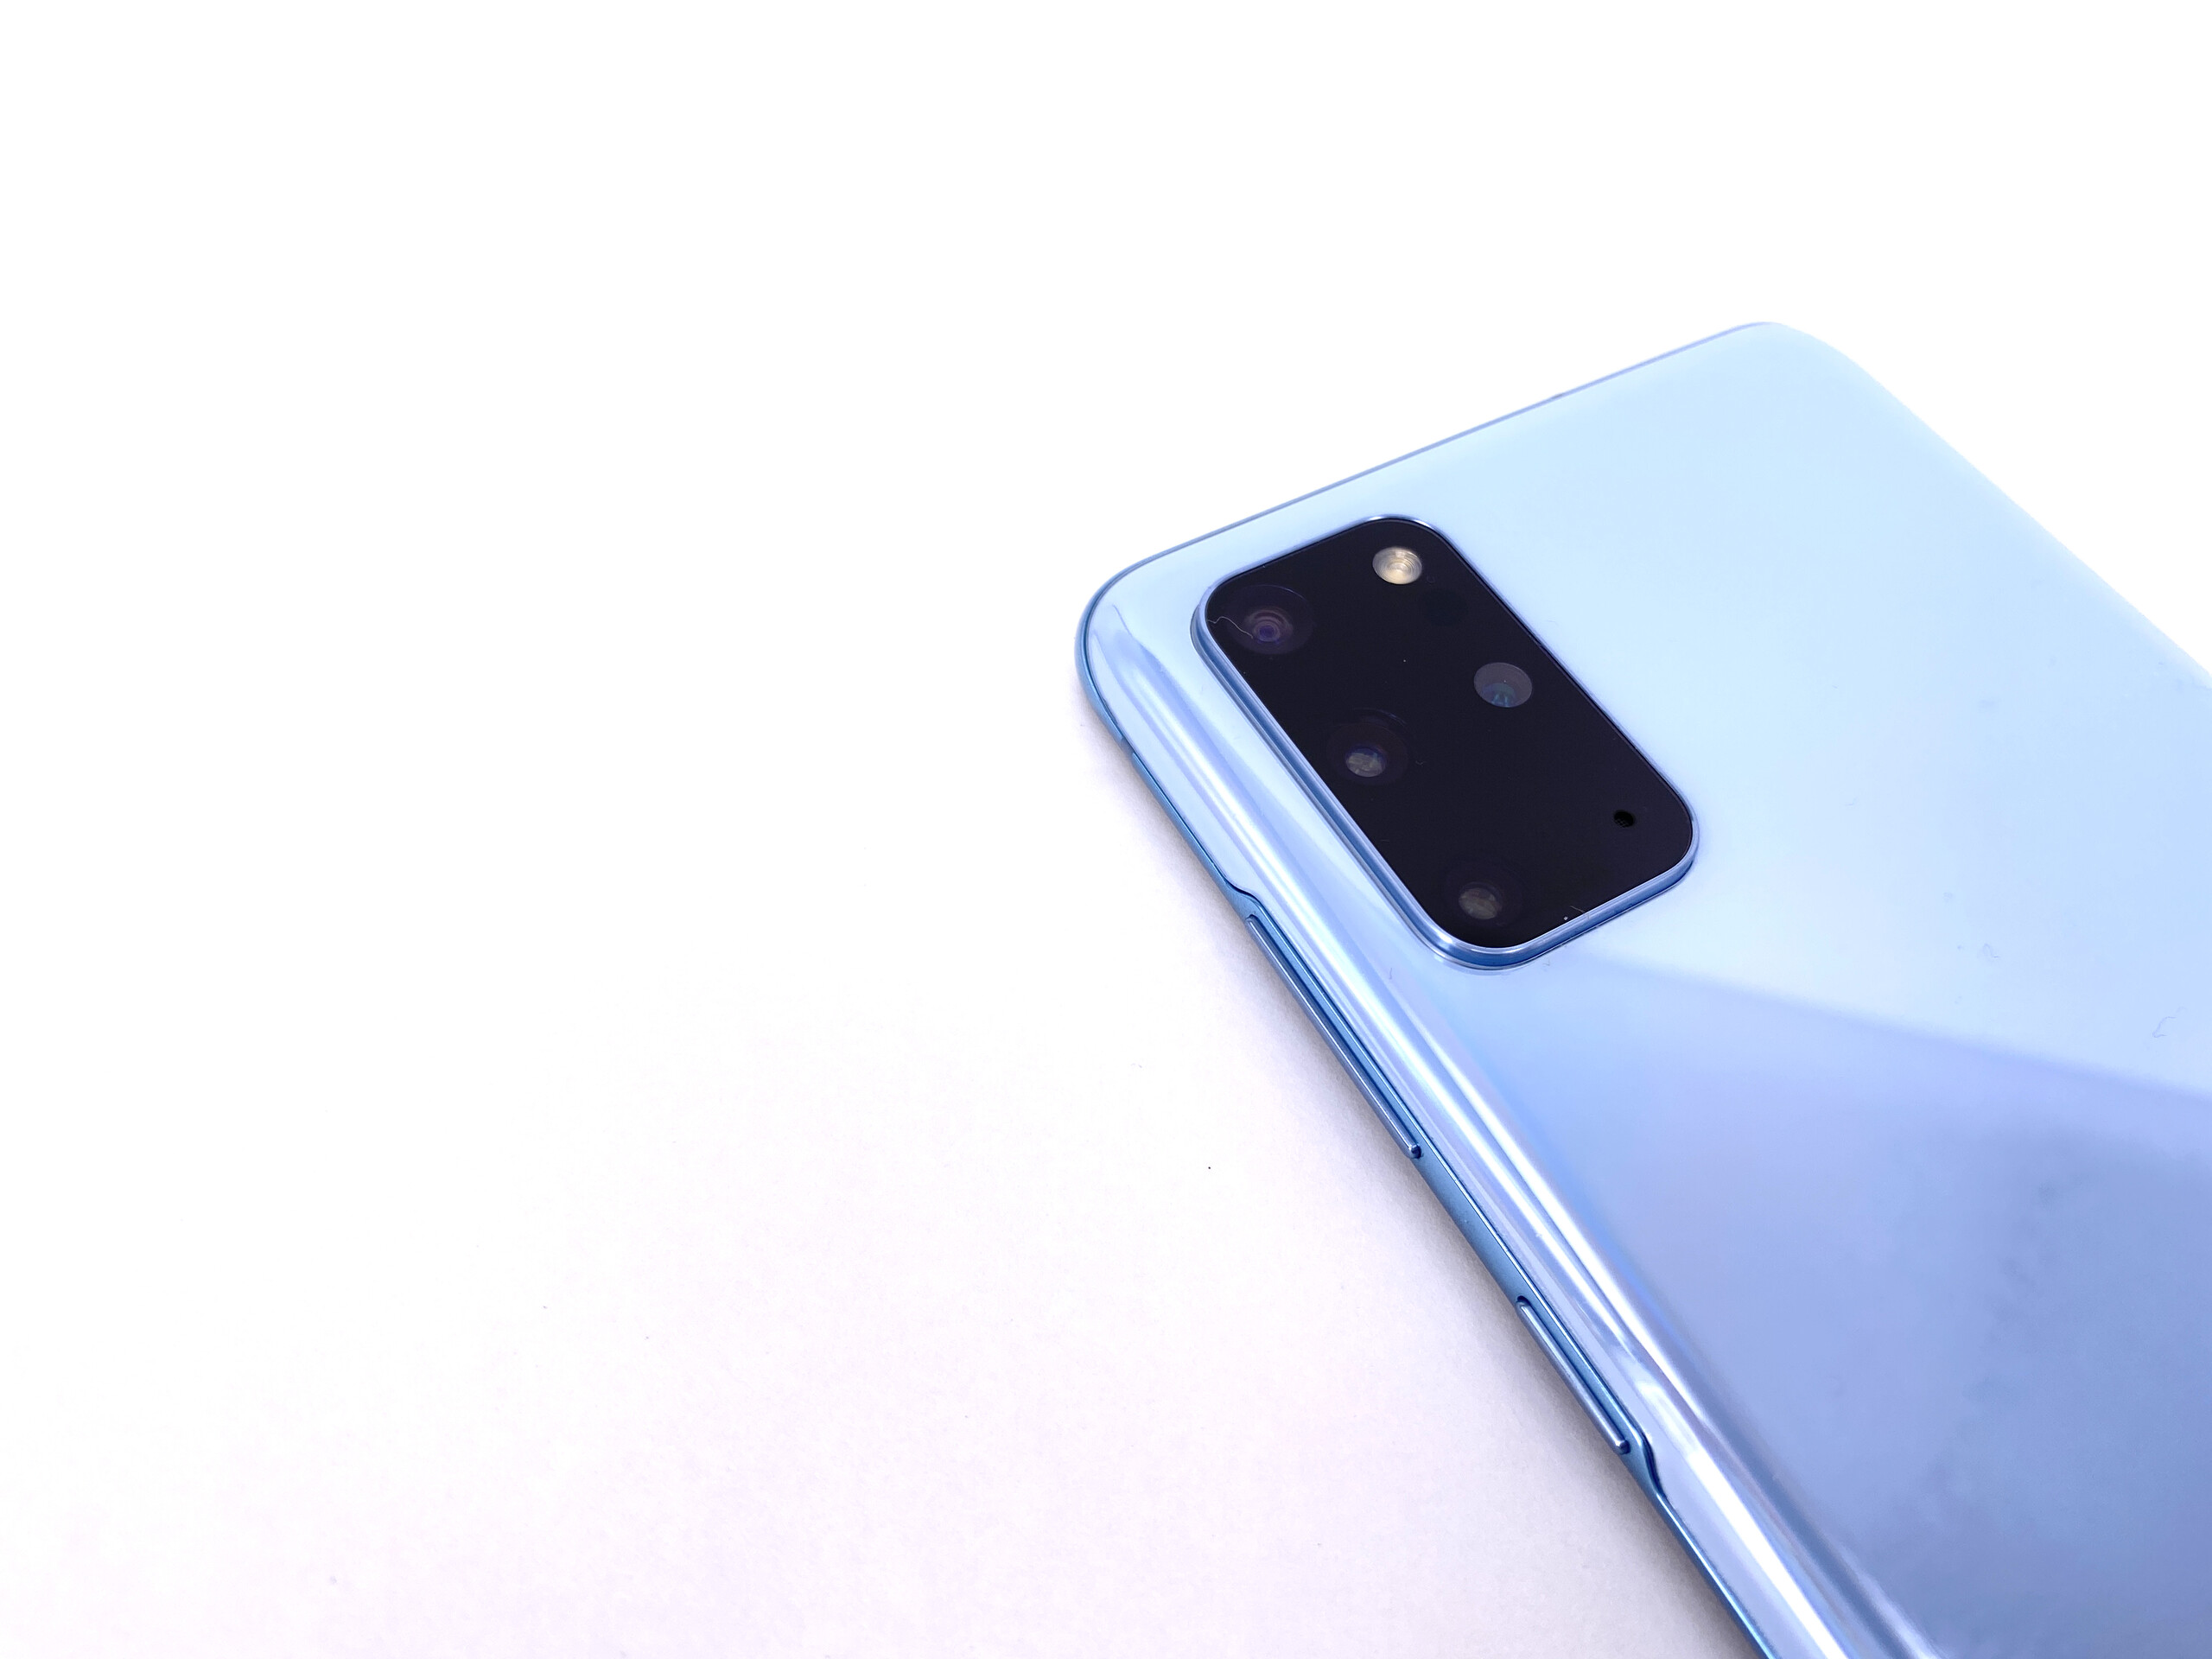
Detta beror i huvudsak på kamerorna Samsung inkluderat. Utan riktig optisk zoom känns det nästan som om Samsung prioriterat videoinspelning i 8K framför ett riktigt teleobjektiv. Men man sätter ändå en del begränsningar på 8K-inspelningen. Det går till exempel inte att zooma eller använda autofokus. På samma sätt begränsar Samsung vilka möjligheter som finns när man spelar in video i 60 FPS i 1080p eller uppåt.
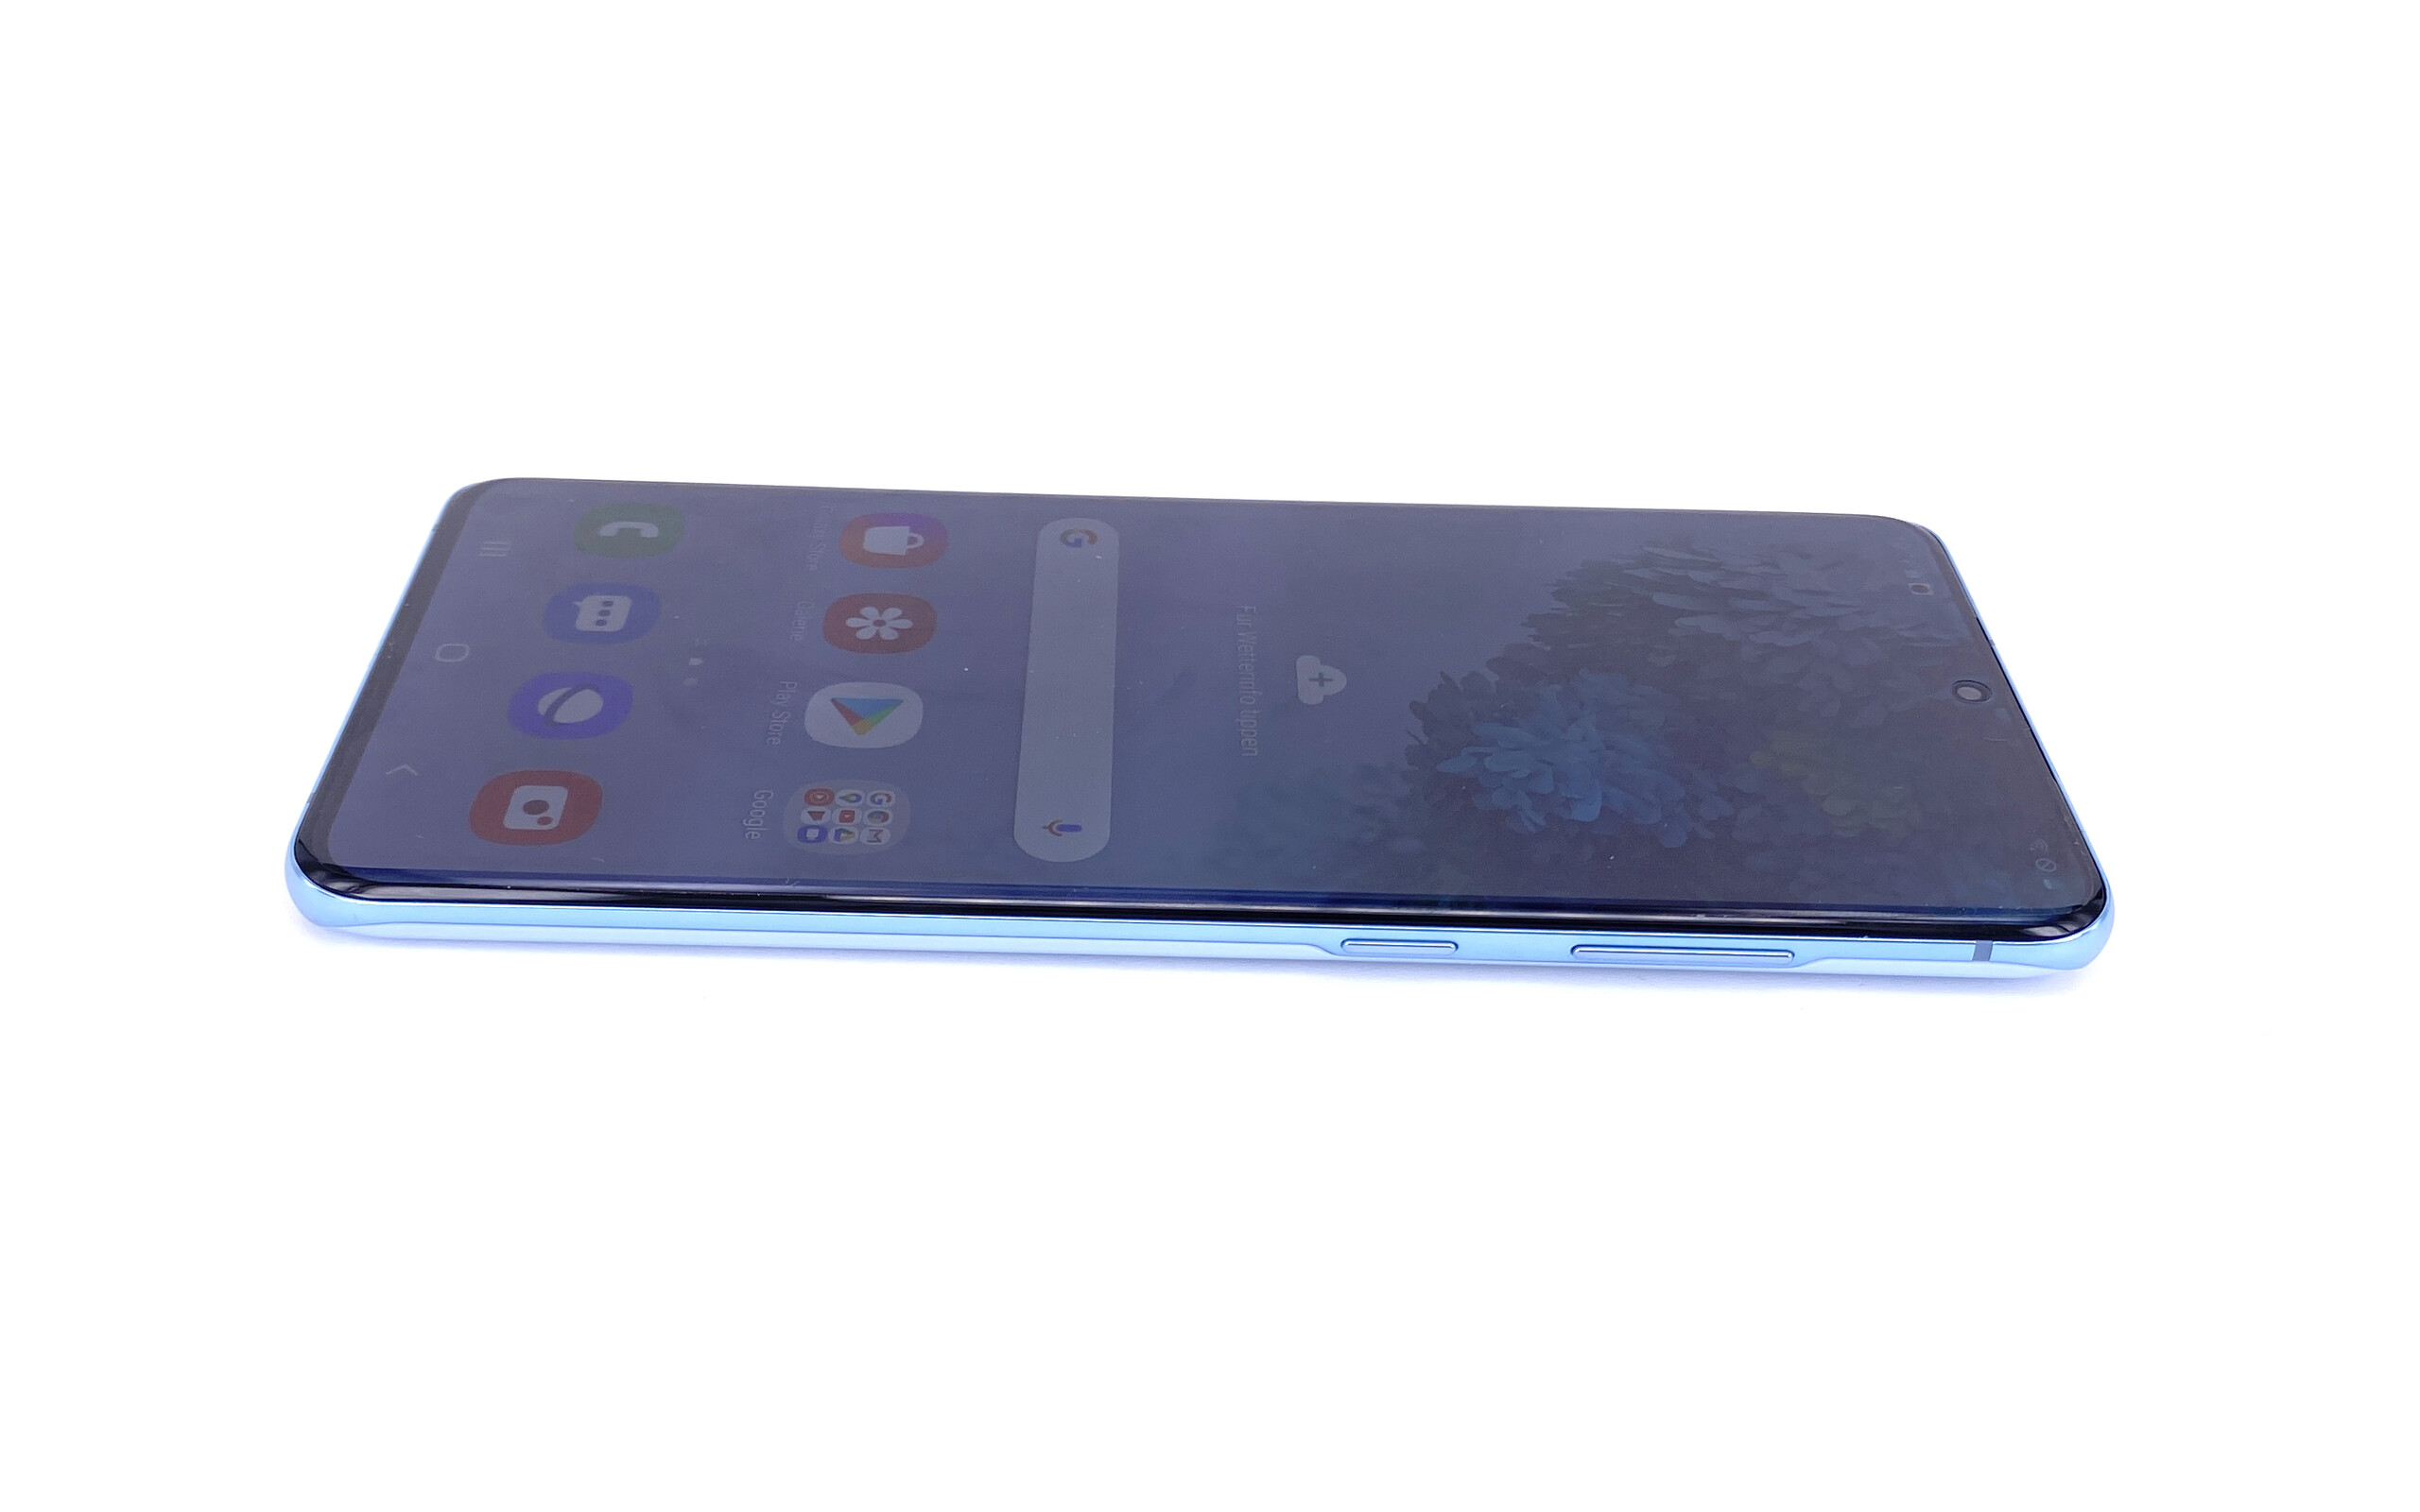
Det är synd att kamerorna har dessa brister, för Galaxy S20+ tar skapliga foton. One UI 2.1 känns dessutom modernt och inkluderar de senaste säkerhetsuppdateringarna samtidigt som enheten har en ljusstark och responsiv AMOLED-skärm.
Samsung Galaxy S20+ använder en del tricks för att dölja kamerans svagheter. Den utmärkta skärmen gör den dock ändå värd en titt.
För att sammanfatta så får du leta någon annanstans om du vill en den bästa kameratelefonen. Håller du dig loyal gentemot Samsung belönas du däremot med ett flagskepp av hög kvalitet som kan övertyga med sitt WiFi, bra samtalskvalitet, skaplig GPS-precision, imponerande konstruktionskvalitet och helt okej batteritid.
Samsung Galaxy S20+
- 08/31/2022 v7 (old)
Florian Schmitt
Price comparison
