Test: Razer Blade Stealth (i7-7500U) (sammanfattning)

| Networking | |
| iperf Server (receive) TCP 1 m | |
| Dell XPS 13 2016 9350 (FHD, i7-6560U) | |
| Apple MacBook 12 (Early 2016) 1.1 GHz | |
| Razer Blade Stealth QHD i7-7500U (sim) | |
| Medion Akoya S3409-MD60234 (jseb) | |
| Acer Aspire S 13 S5-371-71QZ | |
| iperf Client (transmit) TCP 1 m | |
| Dell XPS 13 2016 9350 (FHD, i7-6560U) | |
| Medion Akoya S3409-MD60234 (jseb) | |
| Razer Blade Stealth QHD i7-7500U (sim) | |
| Apple MacBook 12 (Early 2016) 1.1 GHz | |
| Acer Aspire S 13 S5-371-71QZ | |
| |||||||||||||||||||||||||
Distribution av ljusstyrkan: 88 %
Kontrast: 893:1 (Svärta: 0.45 cd/m²)
ΔE ColorChecker Calman: 3.6 | ∀{0.5-29.43 Ø4.71}
ΔE Greyscale Calman: 4.3 | ∀{0.09-98 Ø4.96}
95.7% sRGB (Argyll 1.6.3 3D)
62.3% AdobeRGB 1998 (Argyll 1.6.3 3D)
69.9% AdobeRGB 1998 (Argyll 3D)
95.8% sRGB (Argyll 3D)
68.7% Display P3 (Argyll 3D)
Gamma: 2.1
CCT: 6572 K
| Razer Blade Stealth QHD i7-7500U 2560x1440, 12.5" | Razer Blade Stealth UHD i7-6500U 3840x2160, 12.5" | Dell XPS 13 9360 QHD+ i5 3200x1800, 13.3" | Lenovo IdeaPad 710S-13ISK 1920x1080, 13.3" | Asus Zenbook UX305UA-FC040T 1920x1080, 13.3" | Acer Aspire S 13 S5-371-71QZ 1920x1080, 13.3" | |
|---|---|---|---|---|---|---|
| Display | 22% | -5% | -1% | -4% | ||
| Display P3 Coverage (%) | 68.7 | 83.7 22% | 64.6 -6% | 66.4 -3% | 65.1 -5% | |
| sRGB Coverage (%) | 95.8 | 99.2 4% | 91.6 -4% | 97.5 2% | 92.8 -3% | |
| AdobeRGB 1998 Coverage (%) | 69.9 | 97.2 39% | 66.5 -5% | 68.4 -2% | 66.3 -5% | |
| Response Times | -43% | 12% | -7% | 24% | -12% | |
| Response Time Grey 50% / Grey 80% * (ms) | 37 ? | 63.2 ? -71% | 31 ? 16% | 52.4 ? -42% | 25 ? 32% | 50 ? -35% |
| Response Time Black / White * (ms) | 33.4 ? | 38 ? -14% | 31.2 ? 7% | 23.6 ? 29% | 28 ? 16% | 29.6 ? 11% |
| PWM Frequency (Hz) | 200 ? | 220 ? | 50 ? | |||
| Screen | 16% | 10% | -13% | -24% | -5% | |
| Brightness middle (cd/m²) | 402 | 415 3% | 444 10% | 344 -14% | 358 -11% | 375 -7% |
| Brightness (cd/m²) | 382 | 399 4% | 393 3% | 326 -15% | 351 -8% | 358 -6% |
| Brightness Distribution (%) | 88 | 93 6% | 82 -7% | 87 -1% | 86 -2% | 87 -1% |
| Black Level * (cd/m²) | 0.45 | 0.309 31% | 0.33 27% | 0.36 20% | 0.4 11% | 0.39 13% |
| Contrast (:1) | 893 | 1343 50% | 1345 51% | 956 7% | 895 0% | 962 8% |
| Colorchecker dE 2000 * | 3.6 | 3.78 -5% | 4 -11% | 6.09 -69% | 5.96 -66% | 4.6 -28% |
| Colorchecker dE 2000 max. * | 7.5 | 7.2 4% | 7.7 -3% | 10 -33% | 10.99 -47% | 8.8 -17% |
| Greyscale dE 2000 * | 4.3 | 3.38 21% | 2.83 34% | 5.36 -25% | 8.93 -108% | 4 7% |
| Gamma | 2.1 105% | 2.23 99% | 2.05 107% | 2.01 109% | 2.28 96% | 2.34 94% |
| CCT | 6572 99% | 7329 89% | 6963 93% | 7230 90% | 6548 99% | 7304 89% |
| Color Space (Percent of AdobeRGB 1998) (%) | 62.3 | 85.1 37% | 59.3 -5% | 62.25 0% | 60 -4% | 57.9 -7% |
| Color Space (Percent of sRGB) (%) | 95.7 | 99.3 4% | 91.4 -4% | 97.54 2% | 93 -3% | 88.7 -7% |
| Totalt genomsnitt (program/inställningar) | -2% /
9% | 6% /
7% | -7% /
-10% | -1% /
-14% | -9% /
-6% |
* ... mindre är bättre
Visa svarstider
| ↔ Svarstid svart till vitt | ||
|---|---|---|
| 33.4 ms ... stiga ↗ och falla ↘ kombinerat | ↗ 13.2 ms stiga | 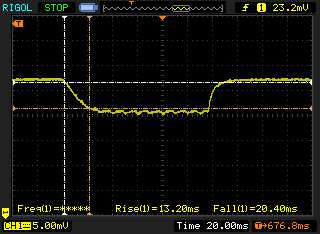 |
| ↘ 20.2 ms hösten | ||
| Skärmen visar långsamma svarsfrekvenser i våra tester och kommer att vara otillfredsställande för spelare. I jämförelse sträcker sig alla testade enheter från 0.1 (minst) till 240 (maximalt) ms. » 90 % av alla enheter är bättre. Detta innebär att den uppmätta svarstiden är sämre än genomsnittet av alla testade enheter (19.8 ms). | ||
| ↔ Svarstid 50 % grått till 80 % grått | ||
| 37 ms ... stiga ↗ och falla ↘ kombinerat | ↗ 19 ms stiga | 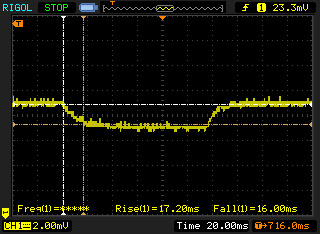 |
| ↘ 18 ms hösten | ||
| Skärmen visar långsamma svarsfrekvenser i våra tester och kommer att vara otillfredsställande för spelare. I jämförelse sträcker sig alla testade enheter från 0.165 (minst) till 636 (maximalt) ms. » 53 % av alla enheter är bättre. Detta innebär att den uppmätta svarstiden är sämre än genomsnittet av alla testade enheter (31 ms). | ||
Skärmflimmer / PWM (Puls-Width Modulation)
| Skärmflimmer / PWM upptäckt | 200 Hz | ≤ 30 % ljusstyrka inställning | 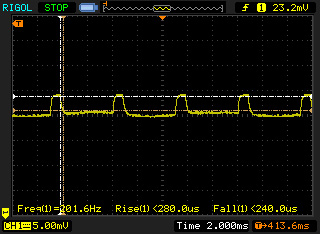 |
Displayens bakgrundsbelysning flimrar vid 200 Hz (i värsta fall, t.ex. med PWM) Flimrande upptäckt vid en ljusstyrkeinställning på 30 % och lägre. Det ska inte finnas något flimmer eller PWM över denna ljusstyrkeinställning. Frekvensen för 200 Hz är relativt låg, så känsliga användare kommer sannolikt att märka flimmer och uppleva ansträngda ögon vid den angivna ljusstyrkeinställningen och nedan. Som jämförelse: 52 % av alla testade enheter använder inte PWM för att dämpa skärmen. Om PWM upptäcktes mättes ett medelvärde av 7754 (minst: 5 - maximum: 343500) Hz. | |||
| PCMark 8 - Home Score Accelerated v2 | |
| Lenovo IdeaPad 710S-13ISK | |
| Dell XPS 13 2016 9350 (FHD, i7-6560U) | |
| Acer Aspire S 13 S5-371-71QZ | |
| Razer Blade Stealth QHD i7-7500U | |
| Asus Zenbook UX305UA-FC040T | |
| Medion Akoya S3409-MD60234 | |
| Razer Blade Stealth UHD i7-6500U | |
| Dell XPS 13 9360 QHD+ i5 | |
| Apple MacBook 12 (Early 2016) 1.1 GHz | |
| PCMark 8 Home Score Accelerated v2 | 3362 poäng | |
Hjälp | ||
| Razer Blade Stealth QHD i7-7500U Samsung PM951 NVMe MZVLV256 | Dell XPS 13 2016 9350 (FHD, i7-6560U) Samsung PM951 NVMe MZ-VLV256D | Asus Zenbook UX305UA-FC040T SK Hynix Canvas SC300 512GB M.2 (HFS512G39MND) | Acer Aspire S 13 S5-371-71QZ LiteOn CV1-8B512 | Lenovo IdeaPad 710S-13ISK Samsung PM951 NVMe MZVLV256 | Dell XPS 13 2016 9350 (FHD, i7-6560U) Samsung SSD SM951 512 GB MZHPV512HDGL | |
|---|---|---|---|---|---|---|
| CrystalDiskMark 3.0 | -9% | -27% | -23% | -1% | 115% | |
| Read Seq (MB/s) | 1178 | 1131 -4% | 469.1 -60% | 502 -57% | 1193 1% | 1502 28% |
| Write Seq (MB/s) | 305.4 | 311.4 2% | 412.1 35% | 418.9 37% | 309.6 1% | 1547 407% |
| Read 512 (MB/s) | 638 | 685 7% | 301.6 -53% | 341.3 -47% | 613 -4% | 1020 60% |
| Write 512 (MB/s) | 305.7 | 276.3 -10% | 327.1 7% | 389.7 27% | 311 2% | 1480 384% |
| Read 4k (MB/s) | 38.54 | 39.63 3% | 28.08 -27% | 29.69 -23% | 42.43 10% | 52 35% |
| Write 4k (MB/s) | 153.4 | 133.9 -13% | 71.9 -53% | 86.8 -43% | 144.9 -6% | 139.5 -9% |
| Read 4k QD32 (MB/s) | 614 | 399.7 -35% | 262 -57% | 301.3 -51% | 549 -11% | 467.1 -24% |
| Write 4k QD32 (MB/s) | 302.7 | 245.6 -19% | 274.7 -9% | 211.2 -30% | 311.3 3% | 409.5 35% |

| 3DMark 11 Performance | 1801 poäng | |
| 3DMark Cloud Gate Standard Score | 6538 poäng | |
| 3DMark Fire Strike Score | 918 poäng | |
Hjälp | ||
| låg | med. | hög | ultra | |
|---|---|---|---|---|
| Sims 4 (2014) | 182 | 56.4 | 27.6 | 18.3 |
| The Witcher 3 (2015) | 13.92 | |||
| World of Warships (2015) | 72.9 | 47.78 | 23.63 | |
| Rise of the Tomb Raider (2016) | 20.2 | 12.7 |
Ljudnivå
| Låg belastning |
| 31 / 31 / 31 dB(A) |
| Hög belastning |
| 35 / 40.5 dB(A) |
 | ||
30 dB tyst 40 dB(A) hörbar 50 dB(A) högt ljud |
||
min: | ||
Razer Blade Stealth QHD i7-7500U ljudanalys
(-) | inte särskilt höga högtalare (40.5 dB)
Analysis not possible as maximum curve is missing or too high
(-) Den maximala temperaturen på ovansidan är 46.7 °C / 116 F, jämfört med genomsnittet av 34.3 °C / 94 F , allt från 21.2 till 62.5 °C för klassen Office.
(-) Botten värms upp till maximalt 51.3 °C / 124 F, jämfört med genomsnittet av 36.8 °C / 98 F
(+) Vid tomgångsbruk är medeltemperaturen för ovansidan 29.5 °C / 85 F, jämfört med enhetsgenomsnittet på 29.5 °C / ### class_avg_f### F.
(+) Handledsstöden och pekplattan når maximal hudtemperatur (33.4 °C / 92.1 F) och är därför inte varma.
(-) Medeltemperaturen för handledsstödsområdet på liknande enheter var 27.5 °C / 81.5 F (-5.9 °C / -10.6 F).
Razer Blade Stealth QHD i7-7500U ljudanalys
(±) | högtalarljudstyrkan är genomsnittlig men bra (80.6 dB)
Bas 100 - 315 Hz
(±) | reducerad bas - i genomsnitt 8% lägre än medianen
(±) | linjäriteten för basen är genomsnittlig (13.9% delta till föregående frekvens)
Mellan 400 - 2000 Hz
(±) | högre mellan - i genomsnitt 5.4% högre än median
(±) | linjäriteten för mids är genomsnittlig (7.5% delta till föregående frekvens)
Högsta 2 - 16 kHz
(+) | balanserade toppar - endast 3.6% från medianen
(+) | toppar är linjära (5.7% delta till föregående frekvens)
Totalt 100 - 16 000 Hz
(+) | det totala ljudet är linjärt (14% skillnad mot median)
Jämfört med samma klass
» 9% av alla testade enheter i den här klassen var bättre, 4% liknande, 86% sämre
» Den bästa hade ett delta på 7%, genomsnittet var 21%, sämst var 53%
Jämfört med alla testade enheter
» 16% av alla testade enheter var bättre, 4% liknande, 80% sämre
» Den bästa hade ett delta på 4%, genomsnittet var 23%, sämst var 134%
Apple MacBook 12 (Early 2016) 1.1 GHz ljudanalys
(+) | högtalare kan spela relativt högt (83.6 dB)
Bas 100 - 315 Hz
(±) | reducerad bas - i genomsnitt 11.3% lägre än medianen
(±) | linjäriteten för basen är genomsnittlig (14.2% delta till föregående frekvens)
Mellan 400 - 2000 Hz
(+) | balanserad mellan - endast 2.4% från medianen
(+) | mids är linjära (5.5% delta till föregående frekvens)
Högsta 2 - 16 kHz
(+) | balanserade toppar - endast 2% från medianen
(+) | toppar är linjära (4.5% delta till föregående frekvens)
Totalt 100 - 16 000 Hz
(+) | det totala ljudet är linjärt (10.2% skillnad mot median)
Jämfört med samma klass
» 7% av alla testade enheter i den här klassen var bättre, 2% liknande, 90% sämre
» Den bästa hade ett delta på 5%, genomsnittet var 18%, sämst var 53%
Jämfört med alla testade enheter
» 5% av alla testade enheter var bättre, 1% liknande, 94% sämre
» Den bästa hade ett delta på 4%, genomsnittet var 23%, sämst var 134%
| Av/Standby | |
| Låg belastning | |
| Hög belastning |
|
Förklaring:
min: | |
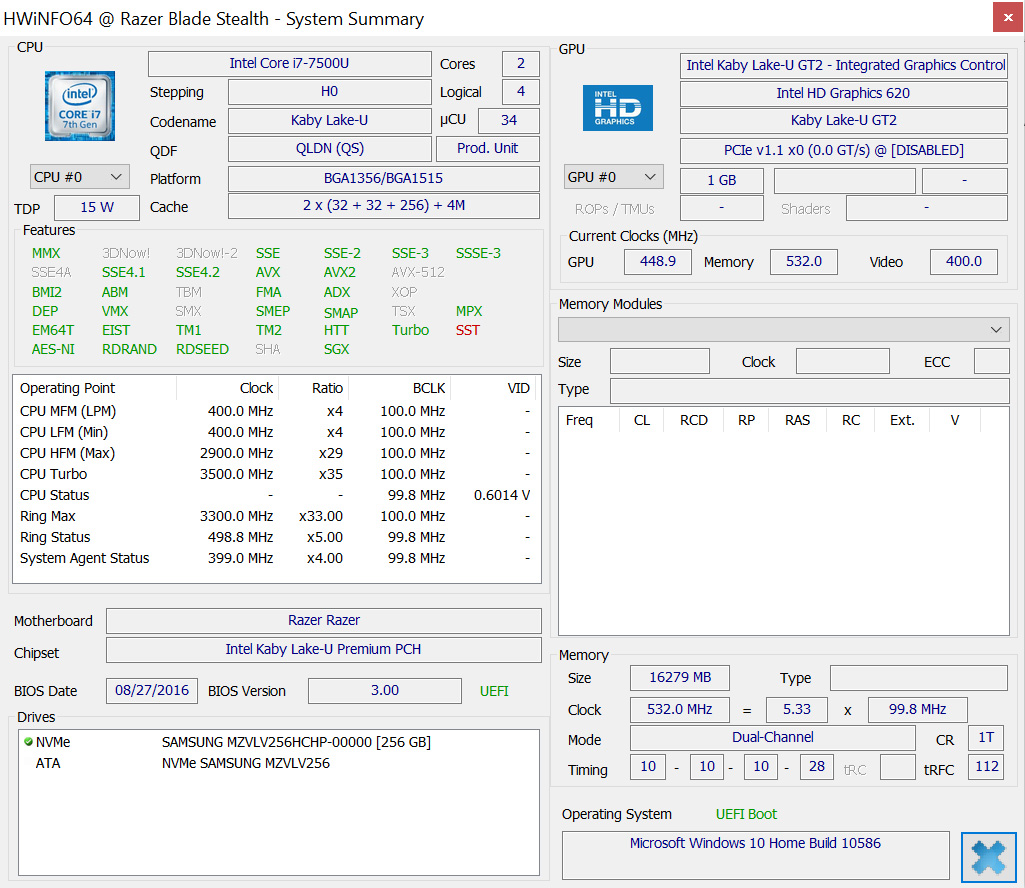
| Razer Blade Stealth QHD i7-7500U i7-7500U, HD Graphics 620, Samsung PM951 NVMe MZVLV256, , 2560x1440, 12.5" | Razer Blade Stealth UHD i7-6500U 6500U, HD Graphics 520, Samsung PM951 NVMe MZ-VLV256D, IPS IGZO, 3840x2160, 12.5" | Dell XPS 13 9360 QHD+ i5 i5-7200U, HD Graphics 620, Toshiba NVMe THNSN5256GPUK, , 3200x1800, 13.3" | Lenovo IdeaPad 710S-13ISK 6560U, Iris Graphics 540, Samsung PM951 NVMe MZVLV256, IPS, 1920x1080, 13.3" | Asus Zenbook UX305UA-FC040T 6500U, HD Graphics 520, SK Hynix Canvas SC300 512GB M.2 (HFS512G39MND), IPS, 1920x1080, 13.3" | Acer Aspire S 13 S5-371-71QZ 6500U, HD Graphics 520, LiteOn CV1-8B512, IPS, 1920x1080, 13.3" | |
|---|---|---|---|---|---|---|
| Power Consumption | -60% | 18% | 3% | 18% | 10% | |
| Idle Minimum * (Watt) | 4.4 | 9 -105% | 3.7 16% | 3.3 25% | 3.2 27% | 4.1 7% |
| Idle Average * (Watt) | 5.8 | 12.8 -121% | 6.1 -5% | 7.4 -28% | 6.5 -12% | 6.7 -16% |
| Idle Maximum * (Watt) | 8.6 | 16.8 -95% | 6.5 24% | 8.2 5% | 6.7 22% | 7.4 14% |
| Load Average * (Watt) | 35.2 | 35.7 -1% | 29.5 16% | 36.5 -4% | 30.6 13% | 32.4 8% |
| Load Maximum * (Watt) | 52 | 39.3 24% | 33 37% | 43.7 16% | 31 40% | 32.4 38% |
* ... mindre är bättre
| Razer Blade Stealth QHD i7-7500U i7-7500U, HD Graphics 620, 53.6 Wh | Razer Blade Stealth UHD i7-6500U 6500U, HD Graphics 520, 45 Wh | Dell XPS 13 9360 QHD+ i5 i5-7200U, HD Graphics 620, 60 Wh | Lenovo IdeaPad 710S-13ISK 6560U, Iris Graphics 540, 46 Wh | Asus Zenbook UX305UA-FC040T 6500U, HD Graphics 520, 56 Wh | Acer Aspire S 13 S5-371-71QZ 6500U, HD Graphics 520, 45 Wh | Medion Akoya S3409-MD60234 i7-7500U, HD Graphics 620, 45 Wh | Dell XPS 13 2016 9350 (FHD, i7-6560U) 6560U, Iris Graphics 540, 56 Wh | |
|---|---|---|---|---|---|---|---|---|
| Batteridrifttid | -43% | 17% | -11% | 33% | 5% | -23% | 12% | |
| Reader / Idle (h) | 13.6 | 7.3 -46% | 13.5 -1% | 23.8 75% | 17.1 26% | 12 -12% | 15.7 15% | |
| WiFi v1.3 (h) | 8.3 | 3.8 -54% | 8.8 6% | 7 -16% | 9.4 13% | 7.9 -5% | 4.6 -45% | 7.3 -12% |
| Load (h) | 1.8 | 1.3 -28% | 2.3 28% | 1.5 -17% | 2 11% | 1.7 -6% | 1.6 -11% | 2.4 33% |
| H.264 (h) | 9.1 | 8.1 | 9.1 | 4.1 |
För
Emot
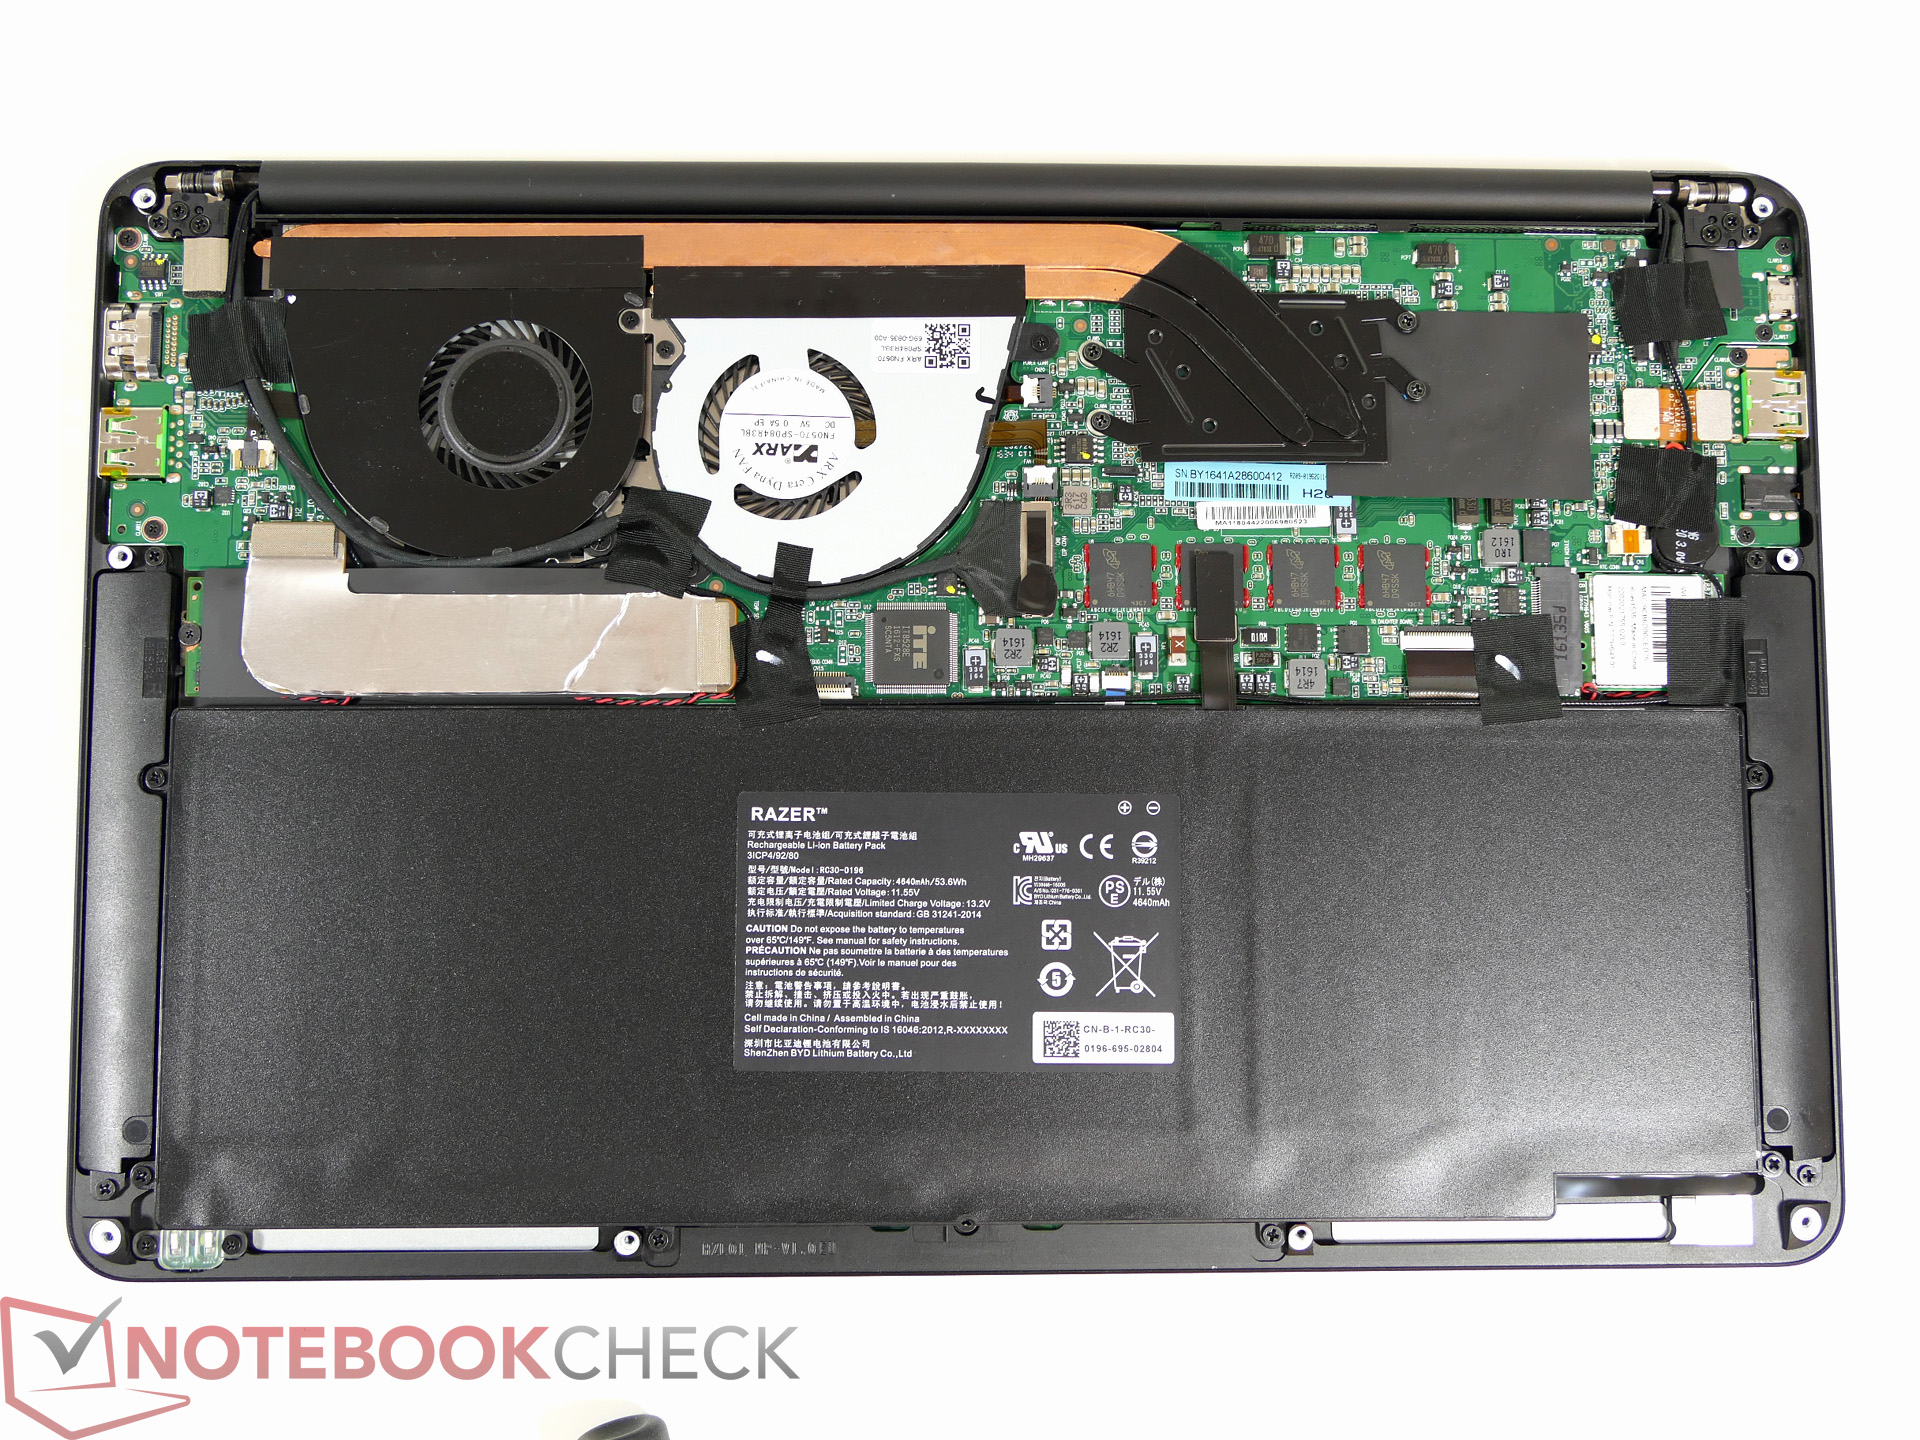
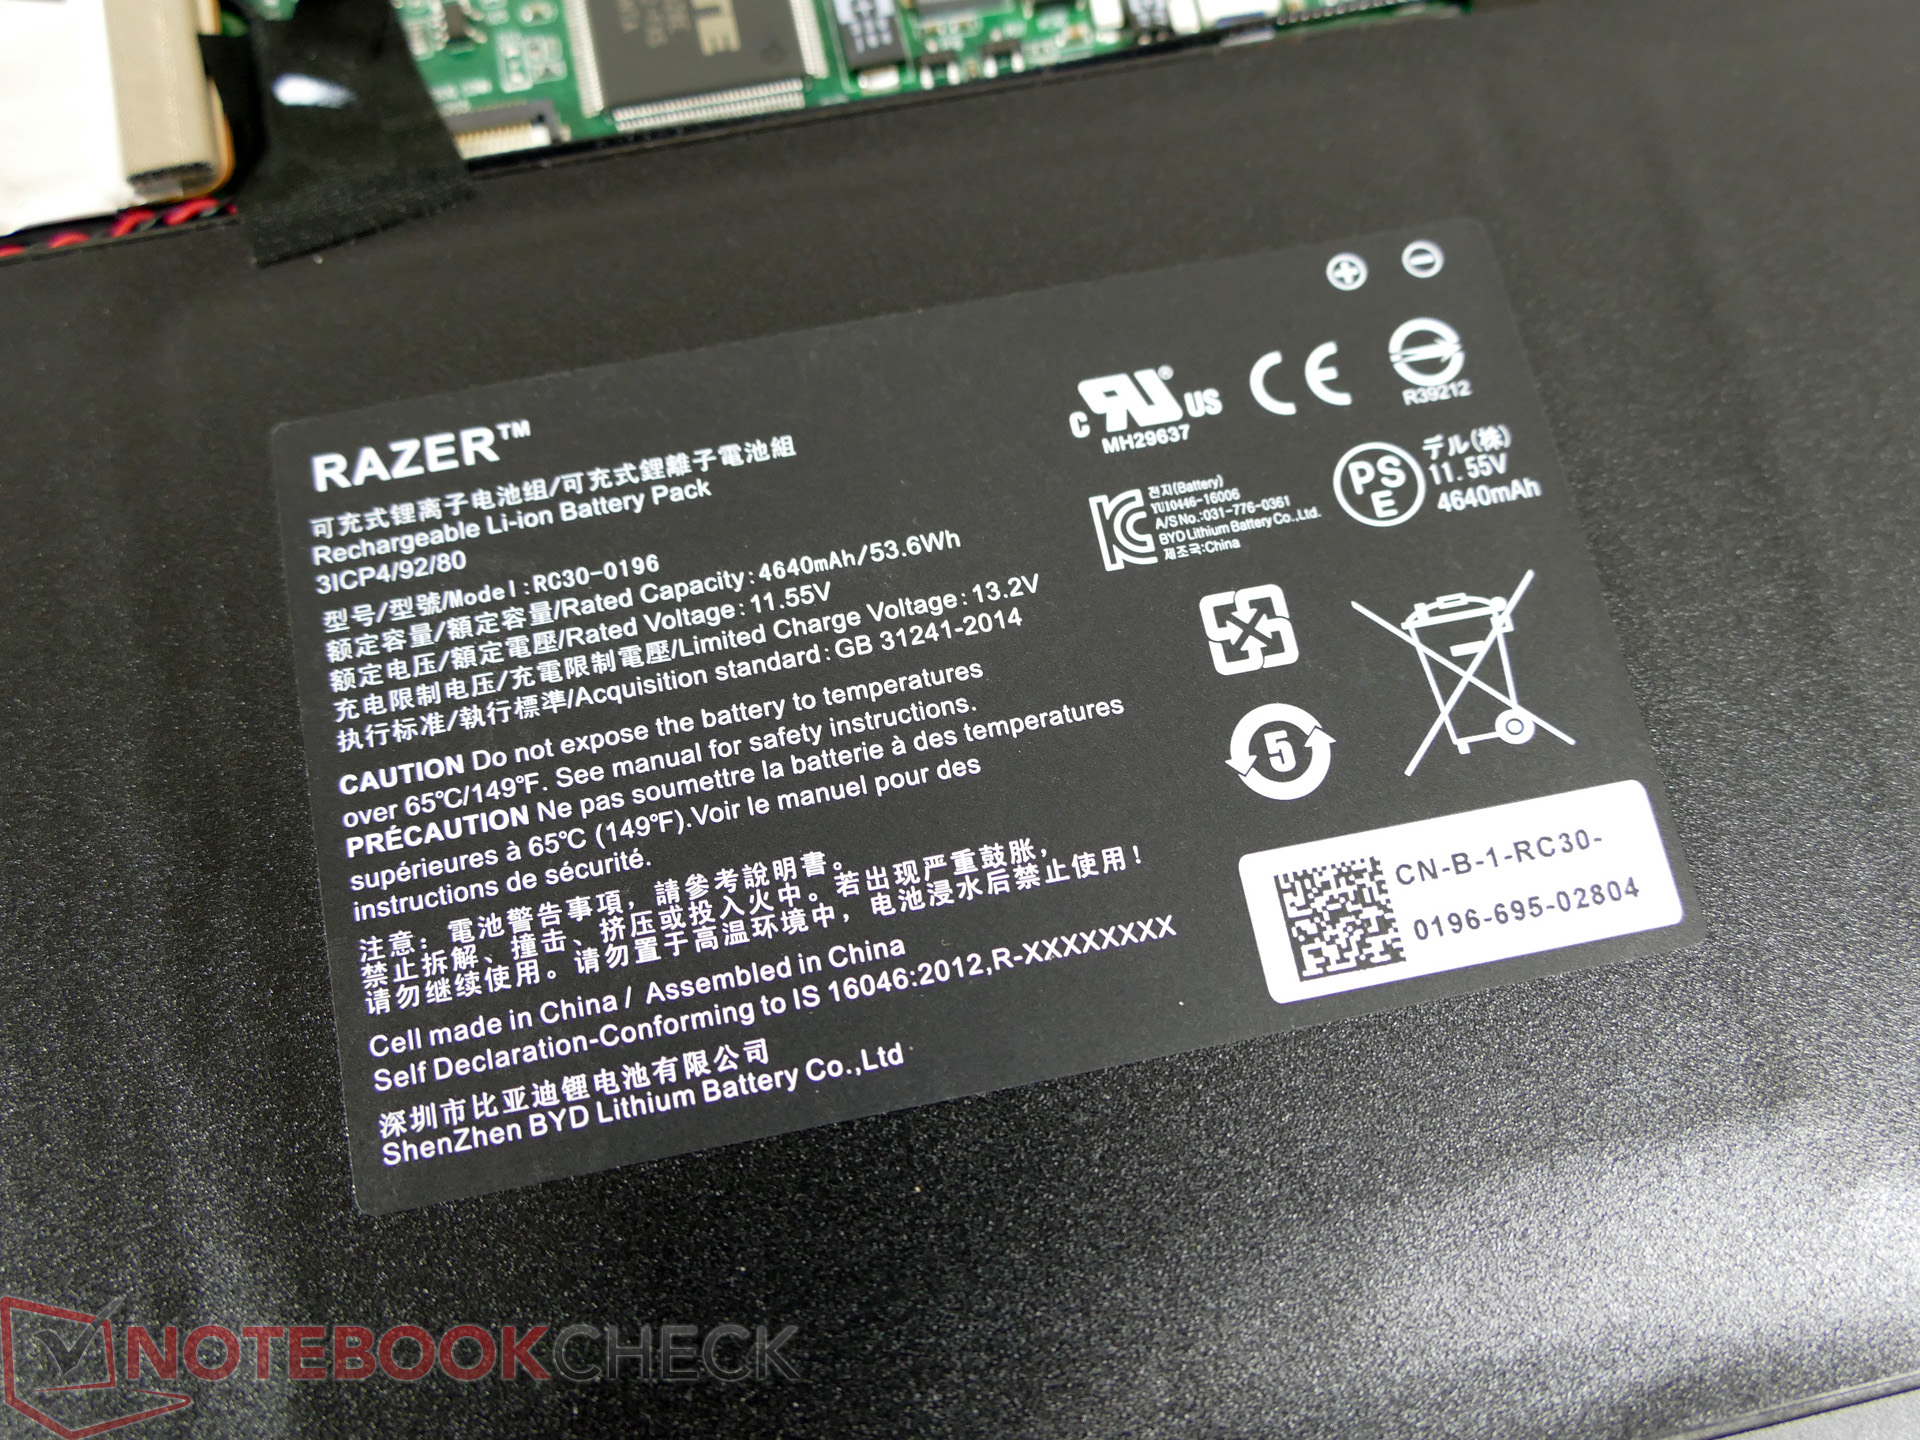
Med den senaste uppdateringen av Blade Stealth har Razer eliminerat föregångarens största brist: den mediokra batteritiden. Nu håller den ut i upp till 13 timmar, så beroende på arbetsuppgifter kan batteriet räcka hela dagen.
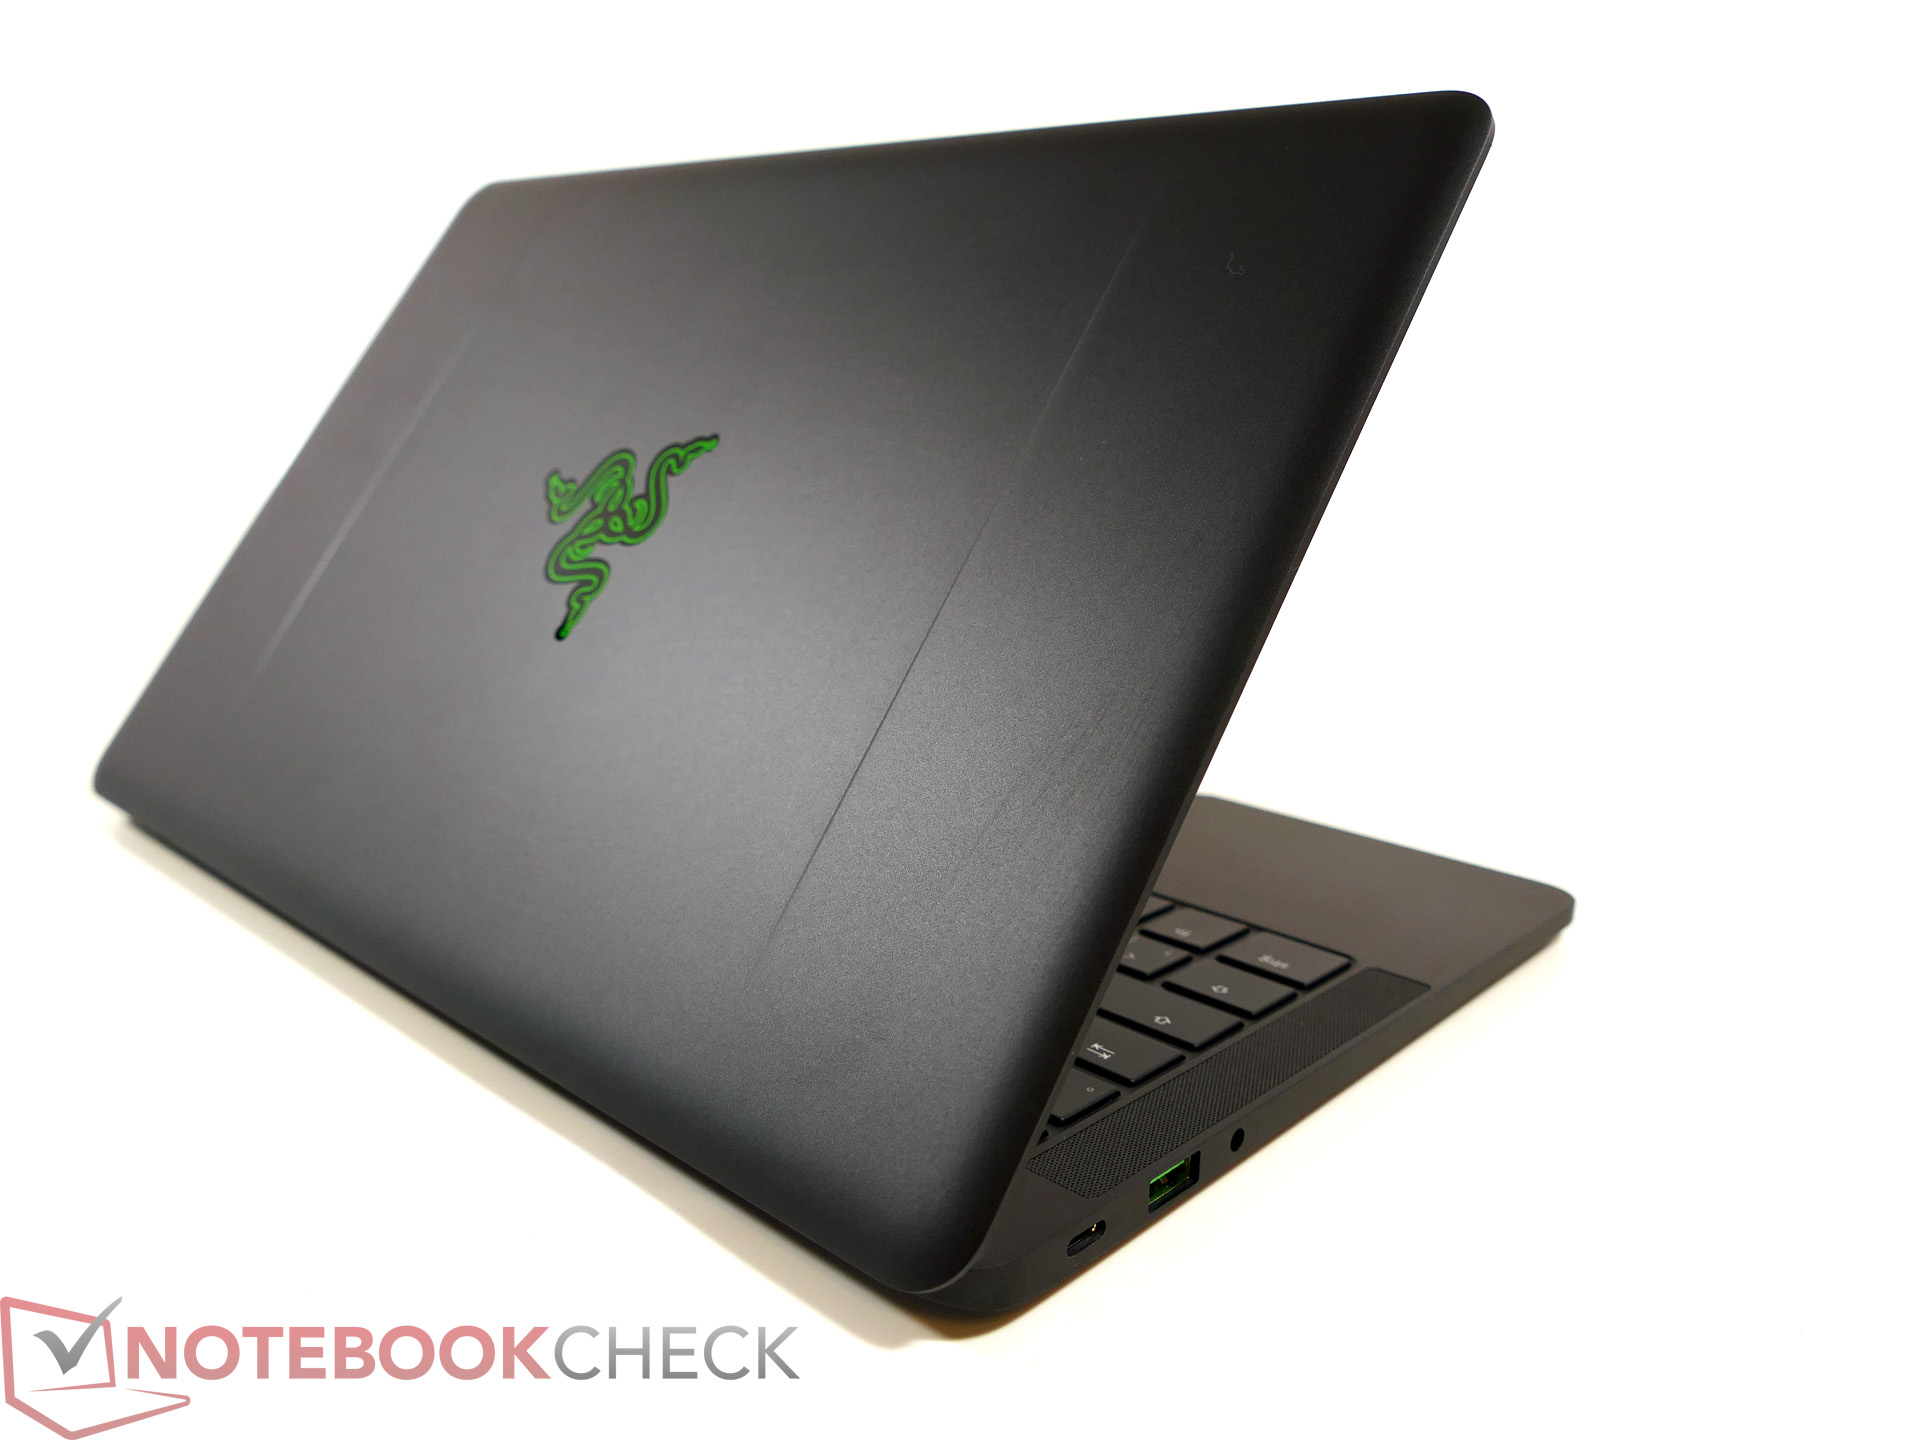
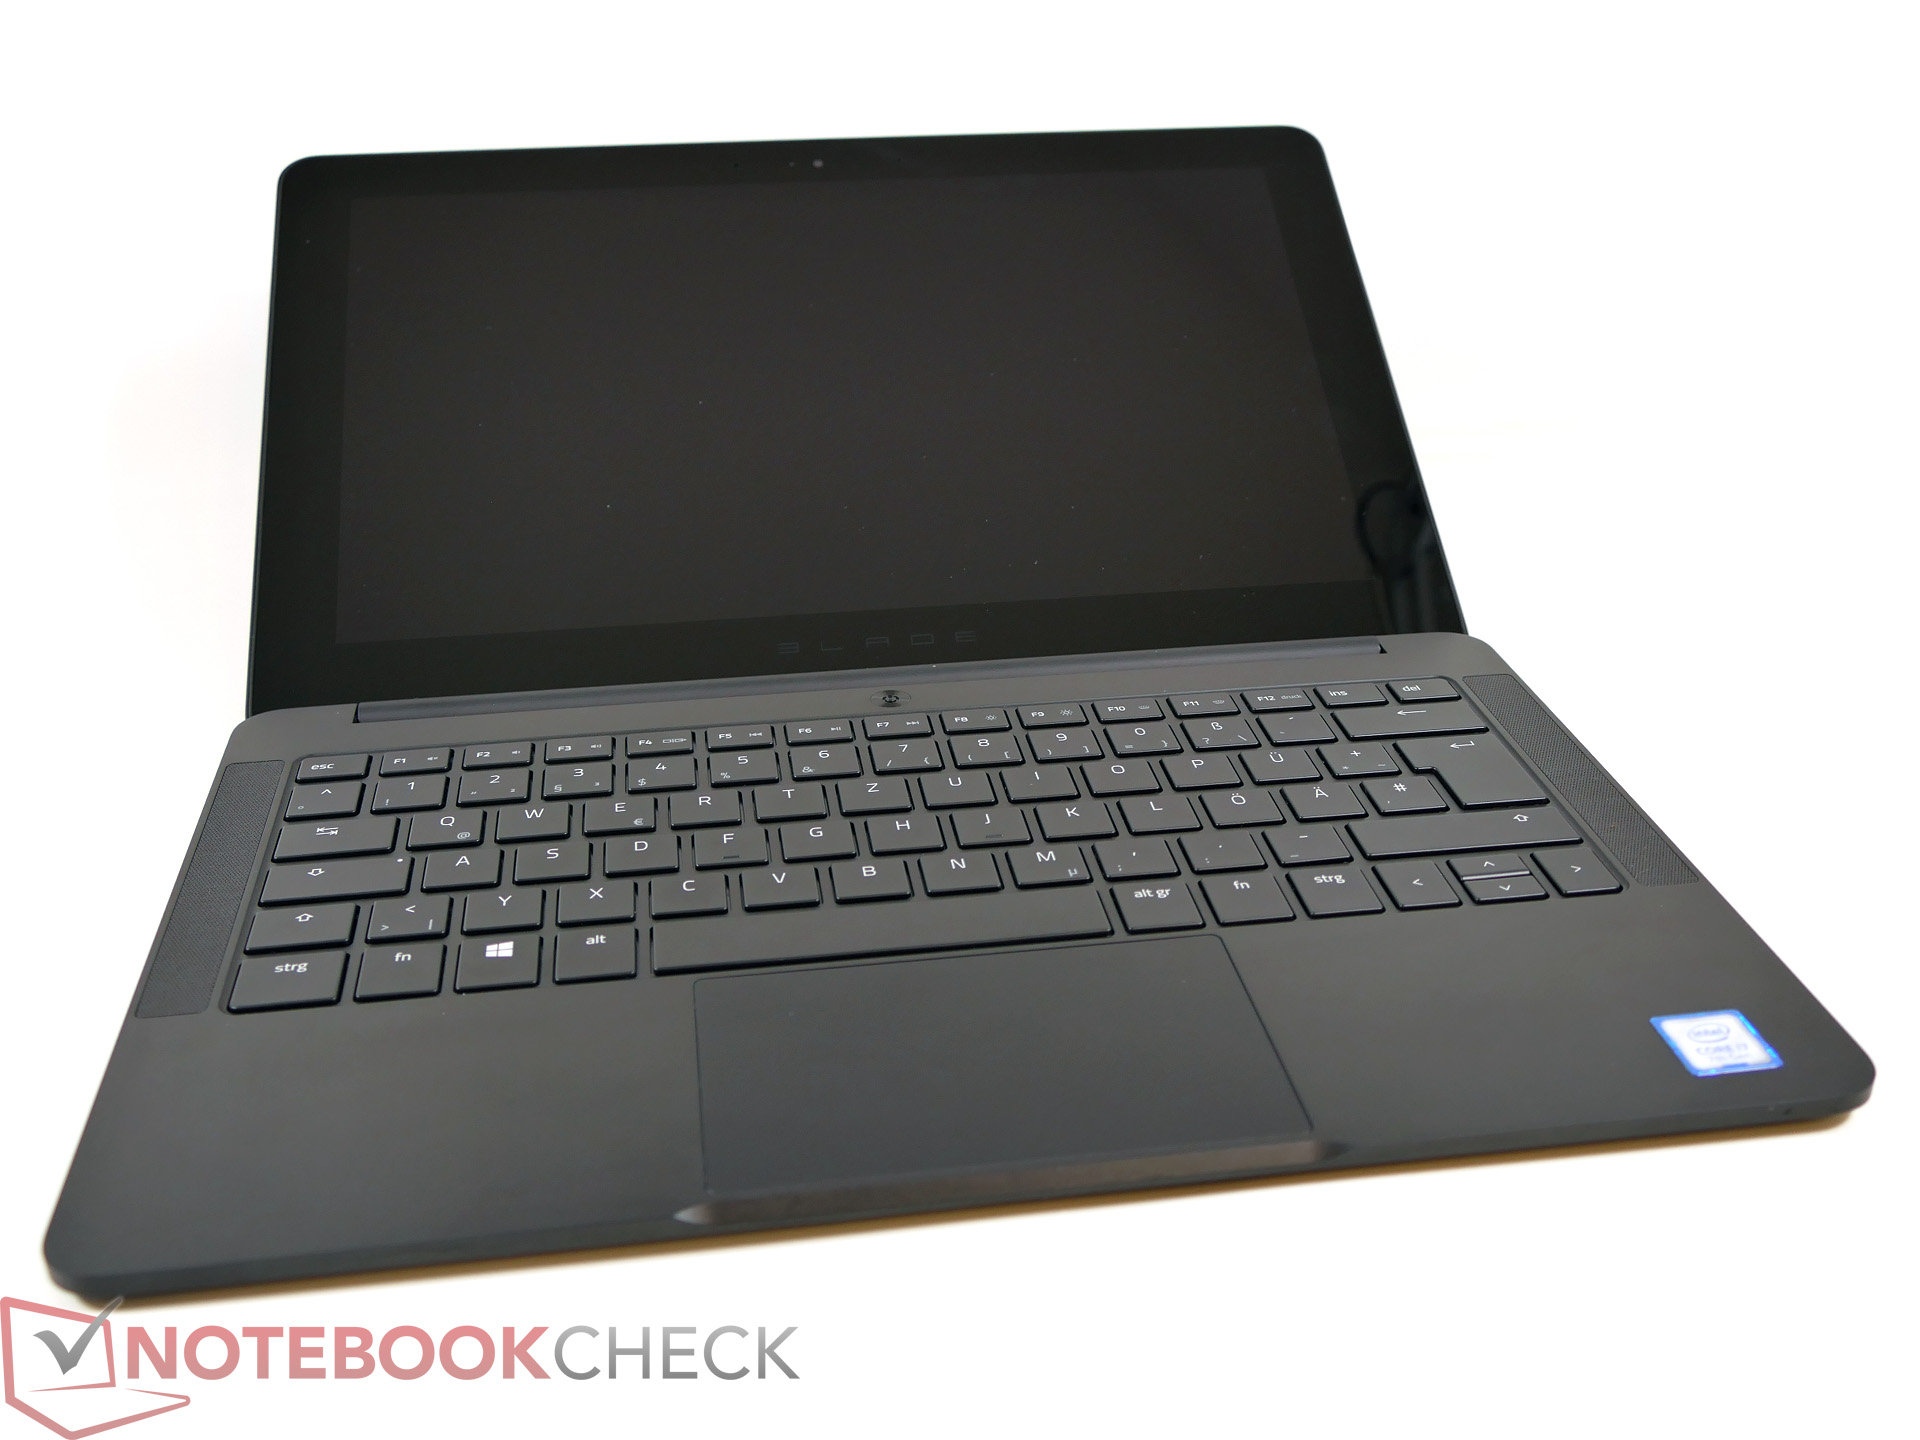
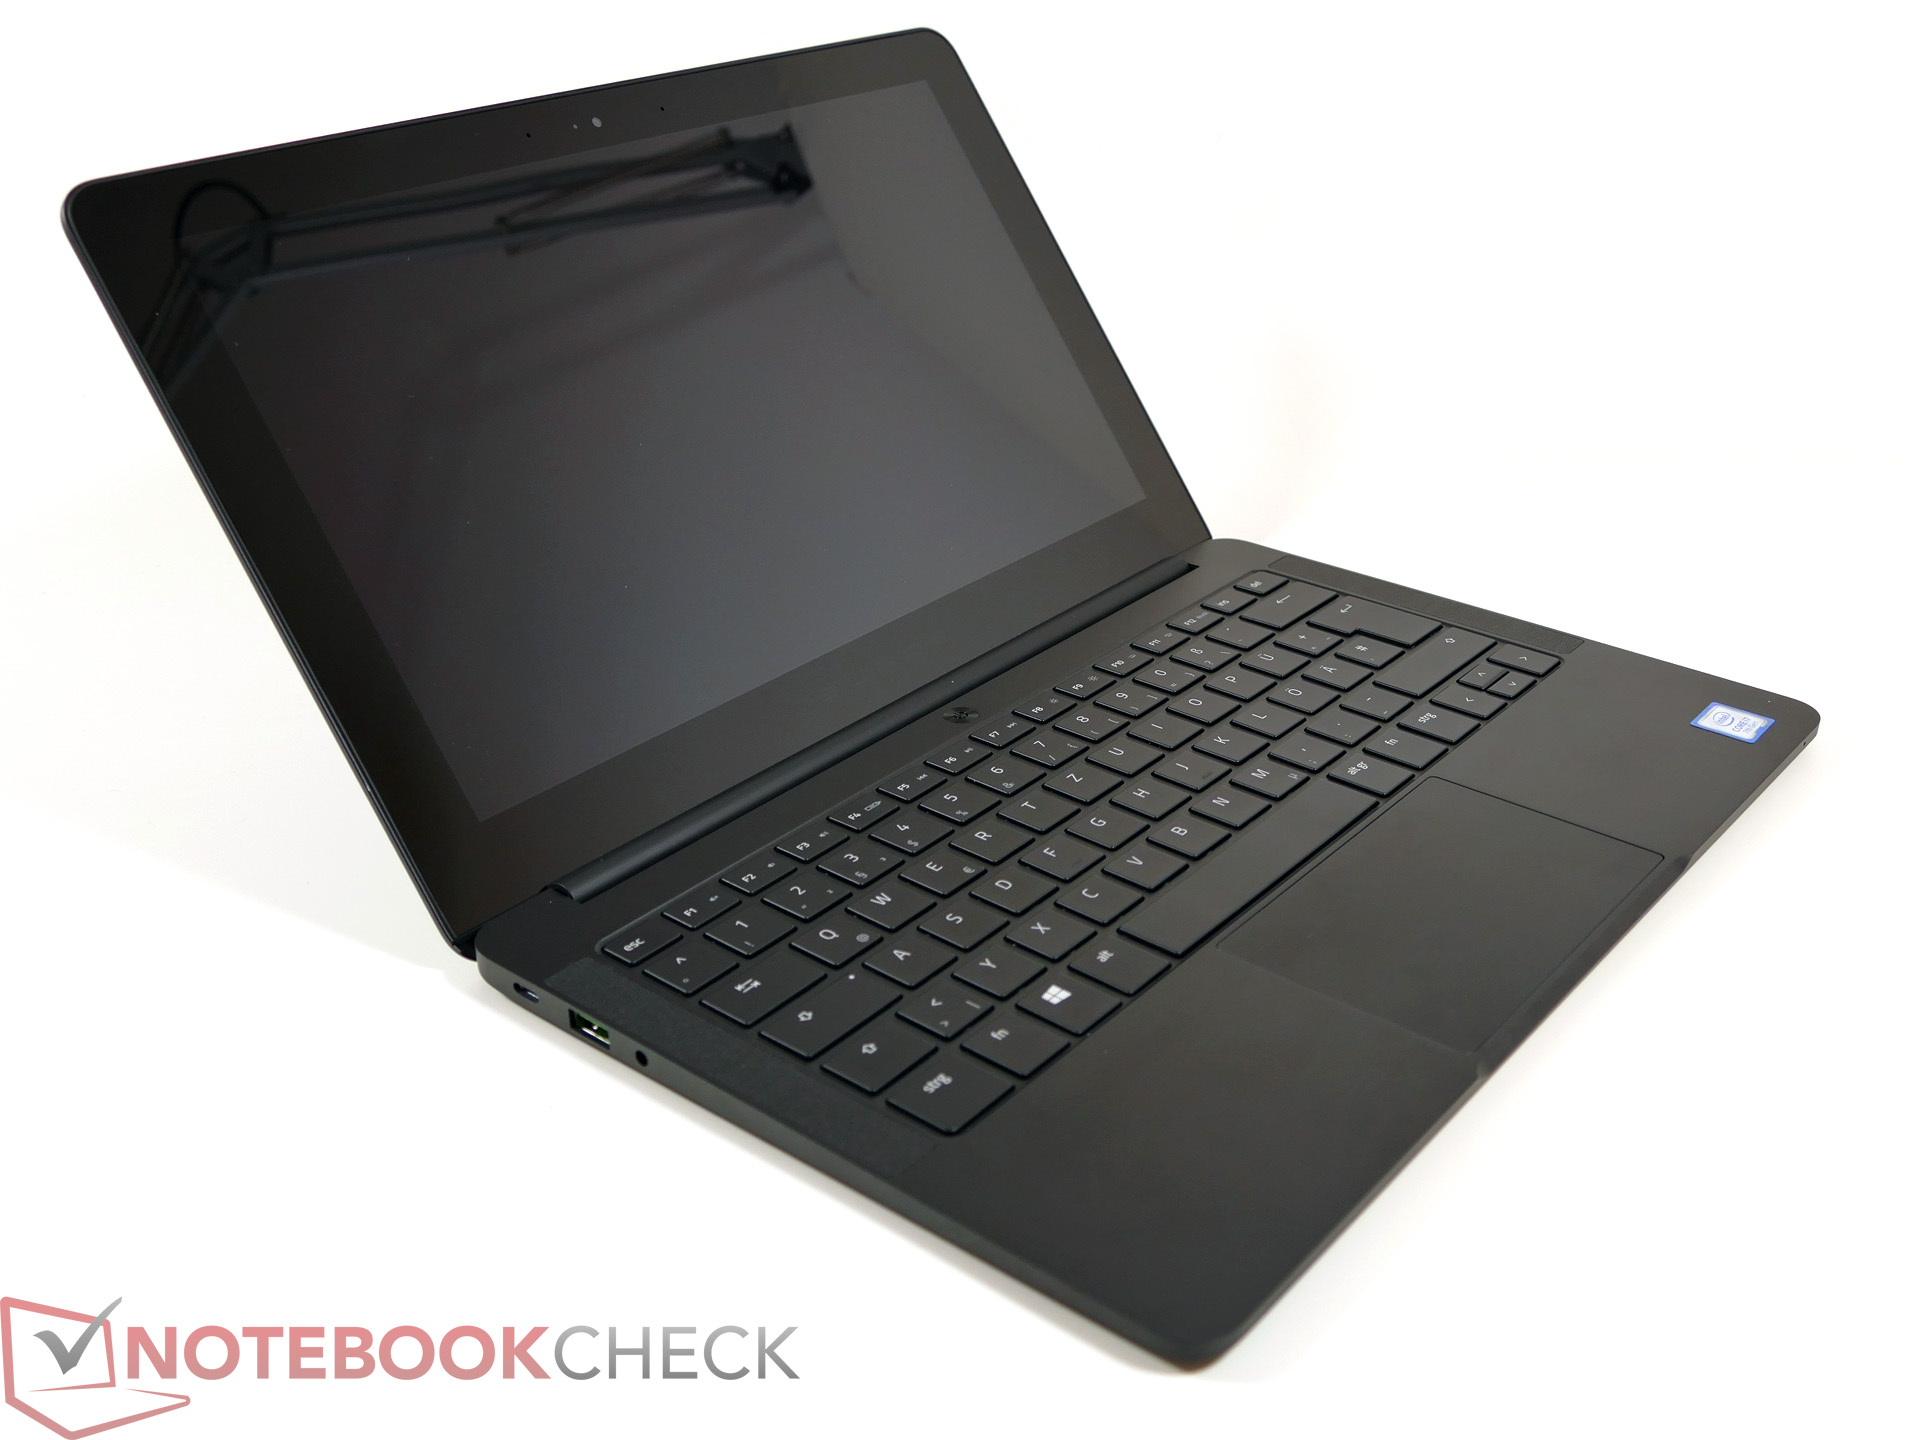
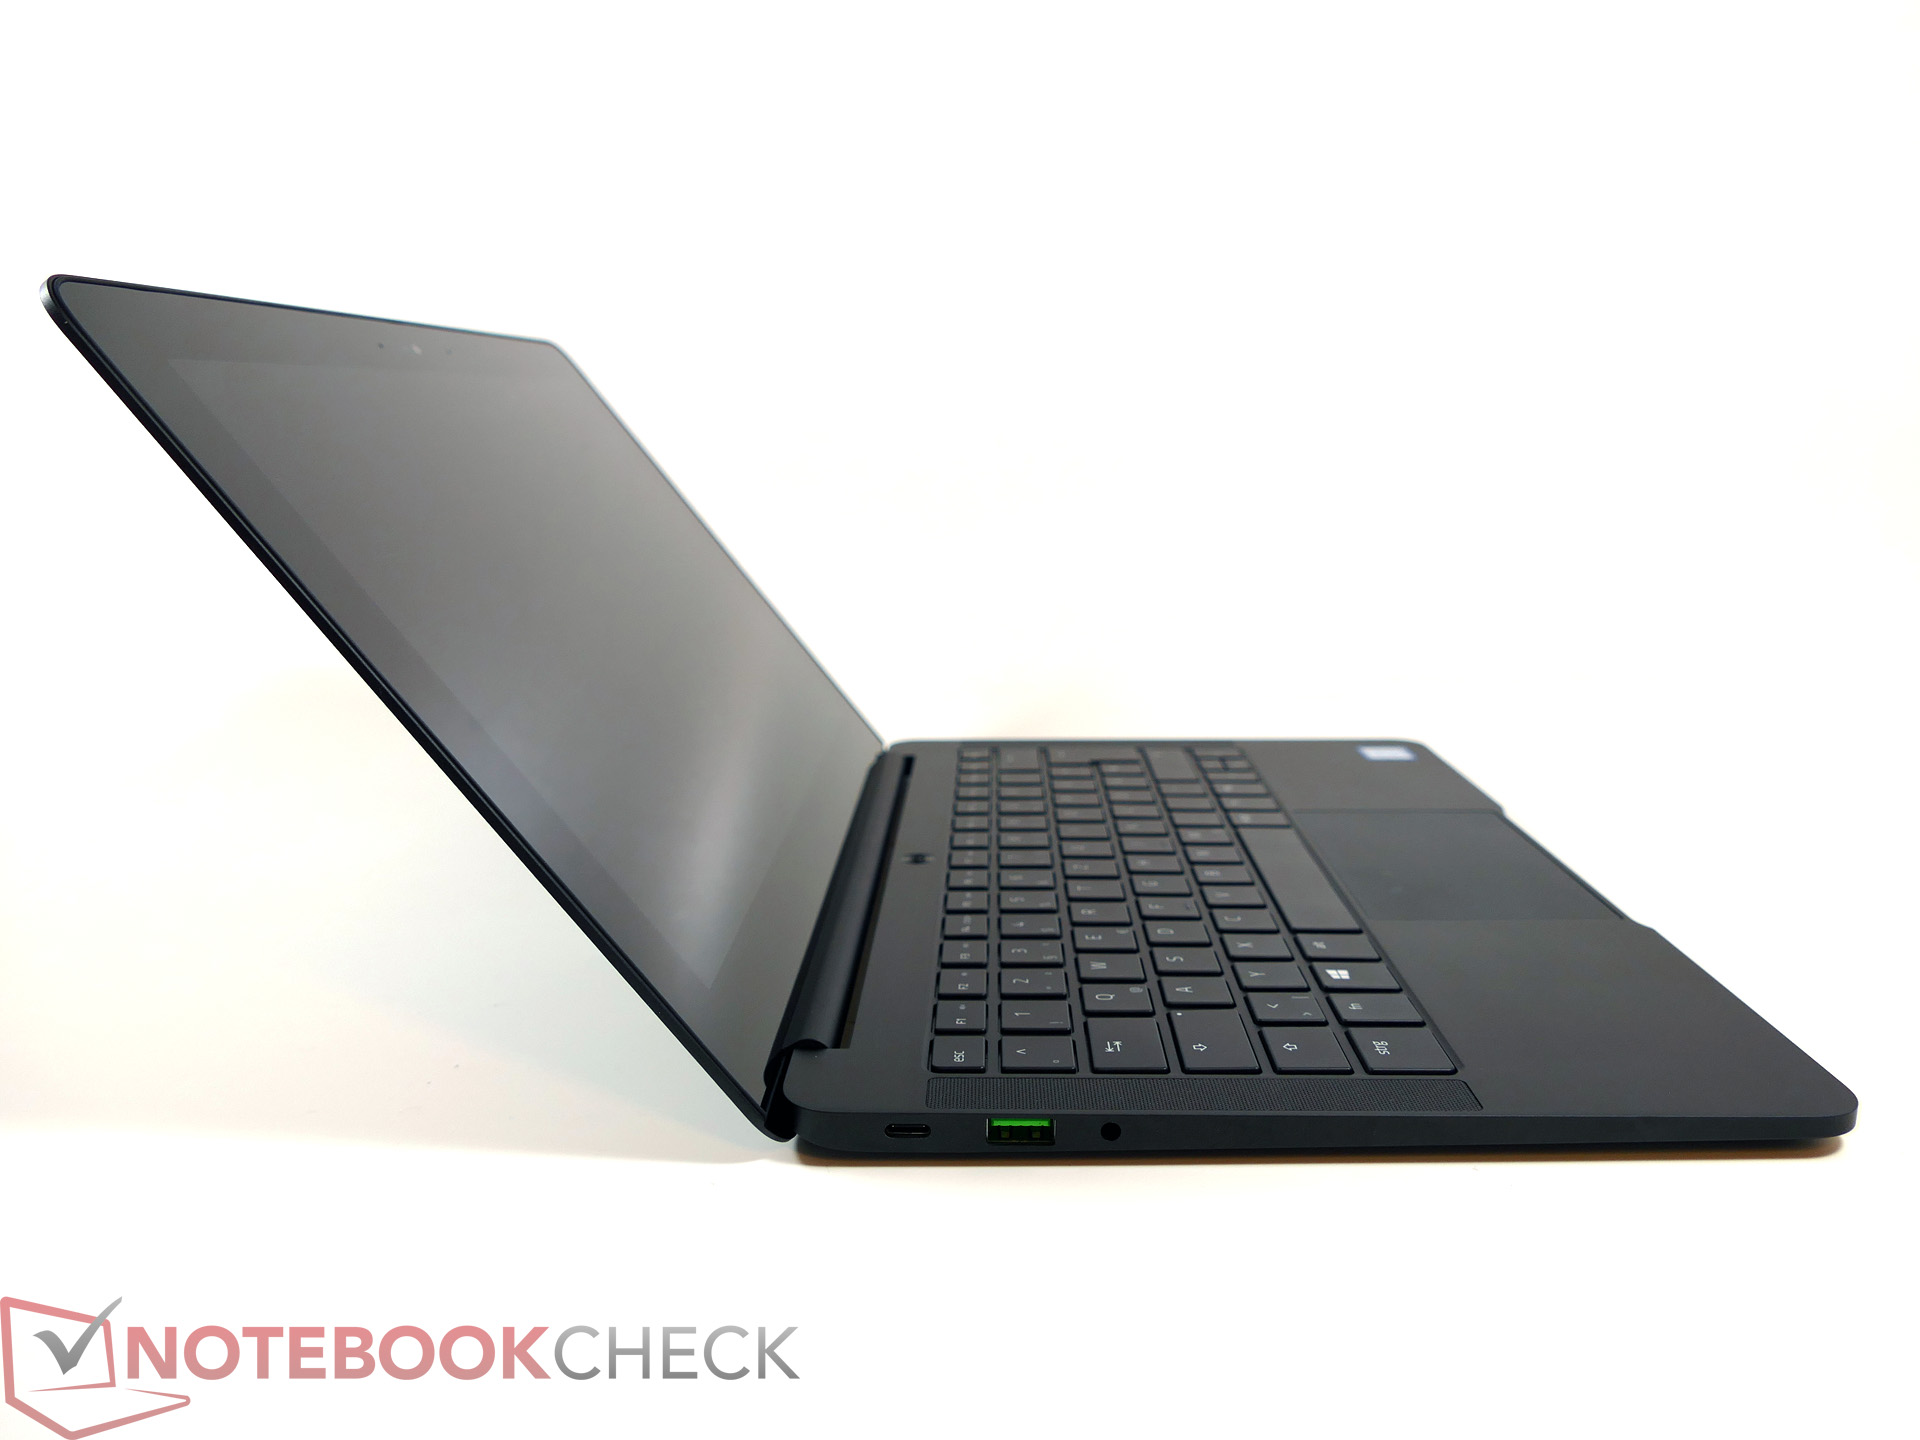
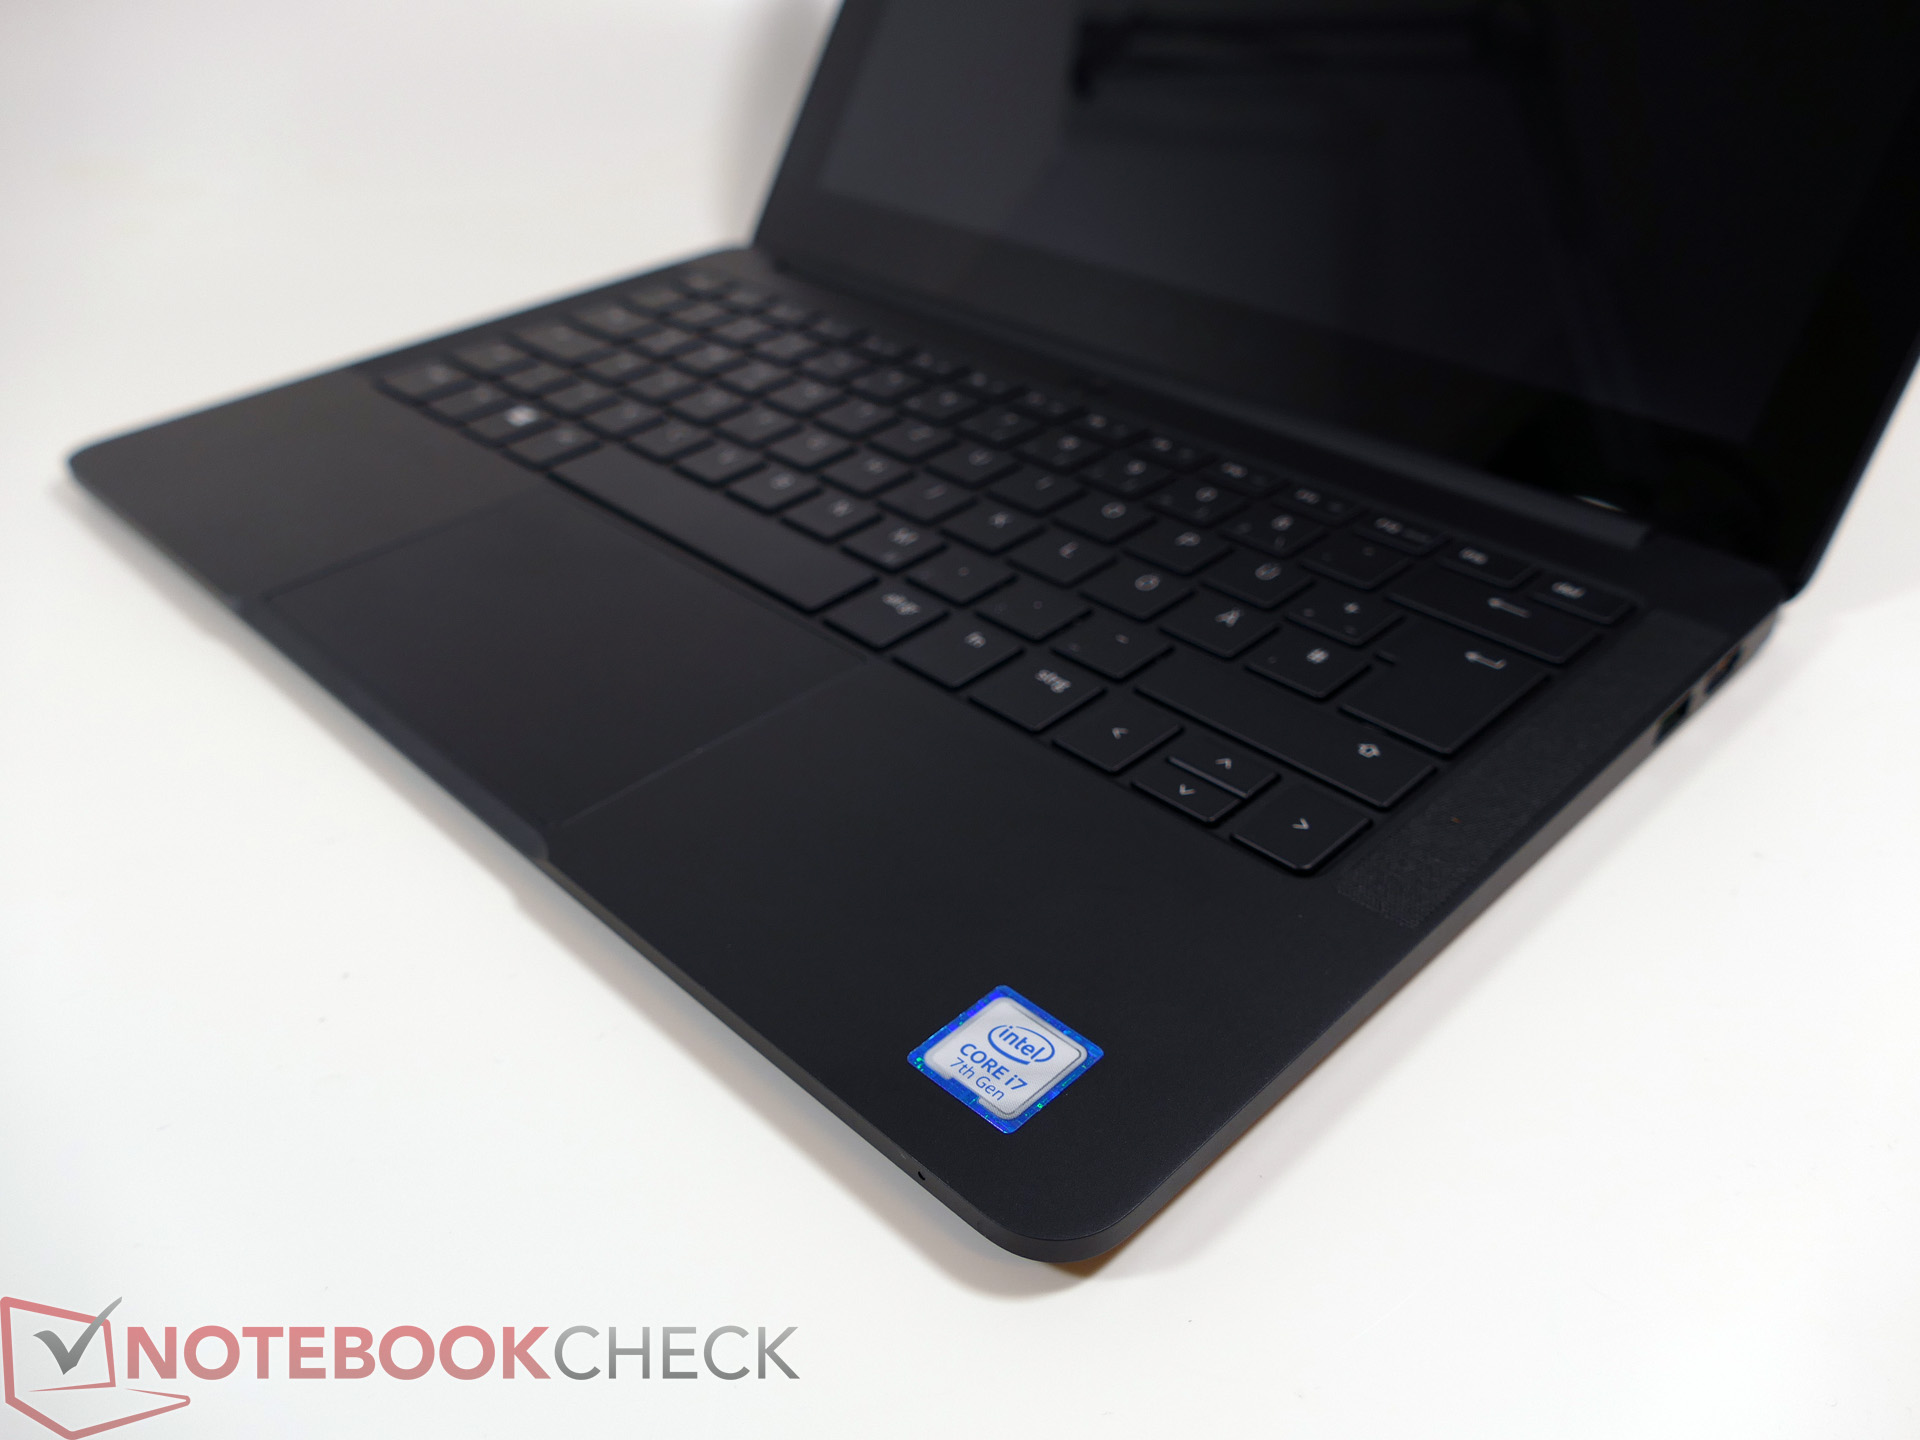
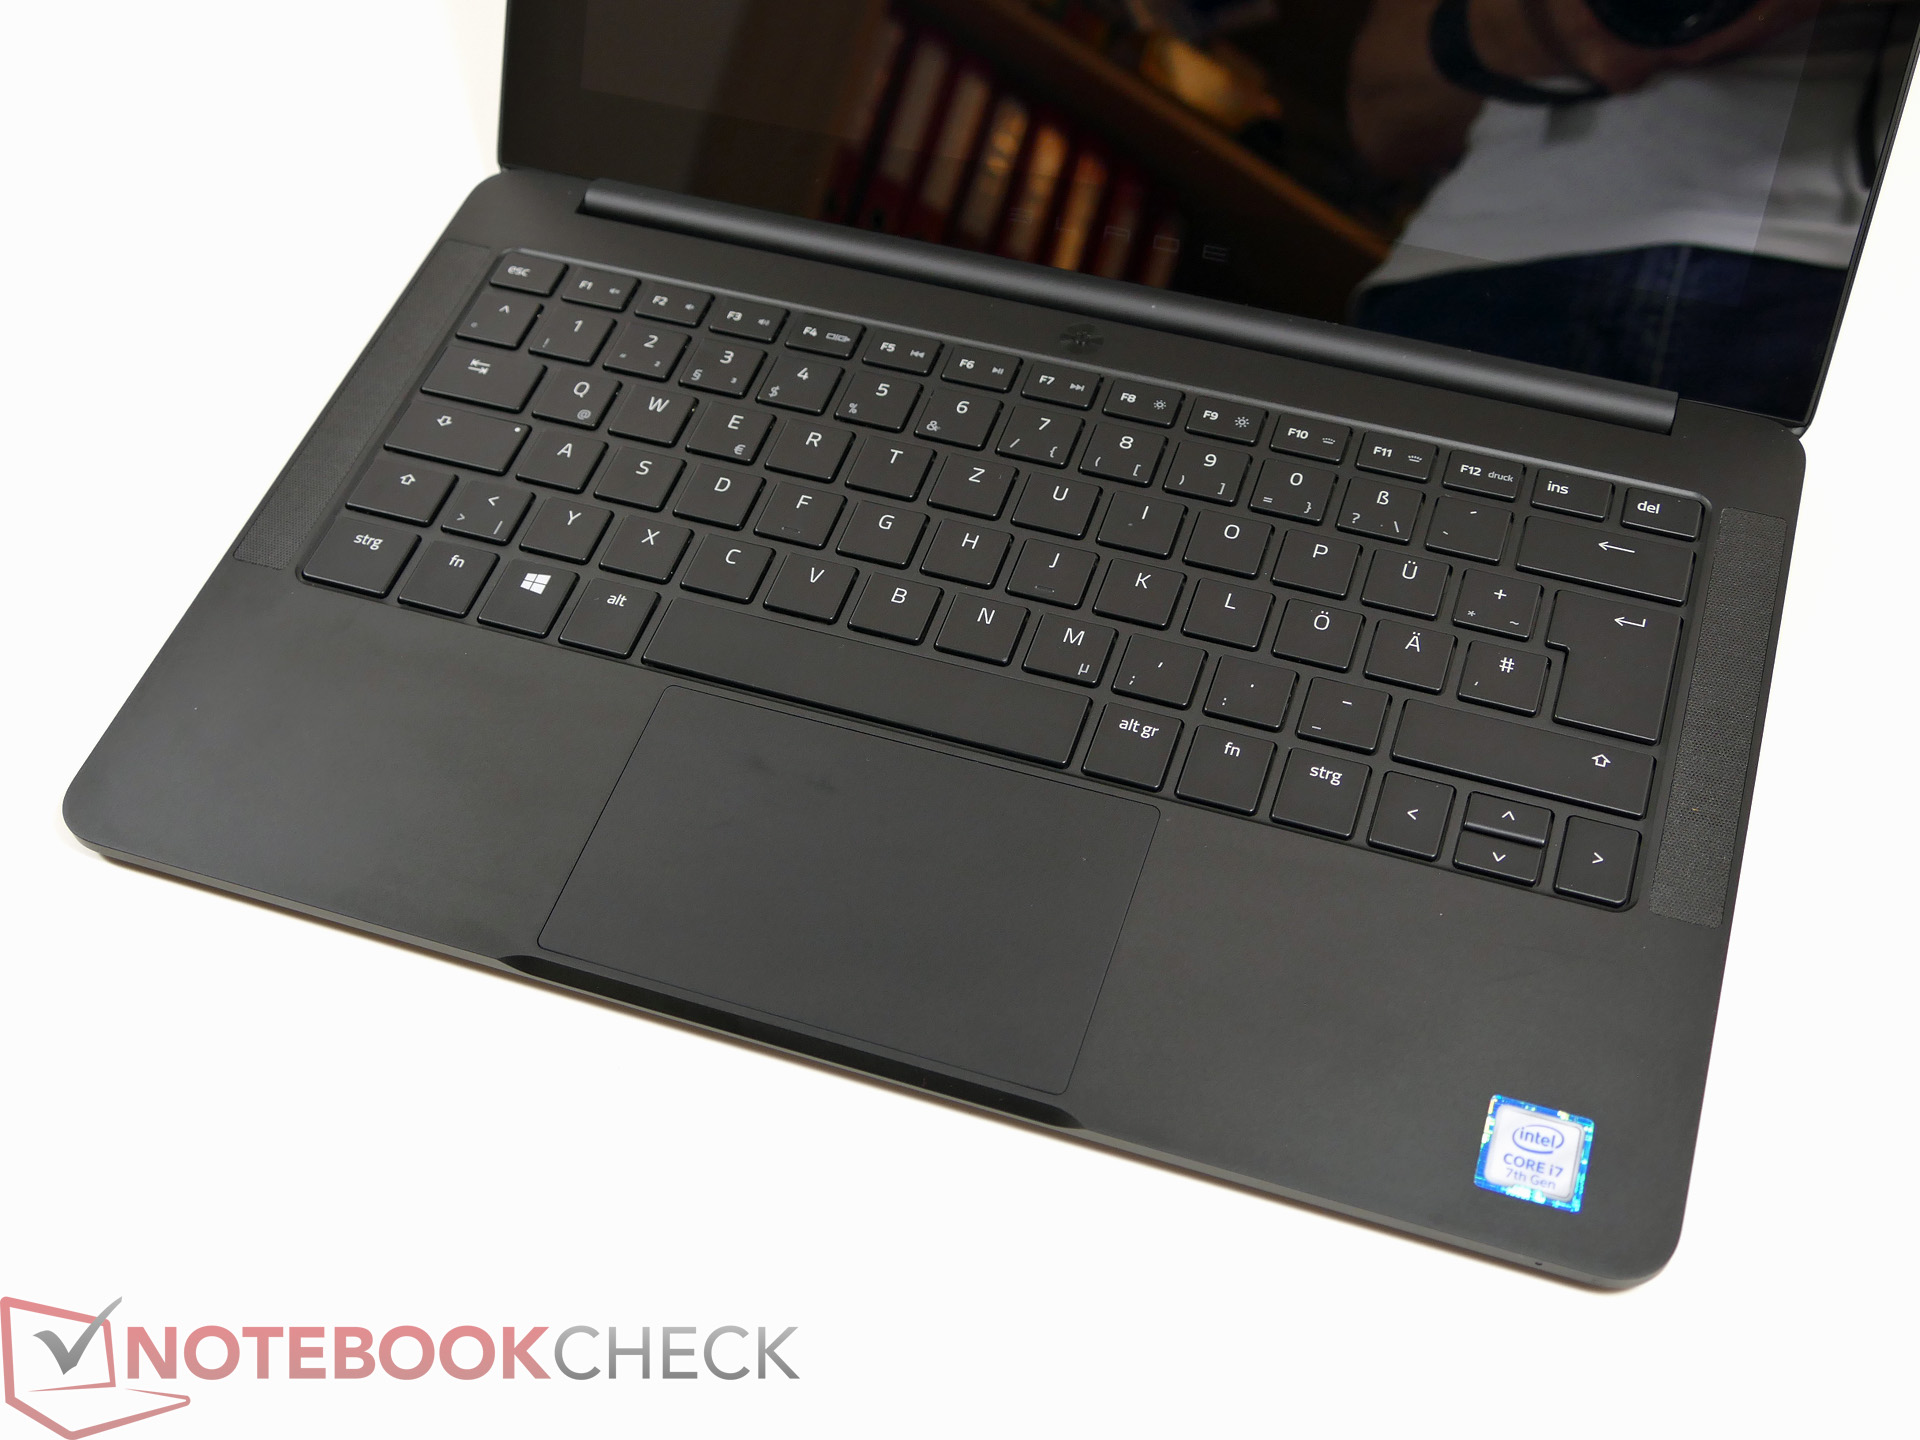
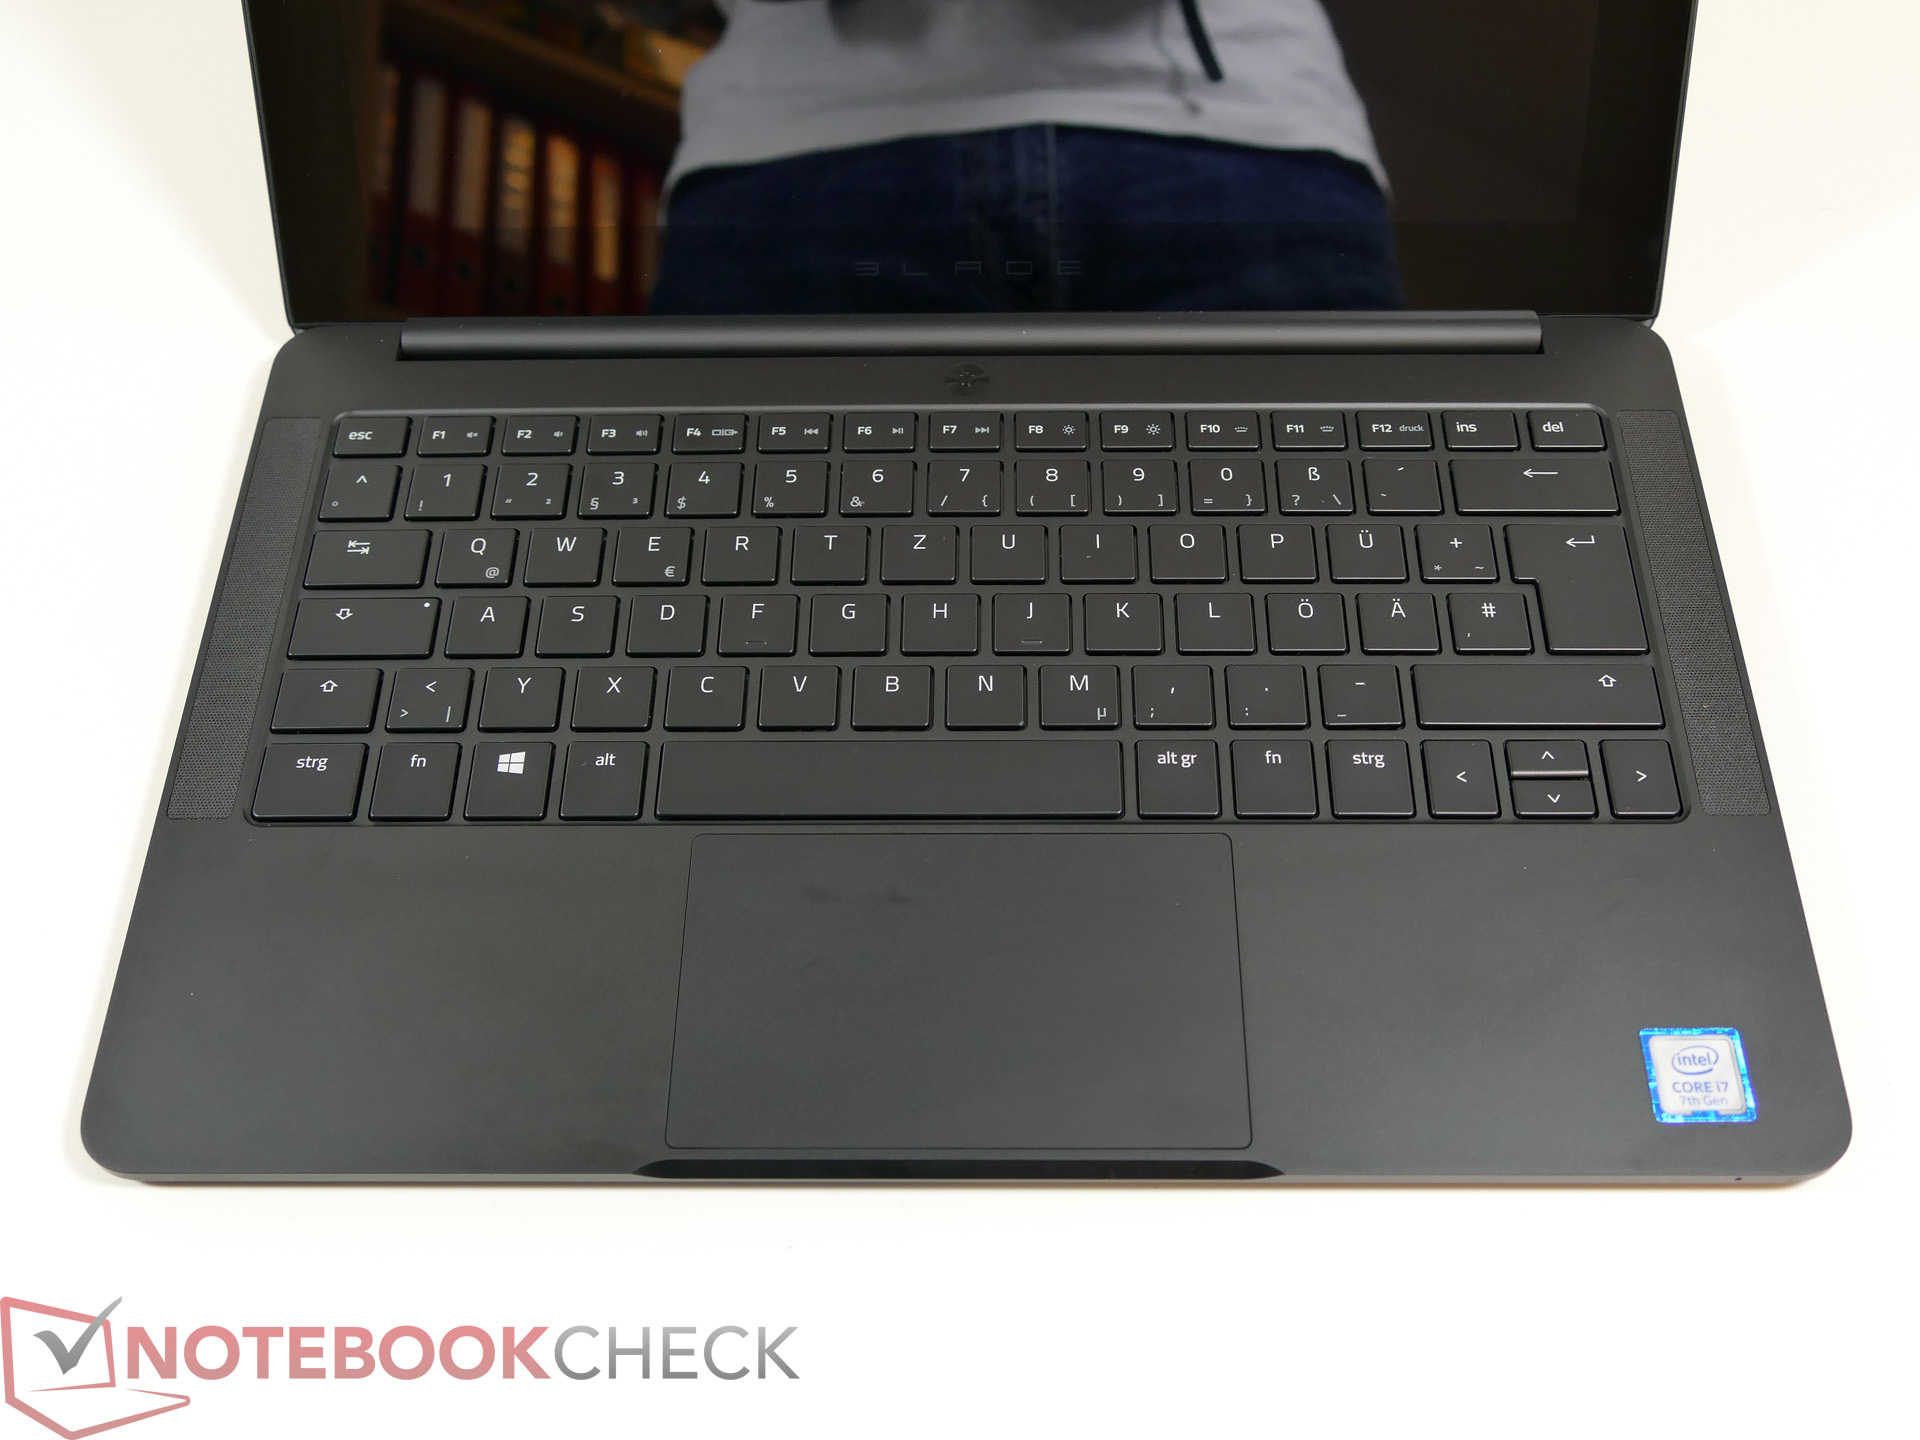
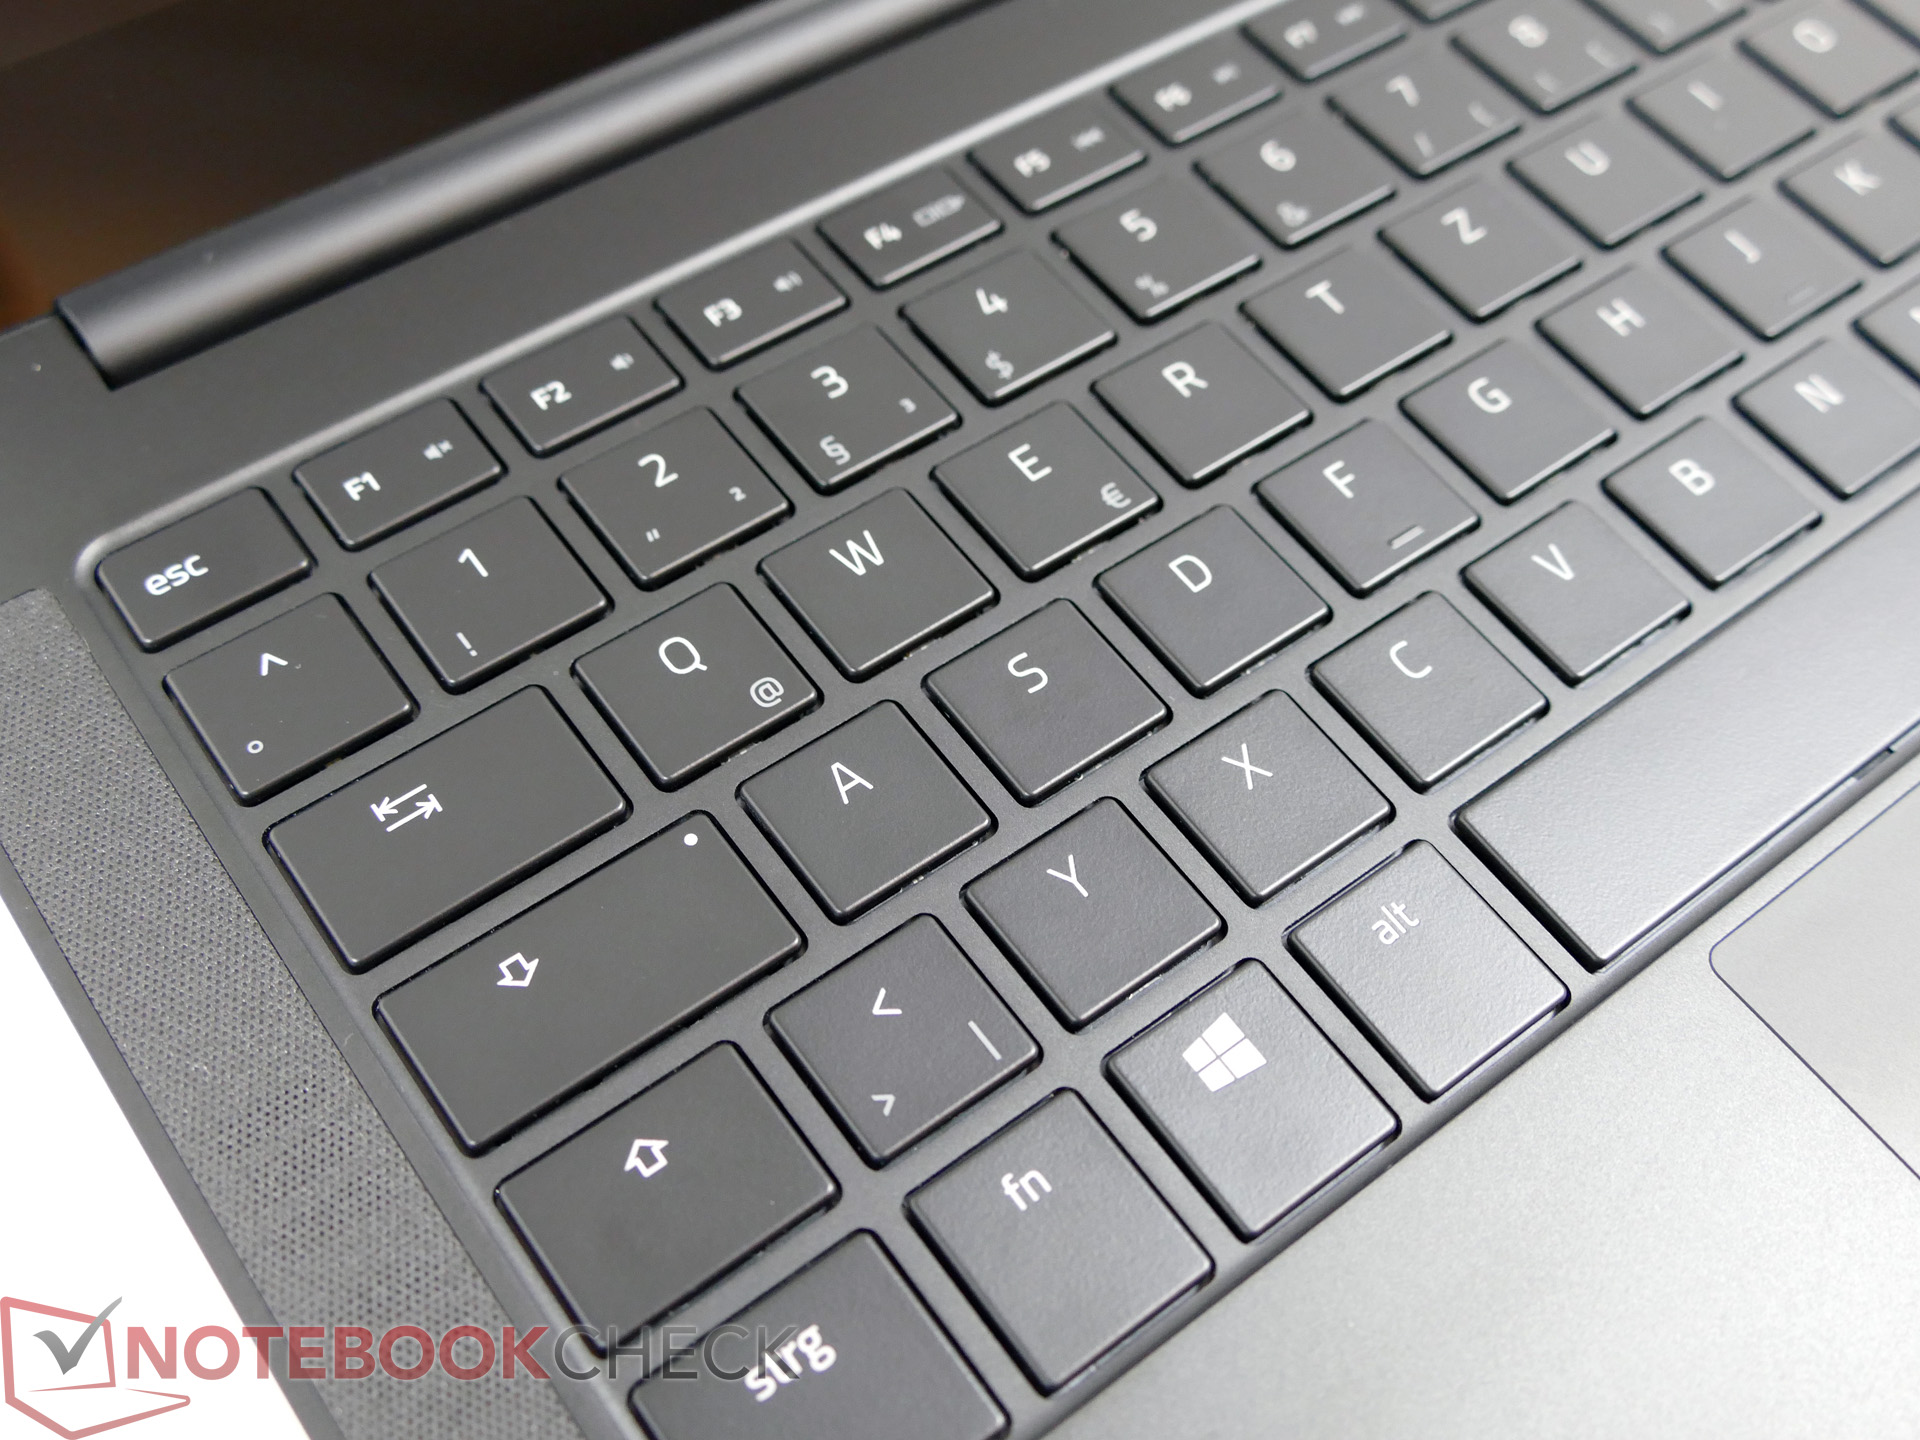
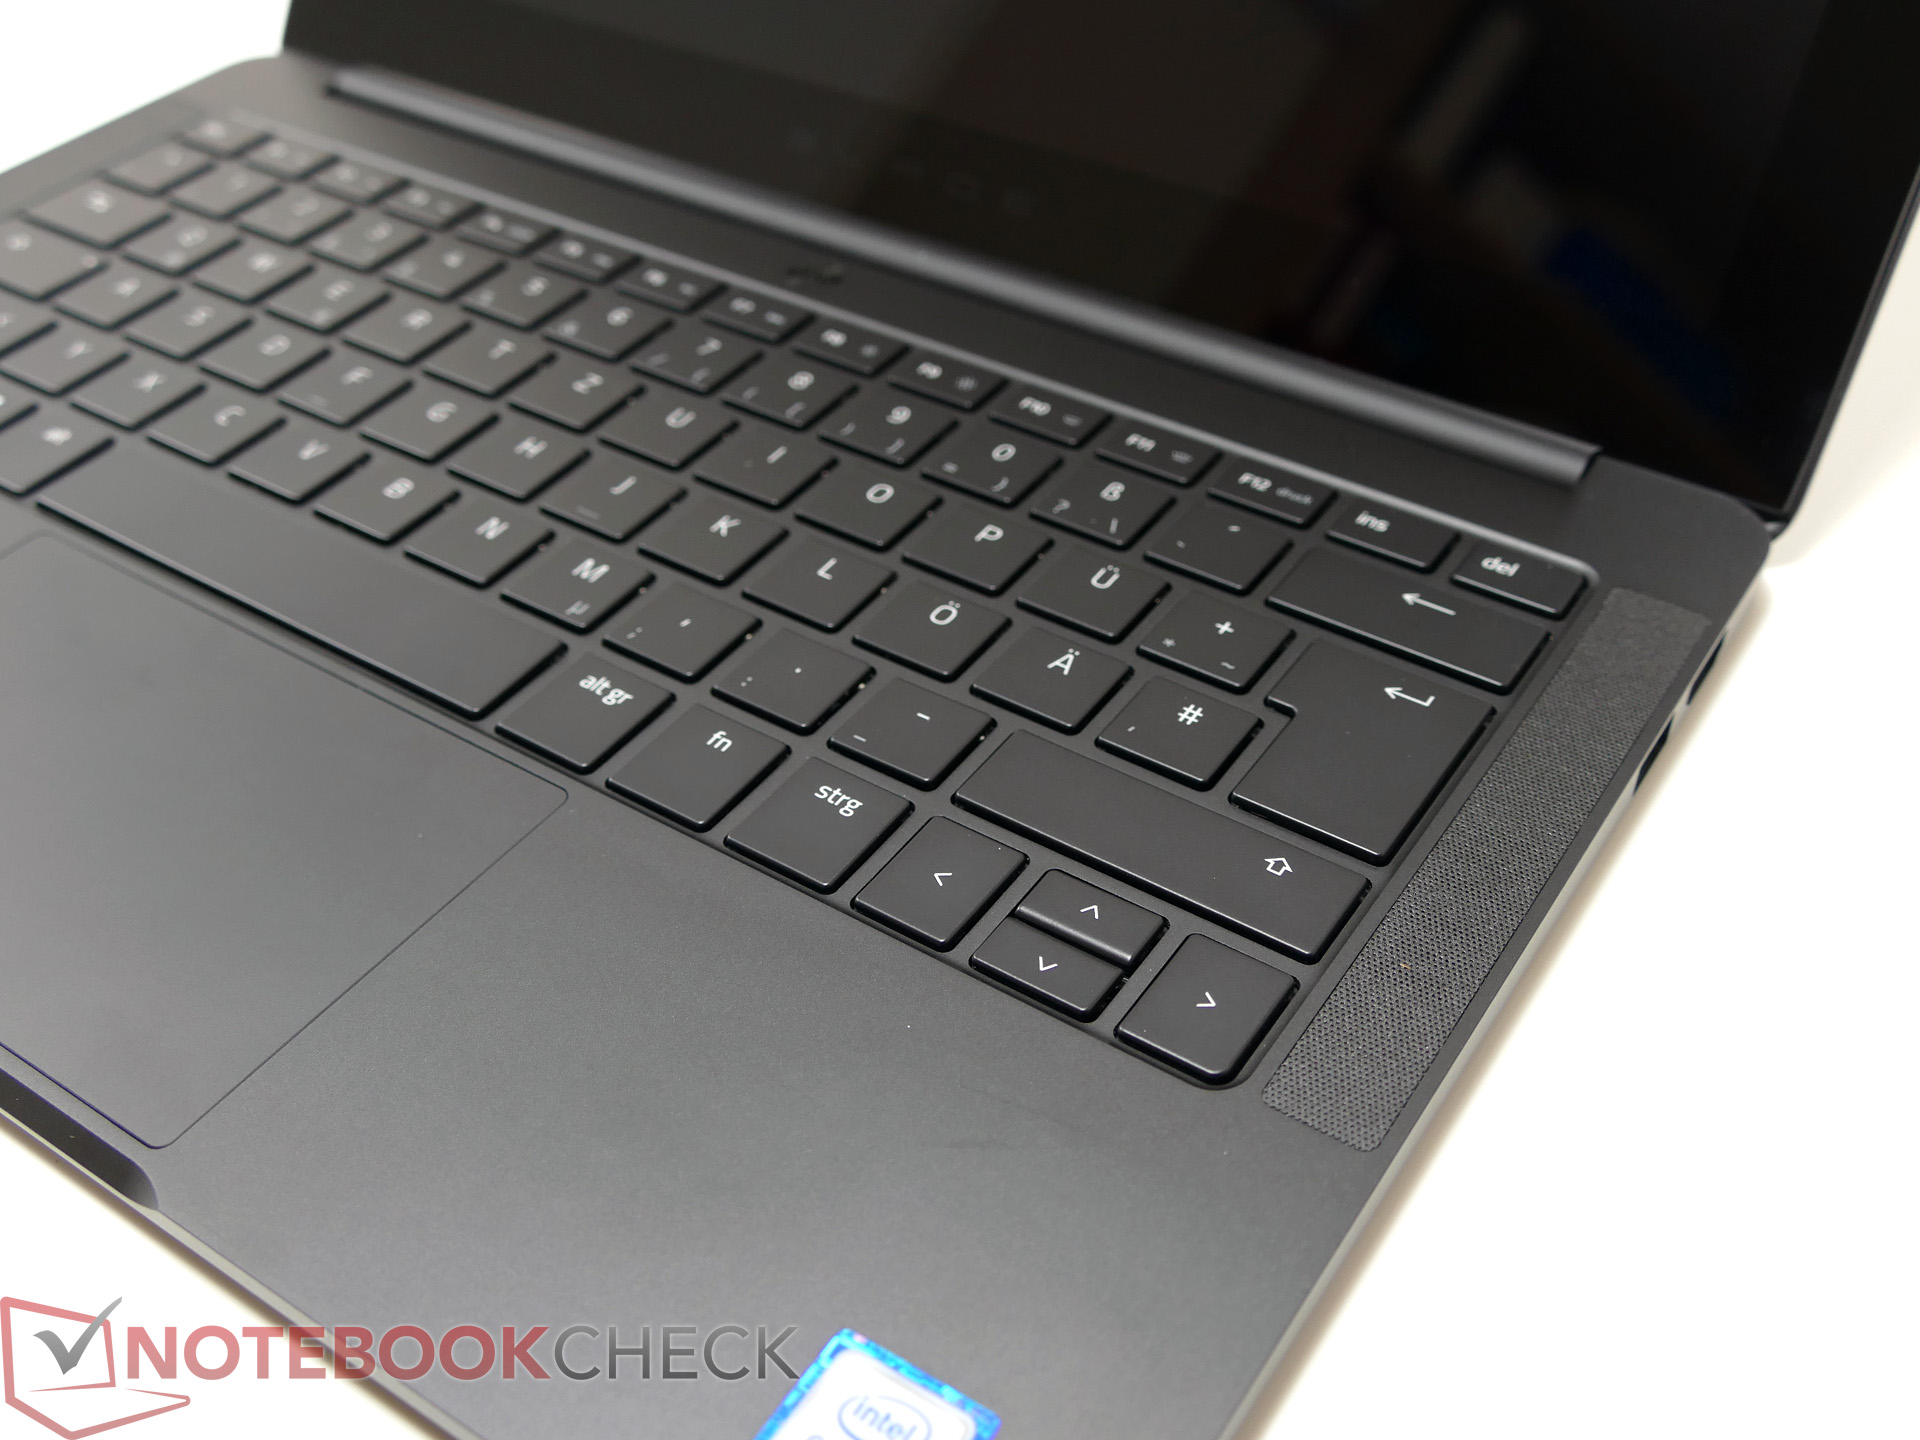
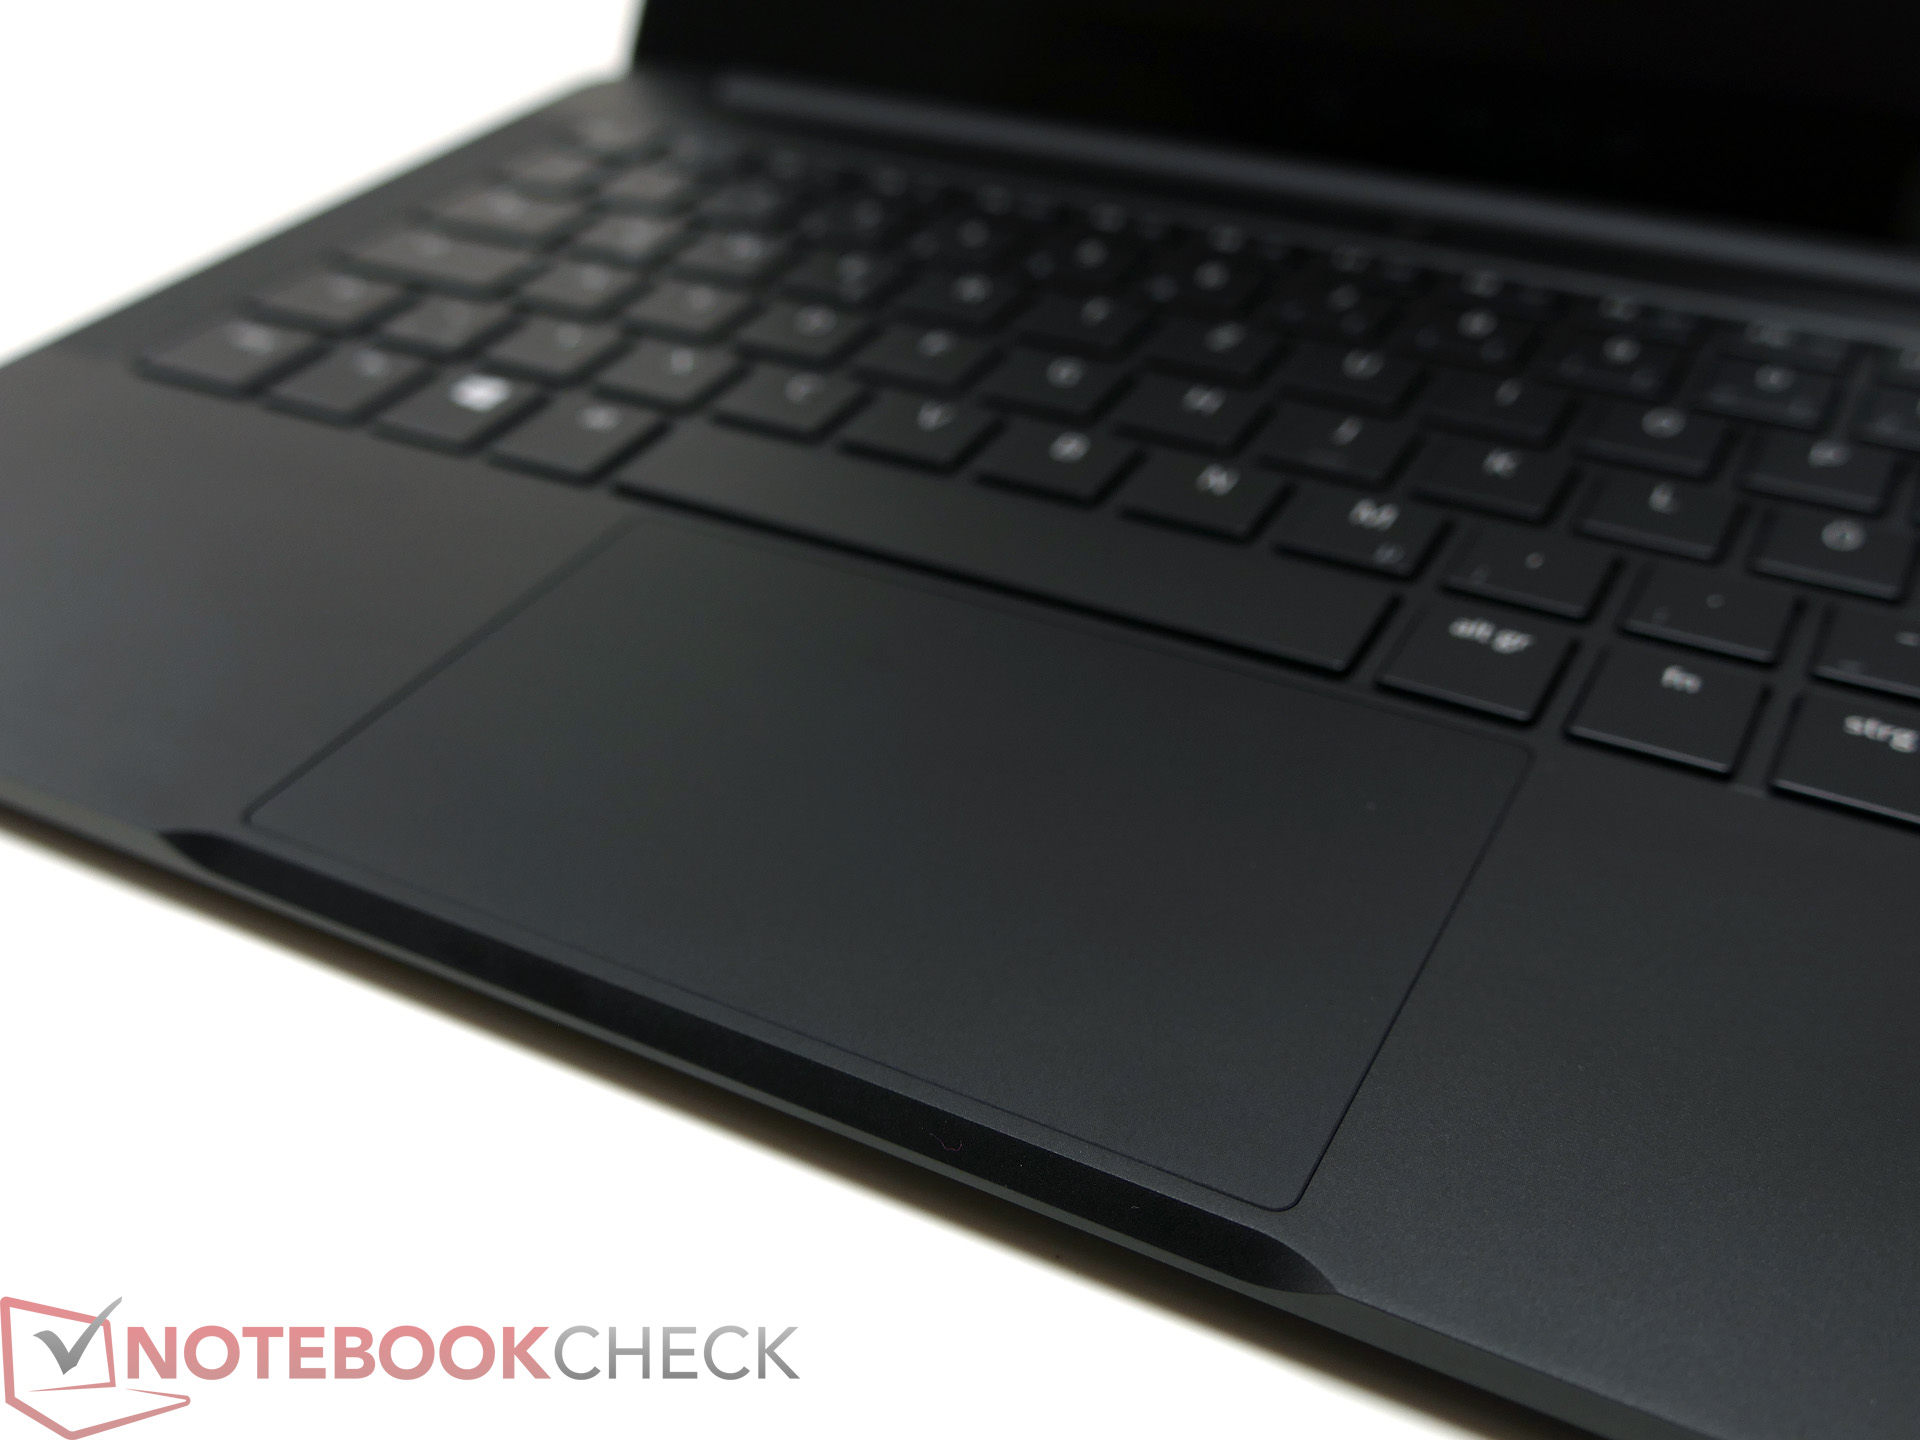
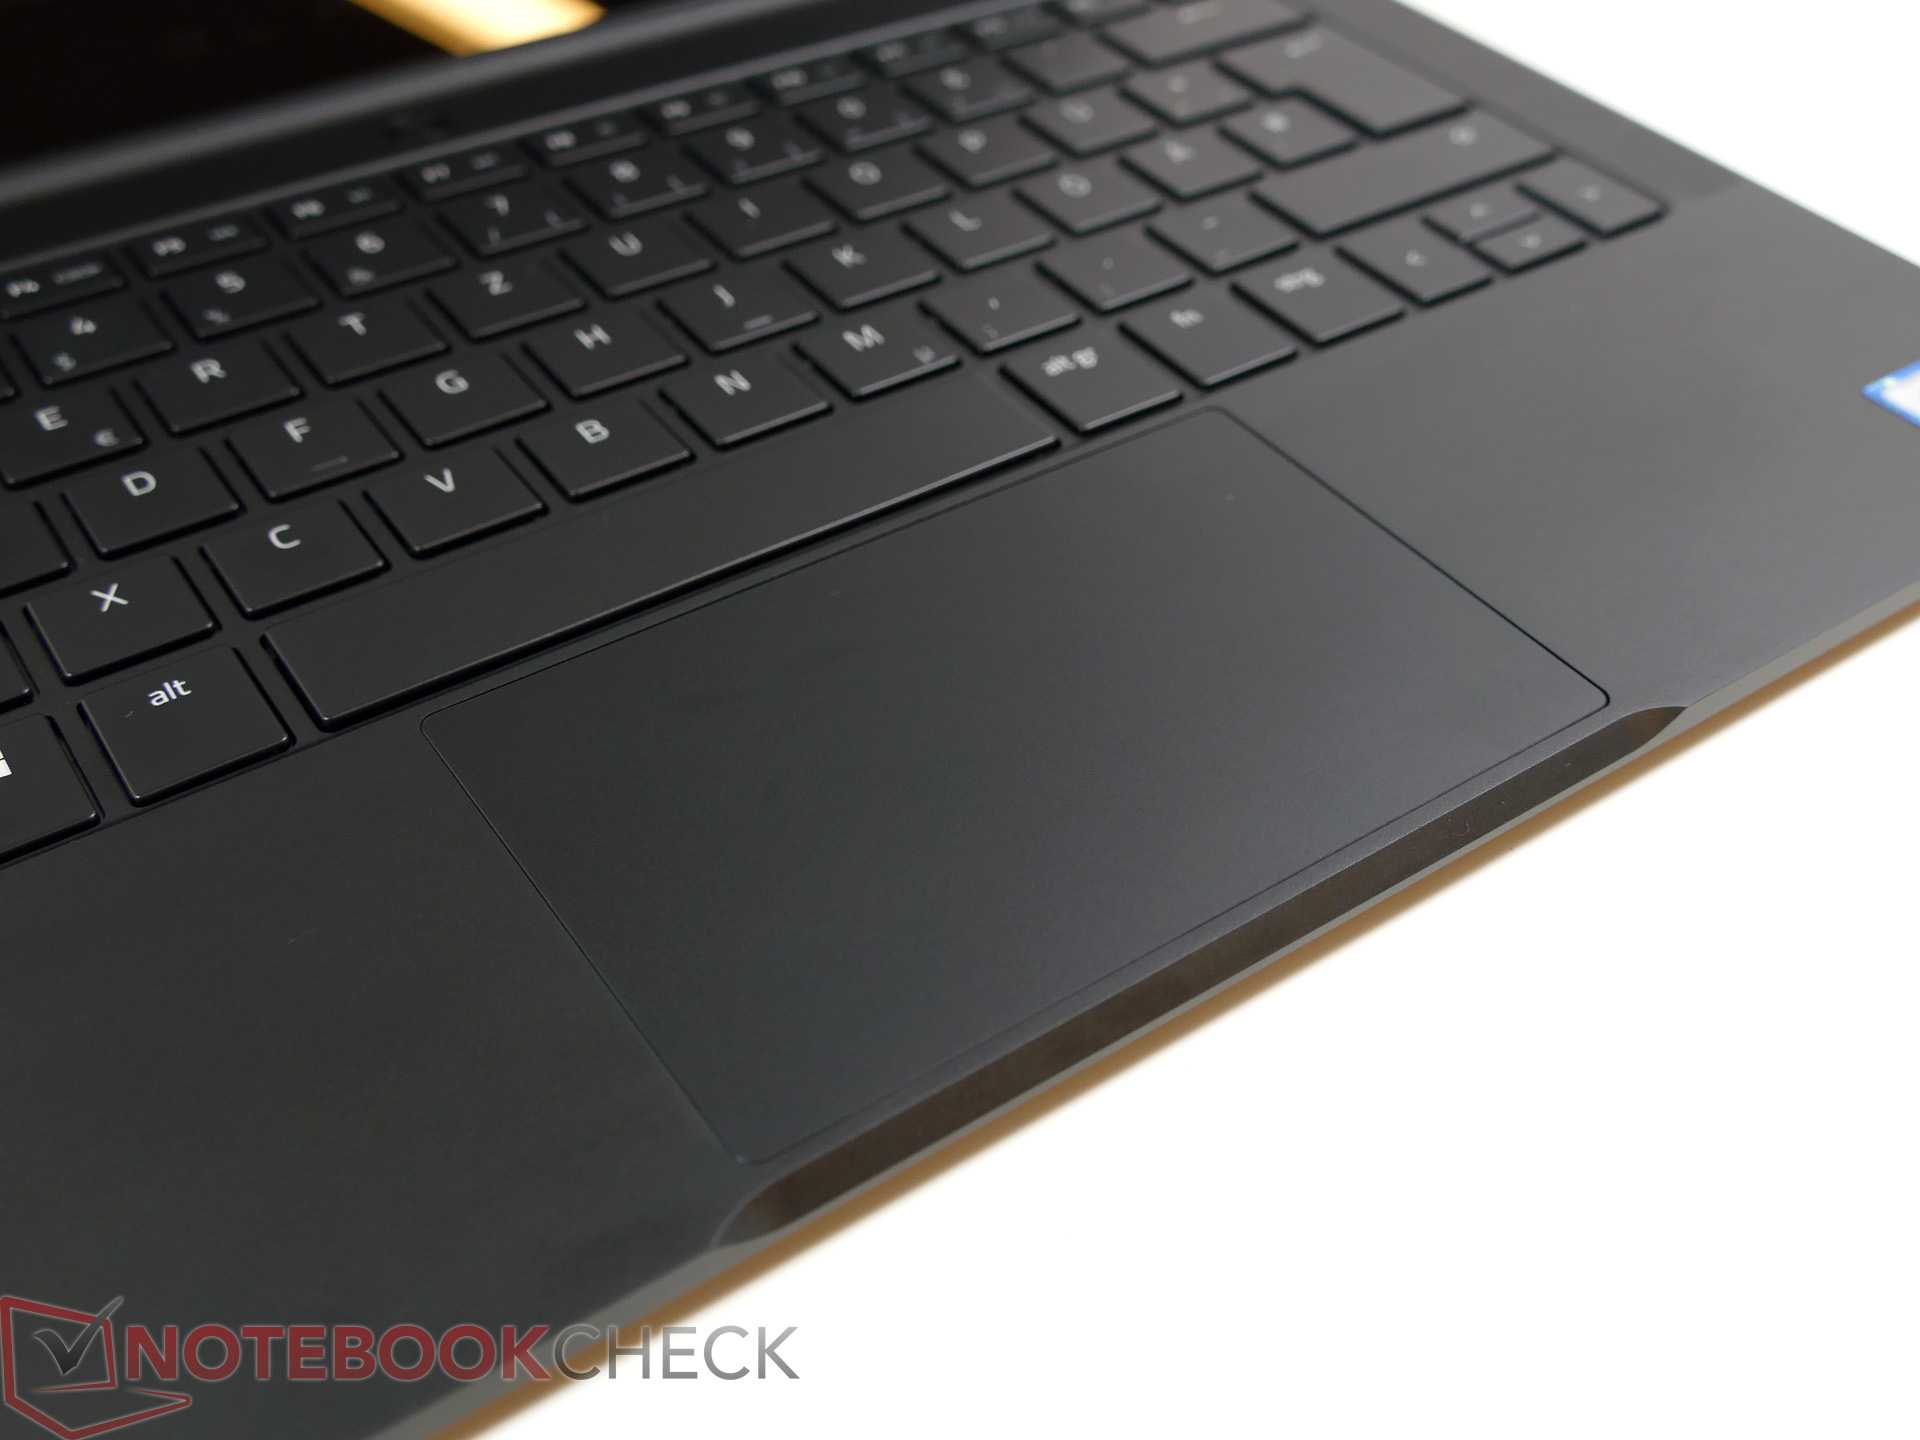
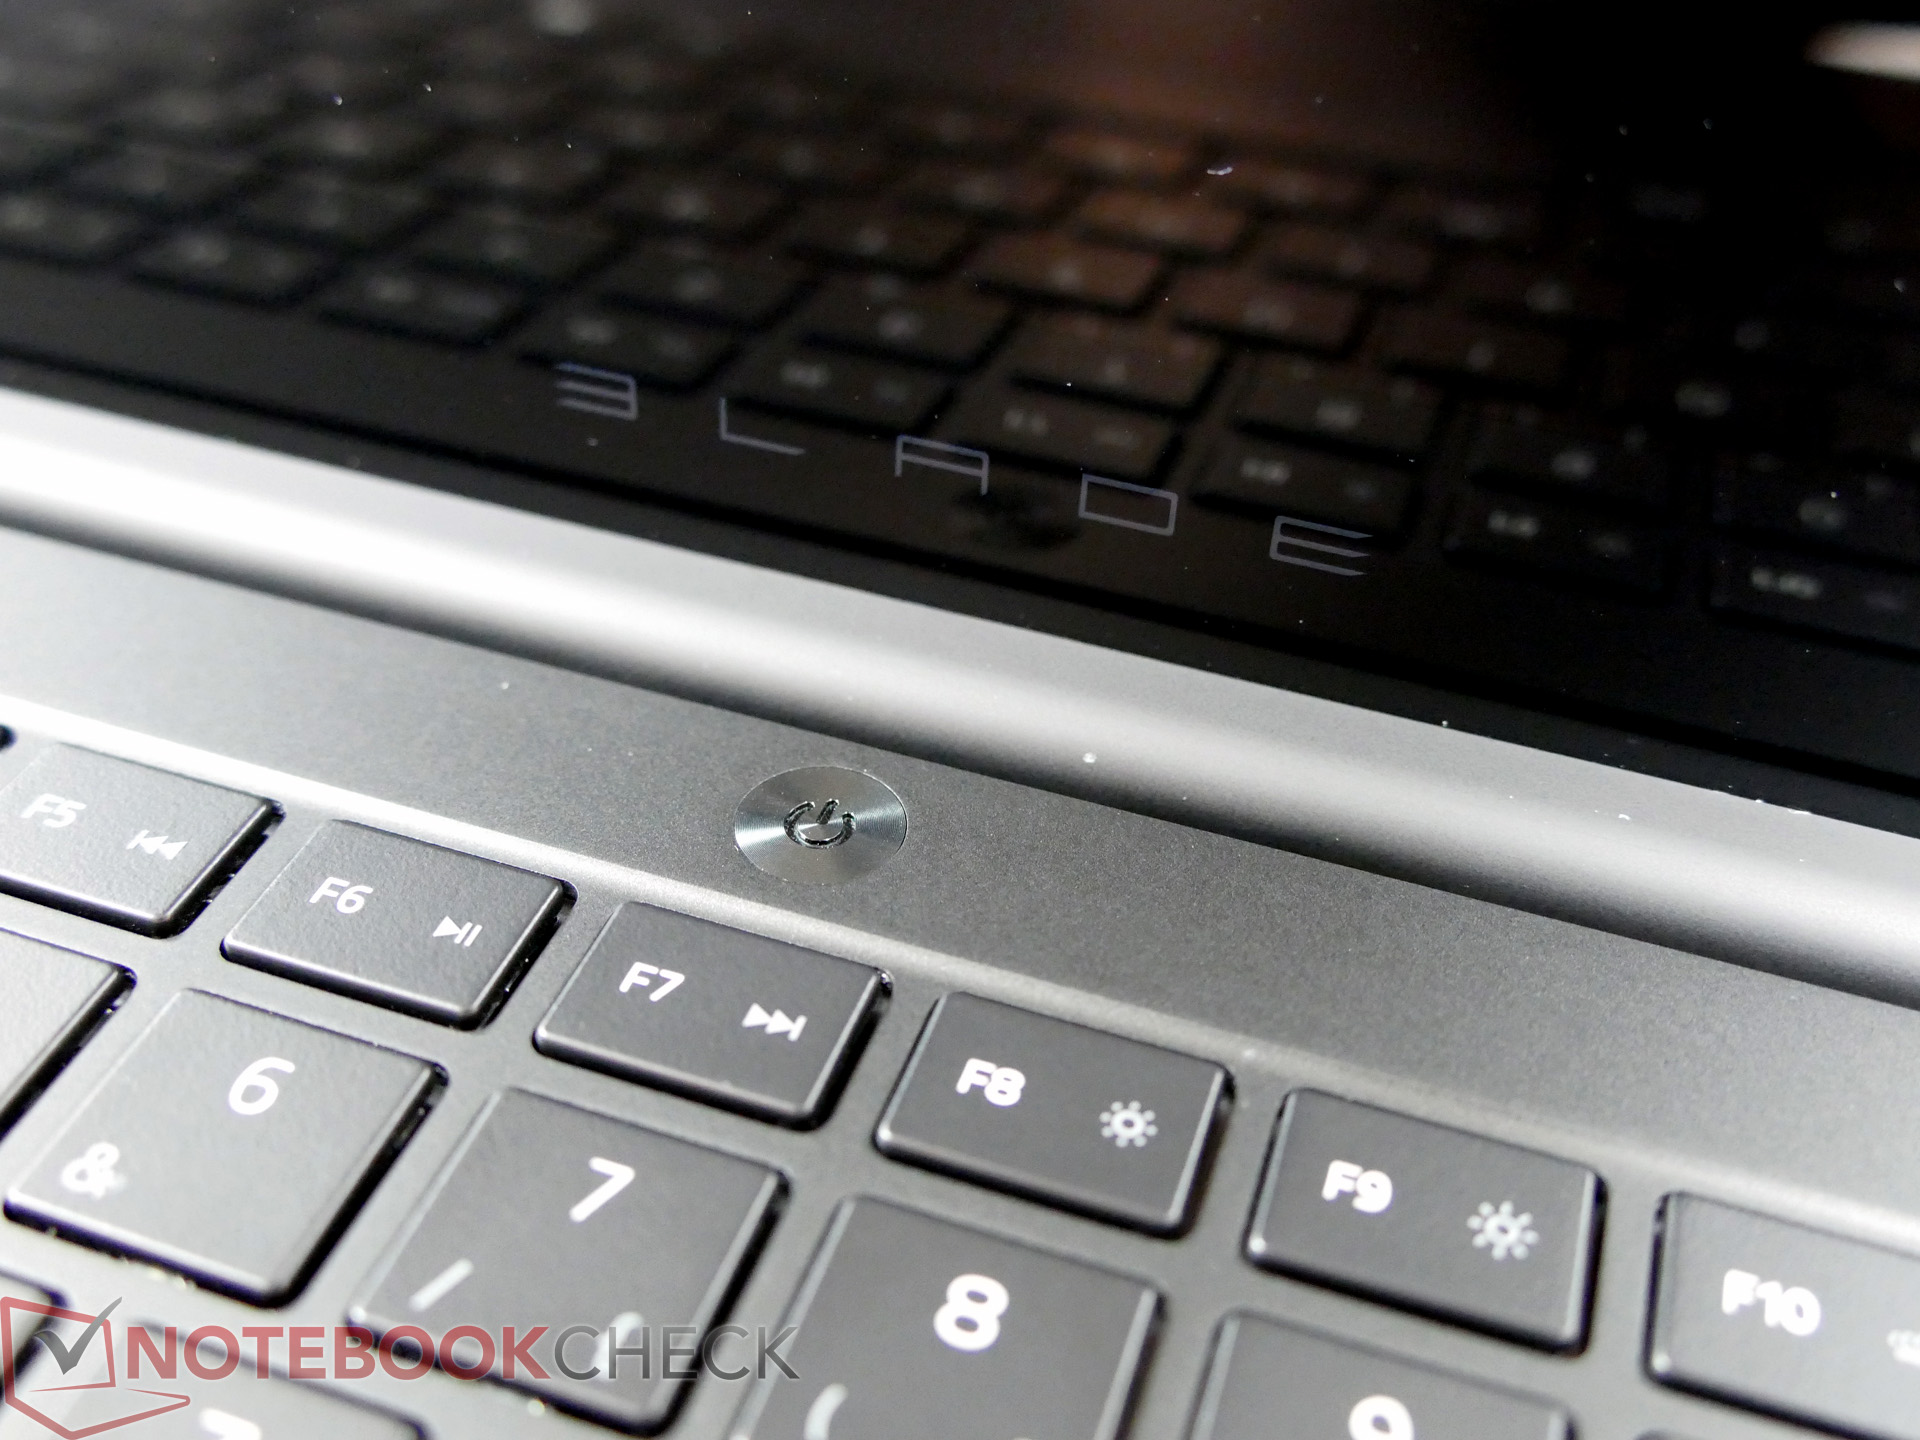
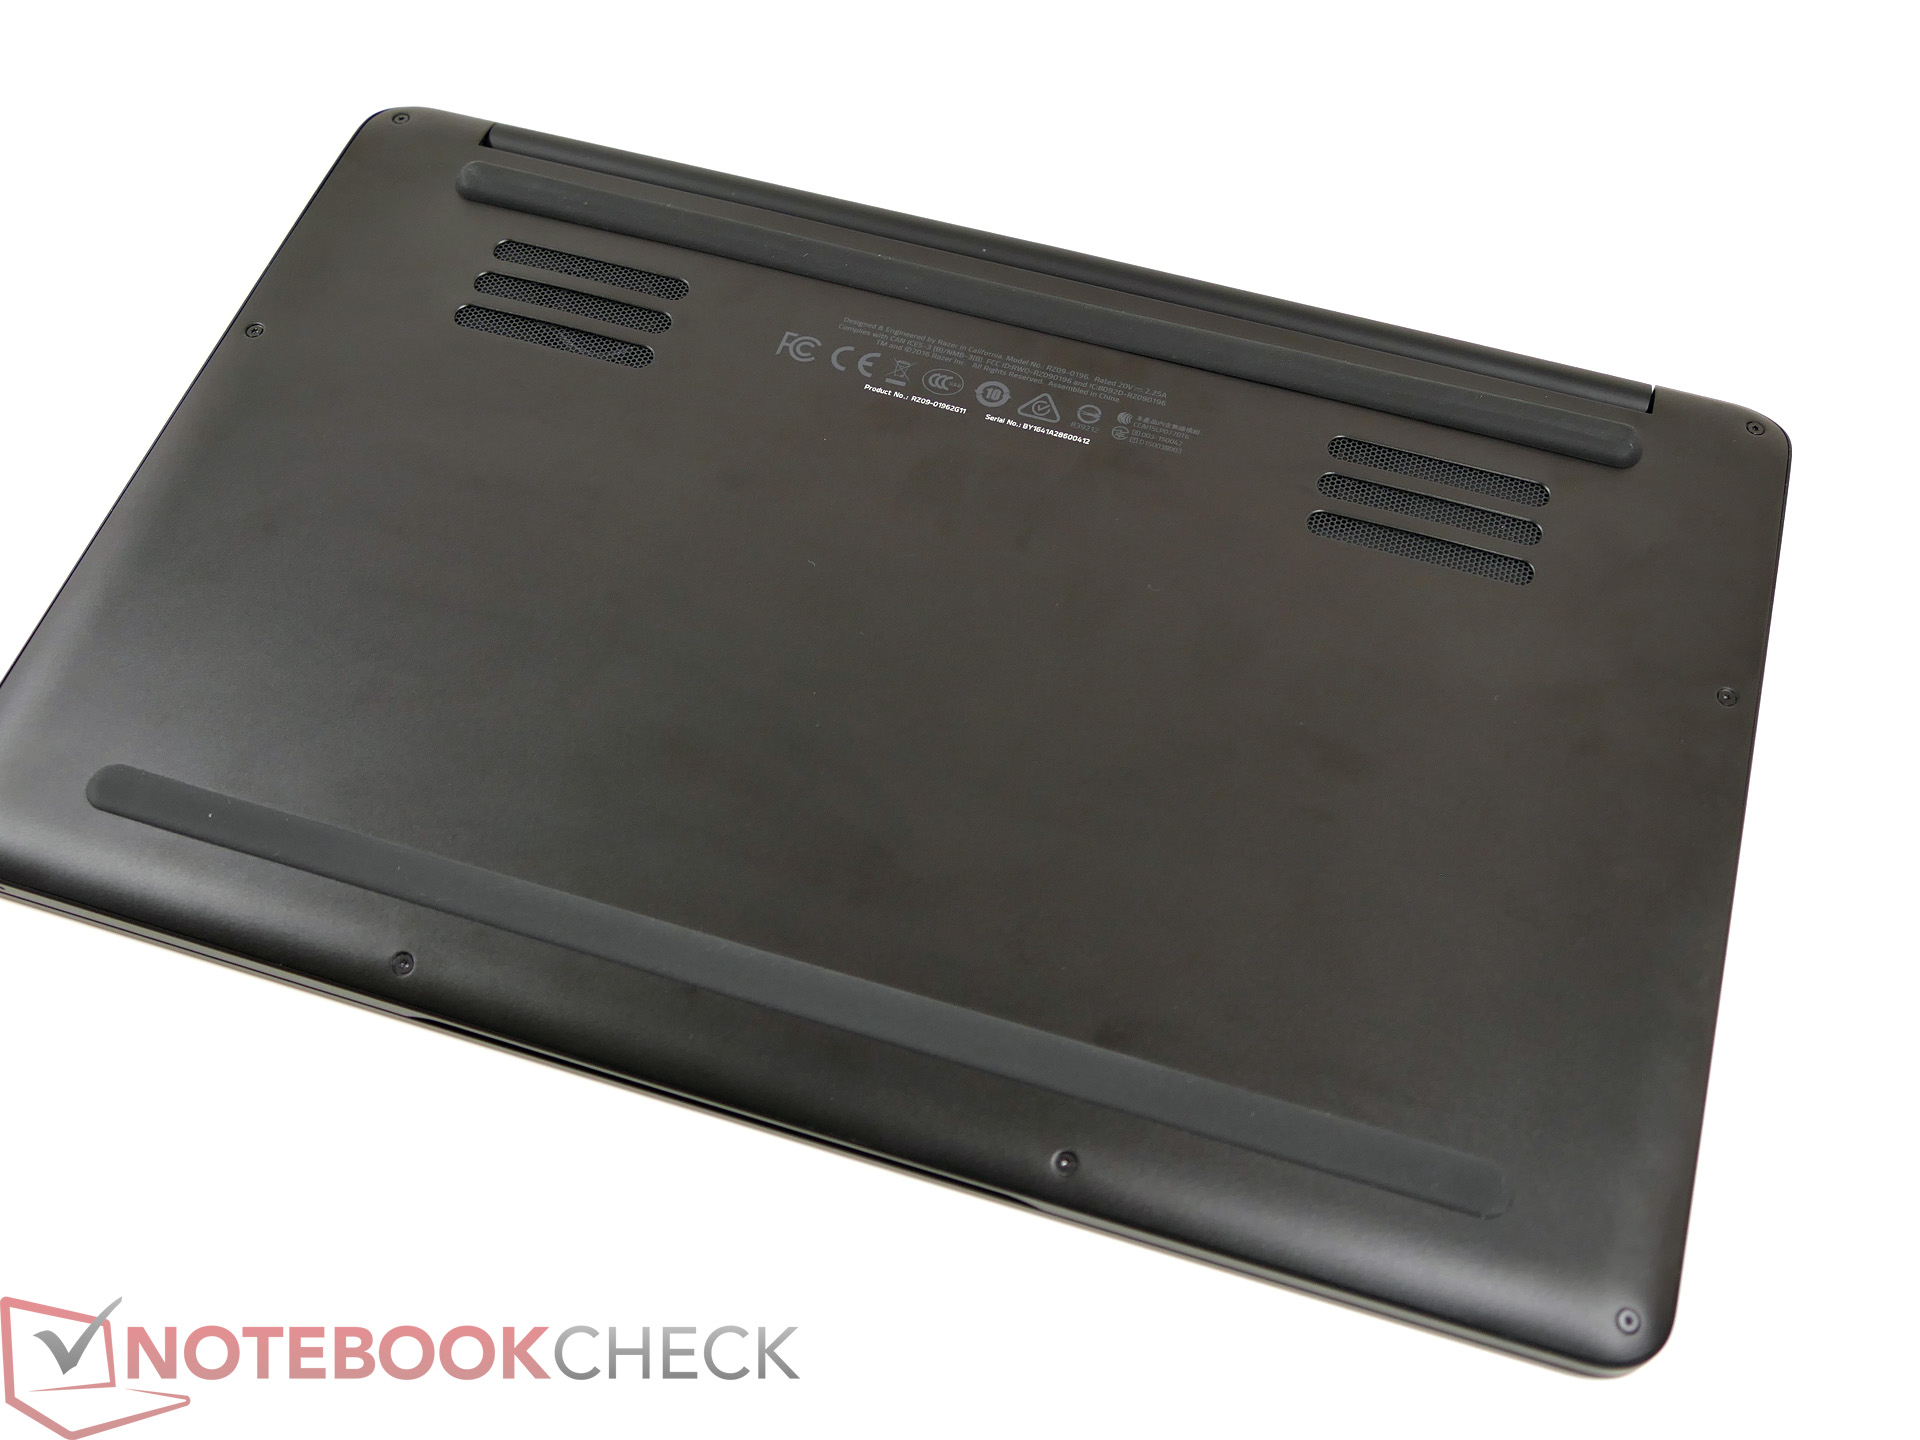
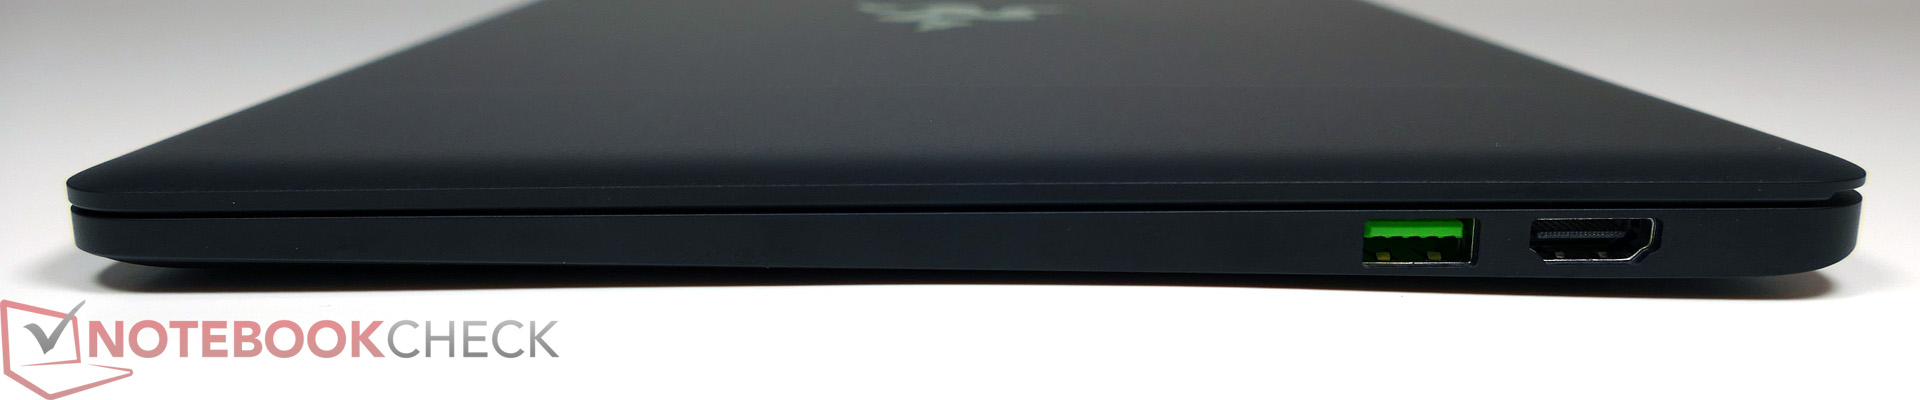
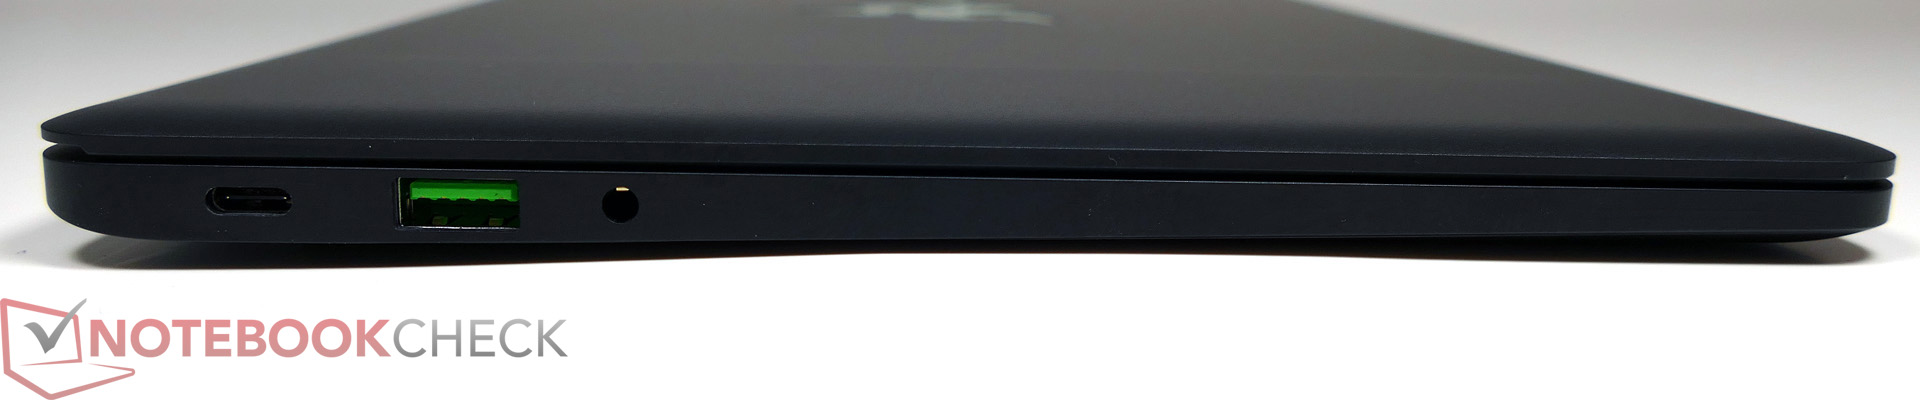
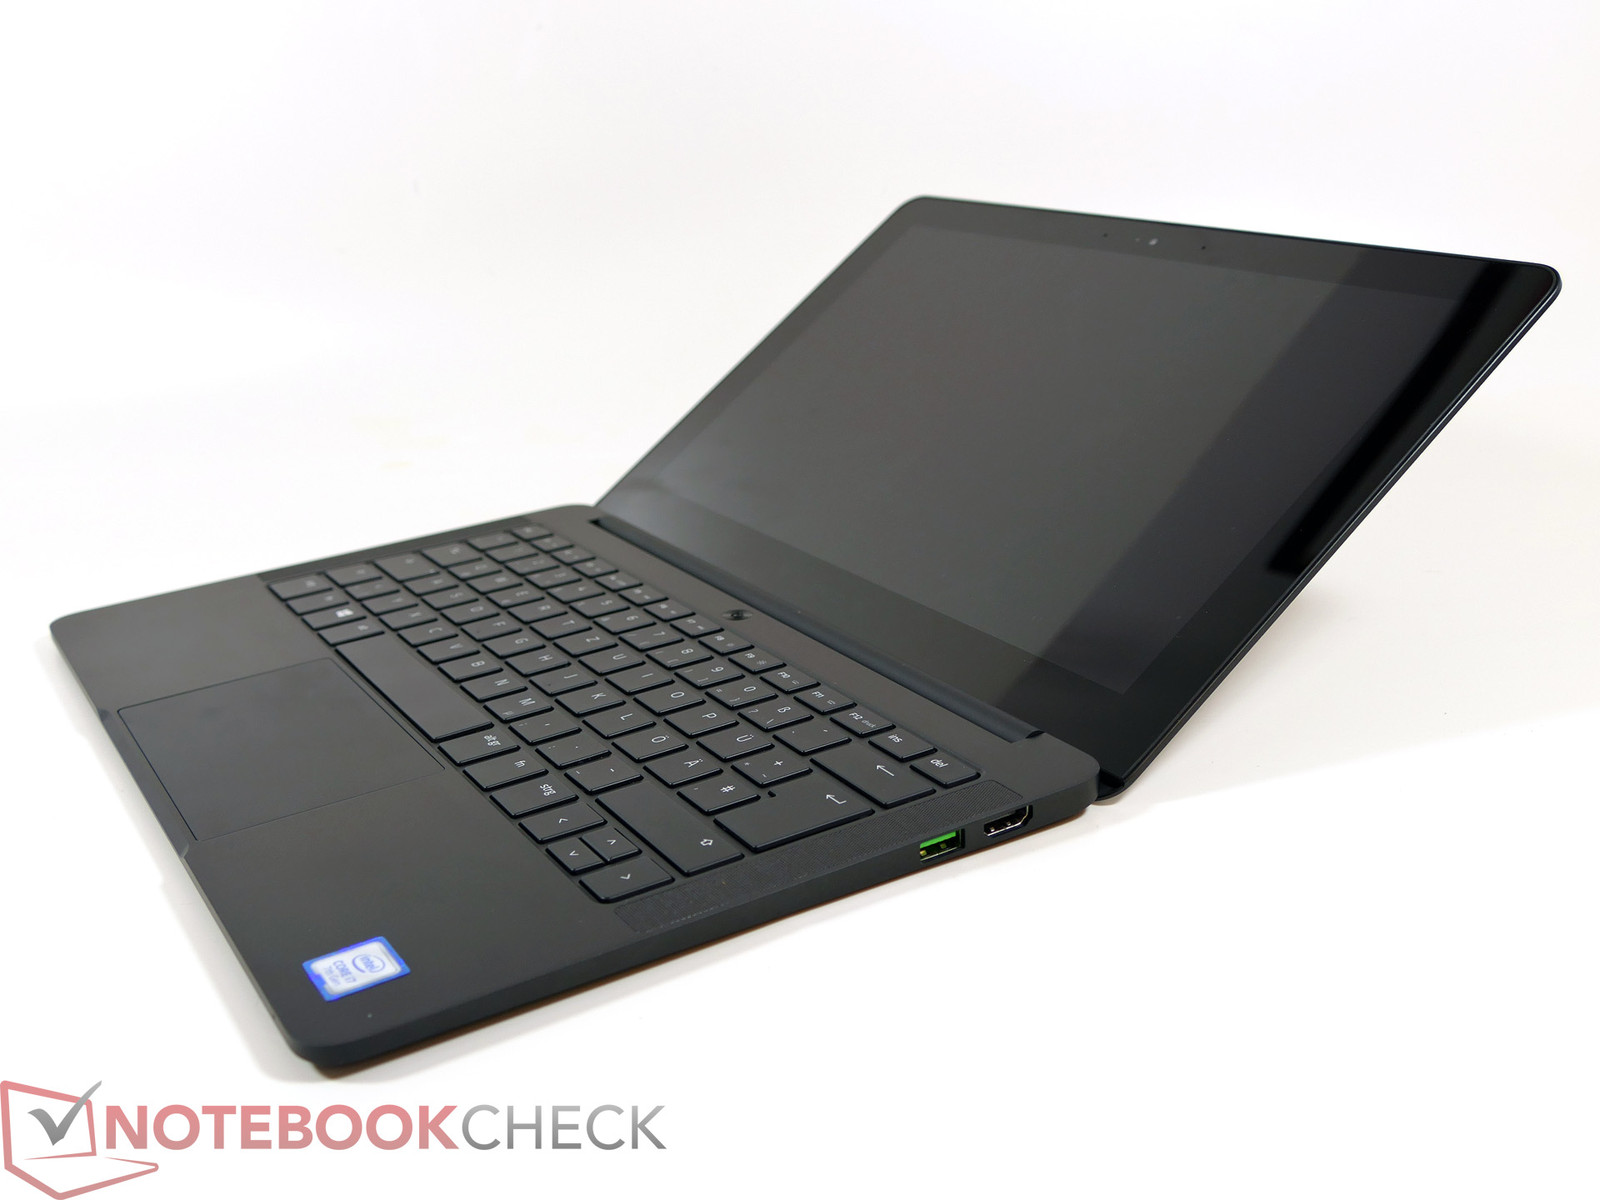
Chassit är oförändrat. Designen håller definitivt hög klass och kan jämföras med Apples MacBook vad gäller byggkvalitet och haptik. Tyvärr är den mattsvarta ytan känslig för fingeravtryck, som dessutom kan vara mycket svåra att få bort.
Den här gången fick vi ett testexemplar med QHD+-panel, som nästan är i klass med 4K-alternativet – särskilt med tanke på storleken på 12,5 tum ser den här skärmen ut som det bättre alternativet i de flesta fall. Konfigurationen med den inte fullt så högupplösta panelen är dessutom ett par tusenlappar billigare och förbrukar sannolikt mindre ström.
Vi är också imponerade av prestandan. Processorn gör ganska bra ifrån sig även under kontinuerlig belastning. Blade Stealth bör ha tillräcklig kraft för att driva Razer Core-grafikkortet, vilket resulterar i ett riktigt spelsystem.
Sammanfattningsvis: Tack vare Kaby Lake-processorn och det större batteriet kan Blade Stealth numera mäta sig med konkurrenterna. Det externa GPU-chassit Razer Core är ett spännande alternativ, men Blade Stealth kan stå på egna ben även utan tillbehöret.
Razer Blade Stealth QHD i7-7500U
- 10/25/2016 v5.1 (old)
J. Simon Leitner
Price comparison
