Test: Nokia 7.1 Smartphone (Sammanfattning)


| Networking | |
| iperf3 transmit AX12 | |
| Sony Xperia XA2 Plus | |
| Samsung Galaxy A7 2018 | |
| Asus Zenfone 5 ZE620KL | |
| Nokia 7.1 | |
| Sharp D10 | |
| iperf3 receive AX12 | |
| Asus Zenfone 5 ZE620KL | |
| Sharp D10 | |
| Nokia 7.1 | |
| Sony Xperia XA2 Plus | |
| Samsung Galaxy A7 2018 | |


| |||||||||||||||||||||||||
Distribution av ljusstyrkan: 91 %
Mitt på batteriet: 577 cd/m²
Kontrast: 1603:1 (Svärta: 0.36 cd/m²)
ΔE ColorChecker Calman: 7.4 | ∀{0.5-29.43 Ø4.72}
ΔE Greyscale Calman: 10.2 | ∀{0.09-98 Ø4.97}
100% sRGB (Calman 2D)
Gamma: 2.29
CCT: 9657 K
| Nokia 7.1 IPS, 2280x1080, 5.8" | Asus Zenfone 5 ZE620KL IPS, 2246x1080, 6.2" | Sony Xperia XA2 Plus IPS, 2160x1080, 6" | Samsung Galaxy A7 2018 Super AMOLED, 2220x1080, 6" | Sharp D10 IPS, 2160x1080, 5.9" | |
|---|---|---|---|---|---|
| Screen | 10% | 30% | 41% | 11% | |
| Brightness middle (cd/m²) | 577 | 595 3% | 597 3% | 570 -1% | 745 29% |
| Brightness (cd/m²) | 550 | 561 2% | 592 8% | 565 3% | 723 31% |
| Brightness Distribution (%) | 91 | 87 -4% | 92 1% | 93 2% | 89 -2% |
| Black Level * (cd/m²) | 0.36 | 0.54 -50% | 0.32 11% | 0.6 -67% | |
| Contrast (:1) | 1603 | 1102 -31% | 1866 16% | 1242 -23% | |
| Colorchecker dE 2000 * | 7.4 | 4.2 43% | 2.4 68% | 1.5 80% | 4.52 39% |
| Colorchecker dE 2000 max. * | 15 | 6 60% | 5.3 65% | 3.6 76% | 9.14 39% |
| Greyscale dE 2000 * | 10.2 | 4.7 54% | 3.4 67% | 1.2 88% | 5.8 43% |
| Gamma | 2.29 96% | 2.12 104% | 2.2 100% | 2.07 106% | 2.262 97% |
| CCT | 9657 67% | 7577 86% | 7172 91% | 6504 100% | 7660 85% |
* ... mindre är bättre
Skärmflimmer / PWM (Puls-Width Modulation)
| Skärmflimmer / PWM upptäckt | 2315 Hz | ≤ 21 % ljusstyrka inställning | 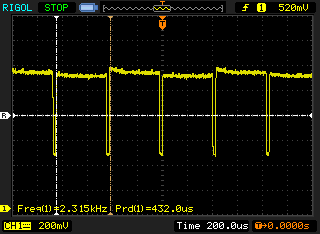 |
Displayens bakgrundsbelysning flimrar vid 2315 Hz (i värsta fall, t.ex. med PWM) Flimrande upptäckt vid en ljusstyrkeinställning på 21 % och lägre. Det ska inte finnas något flimmer eller PWM över denna ljusstyrkeinställning. Frekvensen för 2315 Hz är ganska hög, så de flesta användare som är känsliga för PWM bör inte märka något flimmer. Som jämförelse: 52 % av alla testade enheter använder inte PWM för att dämpa skärmen. Om PWM upptäcktes mättes ett medelvärde av 7769 (minst: 5 - maximum: 343500) Hz. | |||
Visa svarstider
| ↔ Svarstid svart till vitt | ||
|---|---|---|
| 18.4 ms ... stiga ↗ och falla ↘ kombinerat | ↗ 6 ms stiga | 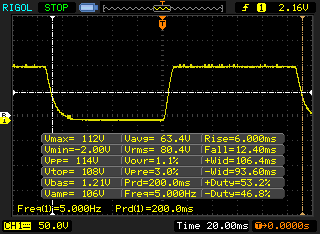 |
| ↘ 12.4 ms hösten | ||
| Skärmen visar bra svarsfrekvens i våra tester, men kan vara för långsam för konkurrenskraftiga spelare. I jämförelse sträcker sig alla testade enheter från 0.1 (minst) till 240 (maximalt) ms. » 41 % av alla enheter är bättre. Det betyder att den uppmätta svarstiden liknar genomsnittet av alla testade enheter (19.8 ms). | ||
| ↔ Svarstid 50 % grått till 80 % grått | ||
| 43.6 ms ... stiga ↗ och falla ↘ kombinerat | ↗ 20.4 ms stiga | 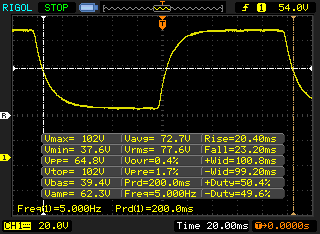 |
| ↘ 23.2 ms hösten | ||
| Skärmen visar långsamma svarsfrekvenser i våra tester och kommer att vara otillfredsställande för spelare. I jämförelse sträcker sig alla testade enheter från 0.165 (minst) till 636 (maximalt) ms. » 73 % av alla enheter är bättre. Detta innebär att den uppmätta svarstiden är sämre än genomsnittet av alla testade enheter (31 ms). | ||
| PCMark for Android | |
| Work performance score (sortera efter värde) | |
| Nokia 7.1 | |
| Asus Zenfone 5 ZE620KL | |
| Sony Xperia XA2 Plus | |
| Samsung Galaxy A7 2018 | |
| Sharp D10 | |
| Genomsnitt Qualcomm Snapdragon 636 (6040 - 7618, n=11) | |
| Work 2.0 performance score (sortera efter värde) | |
| Nokia 7.1 | |
| Asus Zenfone 5 ZE620KL | |
| Sony Xperia XA2 Plus | |
| Samsung Galaxy A7 2018 | |
| Genomsnitt Qualcomm Snapdragon 636 (5611 - 6277, n=11) | |
| GFXBench (DX / GLBenchmark) 2.7 | |
| T-Rex Onscreen (sortera efter värde) | |
| Nokia 7.1 | |
| Asus Zenfone 5 ZE620KL | |
| Sony Xperia XA2 Plus | |
| Sharp D10 | |
| Genomsnitt Qualcomm Snapdragon 636 (30 - 40, n=12) | |
| Genomsnitt av klass Smartphone (12 - 166, n=127, senaste 2 åren) | |
| 1920x1080 T-Rex Offscreen (sortera efter värde) | |
| Nokia 7.1 | |
| Asus Zenfone 5 ZE620KL | |
| Sony Xperia XA2 Plus | |
| Sharp D10 | |
| Genomsnitt Qualcomm Snapdragon 636 (35 - 36, n=12) | |
| Genomsnitt av klass Smartphone (22 - 954, n=127, senaste 2 åren) | |
| GFXBench 3.0 | |
| on screen Manhattan Onscreen OGL (sortera efter värde) | |
| Nokia 7.1 | |
| Asus Zenfone 5 ZE620KL | |
| Sony Xperia XA2 Plus | |
| Sharp D10 | |
| Genomsnitt Qualcomm Snapdragon 636 (13 - 18, n=12) | |
| Genomsnitt av klass Smartphone (18 - 166, n=128, senaste 2 åren) | |
| 1920x1080 1080p Manhattan Offscreen (sortera efter värde) | |
| Nokia 7.1 | |
| Asus Zenfone 5 ZE620KL | |
| Sony Xperia XA2 Plus | |
| Sharp D10 | |
| Genomsnitt Qualcomm Snapdragon 636 (16 - 16, n=12) | |
| Genomsnitt av klass Smartphone (14 - 606, n=127, senaste 2 åren) | |
| GFXBench 3.1 | |
| on screen Manhattan ES 3.1 Onscreen (sortera efter värde) | |
| Nokia 7.1 | |
| Asus Zenfone 5 ZE620KL | |
| Sony Xperia XA2 Plus | |
| Sharp D10 | |
| Genomsnitt Qualcomm Snapdragon 636 (5.7 - 12, n=12) | |
| Genomsnitt av klass Smartphone (11 - 166, n=129, senaste 2 åren) | |
| 1920x1080 Manhattan ES 3.1 Offscreen (sortera efter värde) | |
| Nokia 7.1 | |
| Asus Zenfone 5 ZE620KL | |
| Sony Xperia XA2 Plus | |
| Sharp D10 | |
| Genomsnitt Qualcomm Snapdragon 636 (6.3 - 10, n=12) | |
| Genomsnitt av klass Smartphone (8.6 - 413, n=127, senaste 2 åren) | |
| AnTuTu v7 - Total Score (sortera efter värde) | |
| Nokia 7.1 | |
| Asus Zenfone 5 ZE620KL | |
| Sony Xperia XA2 Plus | |
| Samsung Galaxy A7 2018 | |
| Sharp D10 | |
| Genomsnitt Qualcomm Snapdragon 636 (115565 - 138661, n=11) | |
| AnTuTu v6 - Total Score (sortera efter värde) | |
| Nokia 7.1 | |
| Asus Zenfone 5 ZE620KL | |
| Sony Xperia XA2 Plus | |
| Samsung Galaxy A7 2018 | |
| Sharp D10 | |
| Genomsnitt Qualcomm Snapdragon 636 (92015 - 125213, n=10) | |
| JetStream 1.1 - 1.1 Total | |
| Asus Zenfone 5 ZE620KL (Chrome 67) | |
| Samsung Galaxy A7 2018 (Chrome 70) | |
| Genomsnitt Qualcomm Snapdragon 636 (44.2 - 51.5, n=11) | |
| Nokia 7.1 (Chrome 70) | |
| Sharp D10 (Chrome 70) | |
| Sony Xperia XA2 Plus (Chrome 67) | |
| Octane V2 - Total Score | |
| Genomsnitt av klass Smartphone (2800 - 126661, n=157, senaste 2 åren) | |
| Asus Zenfone 5 ZE620KL (Chrome 67) | |
| Samsung Galaxy A7 2018 (Chrome 70) | |
| Genomsnitt Qualcomm Snapdragon 636 (8163 - 9746, n=12) | |
| Nokia 7.1 (Chrome 70) | |
| Sony Xperia XA2 Plus (Chrome 67) | |
| Sharp D10 (Chrome 70) | |
| Mozilla Kraken 1.1 - Total | |
| Sony Xperia XA2 Plus (Chrome 67) | |
| Sharp D10 (Chrome 70) | |
| Genomsnitt Qualcomm Snapdragon 636 (4105 - 5066, n=12) | |
| Nokia 7.1 (Chrome 70) | |
| Samsung Galaxy A7 2018 (Chrome 70) | |
| Asus Zenfone 5 ZE620KL (Chrome 67) | |
| Genomsnitt av klass Smartphone (257 - 28190, n=135, senaste 2 åren) | |
| WebXPRT 3 - Overall | |
| Genomsnitt av klass Smartphone (104 - 380, n=12, senaste 2 åren) | |
| Samsung Galaxy A7 2018 (Chrome 70) | |
| Genomsnitt Qualcomm Snapdragon 636 (46 - 61, n=9) | |
| Nokia 7.1 (Chrome 70) | |
| Sony Xperia XA2 Plus (Chrome 67) | |
| WebXPRT 2015 - Overall | |
| Samsung Galaxy A7 2018 (Chrome 70) | |
| Genomsnitt Qualcomm Snapdragon 636 (147 - 184, n=8) | |
| Nokia 7.1 (Chrome 70) | |
| Sony Xperia XA2 Plus (Chrome 67) | |
* ... mindre är bättre
| Nokia 7.1 | Asus Zenfone 5 ZE620KL | Sony Xperia XA2 Plus | Samsung Galaxy A7 2018 | Sharp D10 | Genomsnitt 32 GB eMMC Flash | Genomsnitt av klass Smartphone | |
|---|---|---|---|---|---|---|---|
| AndroBench 3-5 | 124% | 17% | 20% | 22% | 5% | 1443% | |
| Sequential Read 256KB (MB/s) | 250.9 | 286.6 14% | 281.1 12% | 295.8 18% | 280.7 12% | 242 ? -4% | 2250 ? 797% |
| Sequential Write 256KB (MB/s) | 126 | 201.8 60% | 146.2 16% | 104.9 -17% | 211.5 68% | 100.5 ? -20% | 1936 ? 1437% |
| Random Read 4KB (MB/s) | 44.9 | 71.2 59% | 77.4 72% | 84 87% | 47.2 5% | 43.1 ? -4% | 311 ? 593% |
| Random Write 4KB (MB/s) | 11.93 | 83.5 600% | 10.5 -12% | 15.45 30% | 16.79 41% | 22.3 ? 87% | 363 ? 2943% |
| Sequential Read 256KB SDCard (MB/s) | 83.5 ? | 85.8 ? 3% | 86 ? 3% | 78.2 ? -6% | 83.2 ? 0% | 71.8 ? -14% | |
| Sequential Write 256KB SDCard (MB/s) | 61.2 ? | 65.2 ? 7% | 67 ? 9% | 64.4 ? 5% | 63.6 ? 4% | 52.9 ? -14% |
Asphalt 9: Legends
(+) Den maximala temperaturen på ovansidan är 38.2 °C / 101 F, jämfört med genomsnittet av 35.3 °C / 96 F , allt från 21.9 till 247 °C för klassen Smartphone.
(+) Botten värms upp till maximalt 35.5 °C / 96 F, jämfört med genomsnittet av 34 °C / 93 F
(+) Vid tomgångsbruk är medeltemperaturen för ovansidan 31.4 °C / 89 F, jämfört med enhetsgenomsnittet på 33 °C / ### class_avg_f### F.
Nokia 7.1 ljudanalys
(+) | högtalare kan spela relativt högt (89.9 dB)
Bas 100 - 315 Hz
(-) | nästan ingen bas - i genomsnitt 28.1% lägre än medianen
(±) | linjäriteten för basen är genomsnittlig (10.5% delta till föregående frekvens)
Mellan 400 - 2000 Hz
(+) | balanserad mellan - endast 3.3% från medianen
(+) | mids är linjära (5.4% delta till föregående frekvens)
Högsta 2 - 16 kHz
(±) | högre toppar - i genomsnitt 6.4% högre än medianen
(+) | toppar är linjära (5.6% delta till föregående frekvens)
Totalt 100 - 16 000 Hz
(±) | linjäriteten för det totala ljudet är genomsnittlig (19.3% skillnad mot median)
Jämfört med samma klass
» 27% av alla testade enheter i den här klassen var bättre, 9% liknande, 64% sämre
» Den bästa hade ett delta på 11%, genomsnittet var 34%, sämst var 134%
Jämfört med alla testade enheter
» 47% av alla testade enheter var bättre, 8% liknande, 46% sämre
» Den bästa hade ett delta på 4%, genomsnittet var 24%, sämst var 134%
Samsung Galaxy A7 2018 ljudanalys
(+) | högtalare kan spela relativt högt (85.5 dB)
Bas 100 - 315 Hz
(-) | nästan ingen bas - i genomsnitt 27.5% lägre än medianen
(±) | linjäriteten för basen är genomsnittlig (10.4% delta till föregående frekvens)
Mellan 400 - 2000 Hz
(+) | balanserad mellan - endast 3.6% från medianen
(+) | mids är linjära (4.8% delta till föregående frekvens)
Högsta 2 - 16 kHz
(±) | högre toppar - i genomsnitt 8.2% högre än medianen
(+) | toppar är linjära (3.3% delta till föregående frekvens)
Totalt 100 - 16 000 Hz
(±) | linjäriteten för det totala ljudet är genomsnittlig (22.3% skillnad mot median)
Jämfört med samma klass
» 47% av alla testade enheter i den här klassen var bättre, 7% liknande, 45% sämre
» Den bästa hade ett delta på 11%, genomsnittet var 34%, sämst var 134%
Jämfört med alla testade enheter
» 65% av alla testade enheter var bättre, 6% liknande, 29% sämre
» Den bästa hade ett delta på 4%, genomsnittet var 24%, sämst var 134%
| Av/Standby | |
| Låg belastning | |
| Hög belastning |
|
Förklaring:
min: | |
| Nokia 7.1 3060 mAh | Asus Zenfone 5 ZE620KL 3300 mAh | Sony Xperia XA2 Plus 3580 mAh | Samsung Galaxy A7 2018 3300 mAh | Sharp D10 2900 mAh | Genomsnitt Qualcomm Snapdragon 636 | Genomsnitt av klass Smartphone | |
|---|---|---|---|---|---|---|---|
| Power Consumption | -107% | 25% | 5% | 26% | -12% | -22% | |
| Idle Minimum * (Watt) | 1.01 | 1.75 -73% | 0.35 65% | 0.71 30% | 0.7 31% | 0.944 ? 7% | 0.871 ? 14% |
| Idle Average * (Watt) | 2.2 | 4.48 -104% | 1.81 18% | 1.36 38% | 1 55% | 2.22 ? -1% | 1.464 ? 33% |
| Idle Maximum * (Watt) | 2.25 | 4.5 -100% | 1.83 19% | 1.47 35% | 1.4 38% | 2.54 ? -13% | 1.652 ? 27% |
| Load Average * (Watt) | 3.76 | 7.92 -111% | 3.31 12% | 5.13 -36% | 3.7 2% | 4.51 ? -20% | 6.79 ? -81% |
| Load Maximum * (Watt) | 5.56 | 13.62 -145% | 4.97 11% | 7.89 -42% | 5.2 6% | 7.37 ? -33% | 11.3 ? -103% |
* ... mindre är bättre
| Nokia 7.1 3060 mAh | Asus Zenfone 5 ZE620KL 3300 mAh | Sony Xperia XA2 Plus 3580 mAh | Samsung Galaxy A7 2018 3300 mAh | Sharp D10 2900 mAh | |
|---|---|---|---|---|---|
| Batteridrifttid | 43% | 208% | 66% | 84% | |
| Reader / Idle (h) | 16.4 | 78 376% | 24.5 49% | ||
| H.264 (h) | 8.5 | 14.9 75% | 13.9 64% | ||
| WiFi v1.3 (h) | 5.8 | 8.3 43% | 14 141% | 10.1 74% | 10.7 84% |
| Load (h) | 2.6 | 8.8 238% | 4.6 77% |
För
Emot

Läs den fullständiga versionen av den här recensionen på engelska här.
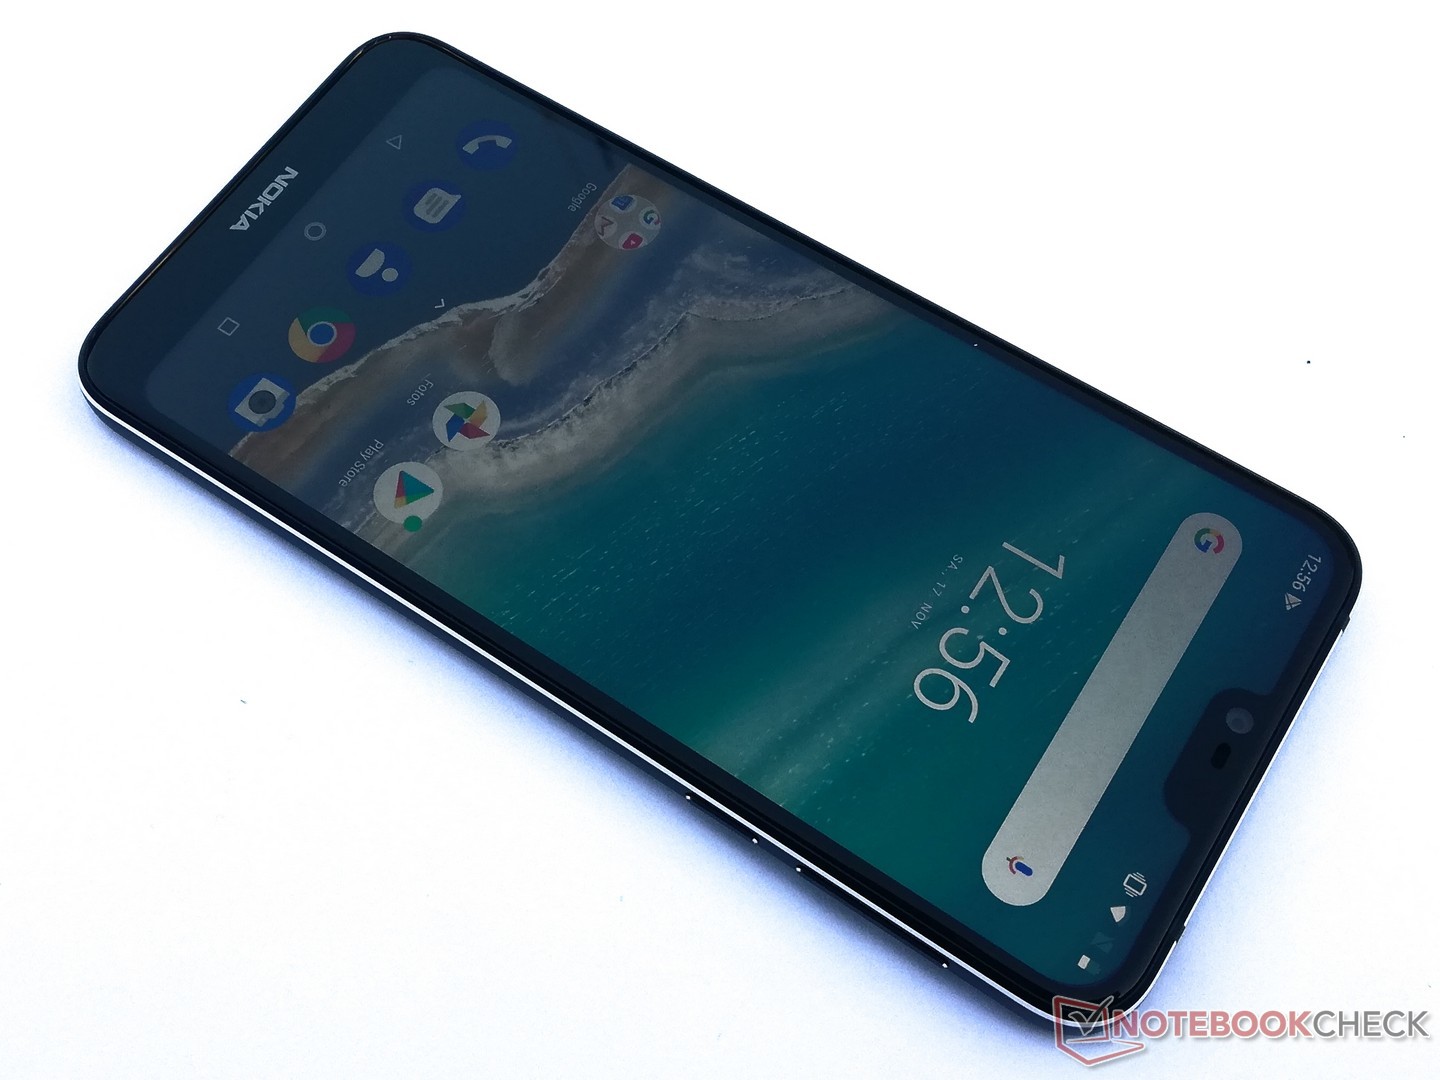
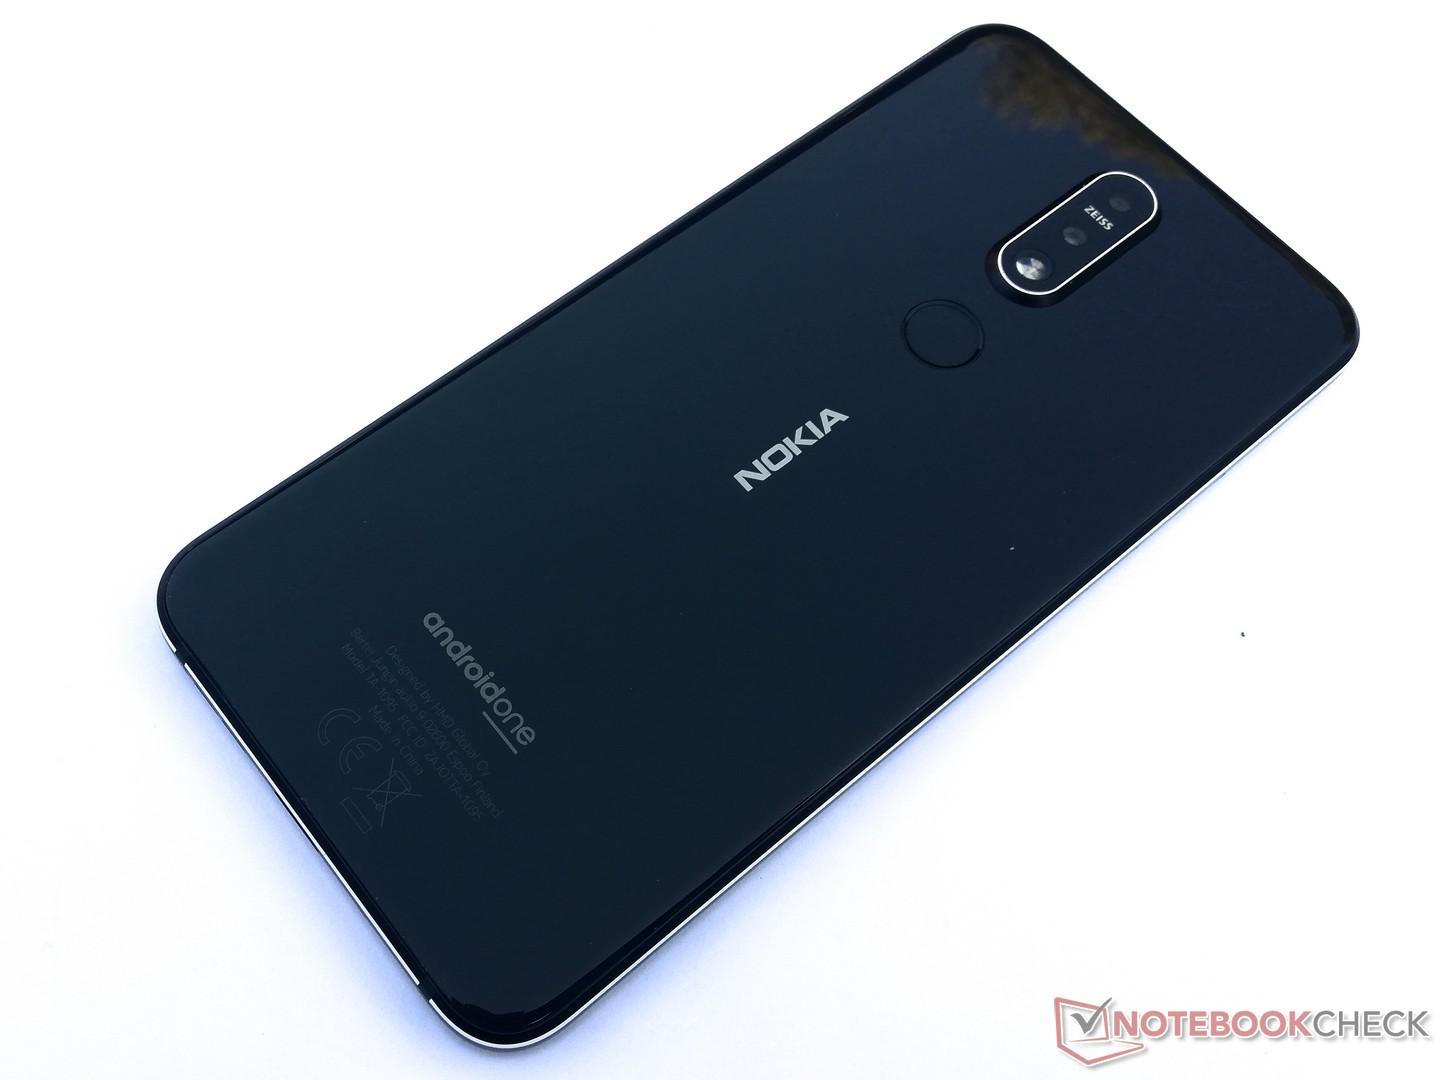
Efter att ha testat Nokia 7.1 kan vi med säkerhet säga att den är en gedigen mittenskikts-telefon som i huvudsak främst utmärker sig genom sin design. Anslutbarhet är inte dess starka sida och det går att få tag på många konkurrenter med bättre anslutbarhet till ett lägre pris. Men den kompenserar för det genom att köra en ren och äkta Android One-variant av Oreo. På så sätt är det användaren som bestämmer vilka appar som ska vara installerade och tack vare Google levereras säkerhetsuppdateringar i tre år.
Nokia 7.1 är en snygg enhet med gedigen prestanda. Men varken batteritid eller anslutbarhet är på samma nivå som dess konkurrenter.
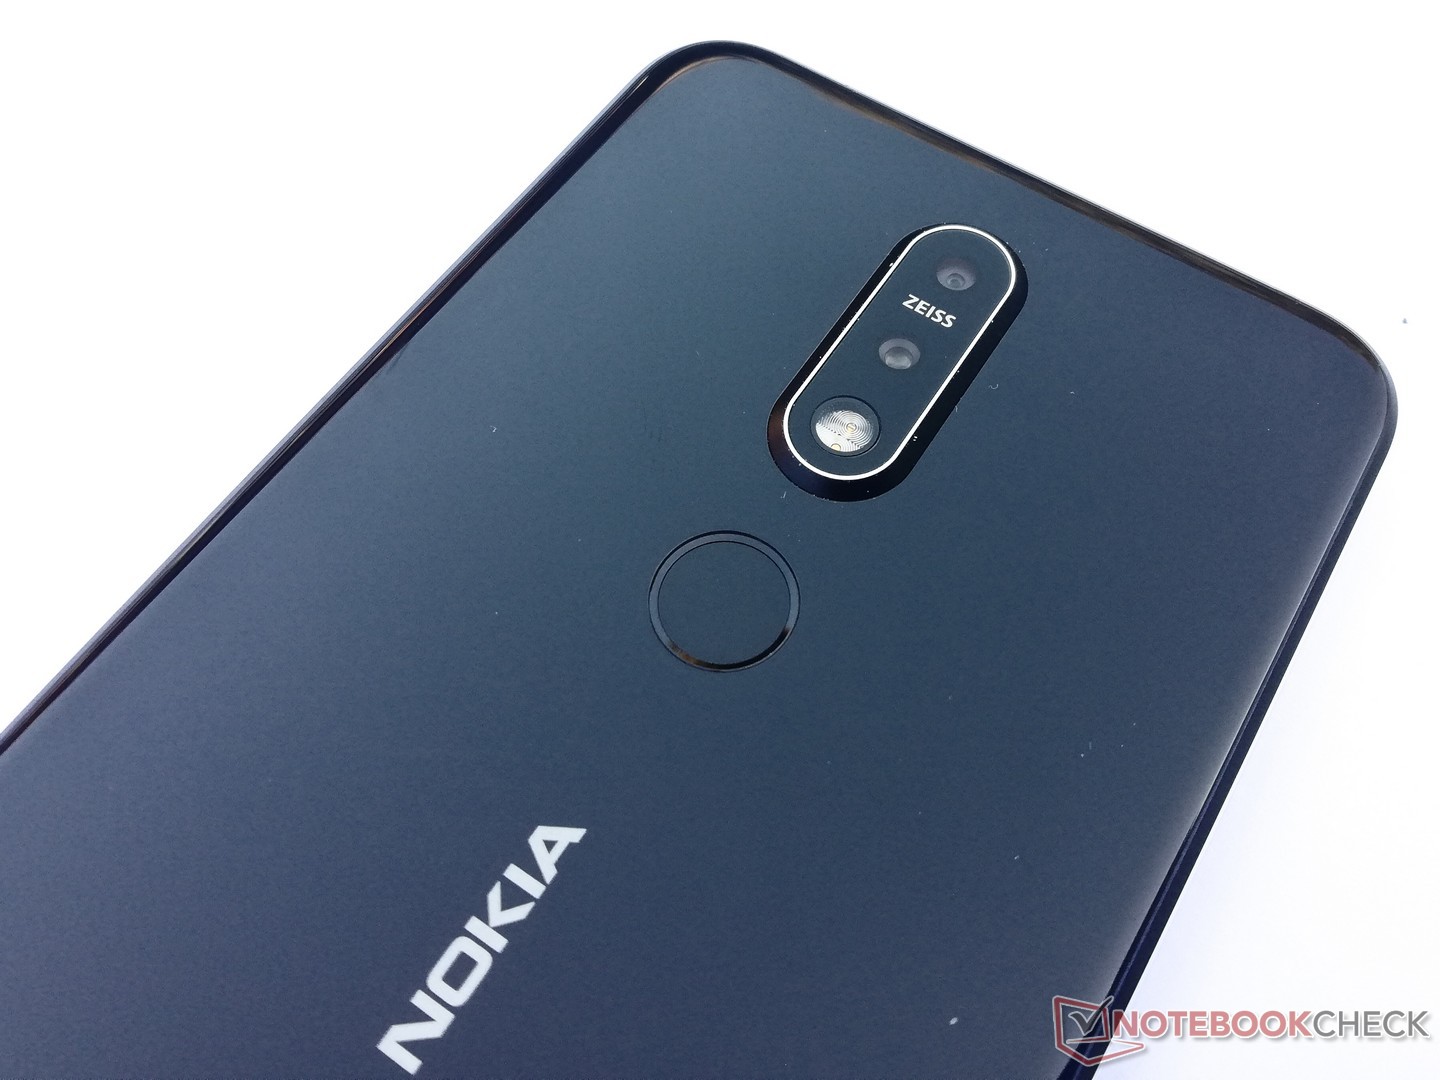
Systemets prestanda räcker till för de flesta vardagsuppgifter och den kan till och med köra mer krävande appar. Det interna lagringsutrymmet är en aning begränsat på bara 32 GB och microSD-kort kan inte användas som intern lagring utan bara för mediafiler. Dessutom är batteritiden ganska dålig. Huvudkameran visade sig vara skaplig och en bättre utrustad SKU med 4 GB RAM och 64 GB intern lagring finns också tillgänglig för den som önskar.
Nokia 7.1
- 11/26/2018 v6 (old)
Mike Wobker
Price comparison
