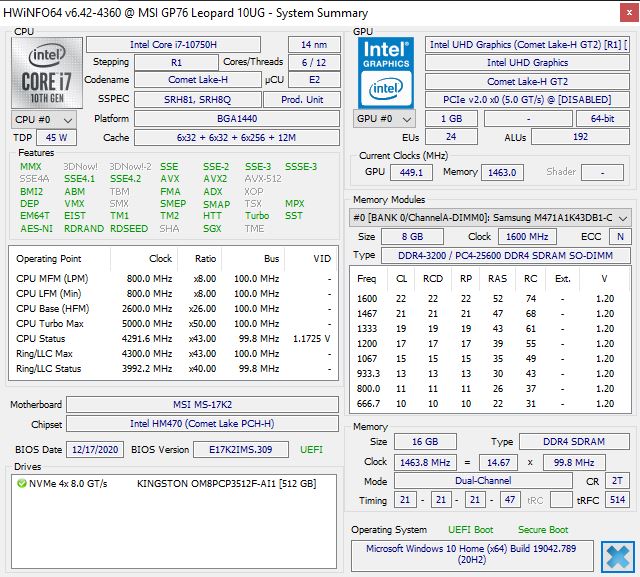
Test: MSI GP76 Leopard 10UG - RTX 3070 som körs med 140 Watt (Sammanfattning)
Testgrupp
Gradering | Datum | Modell | Vikt | Höjd | Storlek | Upplösning | Pris |
|---|---|---|---|---|---|---|---|
| 85.1 % v7 (old) | 03/2021 | MSI GP76 Leopard 10UG i7-10750H, GeForce RTX 3070 Laptop GPU | 2.9 kg | 26 mm | 17.30" | 1920x1080 | |
| 86.1 % v7 (old) | 02/2021 | Aorus 15P XC i7-10870H, GeForce RTX 3070 Laptop GPU | 2.2 kg | 27 mm | 15.60" | 1920x1080 | |
| 85 % v7 (old) | 02/2021 | Asus ROG Strix G15 G513QR R9 5900HX, GeForce RTX 3070 Laptop GPU | 2.3 kg | 27.2 mm | 15.60" | 1920x1080 | |
| 85.1 % v7 (old) | Schenker XMG Neo 17 (Early 2021, RTX 3070, 5800H) R7 5800H, GeForce RTX 3070 Laptop GPU | 2.5 kg | 27 mm | 17.30" | 2560x1440 |
| Networking | |
| iperf3 transmit AX12 | |
| Aorus 15P XC | |
| Schenker XMG Neo 17 (Early 2021, RTX 3070, 5800H) | |
| MSI GP76 Leopard 10UG | |
| Asus ROG Strix G15 G513QR | |
| Genomsnitt Intel Wi-Fi 6 AX201 (49.8 - 1775, n=324) | |
| iperf3 receive AX12 | |
| Aorus 15P XC | |
| Schenker XMG Neo 17 (Early 2021, RTX 3070, 5800H) | |
| Asus ROG Strix G15 G513QR | |
| MSI GP76 Leopard 10UG | |
| Genomsnitt Intel Wi-Fi 6 AX201 (136 - 1743, n=324) | |


| |||||||||||||||||||||||||
Distribution av ljusstyrkan: 87 %
Mitt på batteriet: 328 cd/m²
Kontrast: 1131:1 (Svärta: 0.29 cd/m²)
ΔE ColorChecker Calman: 1.93 | ∀{0.5-29.43 Ø4.72}
calibrated: 0.68
ΔE Greyscale Calman: 2.8 | ∀{0.09-98 Ø4.97}
89% sRGB (Argyll 1.6.3 3D)
67% AdobeRGB 1998 (Argyll 1.6.3 3D)
66.9% AdobeRGB 1998 (Argyll 3D)
96.4% sRGB (Argyll 3D)
64.7% Display P3 (Argyll 3D)
Gamma: 2.18
CCT: 7023 K
| MSI GP76 Leopard 10UG Chi Mei CMN176E, IPS, 1920x1080, 17.3" | Aorus 15P XC Sharp LQ156M1JW03, IPS, 1920x1080, 15.6" | Asus ROG Strix G15 G513QR LQ156M1JW25, IPS, 1920x1080, 15.6" | Schenker XMG Neo 17 (Early 2021, RTX 3070, 5800H) BOE NE173QHM-NY2 (BOE0977), IPS, 2560x1440, 17.3" | |
|---|---|---|---|---|
| Display | 3% | 2% | 6% | |
| Display P3 Coverage (%) | 64.7 | 67.2 4% | 67.7 5% | 70.5 9% |
| sRGB Coverage (%) | 96.4 | 98.7 2% | 94.3 -2% | 99.5 3% |
| AdobeRGB 1998 Coverage (%) | 66.9 | 68.6 3% | 68.2 2% | 71.8 7% |
| Response Times | -20% | 2% | -60% | |
| Response Time Grey 50% / Grey 80% * (ms) | 7.4 ? | 11.2 ? -51% | 8.2 ? -11% | 16.8 ? -127% |
| Response Time Black / White * (ms) | 10.8 ? | 9.6 ? 11% | 9.2 ? 15% | 10 ? 7% |
| PWM Frequency (Hz) | 24510 ? | 24040 ? | ||
| Screen | 9% | -20% | -9% | |
| Brightness middle (cd/m²) | 328 | 298 -9% | 308 -6% | 410 25% |
| Brightness (cd/m²) | 314 | 278 -11% | 288 -8% | 381 21% |
| Brightness Distribution (%) | 87 | 88 1% | 86 -1% | 88 1% |
| Black Level * (cd/m²) | 0.29 | 0.29 -0% | 0.23 21% | 0.37 -28% |
| Contrast (:1) | 1131 | 1028 -9% | 1339 18% | 1108 -2% |
| Colorchecker dE 2000 * | 1.93 | 0.96 50% | 3.28 -70% | 2.55 -32% |
| Colorchecker dE 2000 max. * | 4.94 | 3.22 35% | 8.51 -72% | 4.33 12% |
| Colorchecker dE 2000 calibrated * | 0.68 | 0.83 -22% | 0.83 -22% | 1.28 -88% |
| Greyscale dE 2000 * | 2.8 | 1.3 54% | 5 -79% | 3.4 -21% |
| Gamma | 2.18 101% | 2.242 98% | 2.057 107% | 2.275 97% |
| CCT | 7023 93% | 6519 100% | 7393 88% | 6637 98% |
| Color Space (Percent of AdobeRGB 1998) (%) | 67 | 69 3% | 68 1% | 72 7% |
| Color Space (Percent of sRGB) (%) | 89 | 91 2% | 90 1% | 95 7% |
| Totalt genomsnitt (program/inställningar) | -3% /
4% | -5% /
-13% | -21% /
-12% |
* ... mindre är bättre
Visa svarstider
| ↔ Svarstid svart till vitt | ||
|---|---|---|
| 10.8 ms ... stiga ↗ och falla ↘ kombinerat | ↗ 5.6 ms stiga | 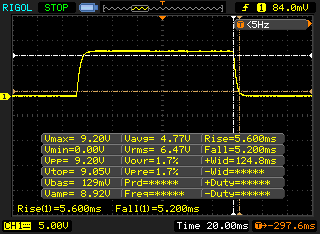 |
| ↘ 5.2 ms hösten | ||
| Skärmen visar bra svarsfrekvens i våra tester, men kan vara för långsam för konkurrenskraftiga spelare. I jämförelse sträcker sig alla testade enheter från 0.1 (minst) till 240 (maximalt) ms. » 29 % av alla enheter är bättre. Det betyder att den uppmätta svarstiden är bättre än genomsnittet av alla testade enheter (19.8 ms). | ||
| ↔ Svarstid 50 % grått till 80 % grått | ||
| 7.4 ms ... stiga ↗ och falla ↘ kombinerat | ↗ 3.8 ms stiga | 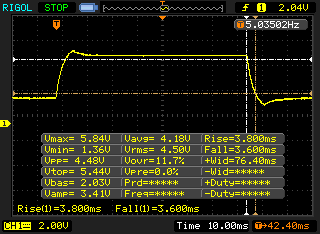 |
| ↘ 3.6 ms hösten | ||
| Skärmen visar väldigt snabba svarsfrekvenser i våra tester och borde vara mycket väl lämpad för fartfyllt spel. I jämförelse sträcker sig alla testade enheter från 0.165 (minst) till 636 (maximalt) ms. » 20 % av alla enheter är bättre. Det betyder att den uppmätta svarstiden är bättre än genomsnittet av alla testade enheter (31 ms). | ||
Skärmflimmer / PWM (Puls-Width Modulation)
| Skärmflimmer / PWM upptäckt | 24510 Hz | ≤ 39 % ljusstyrka inställning | 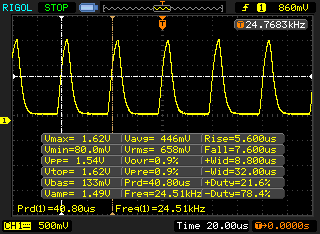 |
Displayens bakgrundsbelysning flimrar vid 24510 Hz (i värsta fall, t.ex. med PWM) Flimrande upptäckt vid en ljusstyrkeinställning på 39 % och lägre. Det ska inte finnas något flimmer eller PWM över denna ljusstyrkeinställning. Frekvensen för 24510 Hz är ganska hög, så de flesta användare som är känsliga för PWM bör inte märka något flimmer. Som jämförelse: 52 % av alla testade enheter använder inte PWM för att dämpa skärmen. Om PWM upptäcktes mättes ett medelvärde av 7763 (minst: 5 - maximum: 343500) Hz. | |||
| Cinebench R15 | |
| CPU Single 64Bit | |
| Genomsnitt av klass Gaming (188.8 - 343, n=109, senaste 2 åren) | |
| Asus ROG Strix G15 G513QR | |
| Schenker XMG Neo 17 (Early 2021, RTX 3070, 5800H) | |
| Aorus 15P XC | |
| MSI GP76 Leopard 10UG | |
| Genomsnitt Intel Core i7-10750H (184 - 213, n=45) | |
| CPU Multi 64Bit | |
| Genomsnitt av klass Gaming (1578 - 6271, n=108, senaste 2 åren) | |
| Asus ROG Strix G15 G513QR | |
| Schenker XMG Neo 17 (Early 2021, RTX 3070, 5800H) | |
| Aorus 15P XC | |
| Genomsnitt Intel Core i7-10750H (804 - 1418, n=50) | |
| MSI GP76 Leopard 10UG | |
| Blender - v2.79 BMW27 CPU | |
| Genomsnitt Intel Core i7-10750H (322 - 587, n=43) | |
| MSI GP76 Leopard 10UG | |
| Aorus 15P XC | |
| Schenker XMG Neo 17 (Early 2021, RTX 3070, 5800H) | |
| Asus ROG Strix G15 G513QR | |
| Genomsnitt av klass Gaming (80 - 330, n=107, senaste 2 åren) | |
| 7-Zip 18.03 | |
| 7z b 4 -mmt1 | |
| Genomsnitt av klass Gaming (4199 - 7436, n=108, senaste 2 åren) | |
| Schenker XMG Neo 17 (Early 2021, RTX 3070, 5800H) | |
| Asus ROG Strix G15 G513QR | |
| Aorus 15P XC | |
| MSI GP76 Leopard 10UG | |
| Genomsnitt Intel Core i7-10750H (4504 - 5470, n=43) | |
| 7z b 4 | |
| Genomsnitt av klass Gaming (33491 - 148086, n=108, senaste 2 åren) | |
| Schenker XMG Neo 17 (Early 2021, RTX 3070, 5800H) | |
| Asus ROG Strix G15 G513QR | |
| Aorus 15P XC | |
| MSI GP76 Leopard 10UG | |
| Genomsnitt Intel Core i7-10750H (26040 - 37345, n=43) | |
| Cinebench R20 | |
| CPU (Single Core) | |
| Genomsnitt av klass Gaming (442 - 895, n=109, senaste 2 åren) | |
| Asus ROG Strix G15 G513QR | |
| Schenker XMG Neo 17 (Early 2021, RTX 3070, 5800H) | |
| Aorus 15P XC | |
| Genomsnitt Intel Core i7-10750H (431 - 504, n=43) | |
| MSI GP76 Leopard 10UG | |
| CPU (Multi Core) | |
| Genomsnitt av klass Gaming (4029 - 16108, n=109, senaste 2 åren) | |
| Asus ROG Strix G15 G513QR | |
| Schenker XMG Neo 17 (Early 2021, RTX 3070, 5800H) | |
| Aorus 15P XC | |
| MSI GP76 Leopard 10UG | |
| Genomsnitt Intel Core i7-10750H (1749 - 3325, n=43) | |
| Geekbench 5.5 | |
| Single-Core | |
| Genomsnitt av klass Gaming (986 - 2474, n=108, senaste 2 åren) | |
| Asus ROG Strix G15 G513QR | |
| Schenker XMG Neo 17 (Early 2021, RTX 3070, 5800H) | |
| MSI GP76 Leopard 10UG | |
| Aorus 15P XC | |
| Genomsnitt Intel Core i7-10750H (1114 - 1333, n=43) | |
| Multi-Core | |
| Genomsnitt av klass Gaming (6460 - 27010, n=108, senaste 2 åren) | |
| Schenker XMG Neo 17 (Early 2021, RTX 3070, 5800H) | |
| Aorus 15P XC | |
| Asus ROG Strix G15 G513QR | |
| MSI GP76 Leopard 10UG | |
| Genomsnitt Intel Core i7-10750H (4443 - 6674, n=43) | |
| HWBOT x265 Benchmark v2.2 - 4k Preset | |
| Genomsnitt av klass Gaming (11.5 - 44.3, n=108, senaste 2 åren) | |
| Schenker XMG Neo 17 (Early 2021, RTX 3070, 5800H) | |
| Asus ROG Strix G15 G513QR | |
| Aorus 15P XC | |
| MSI GP76 Leopard 10UG | |
| Genomsnitt Intel Core i7-10750H (5.54 - 11.6, n=43) | |
| LibreOffice - 20 Documents To PDF | |
| Aorus 15P XC | |
| Genomsnitt Intel Core i7-10750H (43.1 - 99.2, n=43) | |
| MSI GP76 Leopard 10UG | |
| Schenker XMG Neo 17 (Early 2021, RTX 3070, 5800H) | |
| Asus ROG Strix G15 G513QR | |
| Genomsnitt av klass Gaming (19 - 88.8, n=108, senaste 2 åren) | |
| R Benchmark 2.5 - Overall mean | |
| Genomsnitt Intel Core i7-10750H (0.578 - 0.708, n=42) | |
| MSI GP76 Leopard 10UG | |
| Aorus 15P XC | |
| Schenker XMG Neo 17 (Early 2021, RTX 3070, 5800H) | |
| Asus ROG Strix G15 G513QR | |
| Genomsnitt av klass Gaming (0.3439 - 0.759, n=109, senaste 2 åren) | |
* ... mindre är bättre
| PCMark 10 Score | 6017 poäng | |
Hjälp | ||
| DPC Latencies / LatencyMon - interrupt to process latency (max), Web, Youtube, Prime95 | |
| Schenker XMG Neo 17 (Early 2021, RTX 3070, 5800H) | |
| Aorus 15P XC | |
| MSI GP76 Leopard 10UG | |
| Asus ROG Strix G15 G513QR | |
* ... mindre är bättre
| MSI GP76 Leopard 10UG Kingston OM8PCP3512F-AB | Aorus 15P XC ESR512GTLCG-EAC-4 | Asus ROG Strix G15 G513QR SK Hynix HFM001TD3JX013N | Schenker XMG Neo 17 (Early 2021, RTX 3070, 5800H) Samsung SSD 970 EVO Plus 500GB | Genomsnitt Kingston OM8PCP3512F-AB | |
|---|---|---|---|---|---|
| CrystalDiskMark 5.2 / 6 | 64% | 101% | 6% | ||
| Write 4K (MB/s) | 143.7 | 130.2 -9% | 206.1 43% | 194.5 ? 35% | |
| Read 4K (MB/s) | 45.1 | 45.47 1% | 53 18% | 47.3 ? 5% | |
| Write Seq (MB/s) | 978 | 2269 132% | 3018 209% | 978 ? 0% | |
| Read Seq (MB/s) | 1163 | 1643 41% | 2575 121% | 1299 ? 12% | |
| Write 4K Q32T1 (MB/s) | 519 | 547 5% | 535 3% | 505 ? -3% | |
| Read 4K Q32T1 (MB/s) | 302.7 | 654 116% | 608 101% | 301 ? -1% | |
| Write Seq Q32T1 (MB/s) | 981 | 2512 156% | 3242 230% | 978 ? 0% | |
| Read Seq Q32T1 (MB/s) | 1983 | 3382 71% | 3617 82% | 1930 ? -3% | |
| AS SSD | 105% | 87% | 114% | -4% | |
| Seq Read (MB/s) | 1659 | 2694 62% | 2881 74% | 3020 82% | 1570 ? -5% |
| Seq Write (MB/s) | 921 | 2327 153% | 1570 70% | 2631 186% | 904 ? -2% |
| 4K Read (MB/s) | 51 | 47.77 -6% | 52.4 3% | 60.3 18% | 48.2 ? -5% |
| 4K Write (MB/s) | 120.1 | 98.8 -18% | 124 3% | 171.6 43% | 118.9 ? -1% |
| 4K-64 Read (MB/s) | 463.5 | 1746 277% | 1334 188% | 1410 204% | 415 ? -10% |
| 4K-64 Write (MB/s) | 909 | 2267 149% | 2189 141% | 2324 156% | 829 ? -9% |
| Access Time Read * (ms) | 0.179 | 0.079 56% | 0.055 69% | 0.045 75% | 0.1294 ? 28% |
| Access Time Write * (ms) | 0.032 | 0.039 -22% | 0.03 6% | 0.024 25% | 0.0371 ? -16% |
| Score Read (Points) | 680 | 2063 203% | 1675 146% | 1773 161% | 619 ? -9% |
| Score Write (Points) | 1121 | 2598 132% | 2470 120% | 2759 146% | 1036 ? -8% |
| Score Total (Points) | 2130 | 5698 168% | 4943 132% | 5429 155% | 1955 ? -8% |
| Totalt genomsnitt (program/inställningar) | 85% /
88% | 87% /
87% | 108% /
108% | 1% /
0% |
* ... mindre är bättre

DiskSpd Read Loop, Queue Depth 8
| 3DMark | |
| 1920x1080 Fire Strike Graphics | |
| Genomsnitt av klass Gaming (12242 - 62849, n=118, senaste 2 åren) | |
| MSI GP76 Leopard 10UG | |
| Schenker XMG Neo 17 (Early 2021, RTX 3070, 5800H) | |
| Aorus 15P XC | |
| Asus ROG Strix G15 G513QR | |
| Genomsnitt NVIDIA GeForce RTX 3070 Laptop GPU (7178 - 29128, n=52) | |
| MSI GS66 Stealth 10UG | |
| 2560x1440 Time Spy Graphics | |
| Genomsnitt av klass Gaming (5012 - 26212, n=117, senaste 2 åren) | |
| Schenker XMG Neo 17 (Early 2021, RTX 3070, 5800H) | |
| MSI GP76 Leopard 10UG | |
| Aorus 15P XC | |
| Asus ROG Strix G15 G513QR | |
| Genomsnitt NVIDIA GeForce RTX 3070 Laptop GPU (2644 - 11019, n=53) | |
| MSI GS66 Stealth 10UG | |
| 3DMark 11 Performance | 25847 poäng | |
| 3DMark Fire Strike Score | 22121 poäng | |
| 3DMark Time Spy Score | 9933 poäng | |
Hjälp | ||
| The Witcher 3 - 1920x1080 Ultra Graphics & Postprocessing (HBAO+) | |
| Genomsnitt av klass Gaming (95 - 240, n=8, senaste 2 åren) | |
| MSI GP76 Leopard 10UG | |
| Schenker XMG Neo 17 (Early 2021, RTX 3070, 5800H) | |
| Aorus 15P XC | |
| Asus ROG Strix G15 G513QR | |
| Genomsnitt NVIDIA GeForce RTX 3070 Laptop GPU (34.9 - 109, n=52) | |
| MSI GS66 Stealth 10UG | |
| Final Fantasy XV Benchmark - 1920x1080 High Quality | |
| Genomsnitt av klass Gaming (41 - 215, n=99, senaste 2 åren) | |
| MSI GP76 Leopard 10UG | |
| Asus ROG Strix G15 G513QR | |
| MSI GS66 Stealth 10UG | |
| Genomsnitt NVIDIA GeForce RTX 3070 Laptop GPU (27.9 - 107, n=49) | |
| Far Cry 5 - 1920x1080 Ultra Preset AA:T | |
| Genomsnitt av klass Gaming (70 - 151, n=9, senaste 2 åren) | |
| MSI GP76 Leopard 10UG | |
| Genomsnitt NVIDIA GeForce RTX 3070 Laptop GPU (89 - 140, n=36) | |
| Aorus 15P XC | |
| Asus ROG Strix G15 G513QR | |
| X-Plane 11.11 - 1920x1080 high (fps_test=3) | |
| Genomsnitt av klass Gaming (52.1 - 143.5, n=113, senaste 2 åren) | |
| Genomsnitt NVIDIA GeForce RTX 3070 Laptop GPU (12.4 - 118.8, n=61) | |
| MSI GP76 Leopard 10UG | |
| Aorus 15P XC | |
| MSI GS66 Stealth 10UG | |
| Schenker XMG Neo 17 (Early 2021, RTX 3070, 5800H) | |
| Asus ROG Strix G15 G513QR | |
| Dota 2 Reborn - 1920x1080 ultra (3/3) best looking | |
| Genomsnitt av klass Gaming (84.8 - 248, n=110, senaste 2 åren) | |
| Schenker XMG Neo 17 (Early 2021, RTX 3070, 5800H) | |
| Genomsnitt NVIDIA GeForce RTX 3070 Laptop GPU (26.9 - 163.9, n=58) | |
| Aorus 15P XC | |
| MSI GP76 Leopard 10UG | |
| MSI GS66 Stealth 10UG | |
| Asus ROG Strix G15 G513QR | |
| låg | med. | hög | ultra | |
|---|---|---|---|---|
| The Witcher 3 (2015) | 109 | |||
| Dota 2 Reborn (2015) | 140 | 139 | 123 | 117 |
| Final Fantasy XV Benchmark (2018) | 90.2 | |||
| X-Plane 11.11 (2018) | 105 | 93.9 | 80.2 | |
| Far Cry 5 (2018) | 114 | |||
| Anno 1800 (2019) | 38.9 | 38.3 | 34.5 | 24.4 |
| Doom Eternal (2020) | 216 |
Ljudnivå
| Låg belastning |
| 25 / 32 / 34 dB(A) |
| Hög belastning |
| 54 / 54 dB(A) |
 | ||
30 dB tyst 40 dB(A) hörbar 50 dB(A) högt ljud |
||
min: | ||
(±) Den maximala temperaturen på ovansidan är 43 °C / 109 F, jämfört med genomsnittet av 40.4 °C / 105 F , allt från 21.2 till 68.8 °C för klassen Gaming.
(-) Botten värms upp till maximalt 47 °C / 117 F, jämfört med genomsnittet av 43.2 °C / 110 F
(+) Vid tomgångsbruk är medeltemperaturen för ovansidan 27.7 °C / 82 F, jämfört med enhetsgenomsnittet på 33.9 °C / ### class_avg_f### F.
(±) När du spelar The Witcher 3 är medeltemperaturen för ovansidan 37.3 °C / 99 F, jämfört med enhetsgenomsnittet på 33.9 °C / ## #class_avg_f### F.
(+) Handledsstöden och pekplattan är kallare än hudtemperaturen med maximalt 29 °C / 84.2 F och är därför svala att ta på.
(±) Medeltemperaturen för handledsstödsområdet på liknande enheter var 28.8 °C / 83.8 F (-0.2 °C / -0.4 F).
MSI GP76 Leopard 10UG ljudanalys
(+) | högtalare kan spela relativt högt (85 dB)
Bas 100 - 315 Hz
(-) | nästan ingen bas - i genomsnitt 18.5% lägre än medianen
(±) | linjäriteten för basen är genomsnittlig (10.8% delta till föregående frekvens)
Mellan 400 - 2000 Hz
(+) | balanserad mellan - endast 2.9% från medianen
(+) | mids är linjära (2.4% delta till föregående frekvens)
Högsta 2 - 16 kHz
(+) | balanserade toppar - endast 2.8% från medianen
(+) | toppar är linjära (4.2% delta till föregående frekvens)
Totalt 100 - 16 000 Hz
(+) | det totala ljudet är linjärt (13.2% skillnad mot median)
Jämfört med samma klass
» 19% av alla testade enheter i den här klassen var bättre, 4% liknande, 77% sämre
» Den bästa hade ett delta på 6%, genomsnittet var 18%, sämst var 132%
Jämfört med alla testade enheter
» 13% av alla testade enheter var bättre, 3% liknande, 84% sämre
» Den bästa hade ett delta på 4%, genomsnittet var 24%, sämst var 134%
Apple MacBook 12 (Early 2016) 1.1 GHz ljudanalys
(+) | högtalare kan spela relativt högt (83.6 dB)
Bas 100 - 315 Hz
(±) | reducerad bas - i genomsnitt 11.3% lägre än medianen
(±) | linjäriteten för basen är genomsnittlig (14.2% delta till föregående frekvens)
Mellan 400 - 2000 Hz
(+) | balanserad mellan - endast 2.4% från medianen
(+) | mids är linjära (5.5% delta till föregående frekvens)
Högsta 2 - 16 kHz
(+) | balanserade toppar - endast 2% från medianen
(+) | toppar är linjära (4.5% delta till föregående frekvens)
Totalt 100 - 16 000 Hz
(+) | det totala ljudet är linjärt (10.2% skillnad mot median)
Jämfört med samma klass
» 7% av alla testade enheter i den här klassen var bättre, 2% liknande, 91% sämre
» Den bästa hade ett delta på 5%, genomsnittet var 18%, sämst var 53%
Jämfört med alla testade enheter
» 5% av alla testade enheter var bättre, 1% liknande, 94% sämre
» Den bästa hade ett delta på 4%, genomsnittet var 24%, sämst var 134%
| Av/Standby | |
| Låg belastning | |
| Hög belastning |
|
Förklaring:
min: | |
| MSI GP76 Leopard 10UG i7-10750H, GeForce RTX 3070 Laptop GPU | Aorus 15P XC i7-10870H, GeForce RTX 3070 Laptop GPU | Asus ROG Strix G15 G513QR R9 5900HX, GeForce RTX 3070 Laptop GPU | Schenker XMG Neo 17 (Early 2021, RTX 3070, 5800H) R7 5800H, GeForce RTX 3070 Laptop GPU | MSI GS66 Stealth 10UG i7-10870H, GeForce RTX 3070 Laptop GPU | Genomsnitt av klass Gaming | |
|---|---|---|---|---|---|---|
| Power Consumption | -10% | 8% | -9% | -0% | -11% | |
| Idle Minimum * (Watt) | 12 | 14 -17% | 4 67% | 13 -8% | 12.9 -8% | 13.1 ? -9% |
| Idle Average * (Watt) | 16 | 17 -6% | 9 44% | 16 -0% | 15.4 4% | 18.8 ? -18% |
| Idle Maximum * (Watt) | 28 | 33 -18% | 36 -29% | 26 7% | 27.1 3% | 24.4 ? 13% |
| Load Average * (Watt) | 92 | 96 -4% | 130 -41% | 125 -36% | 98.2 -7% | 108.6 ? -18% |
| Witcher 3 ultra * (Watt) | 198 | 179 10% | 174 12% | 187 6% | 164.9 17% | |
| Load Maximum * (Watt) | 210 | 256 -22% | 227 -8% | 259 -23% | 232.9 -11% | 254 ? -21% |
* ... mindre är bättre
| MSI GP76 Leopard 10UG i7-10750H, GeForce RTX 3070 Laptop GPU, 65 Wh | Aorus 15P XC i7-10870H, GeForce RTX 3070 Laptop GPU, 99 Wh | Asus ROG Strix G15 G513QR R9 5900HX, GeForce RTX 3070 Laptop GPU, 90 Wh | Schenker XMG Neo 17 (Early 2021, RTX 3070, 5800H) R7 5800H, GeForce RTX 3070 Laptop GPU, 62 Wh | MSI GS66 Stealth 10UG i7-10870H, GeForce RTX 3070 Laptop GPU, 99.9 Wh | Genomsnitt av klass Gaming | |
|---|---|---|---|---|---|---|
| Batteridrifttid | 73% | 95% | -15% | 112% | 69% | |
| Reader / Idle (h) | 5.6 | 9.5 70% | 4.7 -16% | 10.8 93% | 8.71 ? 56% | |
| WiFi v1.3 (h) | 4.2 | 6.7 60% | 7.4 76% | 3.5 -17% | 7.1 69% | 6.96 ? 66% |
| Load (h) | 0.8 | 1.5 88% | 1.7 113% | 0.7 -13% | 2.2 175% | 1.47 ? 84% |
För
Emot
Omdöme - Kraftfull spellaptop
Läs den fullständiga versionen av den här recensionen på engelska här.
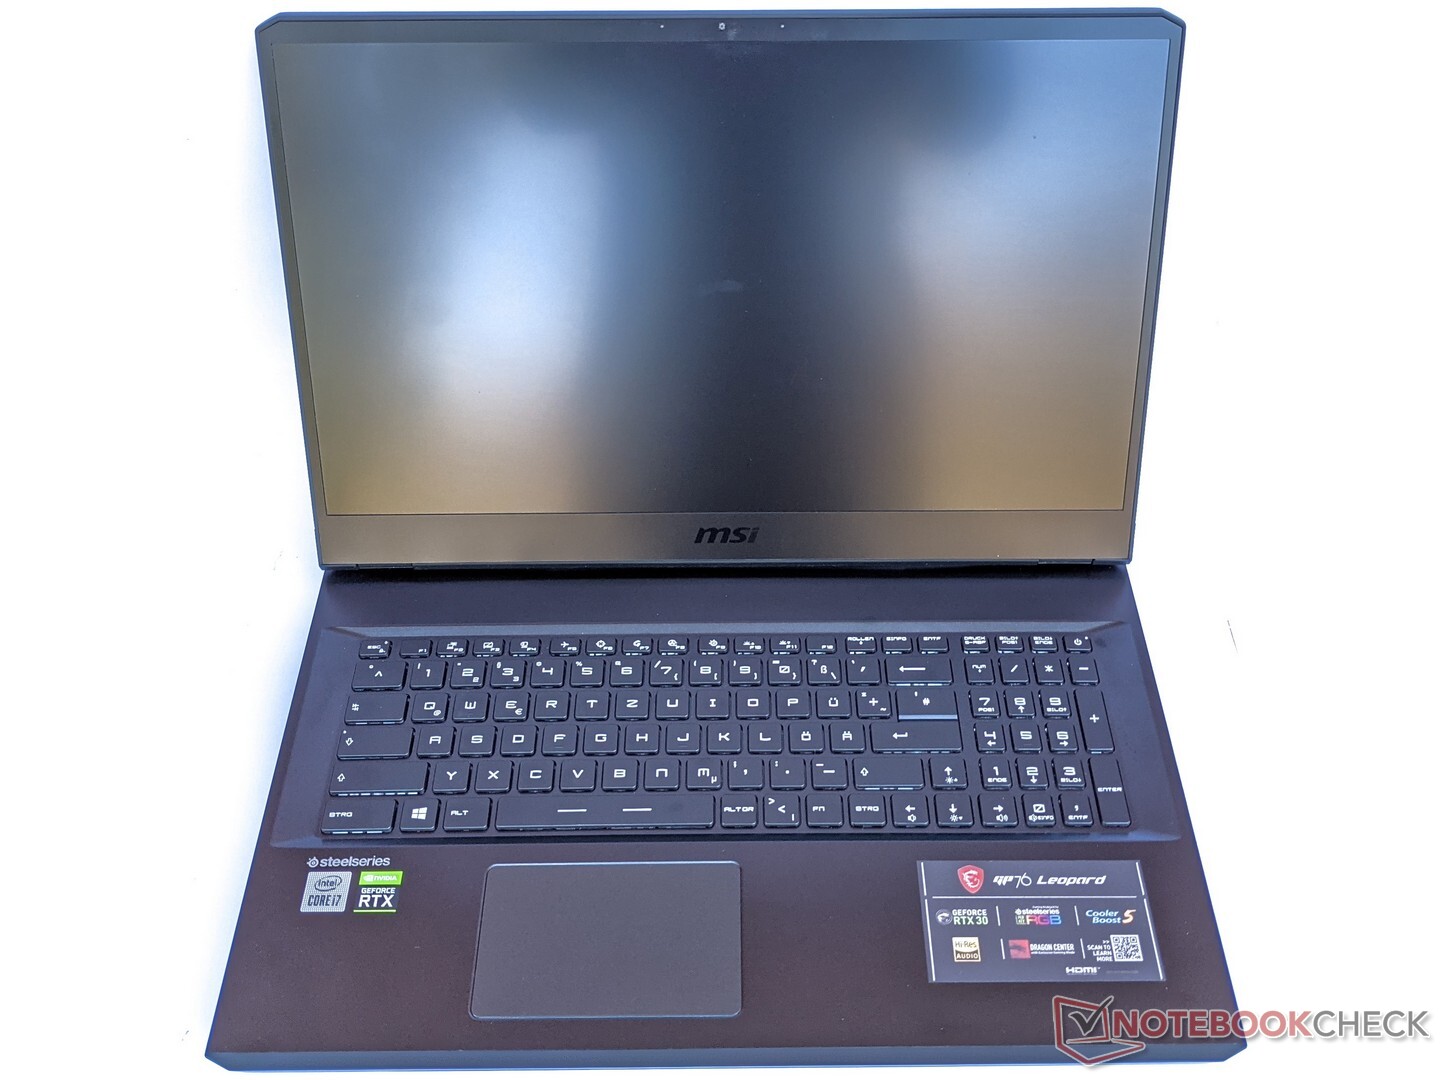
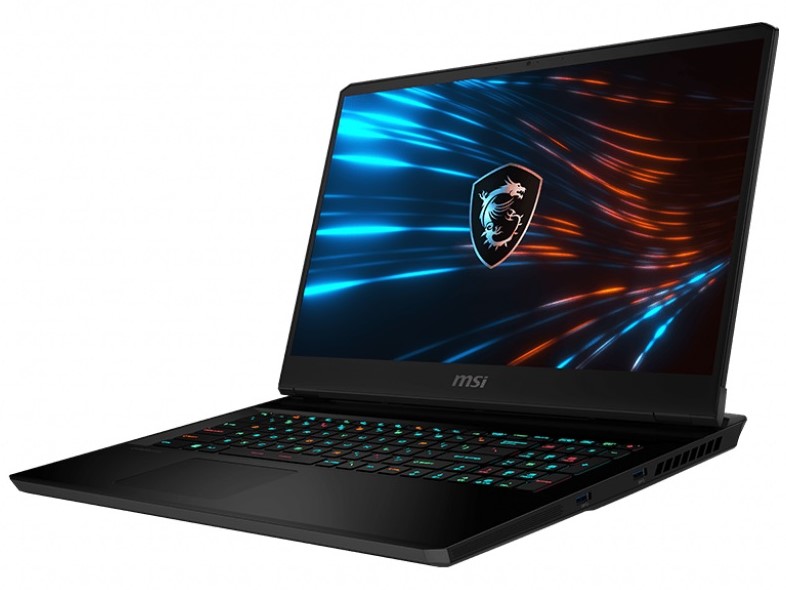
MSI GP76 Leopard 10UG är en klassisk spellaptop. Då den kommer med en 144 Hz-skärm på 17 tum kan den inte betraktas som liten, men det finns exempelvis inga större skillnader i tjocklek jämfört med enheter på 15 tum. Höjdpunkten är en mobil Nvidia GeForce RTX 3070 som körs i maximalt TGP-läge på 140 Watt. Detta ger ganska mycket högre grafikprestanda jämfört med de strypta varianterna och ger därför lite högre FPS i spel.
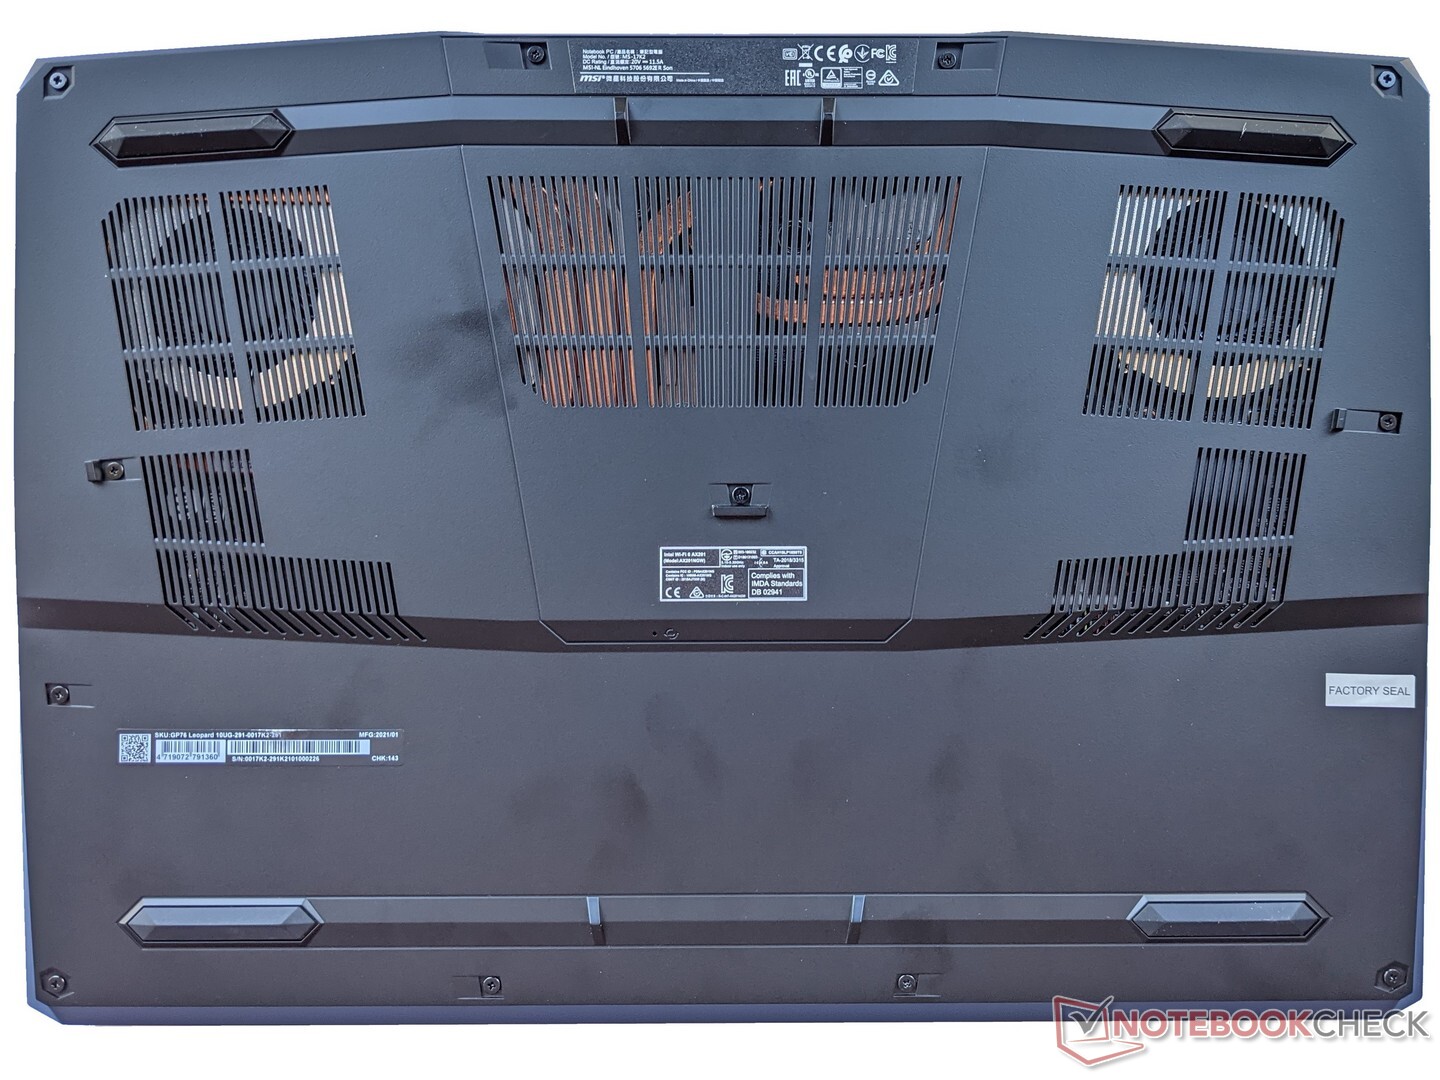
MSI GP76 Leopard 10UG kan visa moderna spel på sin skärm utan problem. Men det är onödigt svårt att utföra service på den.
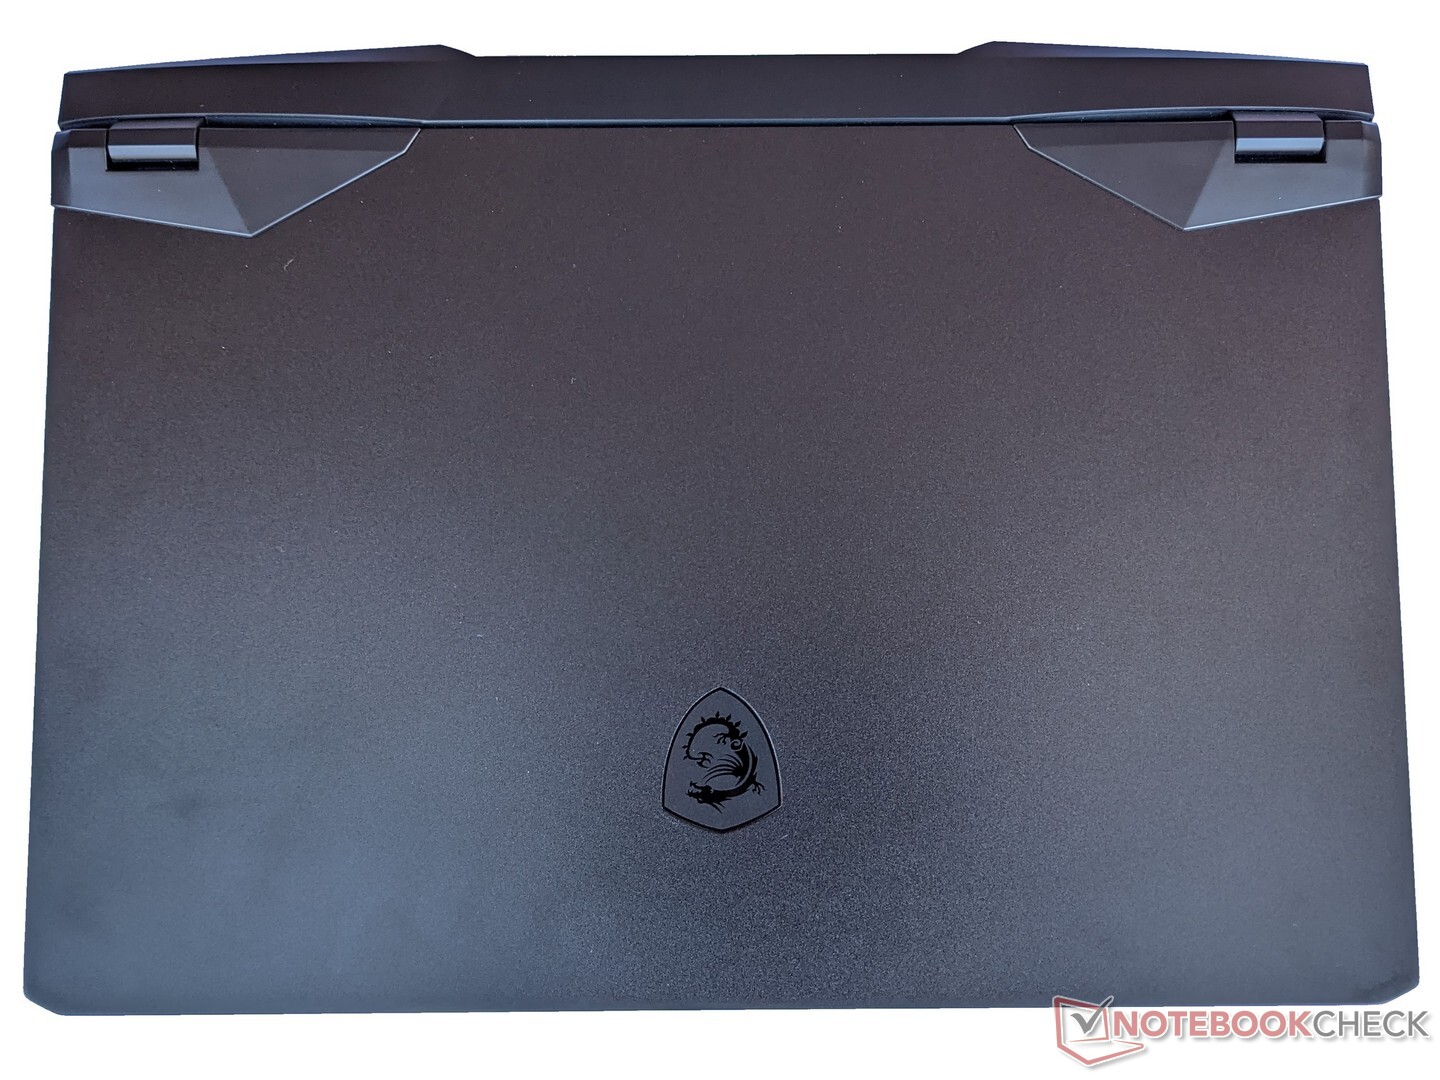
Inga nedskärningar har gjorts på den övriga utrustningen heller, vilket gör GP76 Leopard till en högkvalitativ spellaptop som passar till lite allt möjligt. Vi hade däremot gärna sett att det var lättare att komma åt insidan. Understycket är inte bara fastskruvat och ikrokat, utan det går runt datorns framsida och nästan upp till hörnen. Som ett resultat måste man ta loss framstycket också, så alla krokar lossnar på baksidan och sidorna. Detta är väldigt opraktiskt och svårt att genomföra för den som är ovan, vilket gör det onödigt svårt att lägga till en andra SSD-enhet eller mer RAM.
MSI GP76 Leopard 10UG
- 03/05/2021 v7 (old)
Mike Wobker
Price comparison
