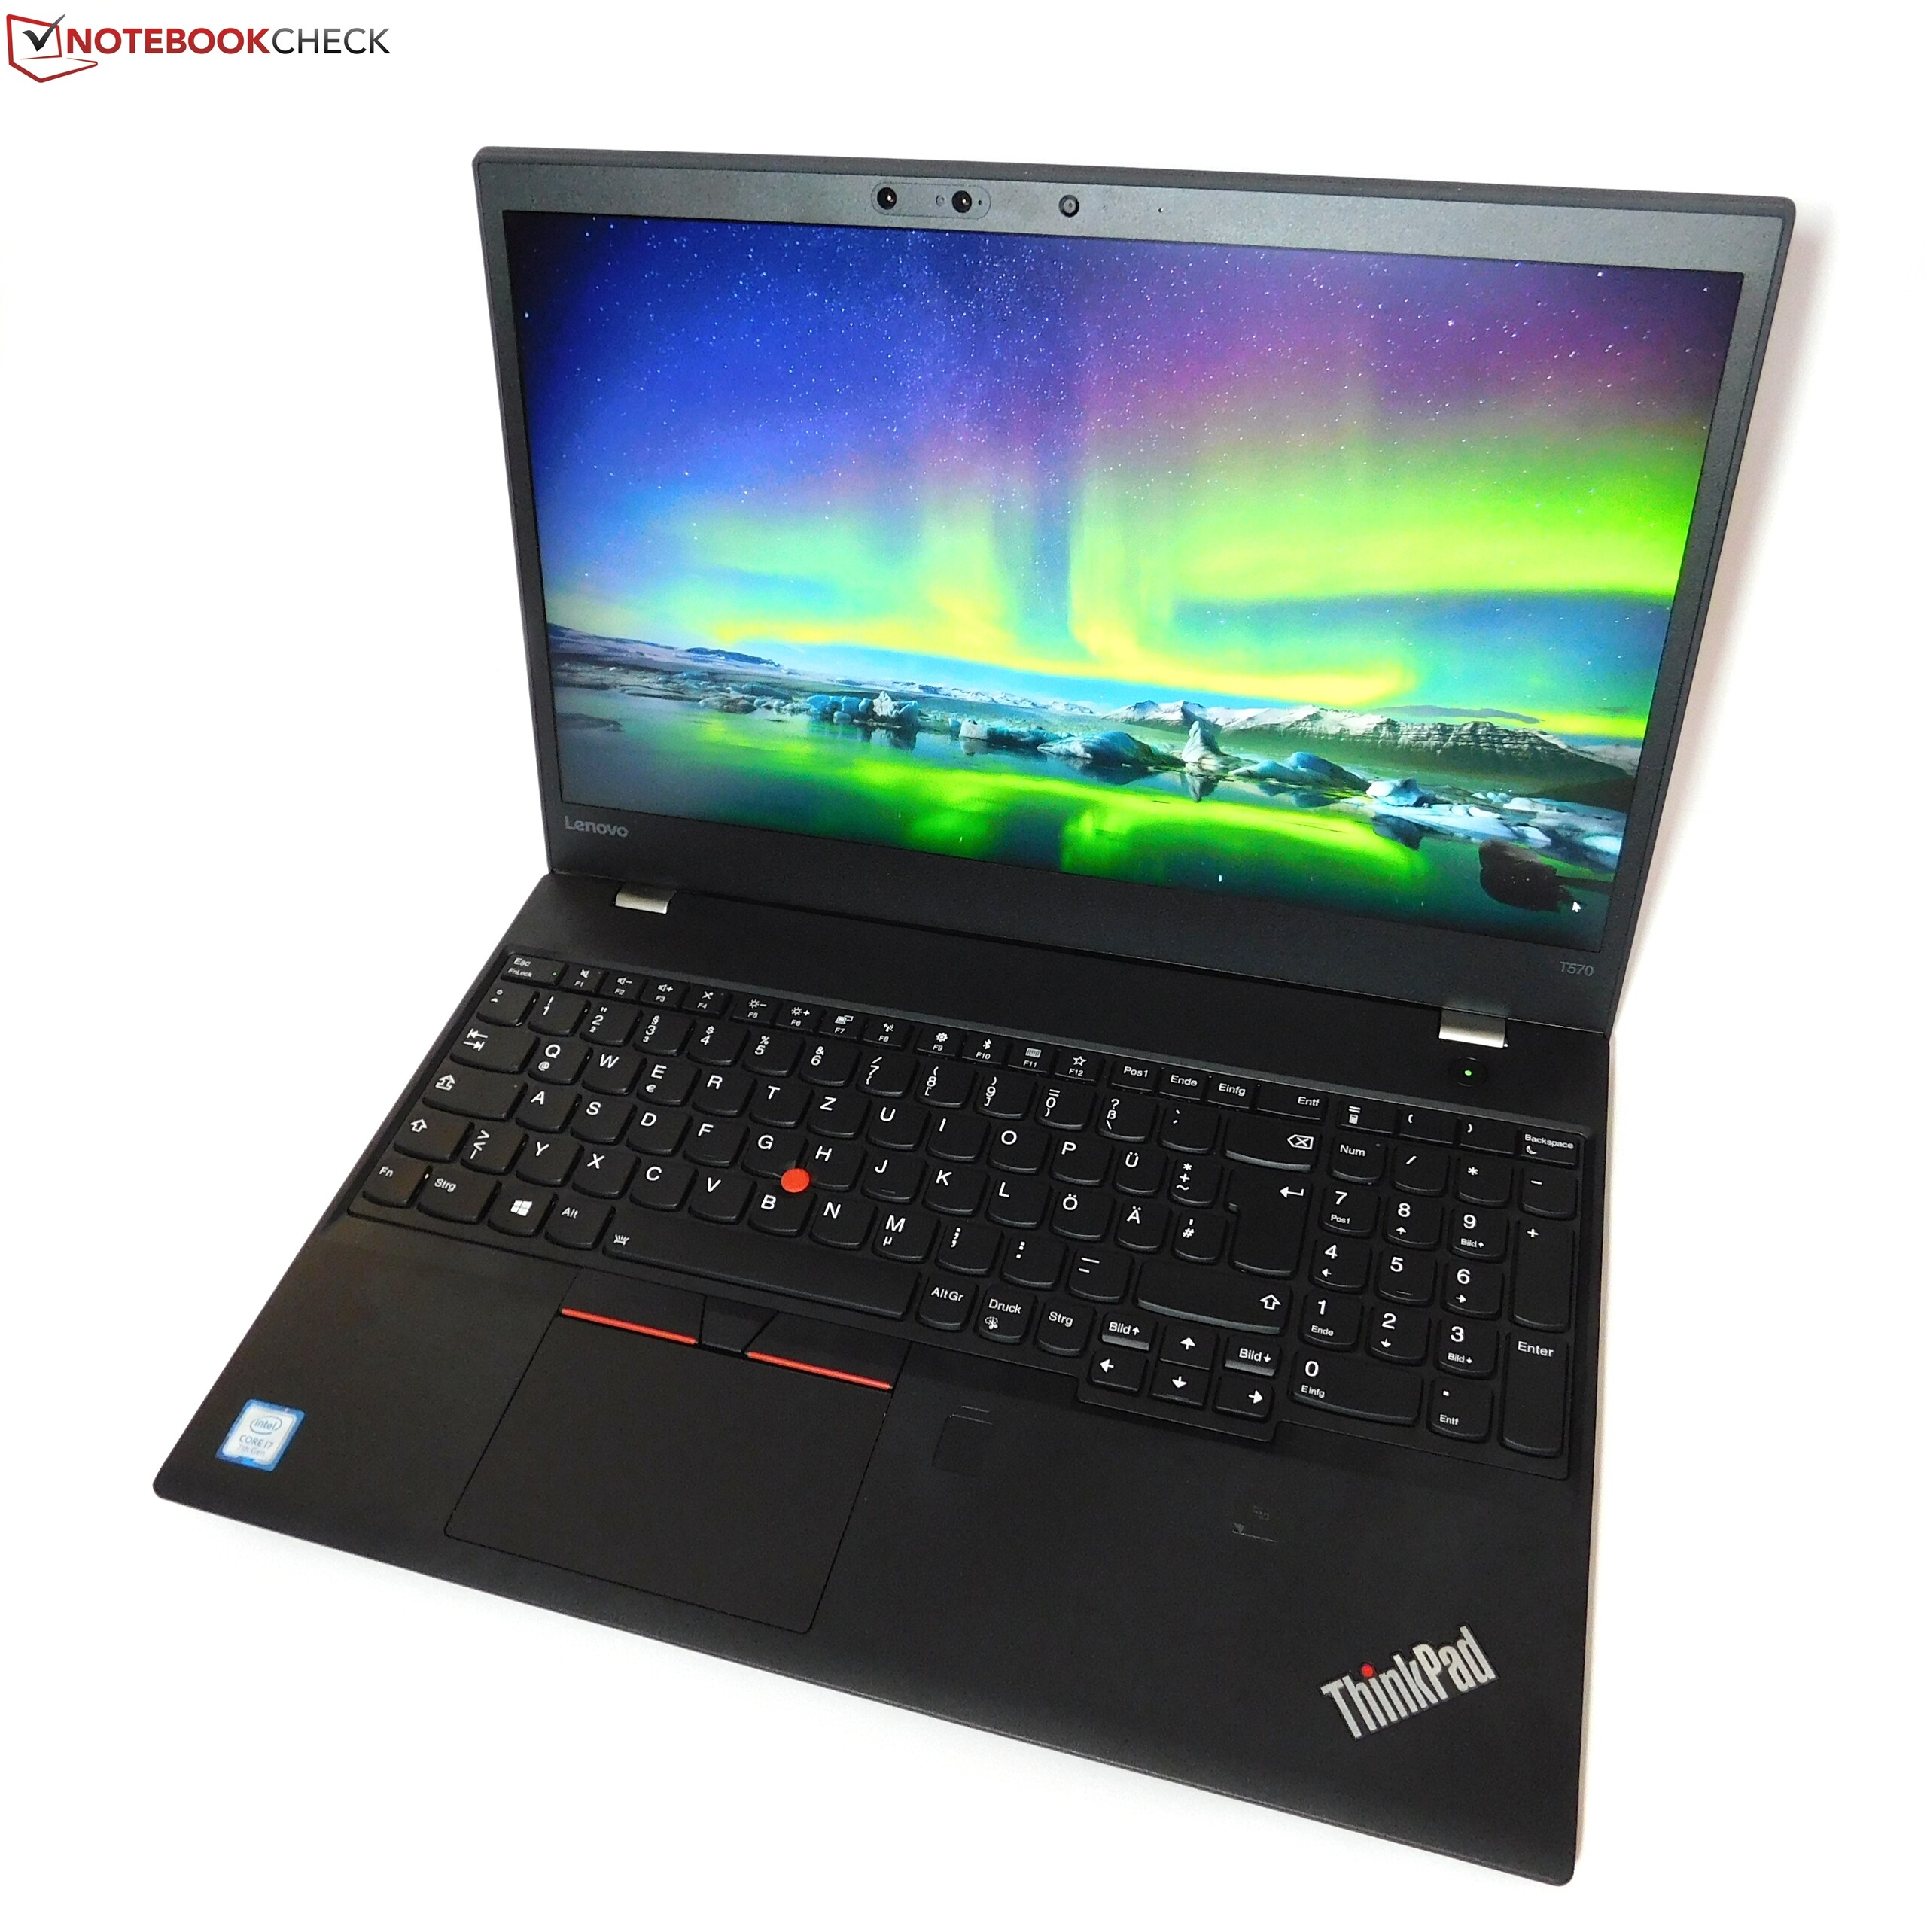
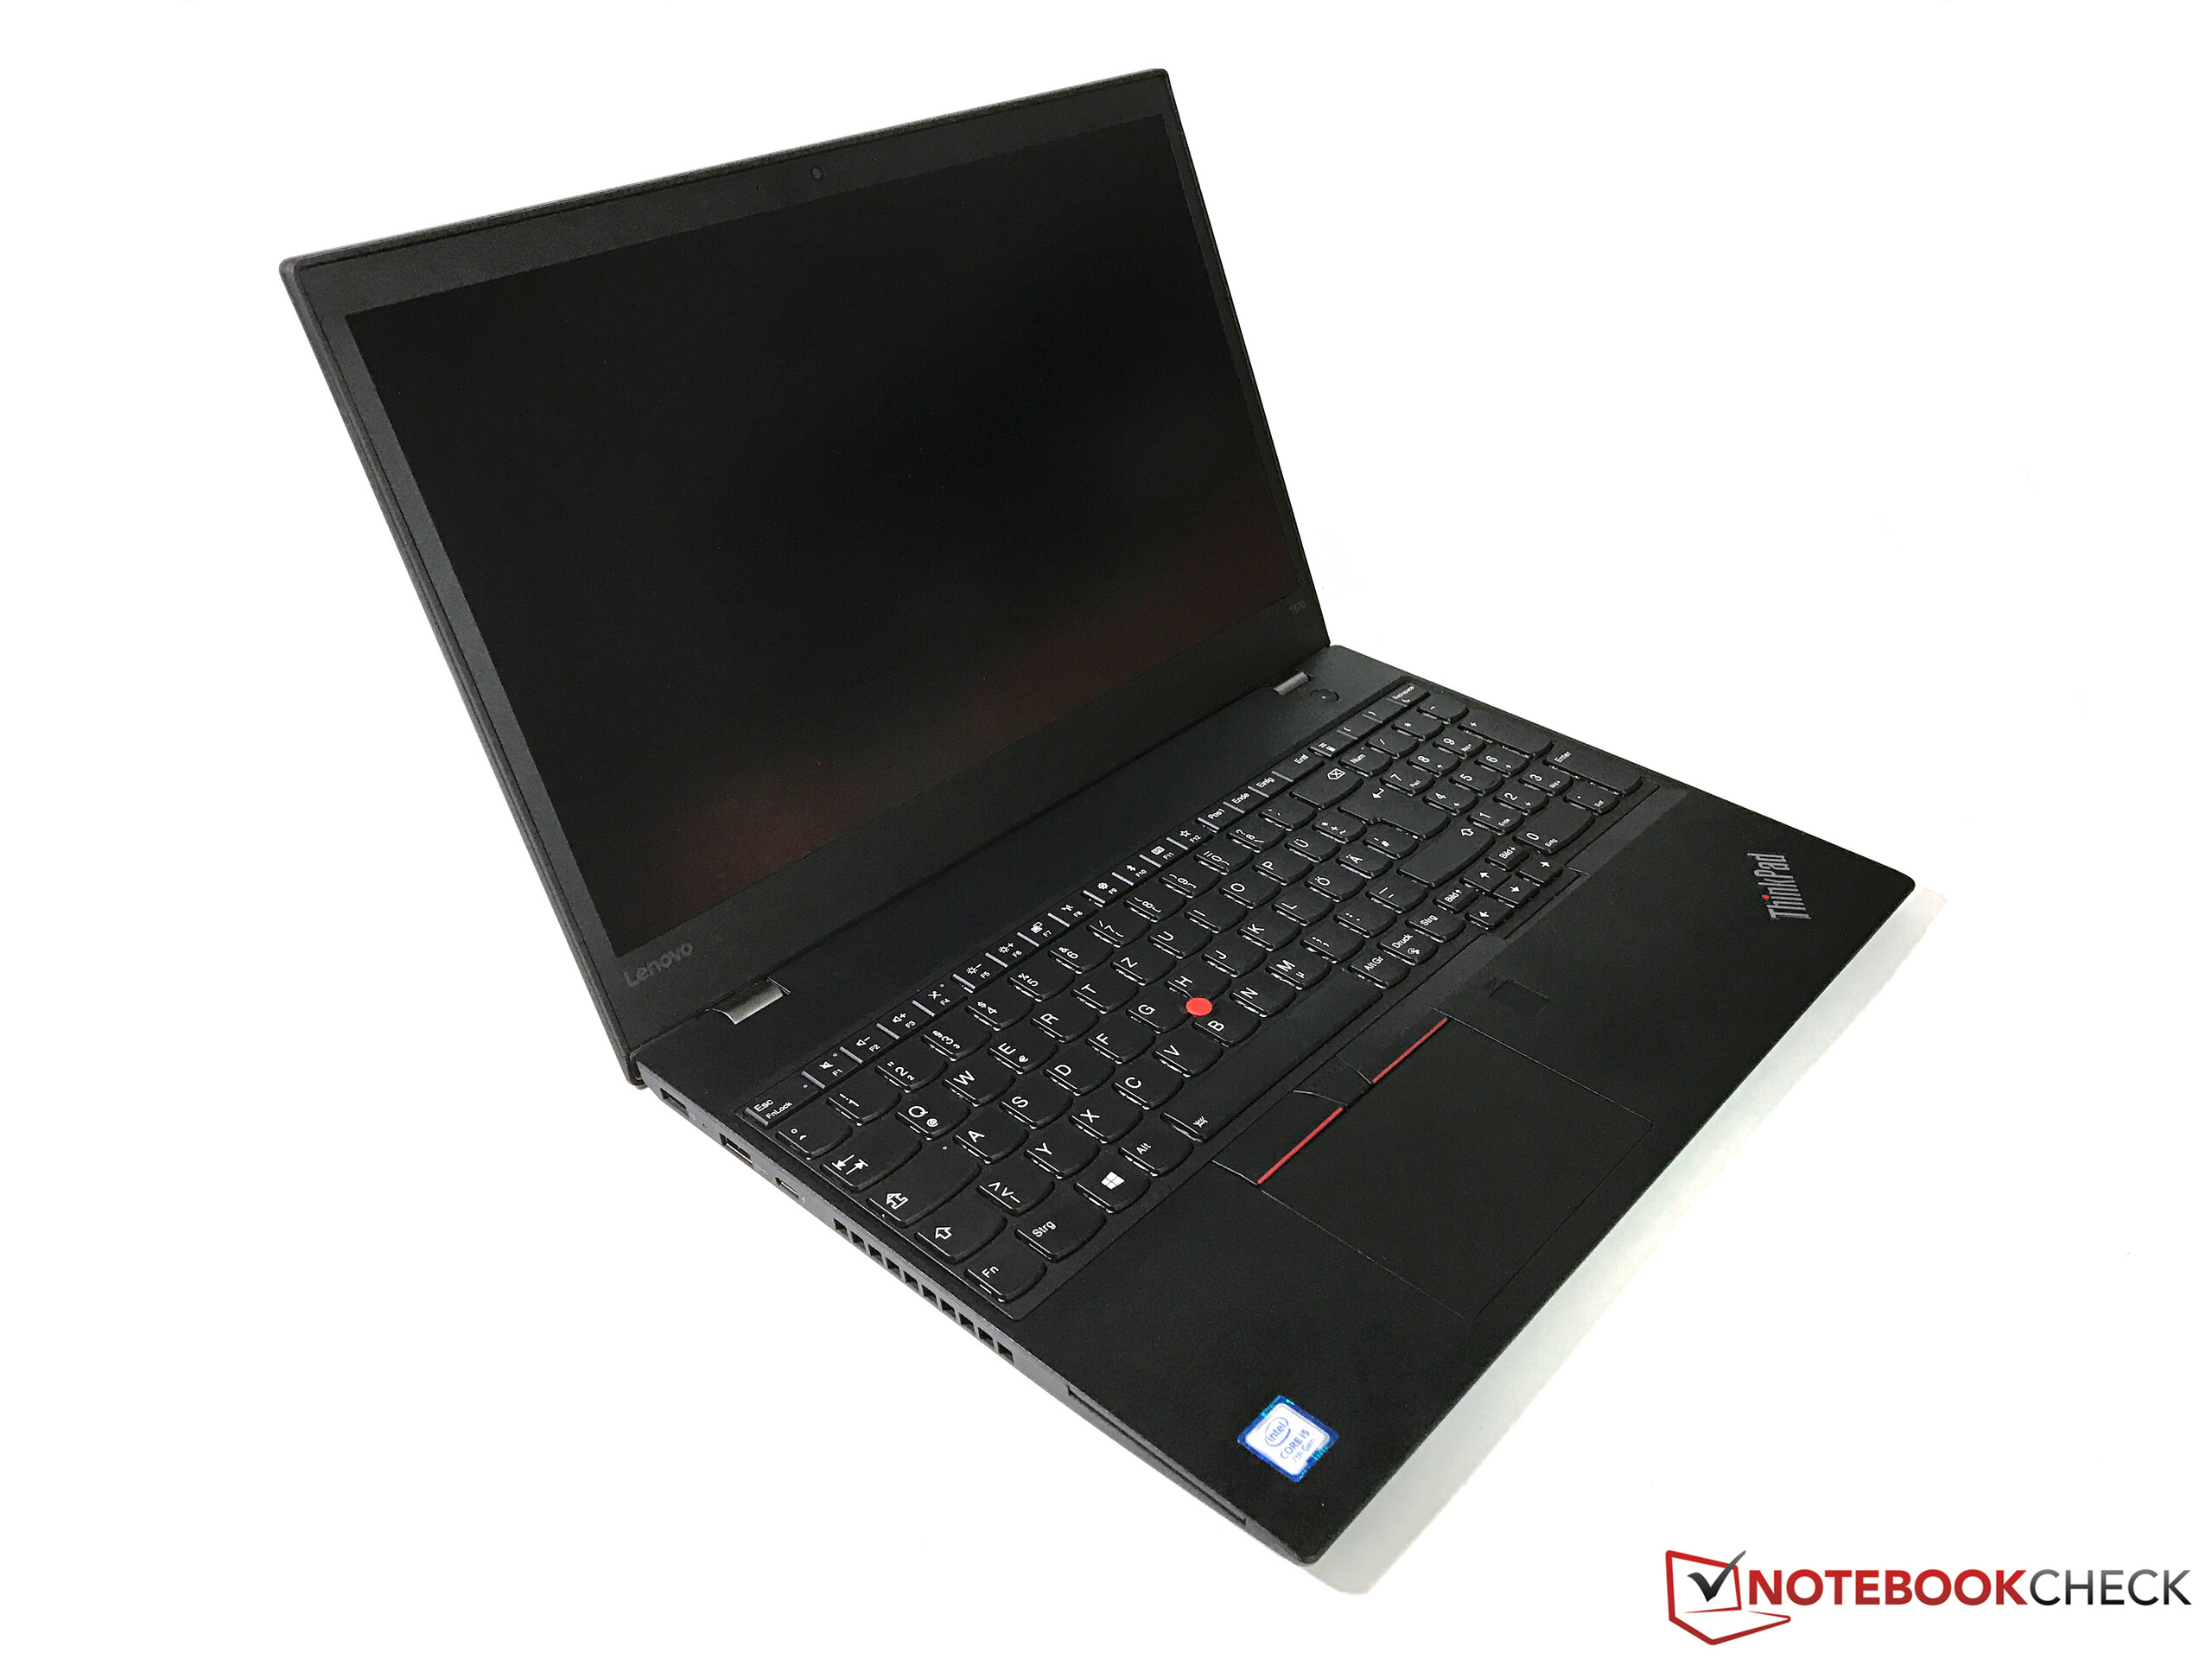
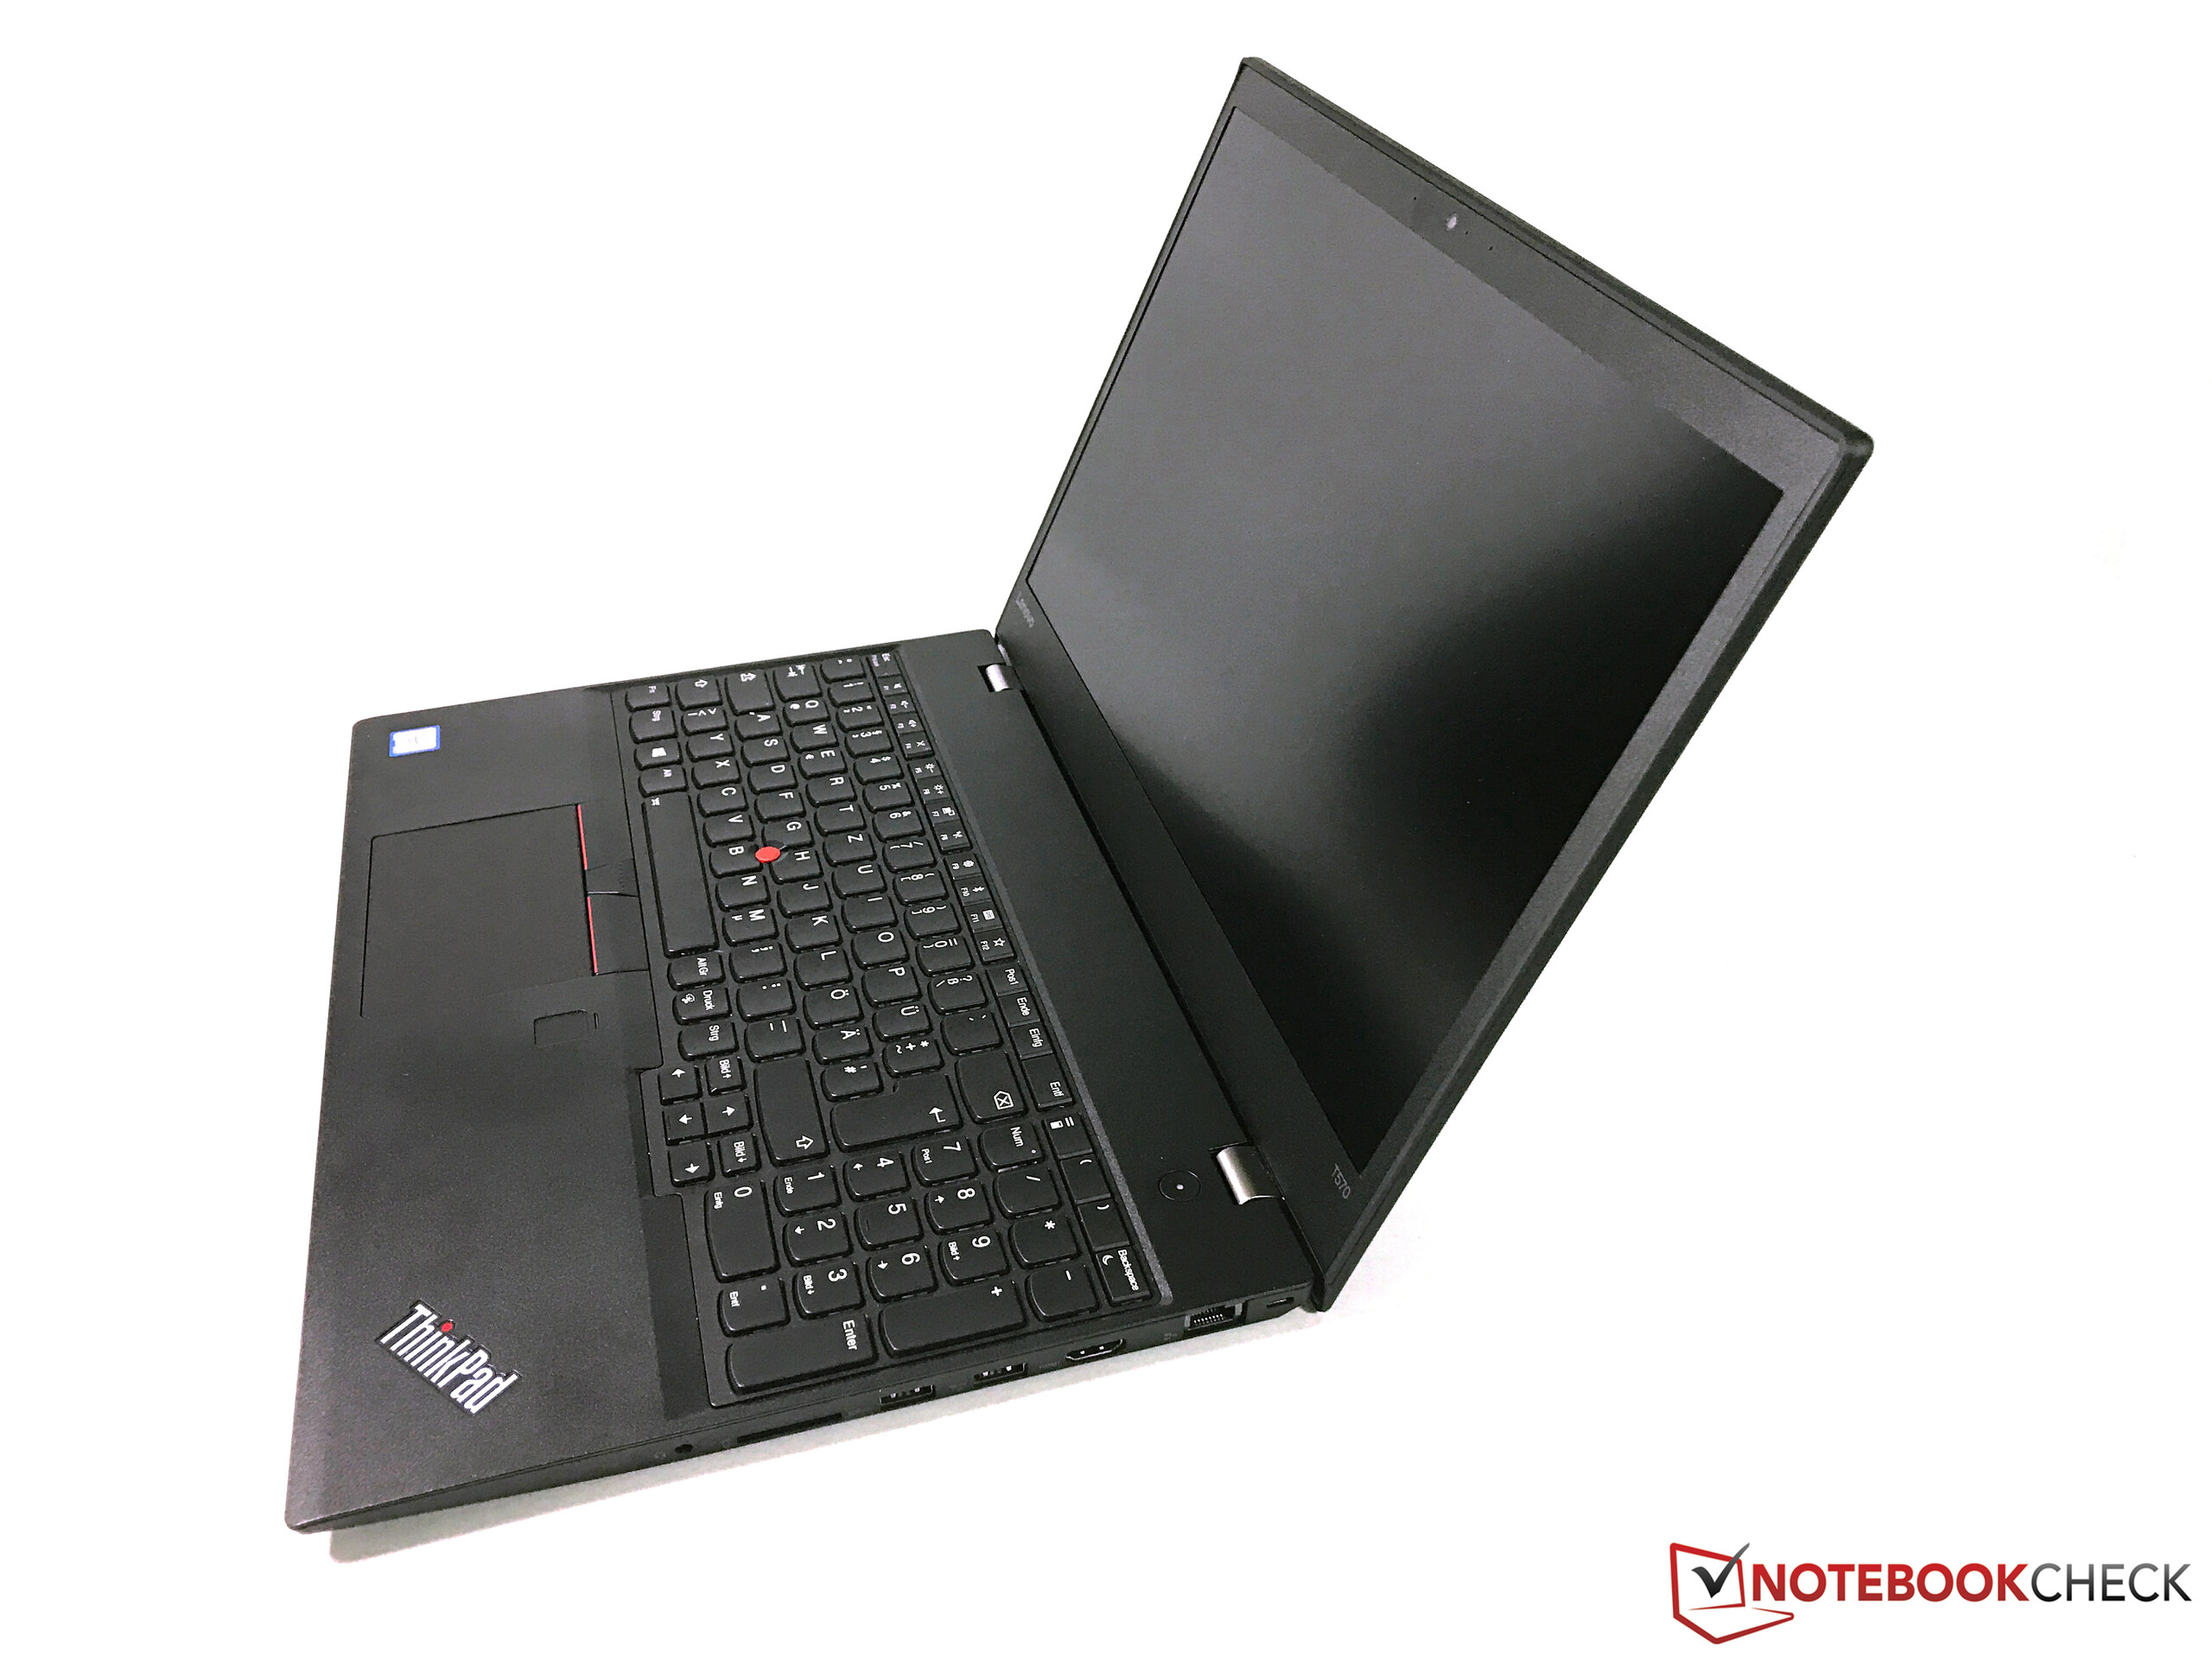
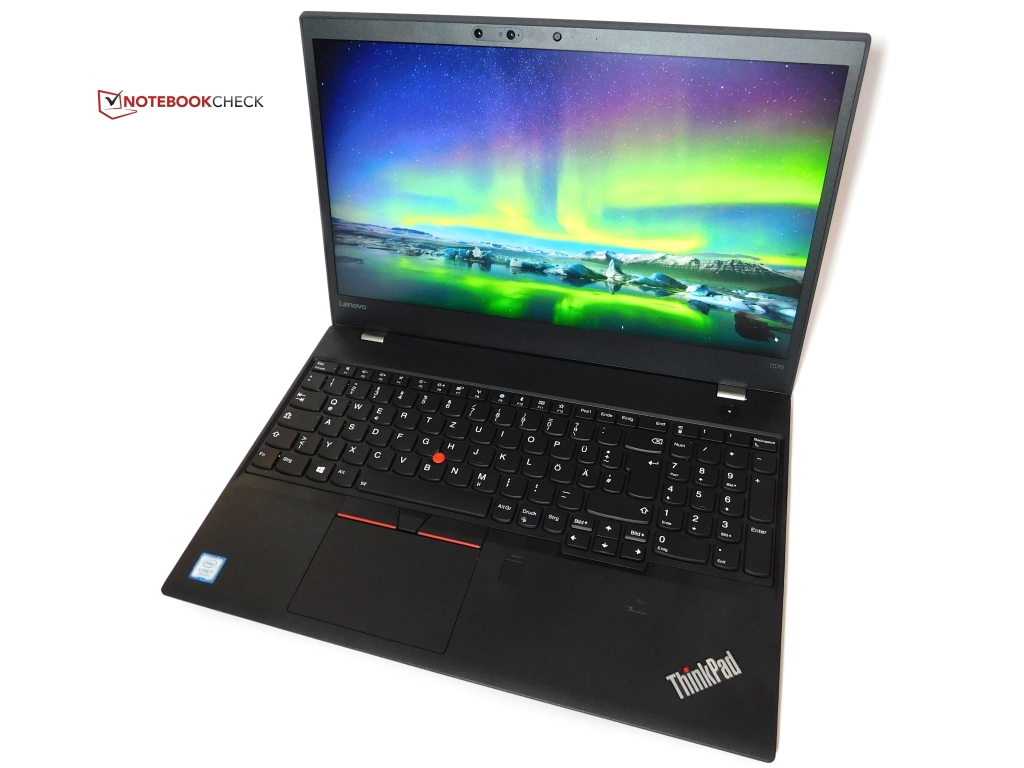
Test: Lenovo ThinkPad T570 (Core i7, 4K, 940MX) (sammanfattning)
| SD Card Reader | |
| average JPG Copy Test (av. of 3 runs) | |
| Lenovo ThinkPad T570-20HAS01E00 | |
| Fujitsu LifeBook U757 | |
| HP EliteBook 850 G4-Z2W86ET | |
| Dell XPS 15 2017 9560 (7300HQ, Full-HD) | |
| maximum AS SSD Seq Read Test (1GB) | |
| Dell XPS 15 2017 9560 (7300HQ, Full-HD) | |
| Lenovo ThinkPad T570-20HAS01E00 | |
| HP EliteBook 850 G4-Z2W86ET | |
| Fujitsu LifeBook U757 | |
| Networking | |
| iperf3 transmit AX12 | |
| Apple MacBook Pro 15 2016 (2.6 GHz, 450) (Klaus I211) | |
| Dell XPS 15 2017 9560 (7300HQ, Full-HD) | |
| HP EliteBook 850 G4-Z2W86ET | |
| Fujitsu LifeBook U757 | |
| Lenovo ThinkPad T570-20HAS01E00 | |
| iperf3 receive AX12 | |
| Apple MacBook Pro 15 2016 (2.6 GHz, 450) (Klaus I211) | |
| Dell XPS 15 2017 9560 (7300HQ, Full-HD) | |
| Lenovo ThinkPad T570-20HAS01E00 | |
| Fujitsu LifeBook U757 | |
| HP EliteBook 850 G4-Z2W86ET | |
| |||||||||||||||||||||||||
Distribution av ljusstyrkan: 89 %
Mitt på batteriet: 339 cd/m²
Kontrast: 942:1 (Svärta: 0.36 cd/m²)
ΔE ColorChecker Calman: 4.2 | ∀{0.5-29.43 Ø4.71}
ΔE Greyscale Calman: 5.1 | ∀{0.09-98 Ø4.96}
91% sRGB (Argyll 1.6.3 3D)
59.4% AdobeRGB 1998 (Argyll 1.6.3 3D)
66.7% AdobeRGB 1998 (Argyll 3D)
91.1% sRGB (Argyll 3D)
70% Display P3 (Argyll 3D)
Gamma: 2.16
CCT: 6569 K
Skärmflimmer / PWM (Puls-Width Modulation)
| Skärmflimmer / PWM upptäckt | 926 Hz | ≤ 90 % ljusstyrka inställning | 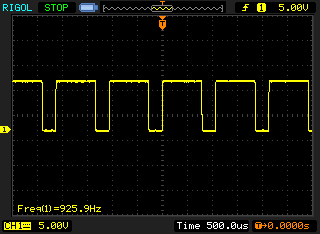 |
Displayens bakgrundsbelysning flimrar vid 926 Hz (i värsta fall, t.ex. med PWM) Flimrande upptäckt vid en ljusstyrkeinställning på 90 % och lägre. Det ska inte finnas något flimmer eller PWM över denna ljusstyrkeinställning. Frekvensen för 926 Hz är ganska hög, så de flesta användare som är känsliga för PWM bör inte märka något flimmer. Som jämförelse: 52 % av alla testade enheter använder inte PWM för att dämpa skärmen. Om PWM upptäcktes mättes ett medelvärde av 7744 (minst: 5 - maximum: 343500) Hz. | |||
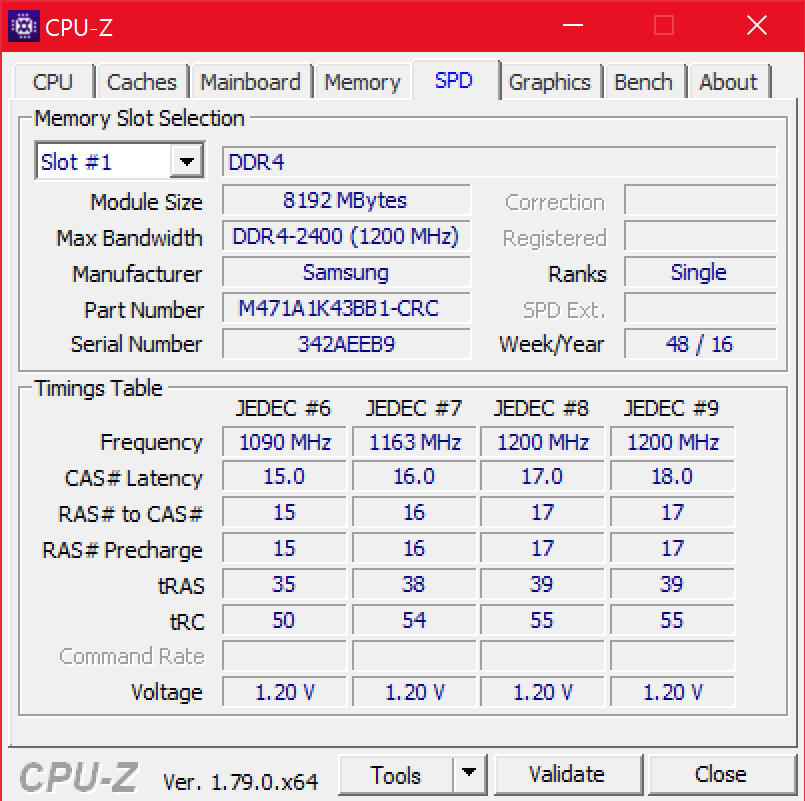
| Lenovo ThinkPad T570-20HAS01E00 BOE NV156QUM-N44, , 3840x2160, 15.6" | Lenovo ThinkPad T570-20H90002GE N156HCA-EAA, , 1920x1080, 15.6" | Lenovo ThinkPad T560-20FH002RGE Panasonic VVX16T028J00, , 2880x1620, 15.6" | HP EliteBook 850 G4-Z2W86ET AUO35ED, , 1920x1080, 15.6" | Fujitsu LifeBook U757 LP156WF6-SPP1, , 1920x1080, 15.6" | Apple MacBook Pro 15 2016 (2.6 GHz, 450) 2880x1800, 15.4" | Dell XPS 15 9560 (i7-7700HQ, UHD) 3840x2160, 15.6" | |
|---|---|---|---|---|---|---|---|
| Display | -32% | -5% | -13% | -7% | 29% | ||
| Display P3 Coverage (%) | 70 | 44.08 -37% | 64.4 -8% | 56.8 -19% | 65.8 -6% | 89.7 28% | |
| sRGB Coverage (%) | 91.1 | 65.6 -28% | 87.8 -4% | 83.7 -8% | 84.8 -7% | 100 10% | |
| AdobeRGB 1998 Coverage (%) | 66.7 | 45.66 -32% | 64.1 -4% | 58.7 -12% | 62 -7% | 100 50% | |
| Response Times | -19% | -13% | -7% | -31% | -60% | -98% | |
| Response Time Grey 50% / Grey 80% * (ms) | 41.6 ? | 41.6 ? -0% | 32.8 ? 21% | 47.2 ? -13% | 36 ? 13% | 47.3 ? -14% | 57.2 ? -38% |
| Response Time Black / White * (ms) | 15.2 ? | 20.8 ? -37% | 22.4 ? -47% | 15.2 ? -0% | 26.4 ? -74% | 31.2 ? -105% | 39.2 ? -158% |
| PWM Frequency (Hz) | 926 ? | 26040 ? | 220 ? | 199.2 ? | 117000 ? | 962 | |
| Screen | -6% | -11% | -65% | -1% | 45% | 4% | |
| Brightness middle (cd/m²) | 339 | 262 -23% | 339 0% | 338 0% | 313 -8% | 483 42% | 370.1 9% |
| Brightness (cd/m²) | 314 | 245 -22% | 322 3% | 341 9% | 294 -6% | 465 48% | 356 13% |
| Brightness Distribution (%) | 89 | 89 0% | 88 -1% | 90 1% | 84 -6% | 92 3% | 87 -2% |
| Black Level * (cd/m²) | 0.36 | 0.24 33% | 0.32 11% | 0.81 -125% | 0.27 25% | 0.33 8% | 0.37 -3% |
| Contrast (:1) | 942 | 1092 16% | 1059 12% | 417 -56% | 1159 23% | 1464 55% | 1000 6% |
| Colorchecker dE 2000 * | 4.2 | 4.5 -7% | 5.88 -40% | 10.9 -160% | 4.5 -7% | 1.4 67% | 5.3 -26% |
| Colorchecker dE 2000 max. * | 7.8 | 10.5 -35% | 11.08 -42% | 18.7 -140% | 10.5 -35% | 3 62% | 9.9 -27% |
| Greyscale dE 2000 * | 5.1 | 3.5 31% | 7.41 -45% | 13.3 -161% | 4 22% | 1.5 71% | 4.6 10% |
| Gamma | 2.16 102% | 2.32 95% | 2.36 93% | 2.11 104% | 2.24 98% | 2.34 94% | 2.31 95% |
| CCT | 6569 99% | 6524 100% | 6036 108% | 16030 41% | 6387 102% | 6650 98% | 6284 103% |
| Color Space (Percent of AdobeRGB 1998) (%) | 59.4 | 42.04 -29% | 57.14 -4% | 53.8 -9% | 55.3 -7% | 88.3 49% | |
| Color Space (Percent of sRGB) (%) | 91 | 65.4 -28% | 87.68 -4% | 83.4 -8% | 84.74 -7% | 100 10% | |
| Totalt genomsnitt (program/inställningar) | -19% /
-13% | -10% /
-10% | -28% /
-47% | -13% /
-6% | -8% /
24% | -22% /
-5% |
* ... mindre är bättre
Visa svarstider
| ↔ Svarstid svart till vitt | ||
|---|---|---|
| 15.2 ms ... stiga ↗ och falla ↘ kombinerat | ↗ 2 ms stiga | 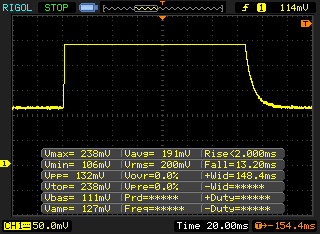 |
| ↘ 13.2 ms hösten | ||
| Skärmen visar bra svarsfrekvens i våra tester, men kan vara för långsam för konkurrenskraftiga spelare. I jämförelse sträcker sig alla testade enheter från 0.1 (minst) till 240 (maximalt) ms. » 37 % av alla enheter är bättre. Det betyder att den uppmätta svarstiden är bättre än genomsnittet av alla testade enheter (19.8 ms). | ||
| ↔ Svarstid 50 % grått till 80 % grått | ||
| 41.6 ms ... stiga ↗ och falla ↘ kombinerat | ↗ 13.2 ms stiga | 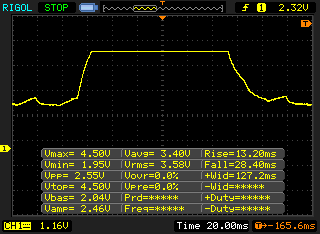 |
| ↘ 28.4 ms hösten | ||
| Skärmen visar långsamma svarsfrekvenser i våra tester och kommer att vara otillfredsställande för spelare. I jämförelse sträcker sig alla testade enheter från 0.165 (minst) till 636 (maximalt) ms. » 67 % av alla enheter är bättre. Detta innebär att den uppmätta svarstiden är sämre än genomsnittet av alla testade enheter (30.9 ms). | ||
| Cinebench R15 | |
| CPU Single 64Bit | |
| Dell XPS 15 9560 (i7-7700HQ, UHD) | |
| Lenovo ThinkPad T570-20HAS01E00 | |
| Apple MacBook Pro 15 2016 (2.6 GHz, 450) | |
| Fujitsu LifeBook U757 | |
| Lenovo ThinkPad T570-20H90002GE | |
| HP EliteBook 850 G4-Z2W86ET | |
| CPU Multi 64Bit | |
| Dell XPS 15 9560 (i7-7700HQ, UHD) | |
| Apple MacBook Pro 15 2016 (2.6 GHz, 450) | |
| Lenovo ThinkPad T570-20HAS01E00 | |
| Fujitsu LifeBook U757 | |
| HP EliteBook 850 G4-Z2W86ET | |
| Lenovo ThinkPad T570-20H90002GE | |
| PCMark 8 | |
| Home Score Accelerated v2 | |
| Apple MacBook Pro 15 2016 (2.6 GHz, 450) | |
| Dell XPS 15 9560 (i7-7700HQ, UHD) | |
| HP EliteBook 850 G4-Z2W86ET | |
| Lenovo ThinkPad T570-20H90002GE | |
| Fujitsu LifeBook U757 | |
| Lenovo ThinkPad T570-20HAS01E00 | |
| Work Score Accelerated v2 | |
| Lenovo ThinkPad T570-20H90002GE | |
| Apple MacBook Pro 15 2016 (2.6 GHz, 450) | |
| Dell XPS 15 9560 (i7-7700HQ, UHD) | |
| HP EliteBook 850 G4-Z2W86ET | |
| Lenovo ThinkPad T570-20HAS01E00 | |
| PCMark 8 Home Score Accelerated v2 | 3049 poäng | |
| PCMark 8 Work Score Accelerated v2 | 3892 poäng | |
Hjälp | ||
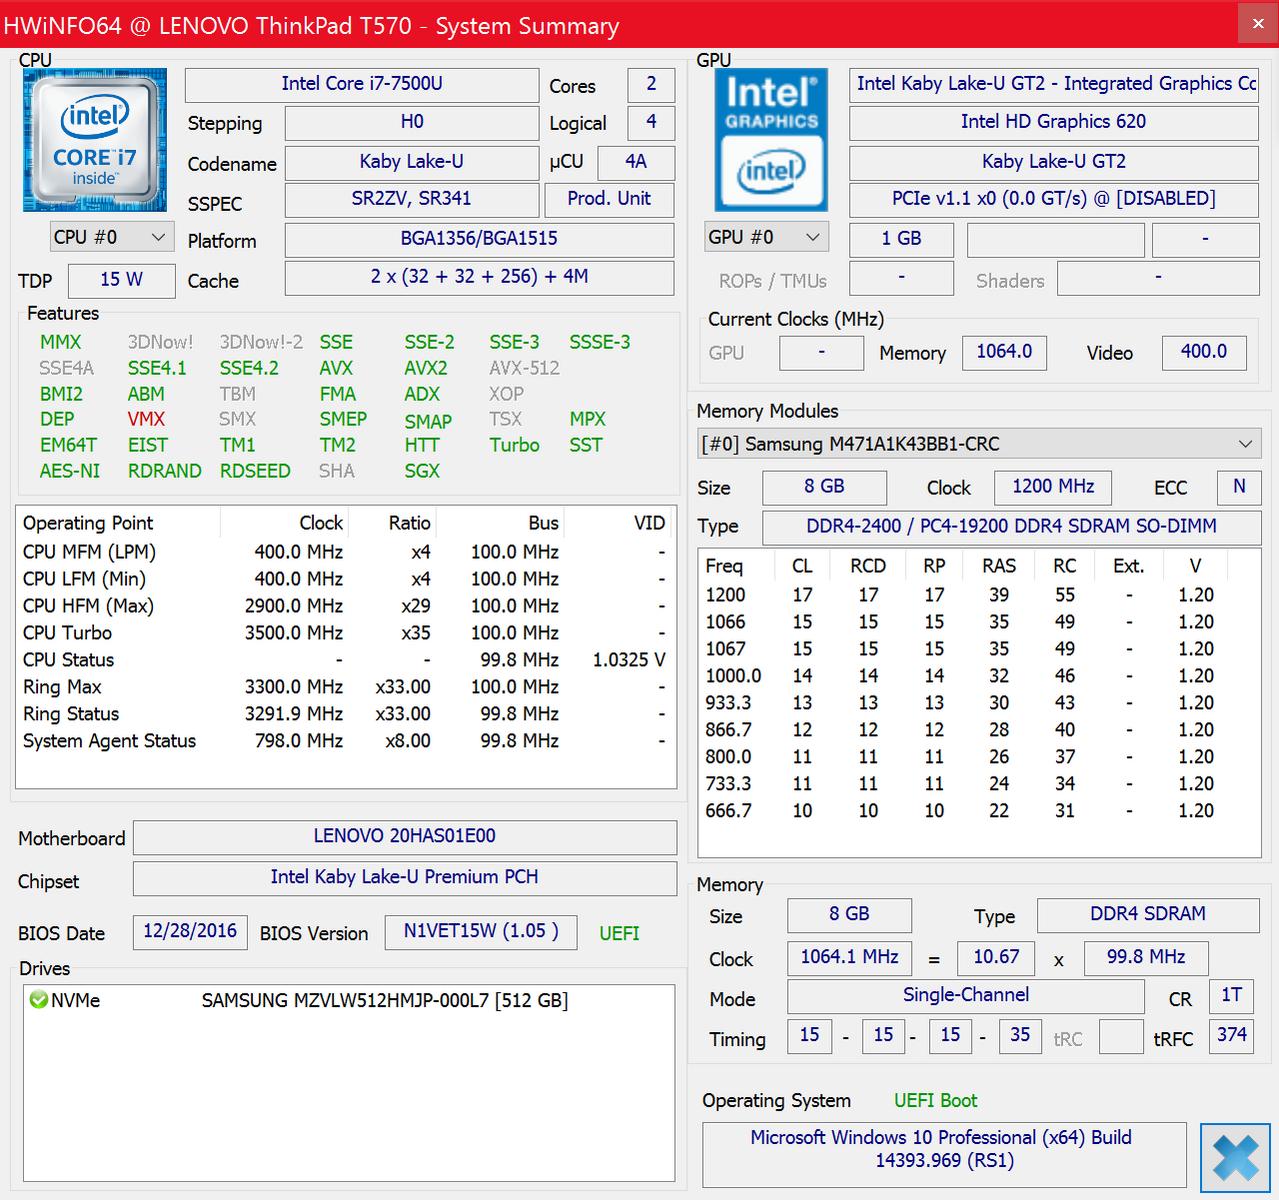
| Lenovo ThinkPad T570-20HAS01E00 Samsung PM961 NVMe MZVLW512HMJP | Lenovo ThinkPad T560-20FH002RGE Samsung SSD PM871 MZ7LN256HCHP | HP EliteBook 850 G4-Z2W86ET Samsung PM951 NVMe MZVLV256 | Fujitsu LifeBook U757 Samsung CM871a MZNTY256HDHP | Apple MacBook Pro 15 2016 (2.6 GHz, 450) Apple SSD SM0256L | Dell XPS 15 9560 (i7-7700HQ, UHD) Lite-On CX2-8B512-Q11 | Lenovo ThinkPad T470s-20HGS00V00 Samsung SSD PM961 1TB M.2 PCIe 3.0 x4 NVMe (MZVLW1T0) | |
|---|---|---|---|---|---|---|---|
| CrystalDiskMark 3.0 | -50% | -29% | -47% | -16% | 4% | 18% | |
| Read Seq (MB/s) | 1210 | 513 -58% | 1245 3% | 509 -58% | 1298 7% | 1684 39% | 1760 45% |
| Write Seq (MB/s) | 1134 | 306.1 -73% | 298.6 -74% | 488.4 -57% | 1343 18% | 1106 -2% | 1666 47% |
| Read 512 (MB/s) | 789 | 450.6 -43% | 673 -15% | 414.3 -47% | 842 7% | 977 24% | 832 5% |
| Write 512 (MB/s) | 903 | 305.5 -66% | 298.8 -67% | 321.7 -64% | 945 5% | 1119 24% | 1064 18% |
| Read 4k (MB/s) | 58.4 | 33.4 -43% | 41.79 -28% | 36.43 -38% | 9.8 -83% | 45.14 -23% | 53.2 -9% |
| Write 4k (MB/s) | 144.1 | 85.6 -41% | 138.4 -4% | 88.4 -39% | 13 -91% | 134.1 -7% | 167.4 16% |
| Read 4k QD32 (MB/s) | 559 | 346.9 -38% | 495 -11% | 402.8 -28% | 630 13% | 509 -9% | 630 13% |
| Write 4k QD32 (MB/s) | 474.4 | 278.9 -41% | 297.5 -37% | 256.7 -46% | 443 -7% | 398.1 -16% | 533 12% |

| 3DMark 11 - 1280x720 Performance GPU | |
| Apple MacBook Pro 15 2016 (2.6 GHz, 450) | |
| Lenovo ThinkPad T570-20HAS01E00 | |
| Lenovo ThinkPad T560-20FH002RGE | |
| Lenovo ThinkPad T570-20H90002GE | |
| HP EliteBook 850 G4-Z2W86ET | |
| Fujitsu LifeBook U757 | |
| 3DMark | |
| 1280x720 Cloud Gate Standard Graphics | |
| Dell XPS 15 9560 (i7-7700HQ, UHD) | |
| Apple MacBook Pro 15 2016 (2.6 GHz, 450) | |
| Lenovo ThinkPad T570-20HAS01E00 | |
| Lenovo ThinkPad T560-20FH002RGE | |
| Lenovo ThinkPad T570-20H90002GE | |
| HP EliteBook 850 G4-Z2W86ET | |
| 1920x1080 Fire Strike Graphics | |
| Dell XPS 15 9560 (i7-7700HQ, UHD) | |
| Apple MacBook Pro 15 2016 (2.6 GHz, 450) | |
| Lenovo ThinkPad T570-20HAS01E00 | |
| Lenovo ThinkPad T560-20FH002RGE | |
| Lenovo ThinkPad T570-20H90002GE | |
| HP EliteBook 850 G4-Z2W86ET | |
| 3DMark 11 Performance | 2931 poäng | |
| 3DMark Cloud Gate Standard Score | 8308 poäng | |
| 3DMark Fire Strike Score | 2098 poäng | |
Hjälp | ||
| BioShock Infinite - 1366x768 High Preset | |
| Dell XPS 15 9560 (i7-7700HQ, UHD) | |
| Lenovo ThinkPad T570-20HAS01E00 | |
| Lenovo ThinkPad T560-20FH002RGE | |
| HP EliteBook 850 G4-Z2W86ET | |
| Lenovo ThinkPad T570-20H90002GE | |
| låg | med. | hög | ultra | 4K | |
|---|---|---|---|---|---|
| BioShock Infinite (2013) | 137.9 | 72.4 | 64.3 | 21.5 | |
| The Witcher 3 (2015) | 42.5 | 25.7 | 11.5 | ||
| Civilization 6 (2016) | 52.1 | 30.7 | 16.4 | 12.6 | 10.1 |
Ljudnivå
| Låg belastning |
| 29.3 / 29.3 / 31.1 dB(A) |
| Hög belastning |
| 35.2 / 41.3 dB(A) |
 | ||
30 dB tyst 40 dB(A) hörbar 50 dB(A) högt ljud |
||
min: | ||
(±) Den maximala temperaturen på ovansidan är 43.1 °C / 110 F, jämfört med genomsnittet av 34.3 °C / 94 F , allt från 21.2 till 62.5 °C för klassen Office.
(-) Botten värms upp till maximalt 55.4 °C / 132 F, jämfört med genomsnittet av 36.8 °C / 98 F
(+) Vid tomgångsbruk är medeltemperaturen för ovansidan 24 °C / 75 F, jämfört med enhetsgenomsnittet på 29.5 °C / ### class_avg_f### F.
(±) Handledsstöden och pekplattan kan bli väldigt varma vid beröring med maximalt 39.6 °C / 103.3 F.
(-) Medeltemperaturen för handledsstödsområdet på liknande enheter var 27.6 °C / 81.7 F (-12 °C / -21.6 F).
| Av/Standby | |
| Låg belastning | |
| Hög belastning |
|
Förklaring:
min: | |
| Lenovo ThinkPad T570-20HAS01E00 i7-7500U, GeForce 940MX, Samsung PM961 NVMe MZVLW512HMJP, IPS, 3840x2160, 15.6" | Lenovo ThinkPad T570-20H90002GE i5-7200U, HD Graphics 620, Samsung PM961 MZVLW256HEHP, IPS, 1920x1080, 15.6" | HP EliteBook 850 G4-Z2W86ET i5-7200U, HD Graphics 620, Samsung PM951 NVMe MZVLV256, TN LED, 1920x1080, 15.6" | Fujitsu LifeBook U757 i5-7200U, HD Graphics 620, Samsung CM871a MZNTY256HDHP, IPS LED, 1920x1080, 15.6" | Apple MacBook Pro 15 2016 (2.6 GHz, 450) 6700HQ, Radeon Pro 450, Apple SSD SM0256L, IPS, 2880x1800, 15.4" | Dell XPS 15 9560 (i7-7700HQ, UHD) i7-7700HQ, GeForce GTX 1050 Mobile, Lite-On CX2-8B512-Q11, IGZO IPS, 3840x2160, 15.6" | |
|---|---|---|---|---|---|---|
| Power Consumption | 31% | 39% | 33% | 2% | -83% | |
| Idle Minimum * (Watt) | 4.7 | 3.6 23% | 3.58 24% | 3.96 16% | 2.9 38% | 11.9 -153% |
| Idle Average * (Watt) | 9.9 | 7.7 22% | 5.97 40% | 7.74 22% | 9.7 2% | 17.1 -73% |
| Idle Maximum * (Watt) | 10.9 | 8.2 25% | 6.81 38% | 8.64 21% | 10.1 7% | 17.3 -59% |
| Load Average * (Watt) | 56.1 | 30.8 45% | 29.4 48% | 28.8 49% | 65 -16% | 94.7 -69% |
| Load Maximum * (Watt) | 75 | 46.1 39% | 39.7 47% | 32 57% | 89.5 -19% | 122 -63% |
| Witcher 3 ultra * (Watt) | 104.8 |
* ... mindre är bättre
| Lenovo ThinkPad T570-20HAS01E00 i7-7500U, GeForce 940MX, 56 Wh | Lenovo ThinkPad T570-20H90002GE i5-7200U, HD Graphics 620, 56 Wh | HP EliteBook 850 G4-Z2W86ET i5-7200U, HD Graphics 620, 51 Wh | Fujitsu LifeBook U757 i5-7200U, HD Graphics 620, 50 Wh | Apple MacBook Pro 15 2016 (2.6 GHz, 450) 6700HQ, Radeon Pro 450, 76 Wh | Dell XPS 15 9560 (i7-7700HQ, UHD) i7-7700HQ, GeForce GTX 1050 Mobile, 97 Wh | |
|---|---|---|---|---|---|---|
| Batteridrifttid | 24% | 22% | 6% | -6% | -11% | |
| Reader / Idle (h) | 13.3 | 19.5 47% | 18 35% | 13.9 5% | ||
| H.264 (h) | 8.1 | 9.8 21% | 10.6 31% | 8.6 6% | ||
| WiFi v1.3 (h) | 6.9 | 7.6 10% | 8.8 28% | 7.3 6% | 10 45% | 7.2 4% |
| Load (h) | 2.9 | 3.4 17% | 2.7 -7% | 0.9 -69% | 1.7 -41% |
För
Emot
Läs originaltestet på engelska här.
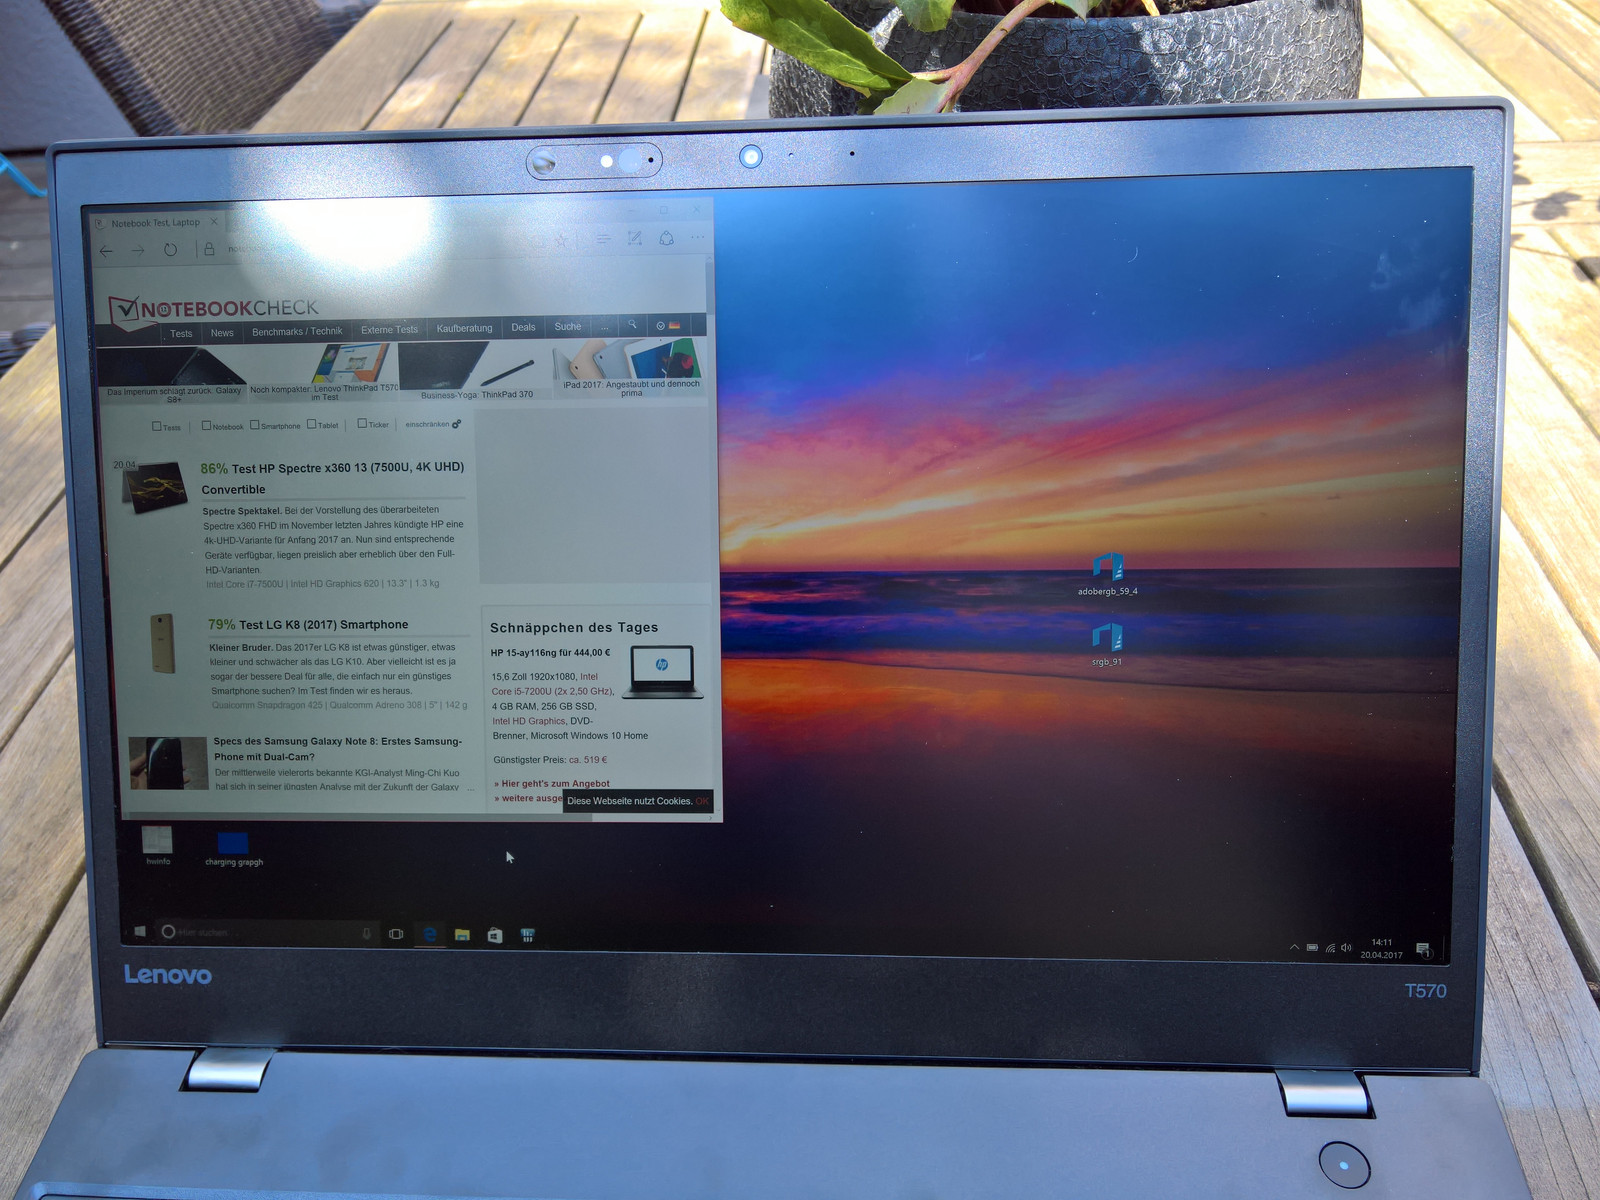
Den dyrare varianten av T570 har samma fördelar som den billigare modellen, inklusive det robusta, relativt kompakta chassit, de bekväma inmatningsenheterna och de många anslutningsalternativen. Praktiska funktioner som PowerBridge och den infraröda kameran gör T570 till en mycket flexibel bärbar dator. Förutom fördelarna med den billigare T570 tillkommer 4K-skärmen i den här modellen samt en Nvidia-GPU, som trots att den är en äldre modell är betydligt mer kraftfull än en integrerad Intel-GPU.
Men den här modellen är inte heller fri från problem. Vår största invändning är CPU-prestandan vid batteridrift. Ett annat nytt problem är värmeutvecklingen på bottenplattan under belastning, vilket troligen beror på grafikkortet. Dessutom är priset högt, och den medföljande strömförsörjningen räcker inte till under hög belastning.
Sammanfattningsvis kan T570 med 4K-skärm rekommenderas. Med den här skärmen har datorn förbättrats markant på en avgörande punkt där den billigare modellen var en besvikelse. Om det inte vore för prestandaminskningen under batteridrift skulle datorn ha fått omdömet "mycket bra". Med detta sagt är minskningen något mindre än med den första testenheten, eftersom grafikkortet inte påverkas av prestandastrypningen.
Det finns otaliga alternativ med 15,6-tums skärm, även om företagsmarknaden är mer fokuserad på 14-tumsformatet. MacBook Pro 15 och Dell XPS 15 är starka konkurrenter, som visserligen inte har samma företagsfunktioner, T570:s utmärkta tangentbord, men betydligt starkare GPU- och CPU-alternativ istället.
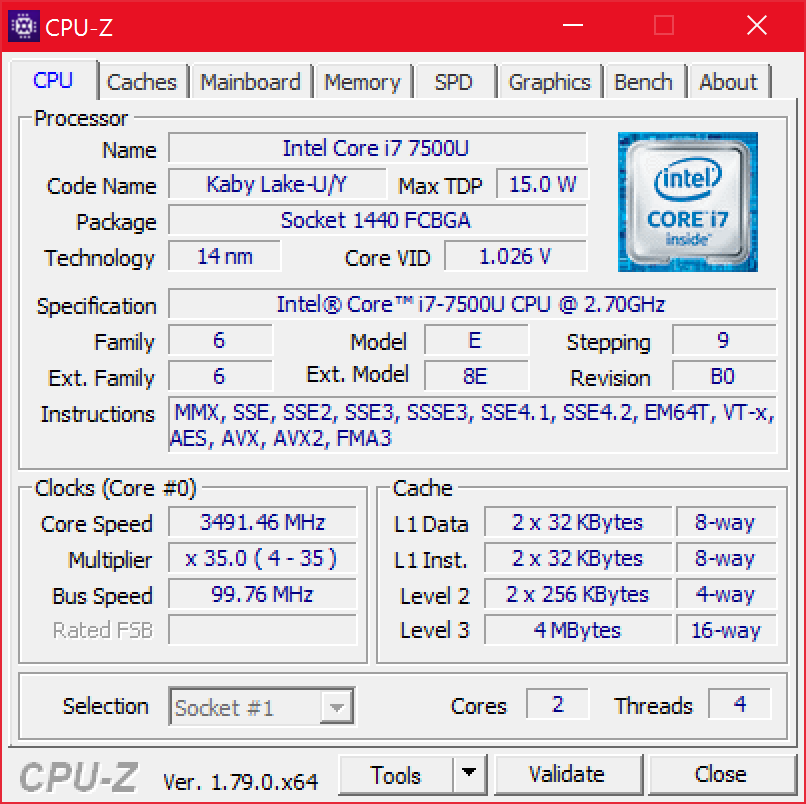
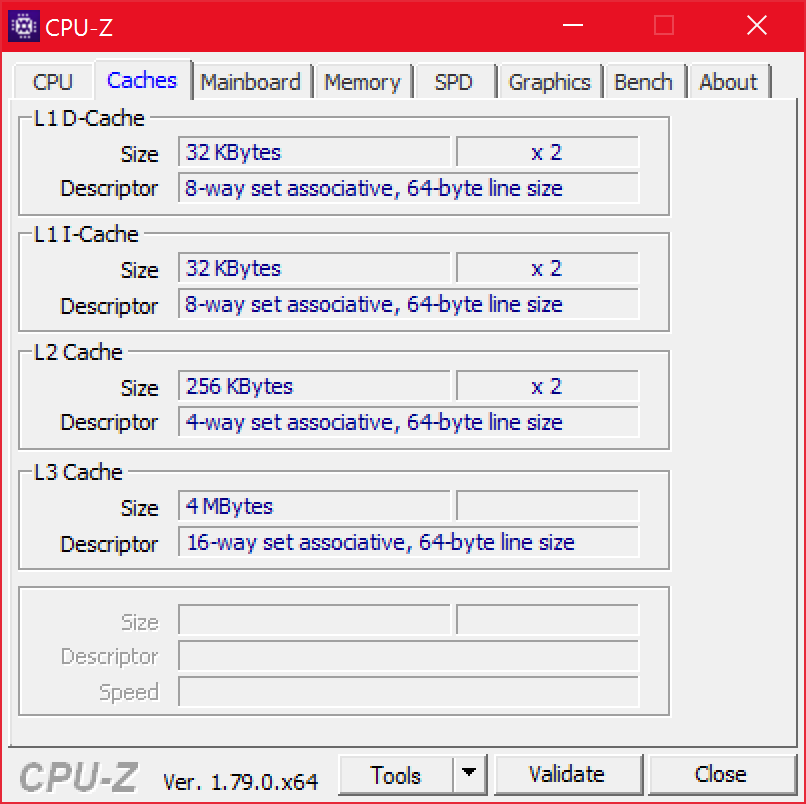
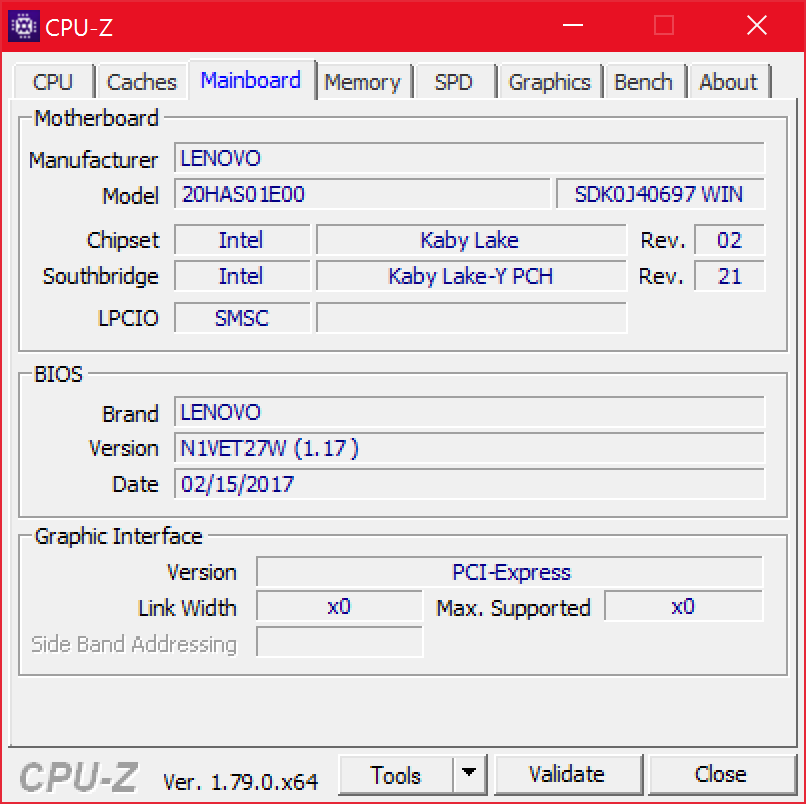
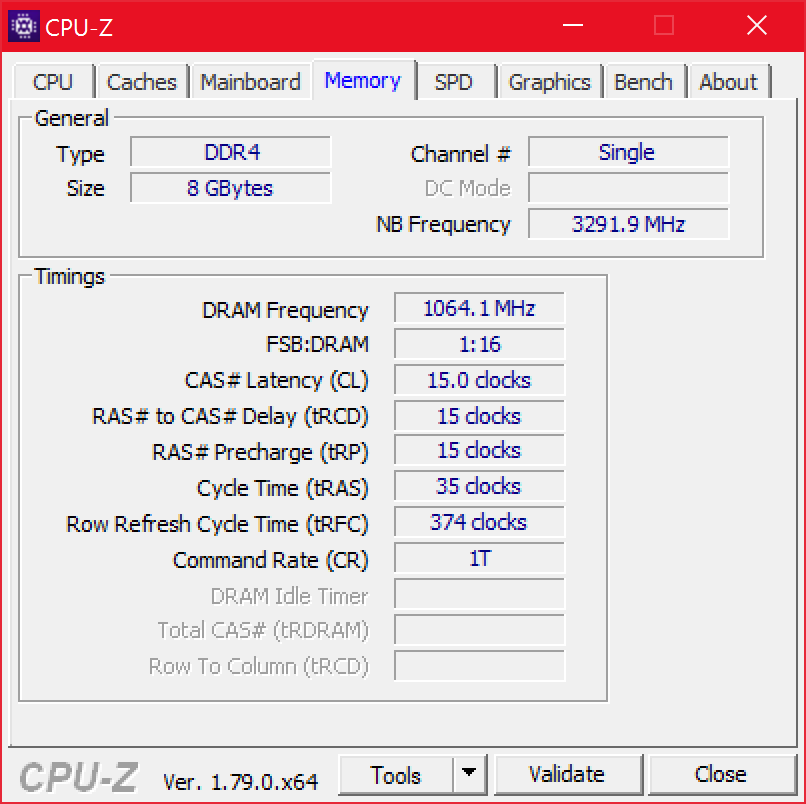
Lenovo ThinkPad T570-20HAS01E00
- 04/25/2017 v6 (old)
Benjamin Herzig