Test: Lenovo ThinkPad T570 (Core i5, Full HD) (sammanfattning)
| SD Card Reader | |
| average JPG Copy Test (av. of 3 runs) | |
| Fujitsu LifeBook U757 | |
| Lenovo ThinkPad T570-20H90002GE | |
| HP EliteBook 850 G4-Z2W86ET | |
| Dell XPS 15 2017 9560 (7300HQ, Full-HD) | |
| maximum AS SSD Seq Read Test (1GB) | |
| Dell XPS 15 2017 9560 (7300HQ, Full-HD) | |
| Lenovo ThinkPad T570-20H90002GE | |
| HP EliteBook 850 G4-Z2W86ET | |
| Fujitsu LifeBook U757 | |
| Networking | |
| iperf3 transmit AX12 | |
| Apple MacBook Pro 15 2016 (2.6 GHz, 450) (Klaus I211) | |
| Dell XPS 15 2017 9560 (7300HQ, Full-HD) | |
| Lenovo ThinkPad T570-20H90002GE | |
| HP EliteBook 850 G4-Z2W86ET | |
| Fujitsu LifeBook U757 | |
| iperf3 receive AX12 | |
| Apple MacBook Pro 15 2016 (2.6 GHz, 450) (Klaus I211) | |
| Dell XPS 15 2017 9560 (7300HQ, Full-HD) | |
| Fujitsu LifeBook U757 | |
| Lenovo ThinkPad T570-20H90002GE | |
| HP EliteBook 850 G4-Z2W86ET | |
| |||||||||||||||||||||||||
Distribution av ljusstyrkan: 89 %
Mitt på batteriet: 257 cd/m²
Kontrast: 1092:1 (Svärta: 0.24 cd/m²)
ΔE ColorChecker Calman: 4.5 | ∀{0.5-29.43 Ø4.71}
ΔE Greyscale Calman: 3.5 | ∀{0.09-98 Ø4.96}
65.4% sRGB (Argyll 1.6.3 3D)
42.04% AdobeRGB 1998 (Argyll 1.6.3 3D)
45.66% AdobeRGB 1998 (Argyll 3D)
65.6% sRGB (Argyll 3D)
44.08% Display P3 (Argyll 3D)
Gamma: 2.32
CCT: 6524 K
| Lenovo ThinkPad T570-20H90002GE N156HCA-EAA, , 1920x1080, 15.6" | Apple MacBook Pro 15 2016 (2.6 GHz, 450) 2880x1800, 15.4" | Fujitsu LifeBook U757 LP156WF6-SPP1, , 1920x1080, 15.6" | HP EliteBook 850 G4-Z2W86ET AUO35ED, , 1920x1080, 15.6" | Dell XPS 15 2017 9560 (7300HQ, Full-HD) Sharp SHP1453 LQ156M1, , 1920x1080, 15.6" | Lenovo ThinkPad T560-20FH001FGE LTN156HL09901, , 1920x1080, 15.6" | |
|---|---|---|---|---|---|---|
| Display | 38% | 29% | 54% | -7% | ||
| Display P3 Coverage (%) | 44.08 | 65.8 49% | 56.8 29% | 68.9 56% | 40.96 -7% | |
| sRGB Coverage (%) | 65.6 | 84.8 29% | 83.7 28% | 98.9 51% | 61.3 -7% | |
| AdobeRGB 1998 Coverage (%) | 45.66 | 62 36% | 58.7 29% | 70.9 55% | 42.36 -7% | |
| Response Times | -32% | -7% | 7% | -91% | -56% | |
| Response Time Grey 50% / Grey 80% * (ms) | 41.6 ? | 47.3 ? -14% | 36 ? 13% | 47.2 ? -13% | 54 ? -30% | 58 ? -39% |
| Response Time Black / White * (ms) | 20.8 ? | 31.2 ? -50% | 26.4 ? -27% | 15.2 ? 27% | 52.4 ? -152% | 36 ? -73% |
| PWM Frequency (Hz) | 26040 ? | 117000 ? | 199.2 ? | 220 ? | ||
| Screen | 46% | 7% | -68% | 13% | -29% | |
| Brightness middle (cd/m²) | 262 | 483 84% | 313 19% | 338 29% | 400 53% | 243 -7% |
| Brightness (cd/m²) | 245 | 465 90% | 294 20% | 341 39% | 392 60% | 220 -10% |
| Brightness Distribution (%) | 89 | 92 3% | 84 -6% | 90 1% | 89 0% | 84 -6% |
| Black Level * (cd/m²) | 0.24 | 0.33 -38% | 0.27 -13% | 0.81 -238% | 0.26 -8% | 0.27 -13% |
| Contrast (:1) | 1092 | 1464 34% | 1159 6% | 417 -62% | 1538 41% | 900 -18% |
| Colorchecker dE 2000 * | 4.5 | 1.4 69% | 4.5 -0% | 10.9 -142% | 4.9 -9% | 7.49 -66% |
| Colorchecker dE 2000 max. * | 10.5 | 3 71% | 10.5 -0% | 18.7 -78% | 11 -5% | 15.13 -44% |
| Greyscale dE 2000 * | 3.5 | 1.5 57% | 4 -14% | 13.3 -280% | 7.2 -106% | 7.5 -114% |
| Gamma | 2.32 95% | 2.34 94% | 2.24 98% | 2.11 104% | 2.11 104% | 2.35 94% |
| CCT | 6524 100% | 6650 98% | 6387 102% | 16030 41% | 6911 94% | 6115 106% |
| Color Space (Percent of AdobeRGB 1998) (%) | 42.04 | 55.3 32% | 53.8 28% | 64.2 53% | 38.9 -7% | |
| Color Space (Percent of sRGB) (%) | 65.4 | 84.74 30% | 83.4 28% | 98.9 51% | 60.9 -7% | |
| Totalt genomsnitt (program/inställningar) | 7% /
31% | 13% /
12% | -11% /
-38% | -8% /
7% | -31% /
-28% |
* ... mindre är bättre
Visa svarstider
| ↔ Svarstid svart till vitt | ||
|---|---|---|
| 20.8 ms ... stiga ↗ och falla ↘ kombinerat | ↗ 6.8 ms stiga | 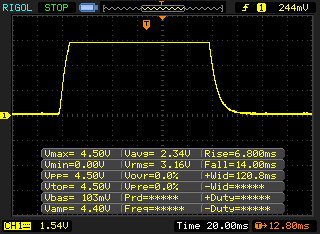 |
| ↘ 14 ms hösten | ||
| Skärmen visar bra svarsfrekvens i våra tester, men kan vara för långsam för konkurrenskraftiga spelare. I jämförelse sträcker sig alla testade enheter från 0.1 (minst) till 240 (maximalt) ms. » 46 % av alla enheter är bättre. Det betyder att den uppmätta svarstiden liknar genomsnittet av alla testade enheter (19.8 ms). | ||
| ↔ Svarstid 50 % grått till 80 % grått | ||
| 41.6 ms ... stiga ↗ och falla ↘ kombinerat | ↗ 22 ms stiga | 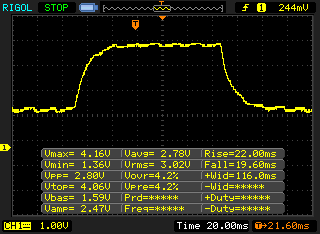 |
| ↘ 19.6 ms hösten | ||
| Skärmen visar långsamma svarsfrekvenser i våra tester och kommer att vara otillfredsställande för spelare. I jämförelse sträcker sig alla testade enheter från 0.165 (minst) till 636 (maximalt) ms. » 67 % av alla enheter är bättre. Detta innebär att den uppmätta svarstiden är sämre än genomsnittet av alla testade enheter (31 ms). | ||
Skärmflimmer / PWM (Puls-Width Modulation)
| Skärmflimmer / PWM upptäckt | 26040 Hz | ≤ 40 % ljusstyrka inställning | 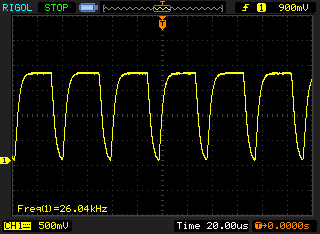 |
Displayens bakgrundsbelysning flimrar vid 26040 Hz (i värsta fall, t.ex. med PWM) Flimrande upptäckt vid en ljusstyrkeinställning på 40 % och lägre. Det ska inte finnas något flimmer eller PWM över denna ljusstyrkeinställning. Frekvensen för 26040 Hz är ganska hög, så de flesta användare som är känsliga för PWM bör inte märka något flimmer. Som jämförelse: 52 % av alla testade enheter använder inte PWM för att dämpa skärmen. Om PWM upptäcktes mättes ett medelvärde av 7757 (minst: 5 - maximum: 343500) Hz. | |||
| Cinebench R15 | |
| CPU Single 64Bit | |
| Dell XPS 15 2017 9560 (7300HQ, Full-HD) | |
| Apple MacBook Pro 15 2016 (2.6 GHz, 450) | |
| Fujitsu LifeBook U757 | |
| Lenovo ThinkPad T570-20H90002GE | |
| HP EliteBook 850 G4-Z2W86ET | |
| Lenovo ThinkPad T560-20FH001FGE | |
| CPU Multi 64Bit | |
| Apple MacBook Pro 15 2016 (2.6 GHz, 450) | |
| Dell XPS 15 2017 9560 (7300HQ, Full-HD) | |
| Fujitsu LifeBook U757 | |
| HP EliteBook 850 G4-Z2W86ET | |
| Lenovo ThinkPad T570-20H90002GE | |
| Lenovo ThinkPad T560-20FH001FGE | |
| PCMark 8 | |
| Home Score Accelerated v2 | |
| Dell XPS 15 2017 9560 (7300HQ, Full-HD) | |
| Apple MacBook Pro 15 2016 (2.6 GHz, 450) | |
| HP EliteBook 850 G4-Z2W86ET | |
| Lenovo ThinkPad T570-20H90002GE | |
| Fujitsu LifeBook U757 | |
| Lenovo ThinkPad T560-20FH001FGE | |
| Work Score Accelerated v2 | |
| Dell XPS 15 2017 9560 (7300HQ, Full-HD) | |
| Lenovo ThinkPad T570-20H90002GE | |
| Apple MacBook Pro 15 2016 (2.6 GHz, 450) | |
| HP EliteBook 850 G4-Z2W86ET | |
| Lenovo ThinkPad T560-20FH001FGE | |
| PCMark 8 Home Score Accelerated v2 | 3523 poäng | |
| PCMark 8 Creative Score Accelerated v2 | 4380 poäng | |
| PCMark 8 Work Score Accelerated v2 | 4606 poäng | |
Hjälp | ||
| Lenovo ThinkPad T570-20H90002GE Samsung PM961 MZVLW256HEHP | Apple MacBook Pro 15 2016 (2.6 GHz, 450) Apple SSD SM0256L | Fujitsu LifeBook U757 Samsung CM871a MZNTY256HDHP | HP EliteBook 850 G4-Z2W86ET Samsung PM951 NVMe MZVLV256 | Dell XPS 15 2017 9560 (7300HQ, Full-HD) WDC WD10SPCX-75KHST0 + SanDisk Z400s M.2 2242 32 GB Cache | Lenovo ThinkPad T470s-20HGS00V00 Samsung SSD PM961 1TB M.2 PCIe 3.0 x4 NVMe (MZVLW1T0) | |
|---|---|---|---|---|---|---|
| CrystalDiskMark 3.0 | -17% | -46% | -28% | -92% | 20% | |
| Read Seq (MB/s) | 1318 | 1298 -2% | 509 -61% | 1245 -6% | 123 -91% | 1760 34% |
| Write Seq (MB/s) | 1166 | 1343 15% | 488.4 -58% | 298.6 -74% | 74.2 -94% | 1666 43% |
| Read 512 (MB/s) | 933 | 842 -10% | 414.3 -56% | 673 -28% | 101.7 -89% | 832 -11% |
| Write 512 (MB/s) | 860 | 945 10% | 321.7 -63% | 298.8 -65% | 42.51 -95% | 1064 24% |
| Read 4k (MB/s) | 56.6 | 9.8 -83% | 36.43 -36% | 41.79 -26% | 10.84 -81% | 53.2 -6% |
| Write 4k (MB/s) | 130.6 | 13 -90% | 88.4 -32% | 138.4 6% | 1.021 -99% | 167.4 28% |
| Read 4k QD32 (MB/s) | 510 | 630 24% | 402.8 -21% | 495 -3% | 69.8 -86% | 630 24% |
| Write 4k QD32 (MB/s) | 426.4 | 443 4% | 256.7 -40% | 297.5 -30% | 1.057 -100% | 533 25% |

| 3DMark 11 - 1280x720 Performance GPU | |
| Dell XPS 15 2017 9560 (7300HQ, Full-HD) | |
| Apple MacBook Pro 15 2016 (2.6 GHz, 450) | |
| Acer TravelMate P259-MG-71UU | |
| Lenovo ThinkPad T470s-20HGS00V00 | |
| Lenovo ThinkPad T570-20H90002GE | |
| HP EliteBook 850 G4-Z2W86ET | |
| Fujitsu LifeBook U757 | |
| Lenovo ThinkPad T560-20FH001FGE | |
| 3DMark | |
| 1280x720 Cloud Gate Standard Graphics | |
| Dell XPS 15 2017 9560 (7300HQ, Full-HD) | |
| Apple MacBook Pro 15 2016 (2.6 GHz, 450) | |
| Acer TravelMate P259-MG-71UU | |
| Lenovo ThinkPad T470s-20HGS00V00 | |
| Lenovo ThinkPad T570-20H90002GE | |
| HP EliteBook 850 G4-Z2W86ET | |
| Lenovo ThinkPad T560-20FH001FGE | |
| 1920x1080 Fire Strike Graphics | |
| Dell XPS 15 2017 9560 (7300HQ, Full-HD) | |
| Apple MacBook Pro 15 2016 (2.6 GHz, 450) | |
| Acer TravelMate P259-MG-71UU | |
| Lenovo ThinkPad T470s-20HGS00V00 | |
| Lenovo ThinkPad T570-20H90002GE | |
| HP EliteBook 850 G4-Z2W86ET | |
| Lenovo ThinkPad T560-20FH001FGE | |
| 3DMark 11 Performance | 1533 poäng | |
| 3DMark Ice Storm Standard Score | 51988 poäng | |
| 3DMark Cloud Gate Standard Score | 5741 poäng | |
| 3DMark Fire Strike Score | 774 poäng | |
Hjälp | ||
| låg | med. | hög | ultra | |
|---|---|---|---|---|
| Tomb Raider (2013) | 66.9 | 33.6 | 19.7 | 9.5 |
| BioShock Infinite (2013) | 41.7 | 24.4 | 20.2 | 6.6 |
| Battlefield 4 (2013) | 30.3 | 25.2 | 15.5 | 4.8 |
| The Witcher 3 (2015) | 13.1 | |||
| Rise of the Tomb Raider (2016) | 10.5 |
Ljudnivå
| Låg belastning |
| 29.3 / 29.3 / 31.2 dB(A) |
| Hög belastning |
| 35.1 / 38.7 dB(A) |
 | ||
30 dB tyst 40 dB(A) hörbar 50 dB(A) högt ljud |
||
min: | ||
| Lenovo ThinkPad T570-20H90002GE i5-7200U, HD Graphics 620 | Apple MacBook Pro 15 2016 (2.6 GHz, 450) 6700HQ, Radeon Pro 450 | Fujitsu LifeBook U757 i5-7200U, HD Graphics 620 | HP EliteBook 850 G4-Z2W86ET i5-7200U, HD Graphics 620 | Dell XPS 15 2017 9560 (7300HQ, Full-HD) i5-7300HQ, GeForce GTX 1050 Mobile | Lenovo ThinkPad T560-20FH001FGE 6200U, HD Graphics 520 | |
|---|---|---|---|---|---|---|
| Noise | -5% | 7% | 6% | -14% | 2% | |
| av / miljö * (dB) | 29.3 | 30.4 -4% | 28.2 4% | 29 1% | 30.3 -3% | 29 1% |
| Idle Minimum * (dB) | 29.3 | 30.6 -4% | 28.2 4% | 29 1% | 31.6 -8% | 30.8 -5% |
| Idle Average * (dB) | 29.3 | 30.6 -4% | 28.2 4% | 29 1% | 31.6 -8% | 30.8 -5% |
| Idle Maximum * (dB) | 31.2 | 30.6 2% | 28.2 10% | 29 7% | 33.4 -7% | 30.8 1% |
| Load Average * (dB) | 35.1 | 34.7 1% | 33.3 5% | 31 12% | 47.8 -36% | 33.1 6% |
| Load Maximum * (dB) | 38.7 | 46.3 -20% | 34 12% | 33.4 14% | 47.8 -24% | 34.4 11% |
* ... mindre är bättre
(+) Den maximala temperaturen på ovansidan är 39.5 °C / 103 F, jämfört med genomsnittet av 34.3 °C / 94 F , allt från 21.2 till 62.5 °C för klassen Office.
(-) Botten värms upp till maximalt 48.3 °C / 119 F, jämfört med genomsnittet av 36.8 °C / 98 F
(+) Vid tomgångsbruk är medeltemperaturen för ovansidan 24.1 °C / 75 F, jämfört med enhetsgenomsnittet på 29.5 °C / ### class_avg_f### F.
(+) Handledsstöden och pekplattan når maximal hudtemperatur (33.6 °C / 92.5 F) och är därför inte varma.
(-) Medeltemperaturen för handledsstödsområdet på liknande enheter var 27.5 °C / 81.5 F (-6.1 °C / -11 F).
| Lenovo ThinkPad T570-20H90002GE i5-7200U, HD Graphics 620 | Apple MacBook Pro 15 2016 (2.6 GHz, 450) 6700HQ, Radeon Pro 450 | Fujitsu LifeBook U757 i5-7200U, HD Graphics 620 | HP EliteBook 850 G4-Z2W86ET i5-7200U, HD Graphics 620 | Dell XPS 15 2017 9560 (7300HQ, Full-HD) i5-7300HQ, GeForce GTX 1050 Mobile | Lenovo ThinkPad T560-20FH001FGE 6200U, HD Graphics 520 | |
|---|---|---|---|---|---|---|
| Heat | 1% | -2% | 9% | -12% | 1% | |
| Maximum Upper Side * (°C) | 39.5 | 43 -9% | 42 -6% | 37 6% | 47.6 -21% | 33.3 16% |
| Maximum Bottom * (°C) | 48.3 | 40 17% | 38.8 20% | 41.1 15% | 42.1 13% | 40.1 17% |
| Idle Upper Side * (°C) | 24.5 | 26 -6% | 29.2 -19% | 23.2 5% | 29.9 -22% | 27.4 -12% |
| Idle Bottom * (°C) | 25.3 | 25 1% | 26.3 -4% | 23.2 8% | 29.8 -18% | 29.6 -17% |
* ... mindre är bättre
Lenovo ThinkPad T570-20H90002GE ljudanalys
(±) | högtalarljudstyrkan är genomsnittlig men bra (77.1 dB)
Bas 100 - 315 Hz
(±) | reducerad bas - i genomsnitt 12.1% lägre än medianen
(±) | linjäriteten för basen är genomsnittlig (10.7% delta till föregående frekvens)
Mellan 400 - 2000 Hz
(+) | balanserad mellan - endast 2.9% från medianen
(±) | linjäriteten för mids är genomsnittlig (9.6% delta till föregående frekvens)
Högsta 2 - 16 kHz
(+) | balanserade toppar - endast 3% från medianen
(+) | toppar är linjära (2.9% delta till föregående frekvens)
Totalt 100 - 16 000 Hz
(+) | det totala ljudet är linjärt (13.8% skillnad mot median)
Jämfört med samma klass
» 9% av alla testade enheter i den här klassen var bättre, 4% liknande, 87% sämre
» Den bästa hade ett delta på 7%, genomsnittet var 21%, sämst var 53%
Jämfört med alla testade enheter
» 15% av alla testade enheter var bättre, 4% liknande, 81% sämre
» Den bästa hade ett delta på 4%, genomsnittet var 23%, sämst var 134%
HP EliteBook 850 G4-Z2W86ET ljudanalys
(±) | högtalarljudstyrkan är genomsnittlig men bra (74.6 dB)
Bas 100 - 315 Hz
(-) | nästan ingen bas - i genomsnitt 15.5% lägre än medianen
(±) | linjäriteten för basen är genomsnittlig (11% delta till föregående frekvens)
Mellan 400 - 2000 Hz
(+) | balanserad mellan - endast 1.7% från medianen
(+) | mids är linjära (3.8% delta till föregående frekvens)
Högsta 2 - 16 kHz
(+) | balanserade toppar - endast 3.2% från medianen
(±) | linjäriteten för toppar är genomsnittlig (7.6% delta till föregående frekvens)
Totalt 100 - 16 000 Hz
(±) | linjäriteten för det totala ljudet är genomsnittlig (17.7% skillnad mot median)
Jämfört med samma klass
» 29% av alla testade enheter i den här klassen var bättre, 6% liknande, 65% sämre
» Den bästa hade ett delta på 7%, genomsnittet var 21%, sämst var 53%
Jämfört med alla testade enheter
» 35% av alla testade enheter var bättre, 8% liknande, 57% sämre
» Den bästa hade ett delta på 4%, genomsnittet var 23%, sämst var 134%
| Av/Standby | |
| Låg belastning | |
| Hög belastning |
|
Förklaring:
min: | |
| Lenovo ThinkPad T570-20H90002GE i5-7200U, HD Graphics 620, 1920x1080 | Apple MacBook Pro 15 2016 (2.6 GHz, 450) 6700HQ, Radeon Pro 450, 2880x1800 | Fujitsu LifeBook U757 i5-7200U, HD Graphics 620, 1920x1080 | HP EliteBook 850 G4-Z2W86ET i5-7200U, HD Graphics 620, 1920x1080 | Dell XPS 15 2017 9560 (7300HQ, Full-HD) i5-7300HQ, GeForce GTX 1050 Mobile, 1920x1080 | Lenovo ThinkPad T560-20FH001FGE 6200U, HD Graphics 520, 1920x1080 | |
|---|---|---|---|---|---|---|
| Power Consumption | -47% | 4% | 12% | -93% | 7% | |
| Idle Minimum * (Watt) | 3.6 | 2.9 19% | 3.96 -10% | 3.58 1% | 6.6 -83% | 4.3 -19% |
| Idle Average * (Watt) | 7.7 | 9.7 -26% | 7.74 -1% | 5.97 22% | 9 -17% | 7.3 5% |
| Idle Maximum * (Watt) | 8.2 | 10.1 -23% | 8.64 -5% | 6.81 17% | 10.7 -30% | 7.8 5% |
| Load Average * (Watt) | 30.8 | 65 -111% | 28.8 6% | 29.4 5% | 77.5 -152% | 26.3 15% |
| Load Maximum * (Watt) | 46.1 | 89.5 -94% | 32 31% | 39.7 14% | 130 -182% | 32 31% |
* ... mindre är bättre
| Lenovo ThinkPad T570-20H90002GE i5-7200U, HD Graphics 620, 56 Wh | Apple MacBook Pro 15 2016 (2.6 GHz, 450) 6700HQ, Radeon Pro 450, 76 Wh | Fujitsu LifeBook U757 i5-7200U, HD Graphics 620, 50 Wh | HP EliteBook 850 G4-Z2W86ET i5-7200U, HD Graphics 620, 51 Wh | Dell XPS 15 2017 9560 (7300HQ, Full-HD) i5-7300HQ, GeForce GTX 1050 Mobile, 56 Wh | Lenovo ThinkPad T560-20FH001FGE 6200U, HD Graphics 520, 67 Wh | |
|---|---|---|---|---|---|---|
| Batteridrifttid | -18% | -4% | -1% | -46% | 12% | |
| Reader / Idle (h) | 19.5 | 18 -8% | 9.4 -52% | 18.1 -7% | ||
| H.264 (h) | 9.8 | 8.6 -12% | 10.6 8% | 9.5 -3% | ||
| WiFi v1.3 (h) | 7.6 | 10 32% | 7.3 -4% | 8.8 16% | 5.6 -26% | 11 45% |
| Load (h) | 3.4 | 0.9 -74% | 2.7 -21% | 1.4 -59% | 3.8 12% |
För
Emot
Läs originaltestet på engelska här.
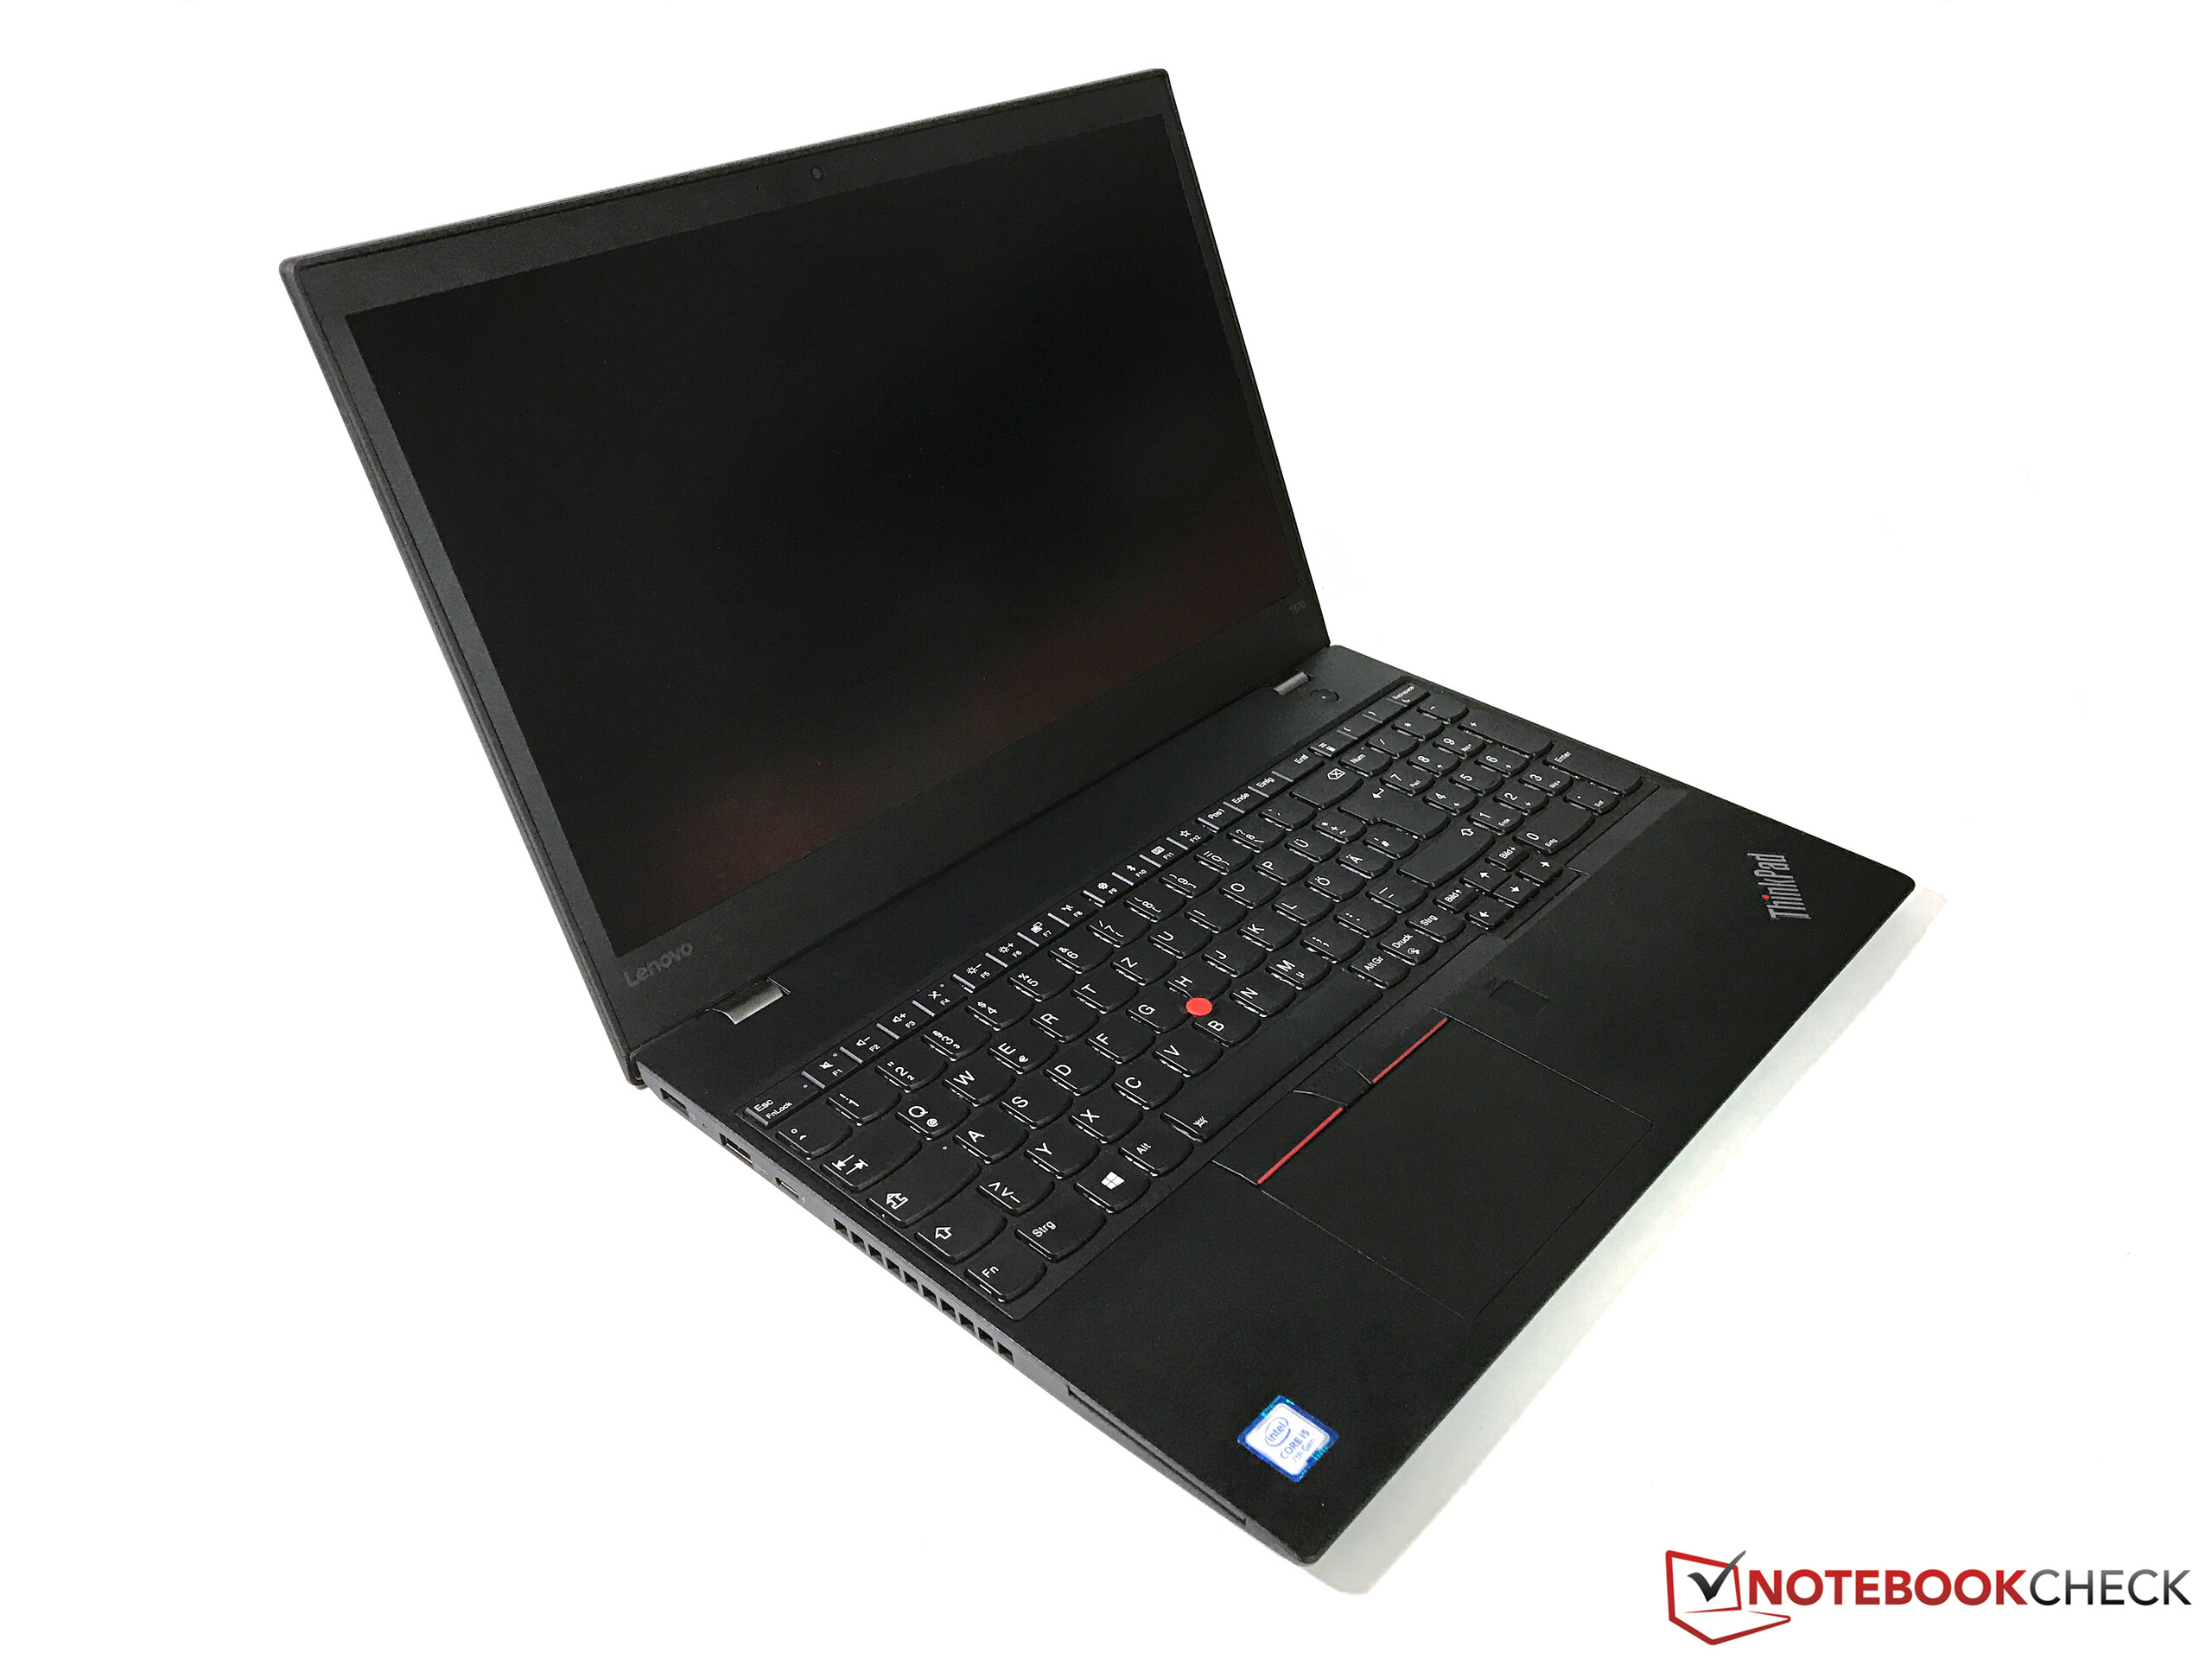
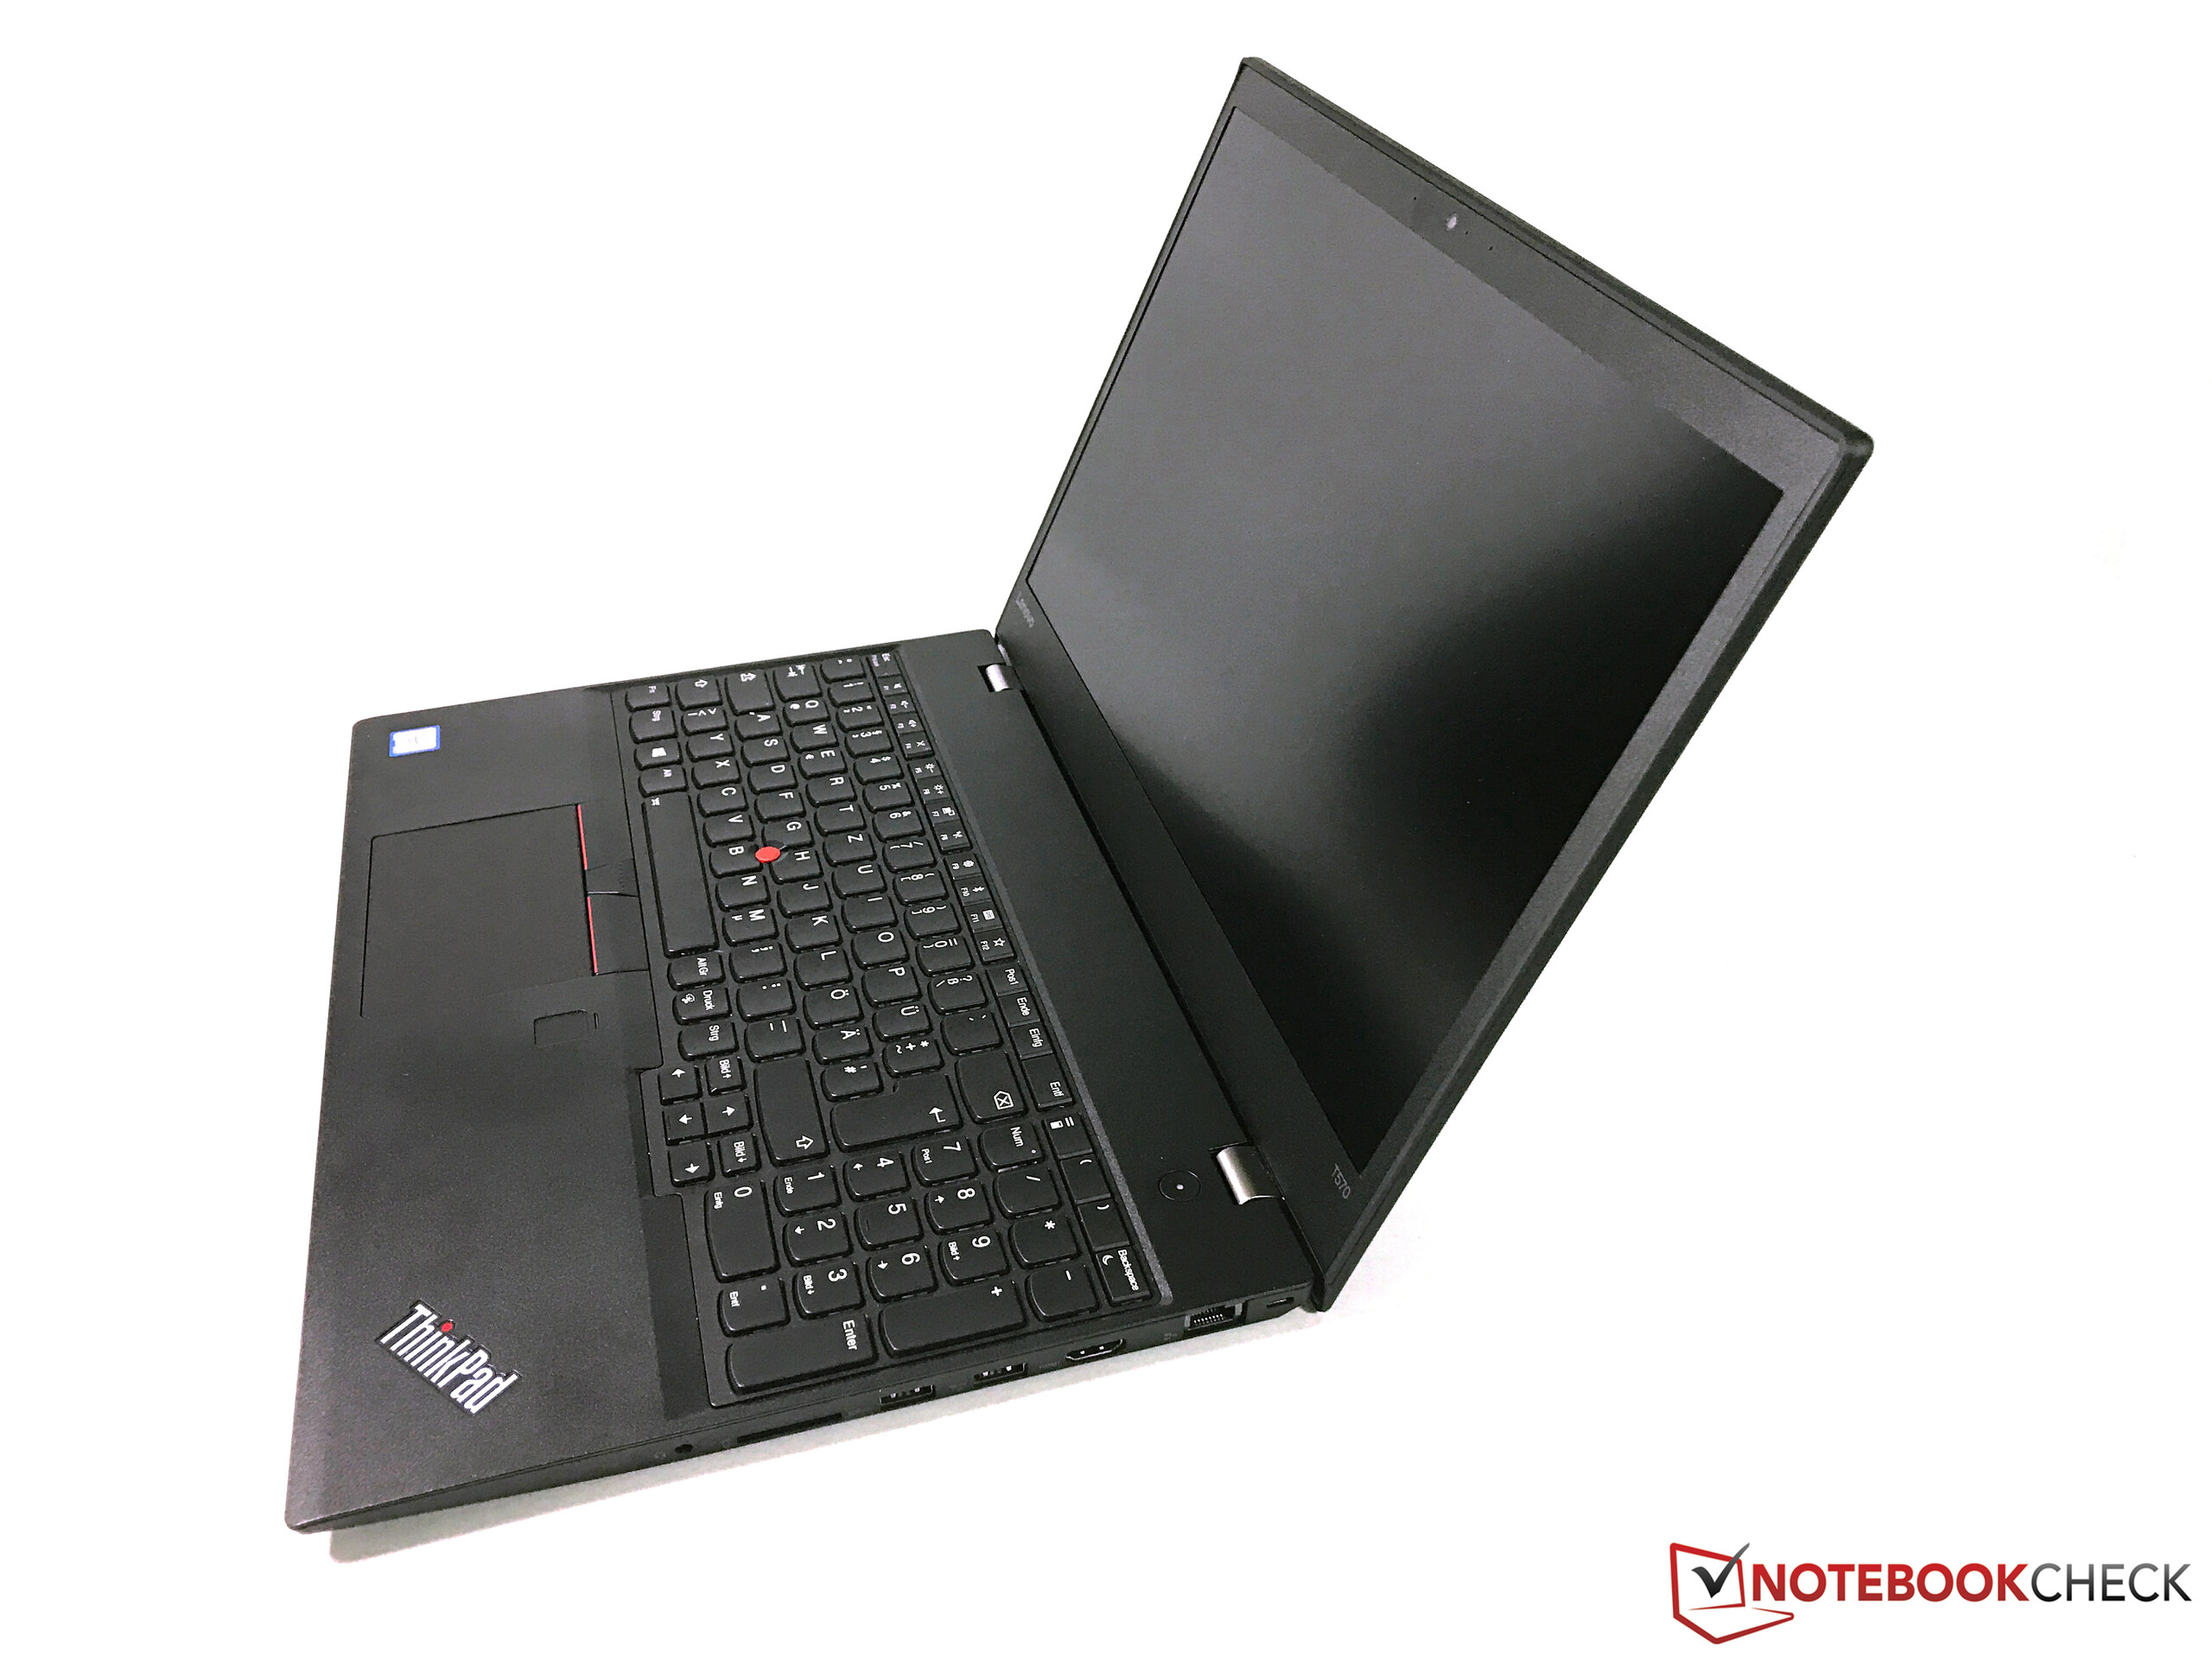
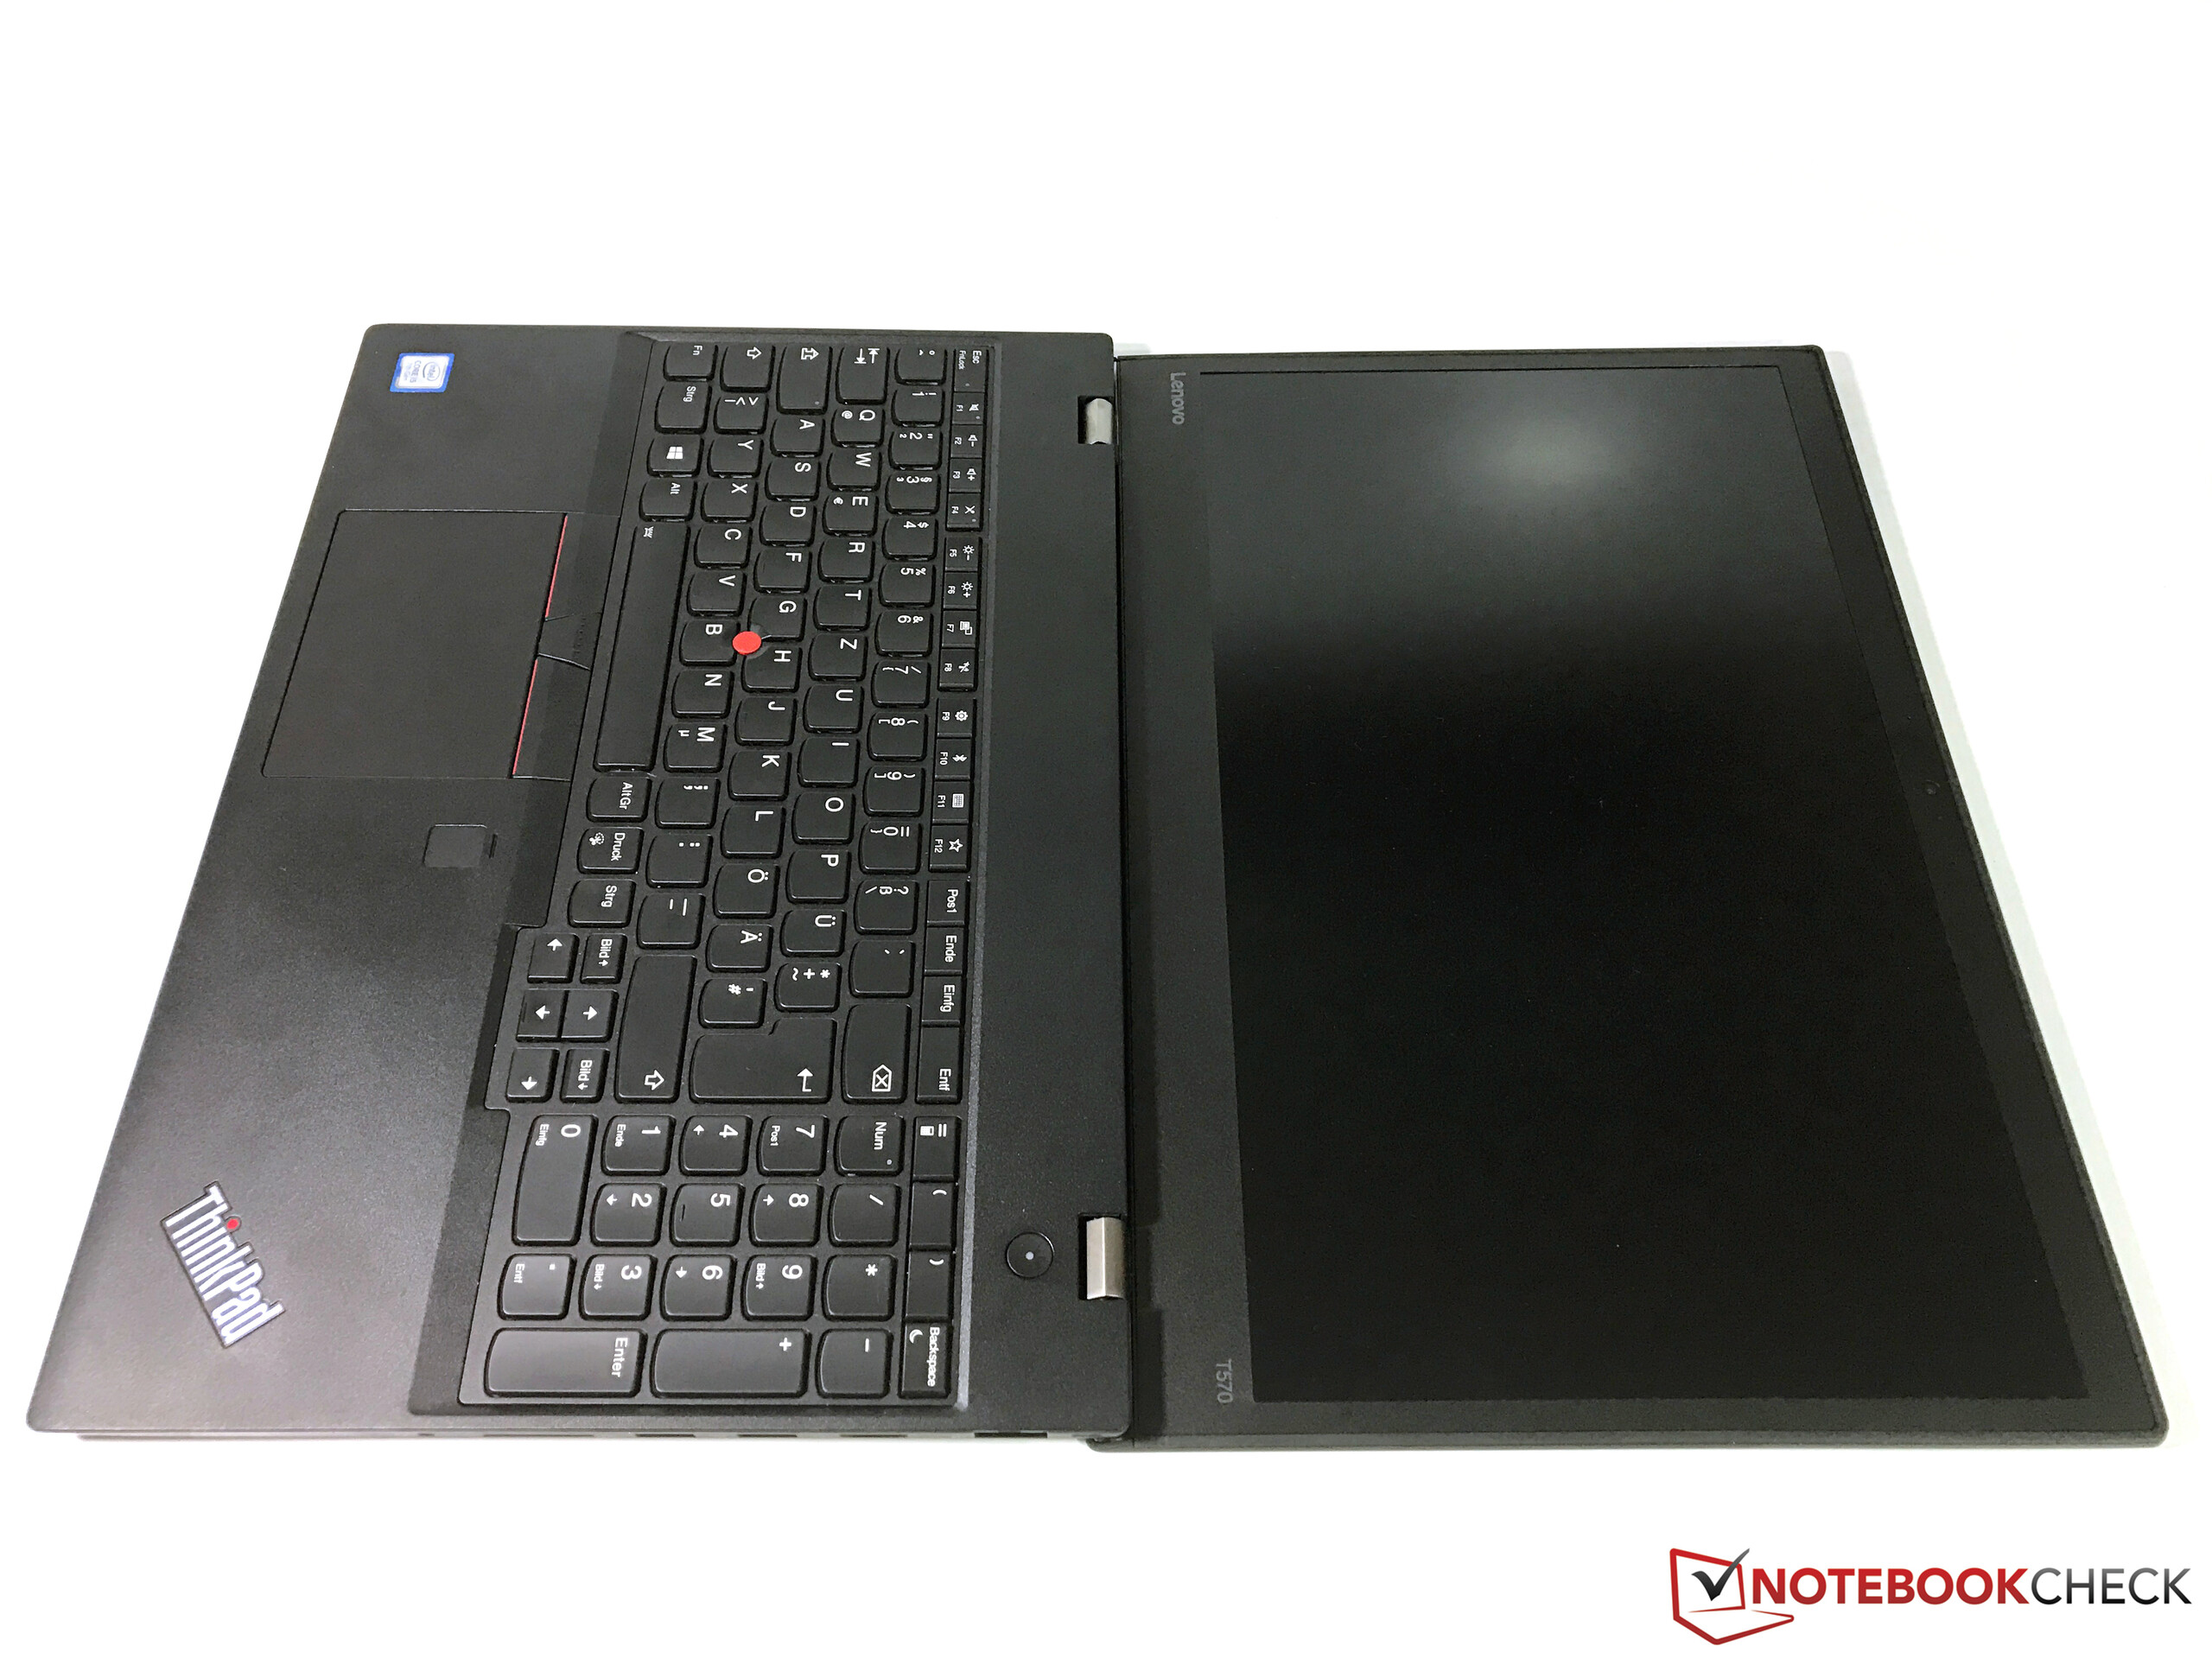
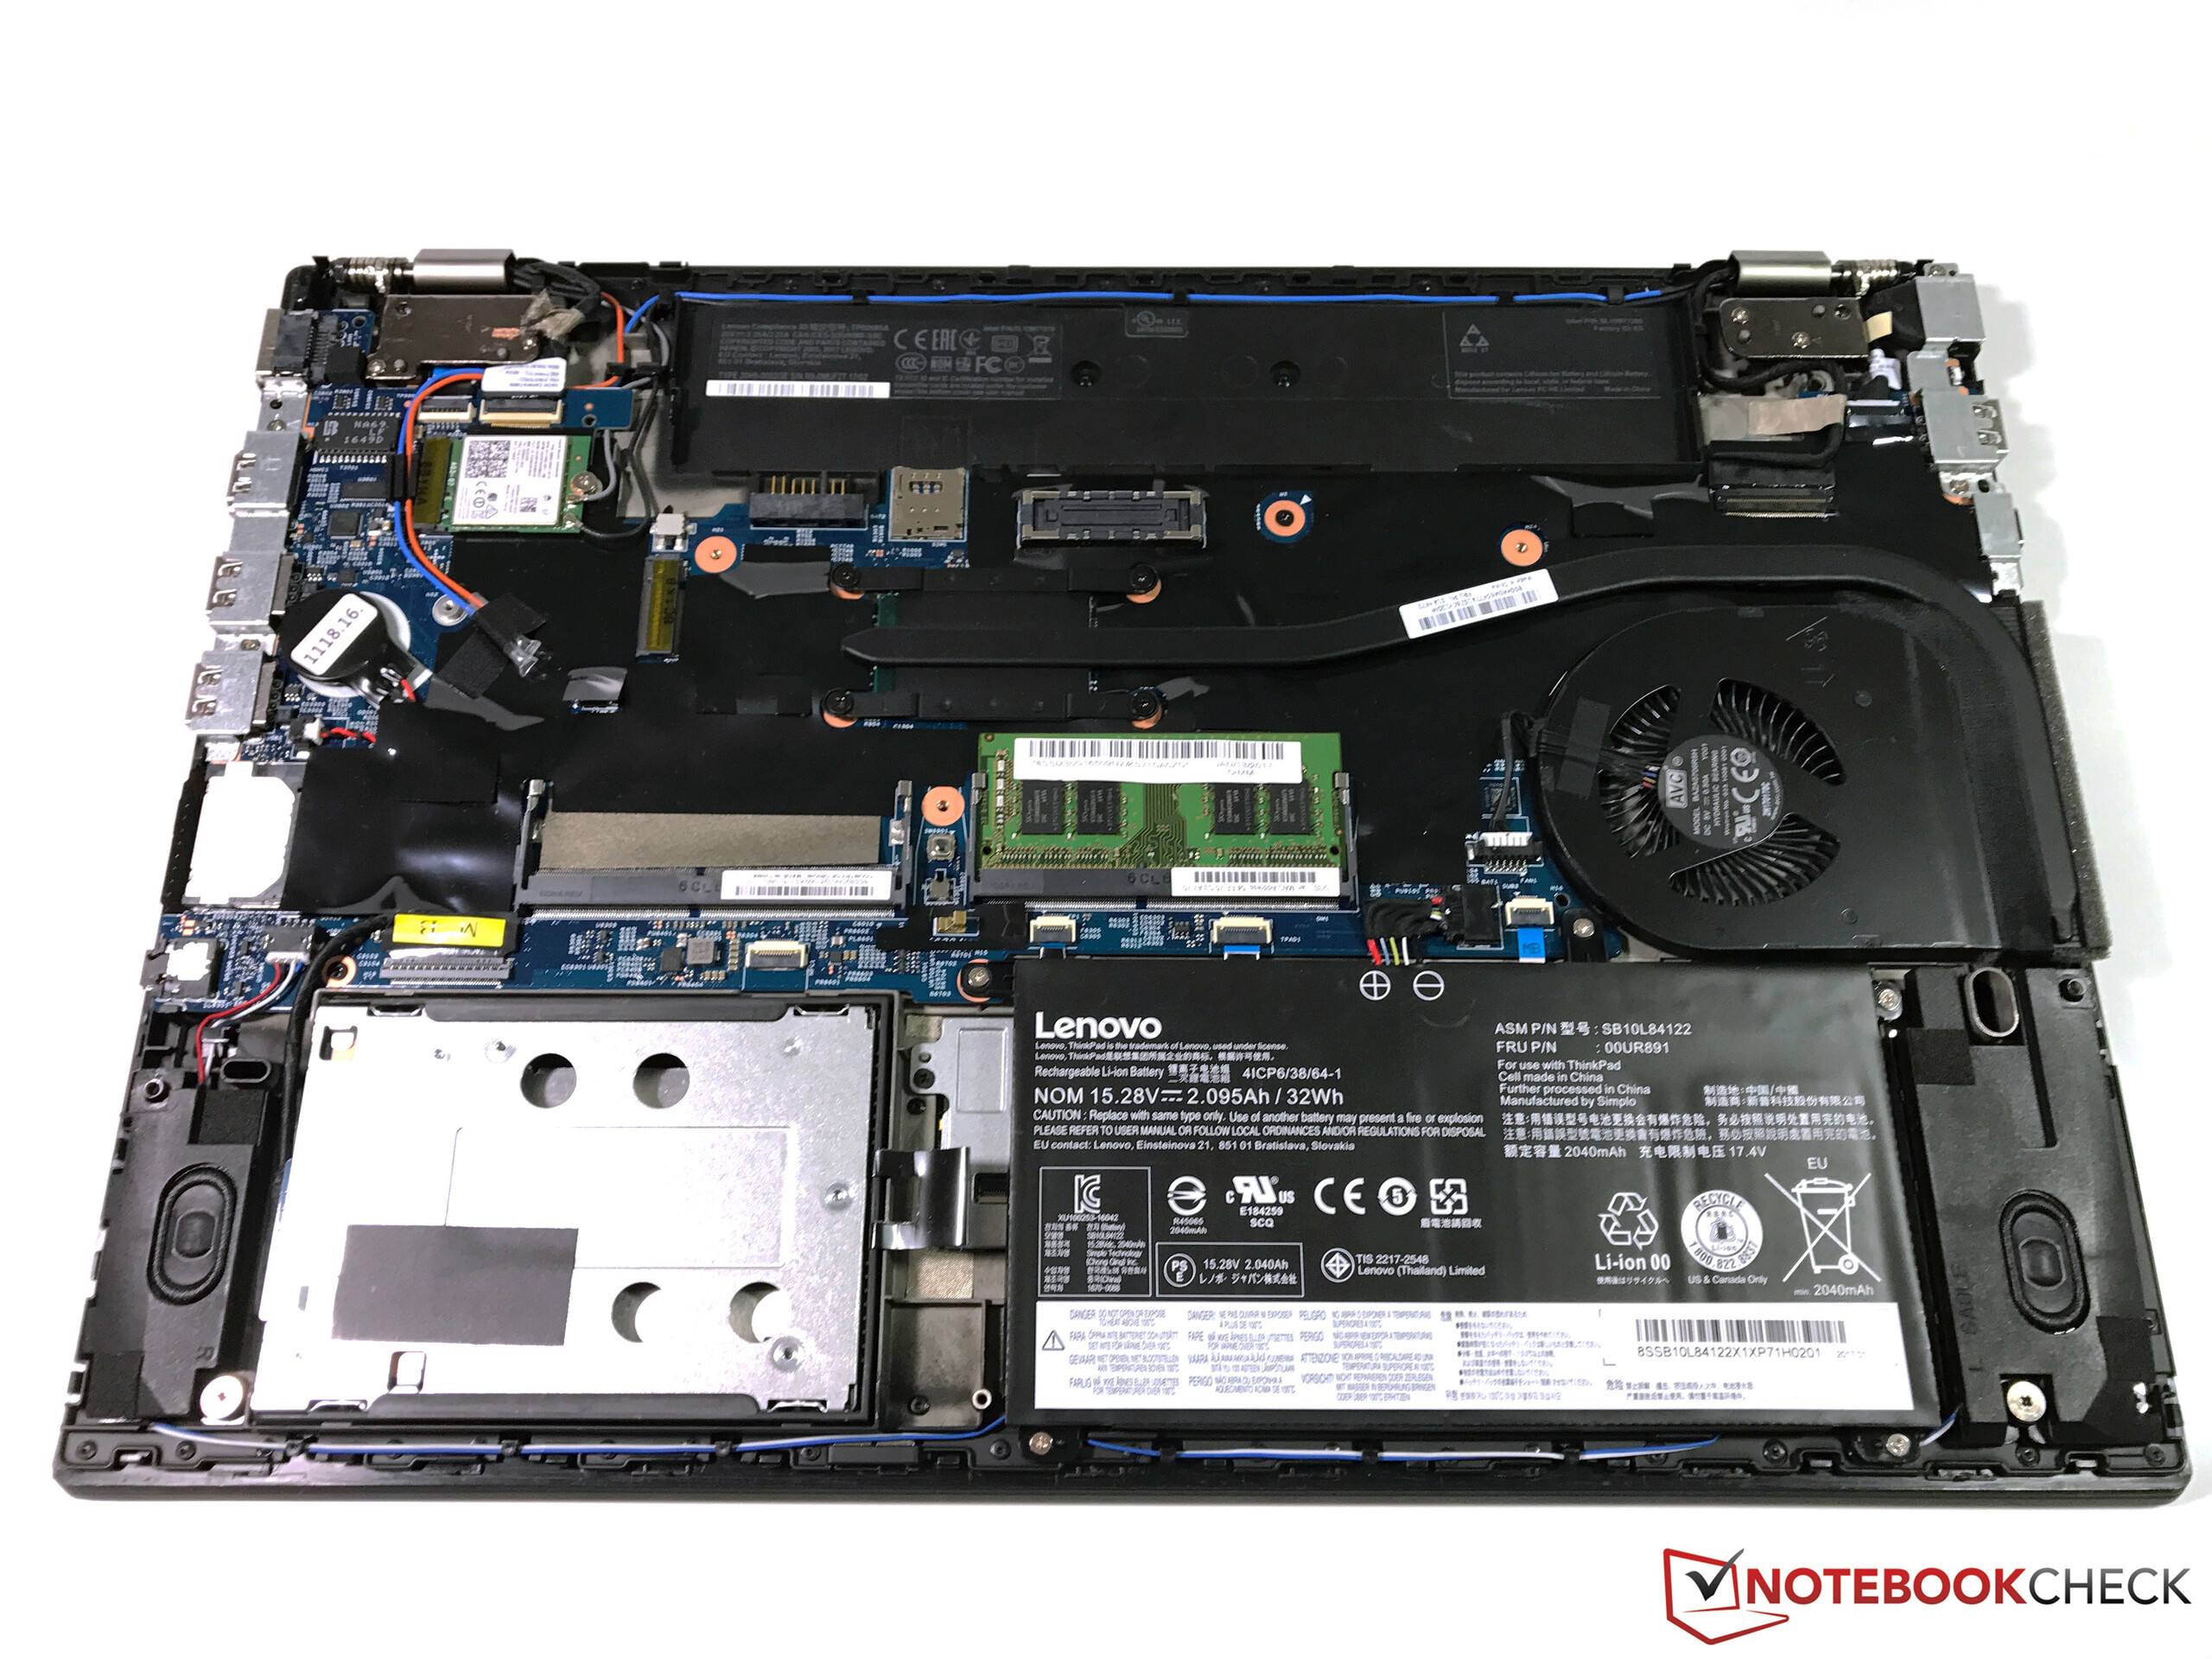
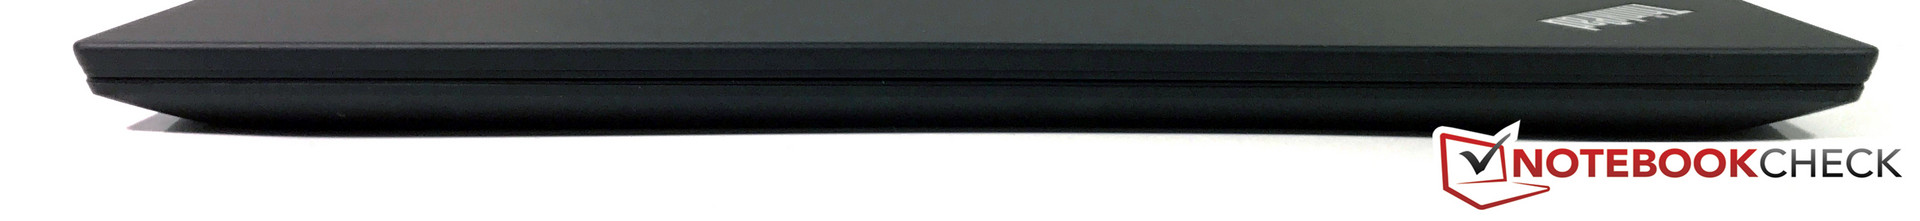
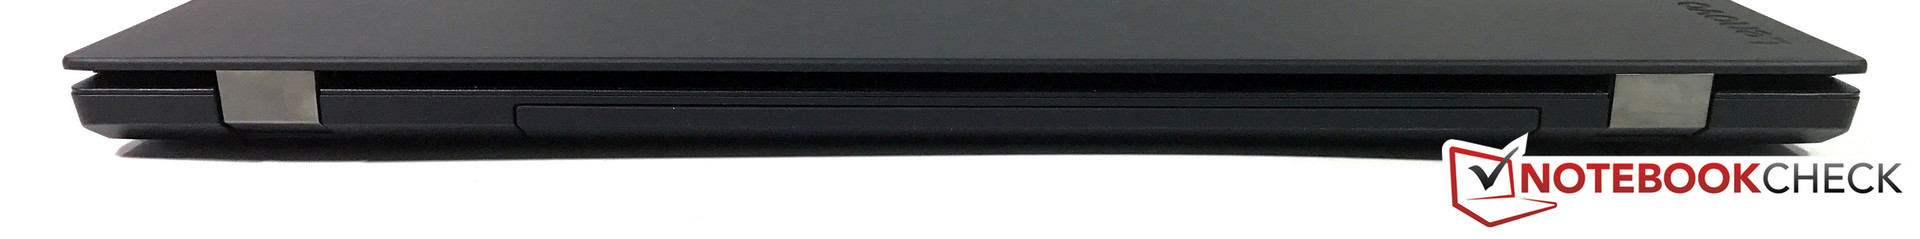
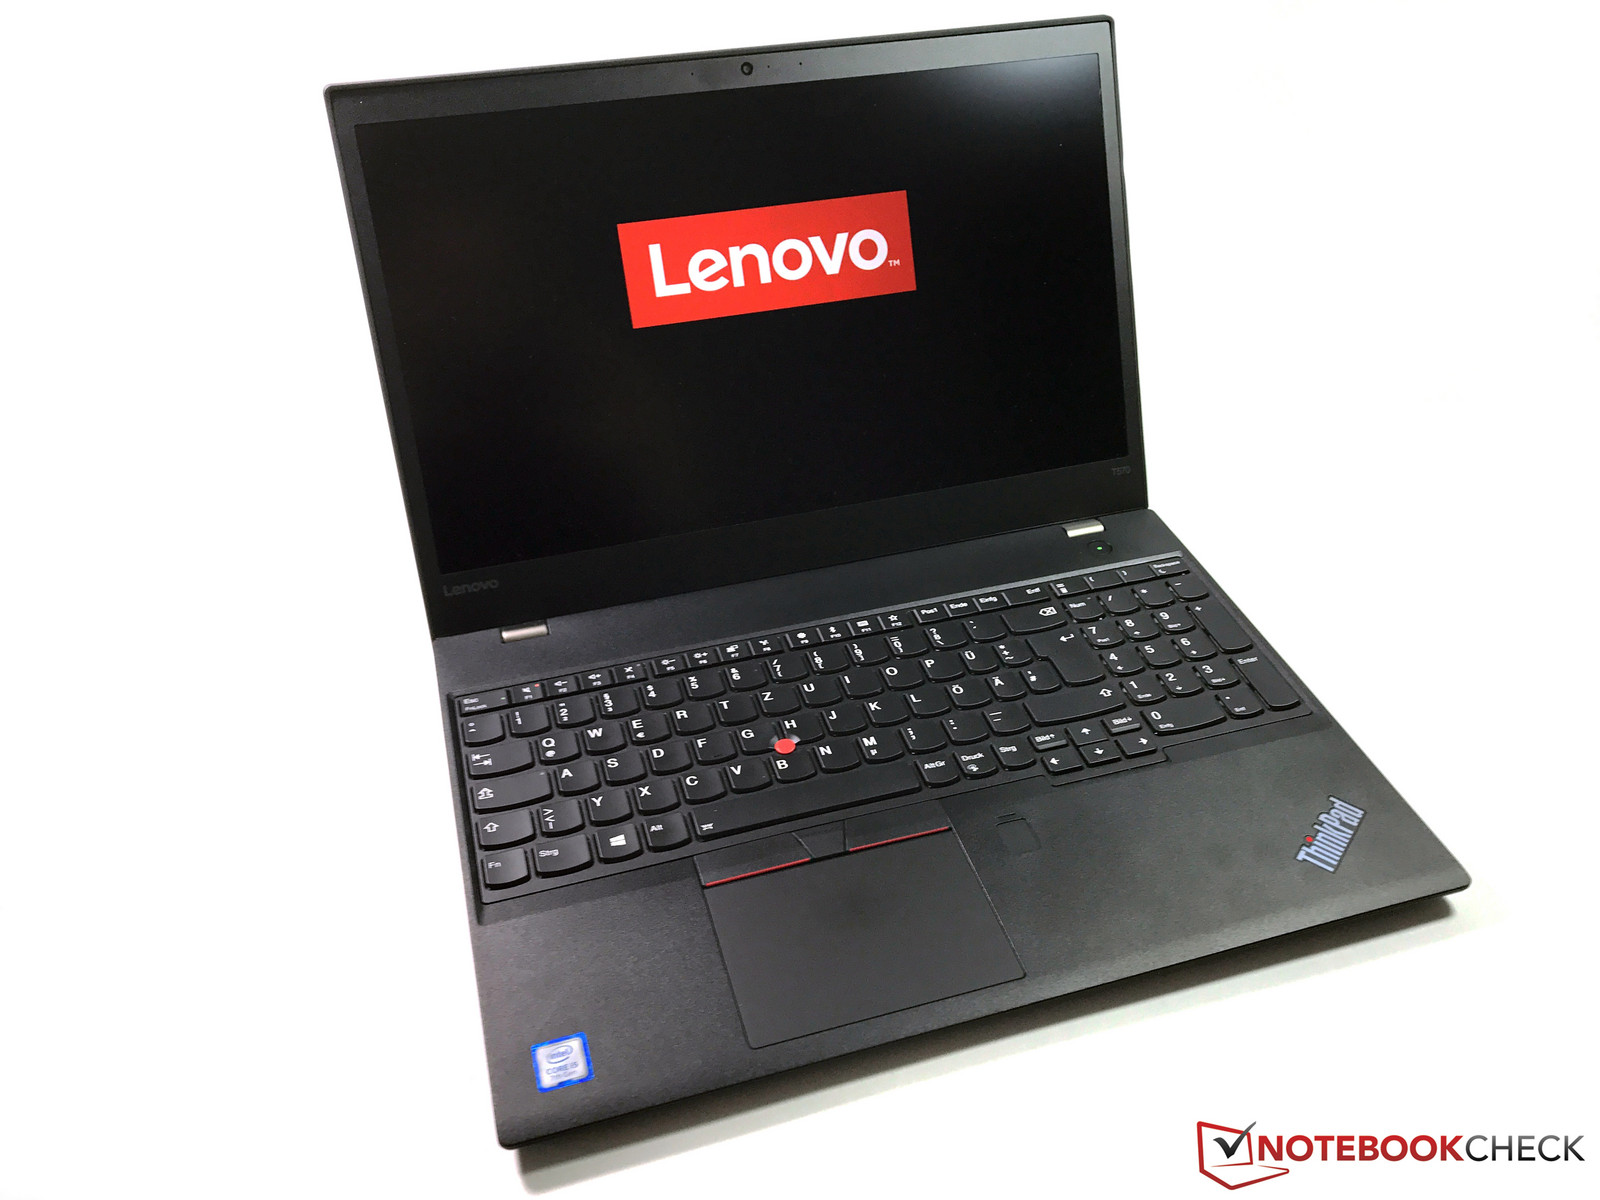
Lenovos senaste 15-tummare ThinkPad T570 är en bra företagsdator på många plan, men den har också några nackdelar. Vi gillar verkligen det mer kompakta chassit. Lenovo har återgått till ett svart färgschema med de senaste T-modellerna och de har också fått ett mindre chassi, något som framförallt märks på de smalare kanterna runt skärmen. Att komma åt komponenterna är emellertid ganska knepigt, vilket också var fallet med det mindre syskonet i serien, ThinkPad T470.
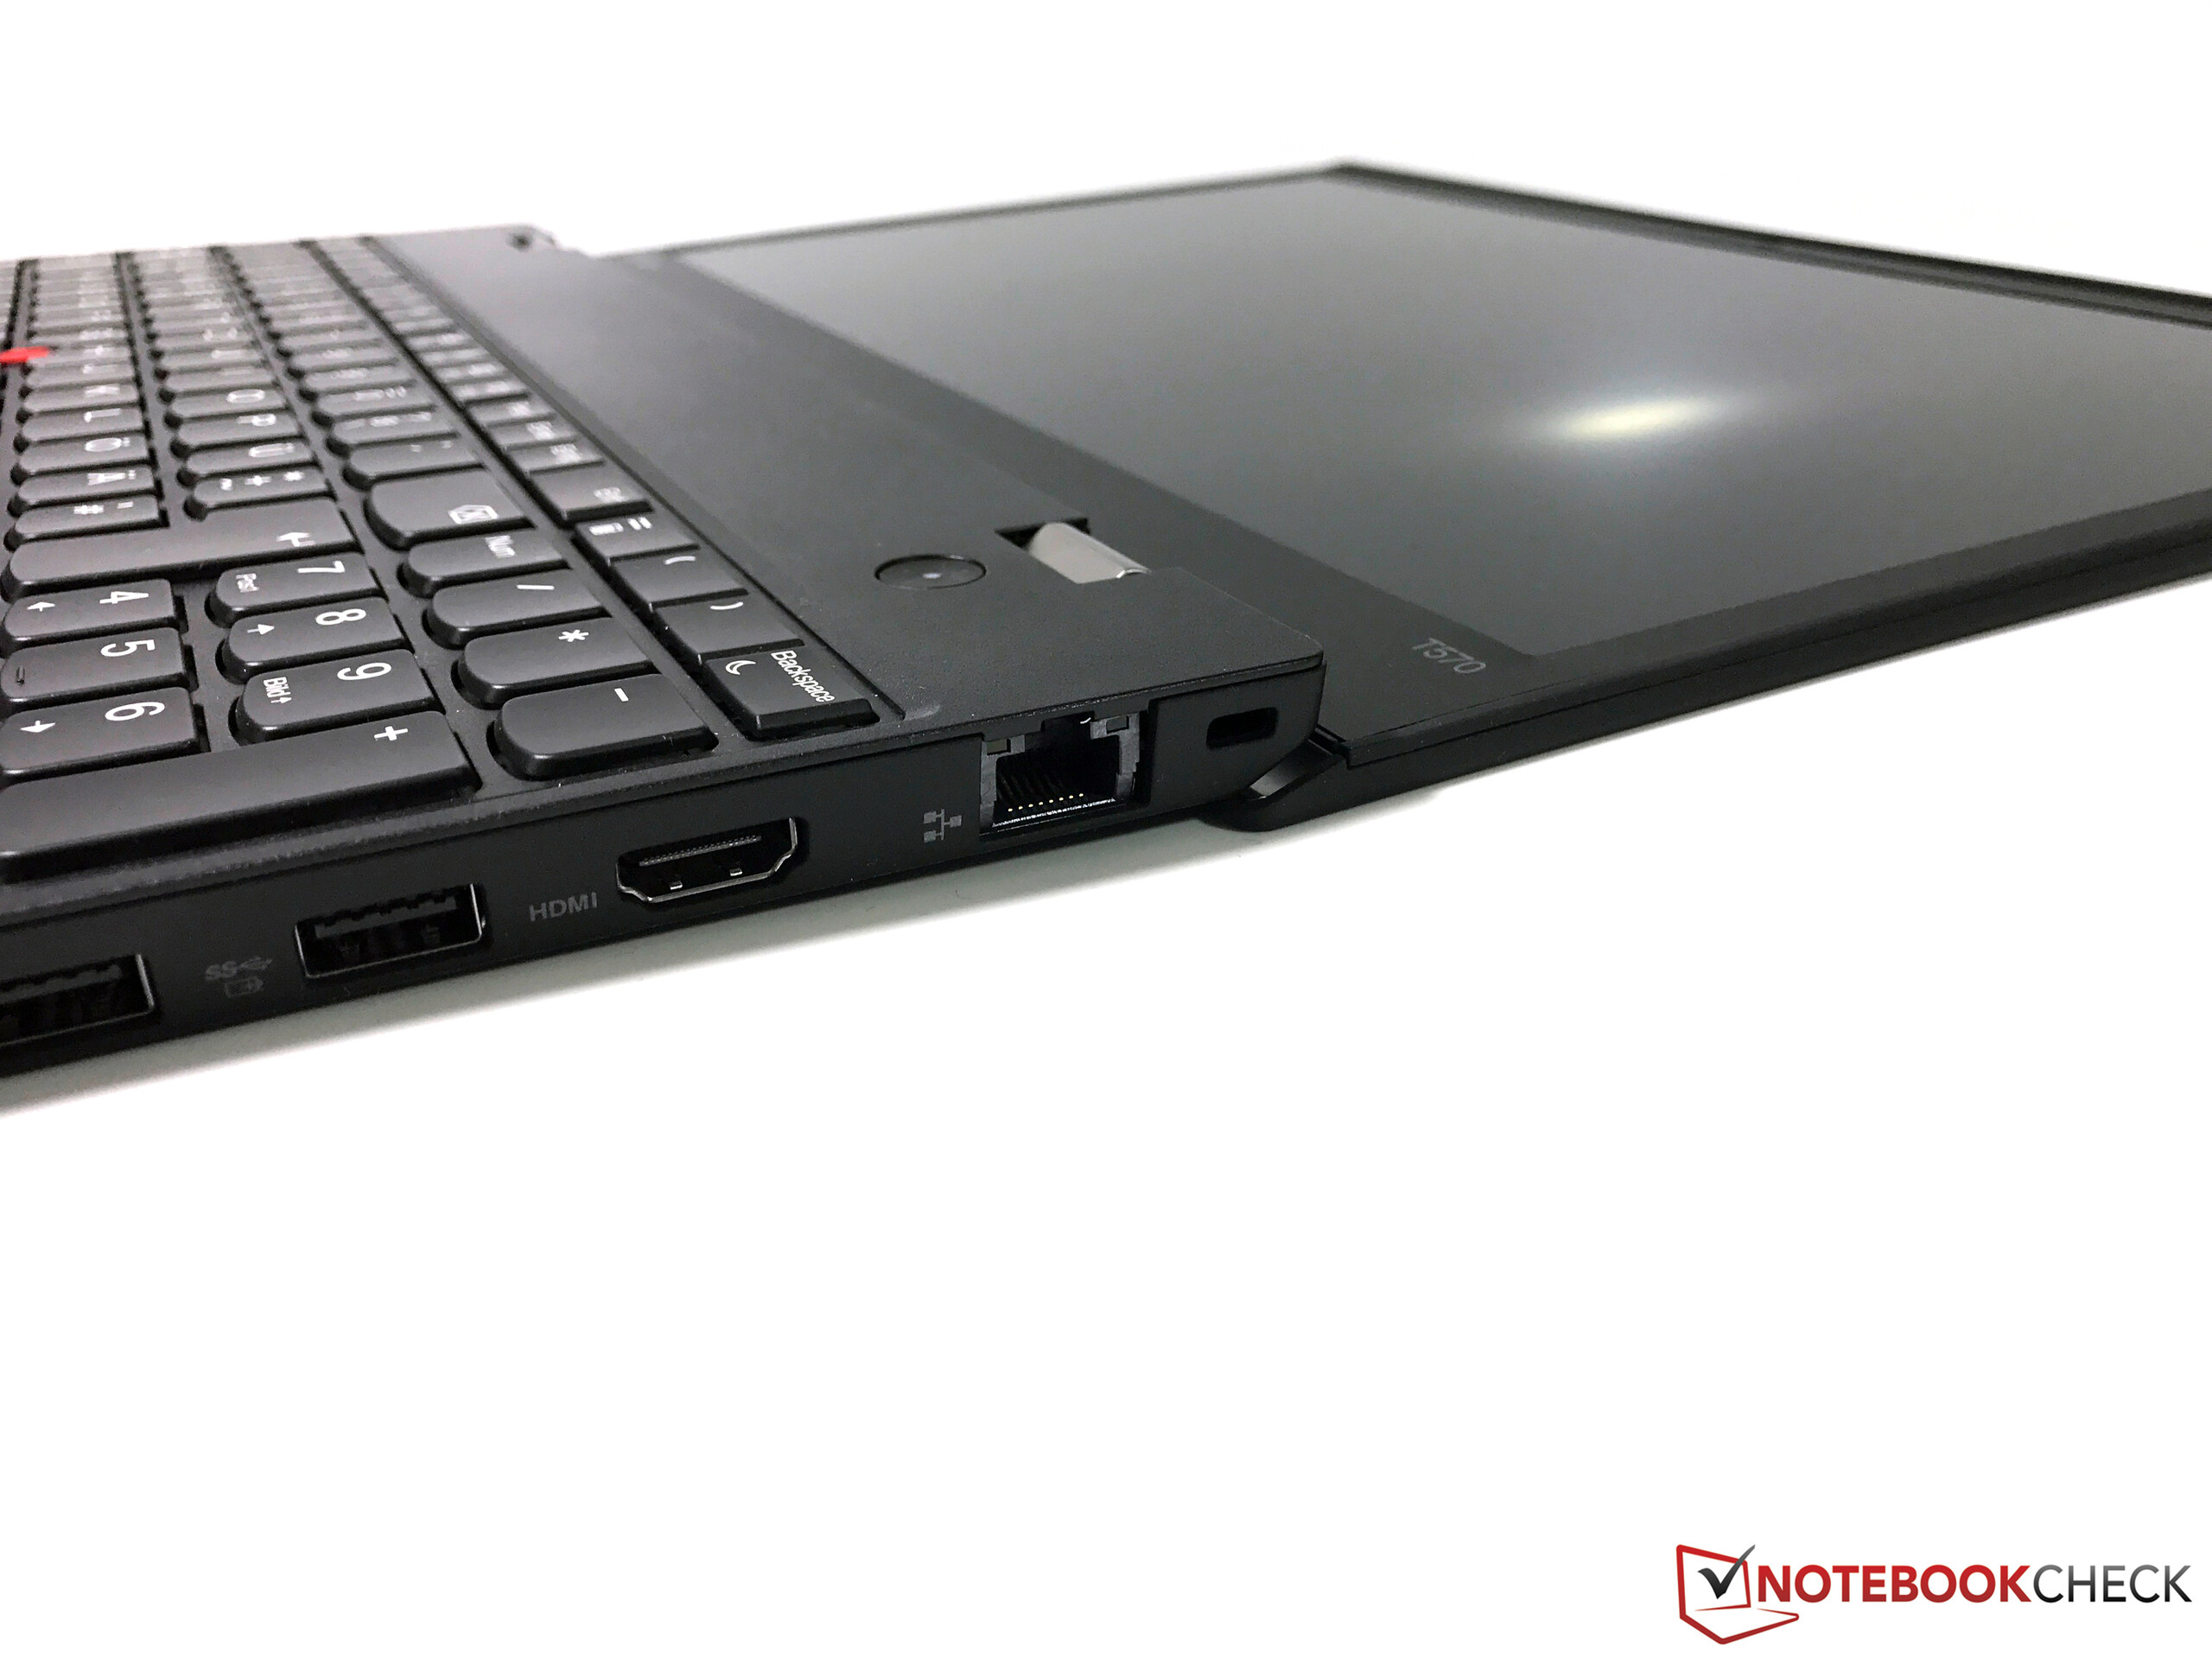
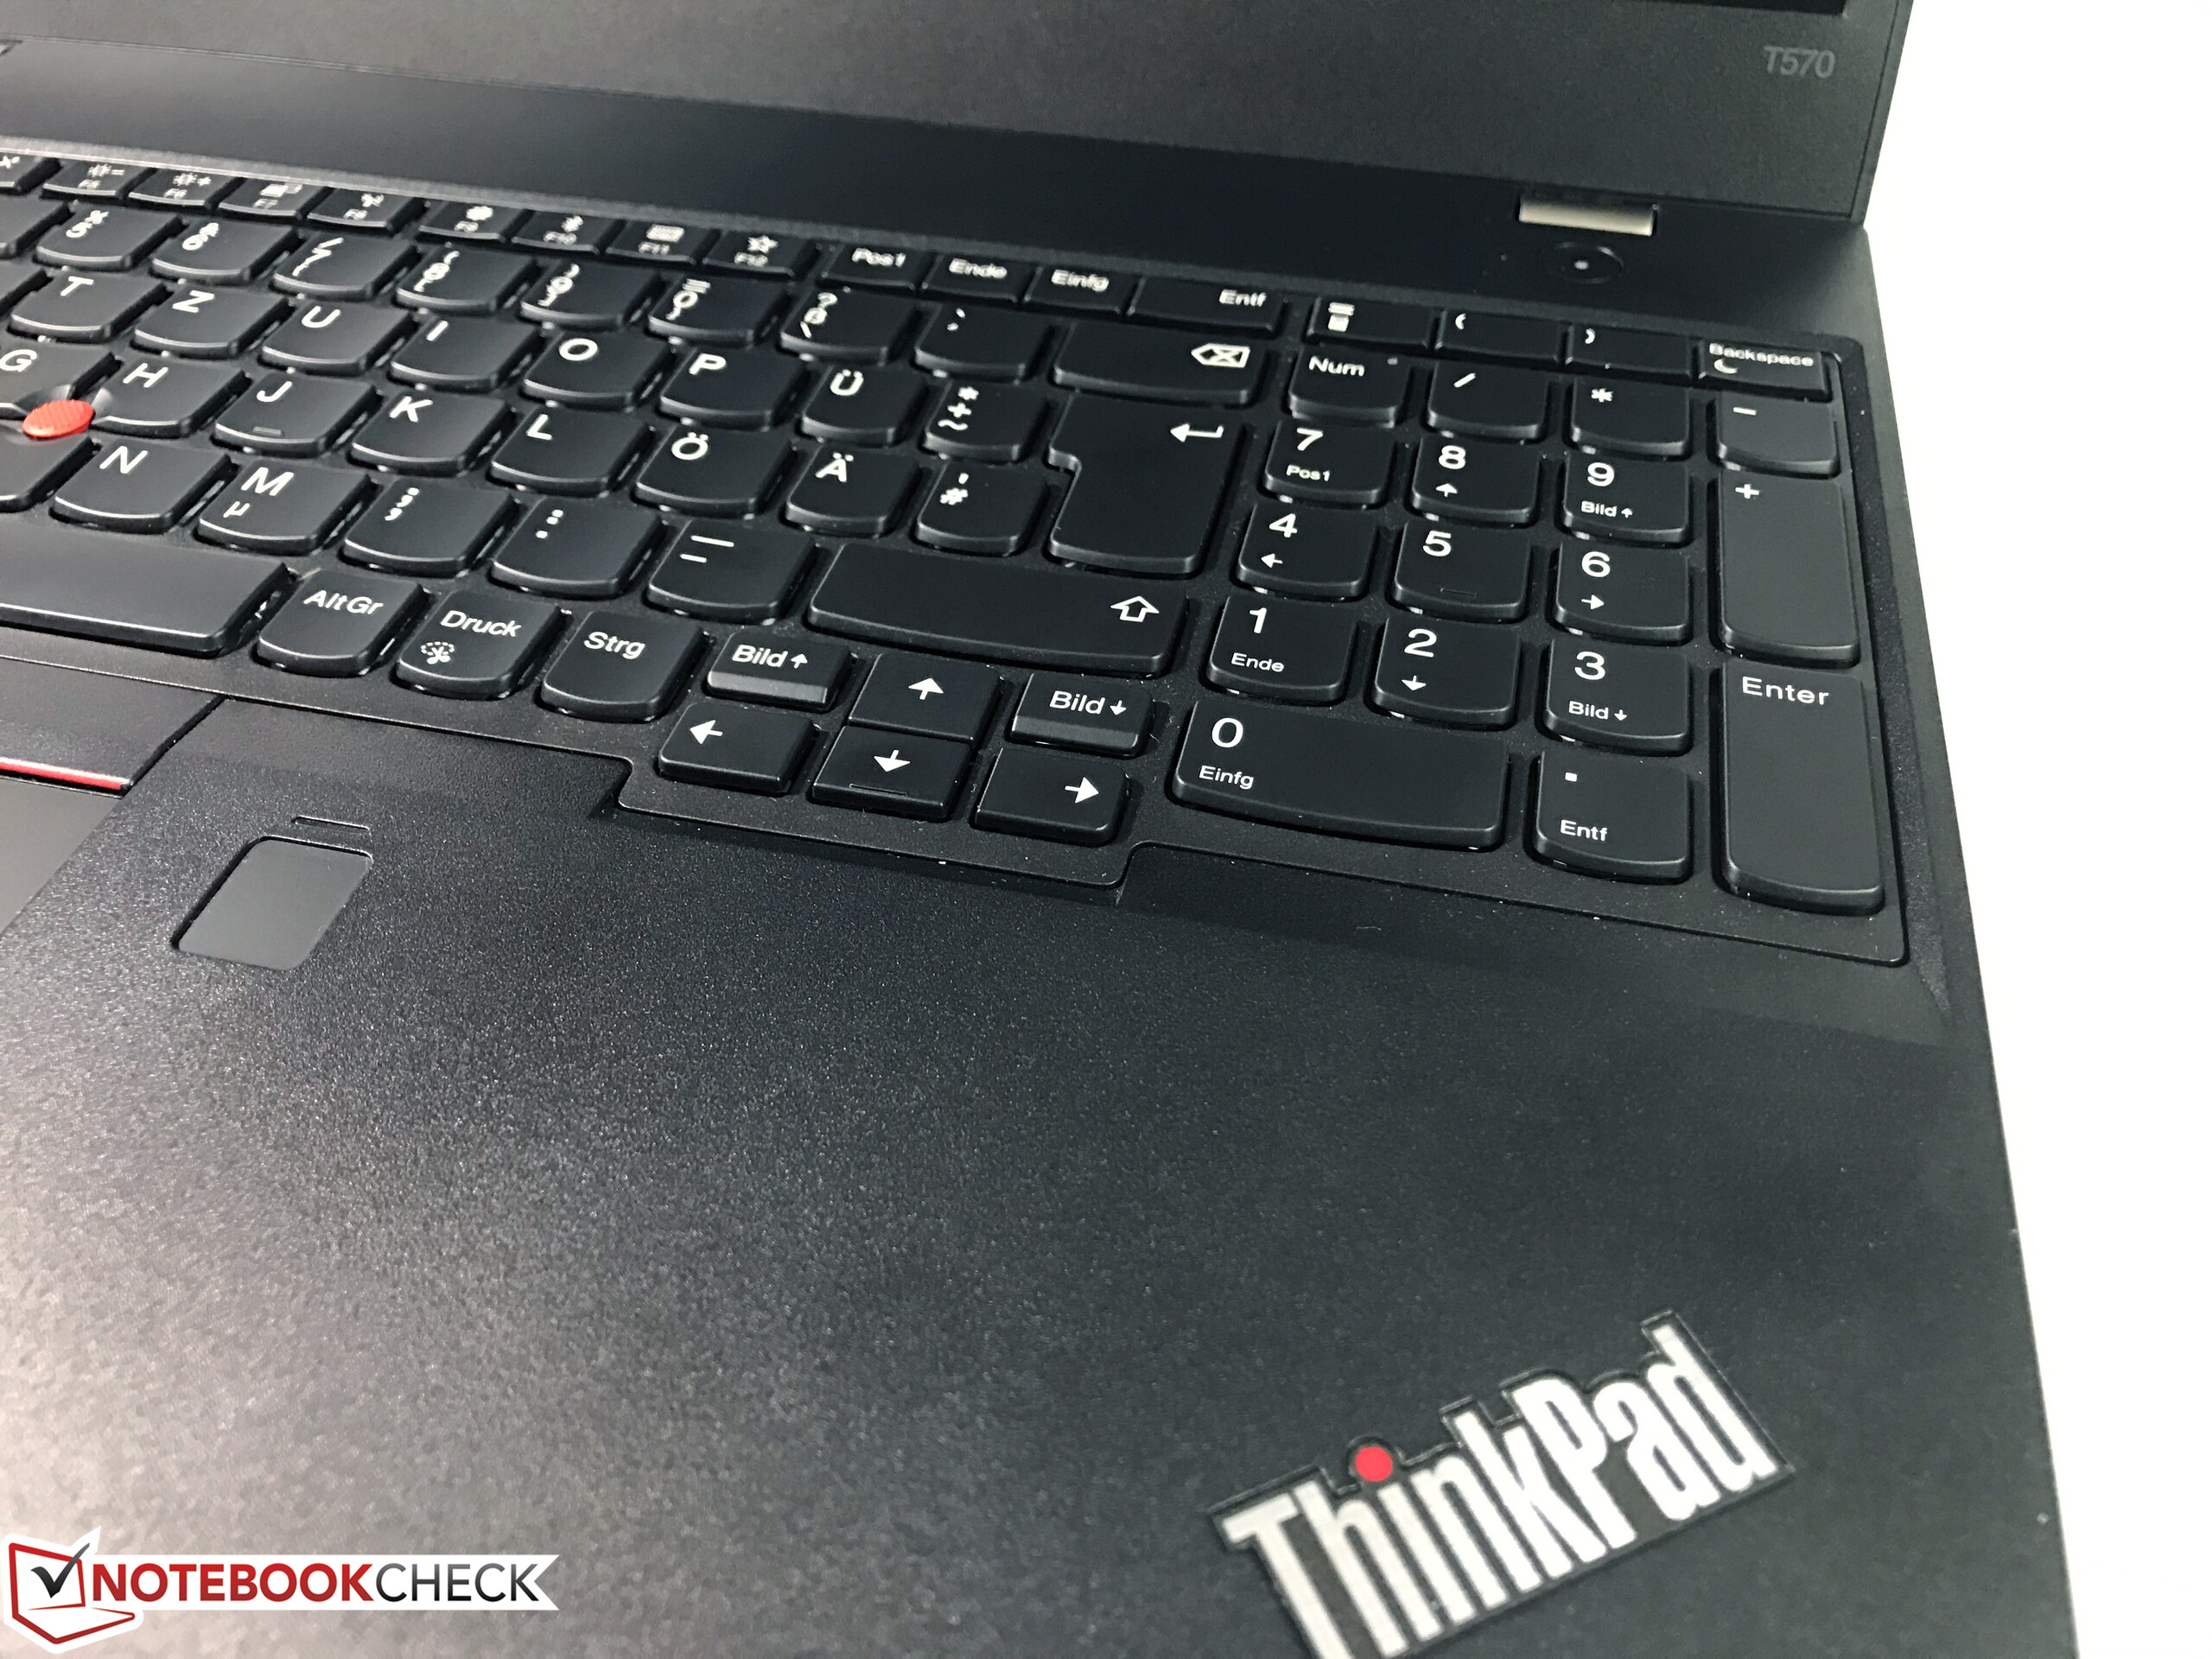
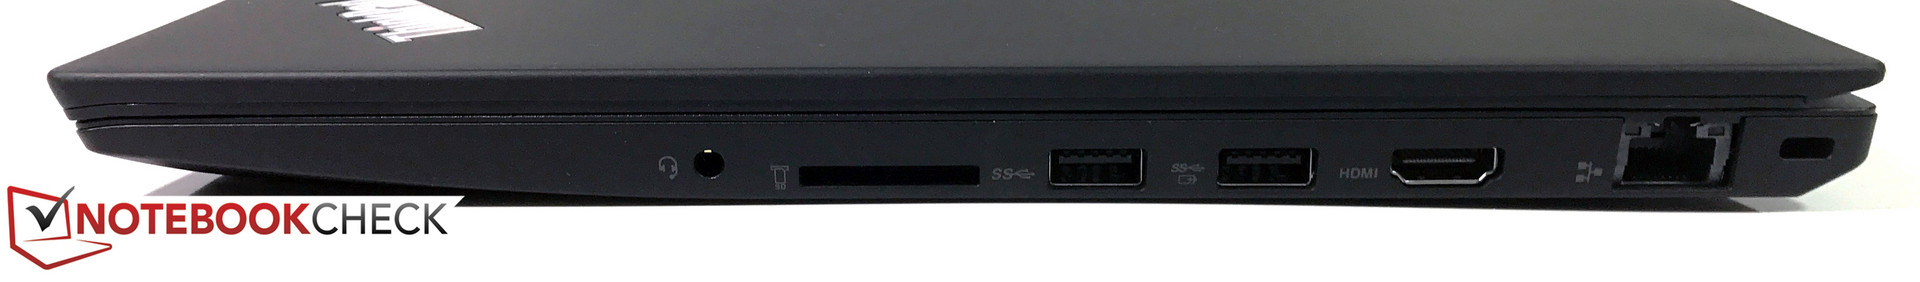
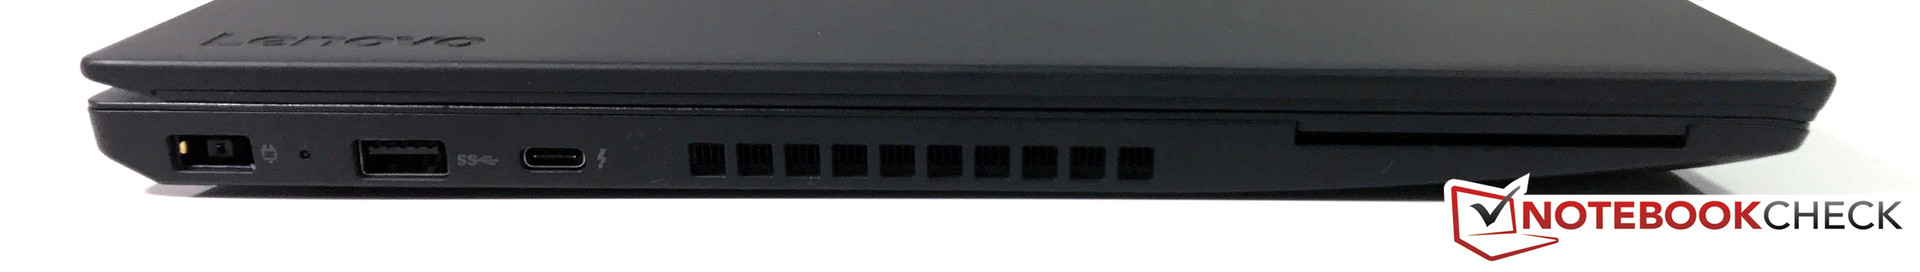
Andra fördelar inkluderar ett utmärkt tangentbordet, även om vissa tangenter är smalare på grund av det nya chassit. Pekplattan har förbättrats jämfört med den tidigare modellen. Lenovo har heller inte kompromissat med säkerhetsfunktioner, trådlös prestanda, portar eller batteritid.
En svaghet kvarstår från föregångaren, då Lenovo fortfarande använder en ganska medelmåttig Full HD-panel. Den bygger på IPS-teknik och är mer ljusstark jämfört med föregångaren ThinkPad T560, men har ändå inte en chans mot konkurrenterna. Färgreproduktionen är också begränsad.
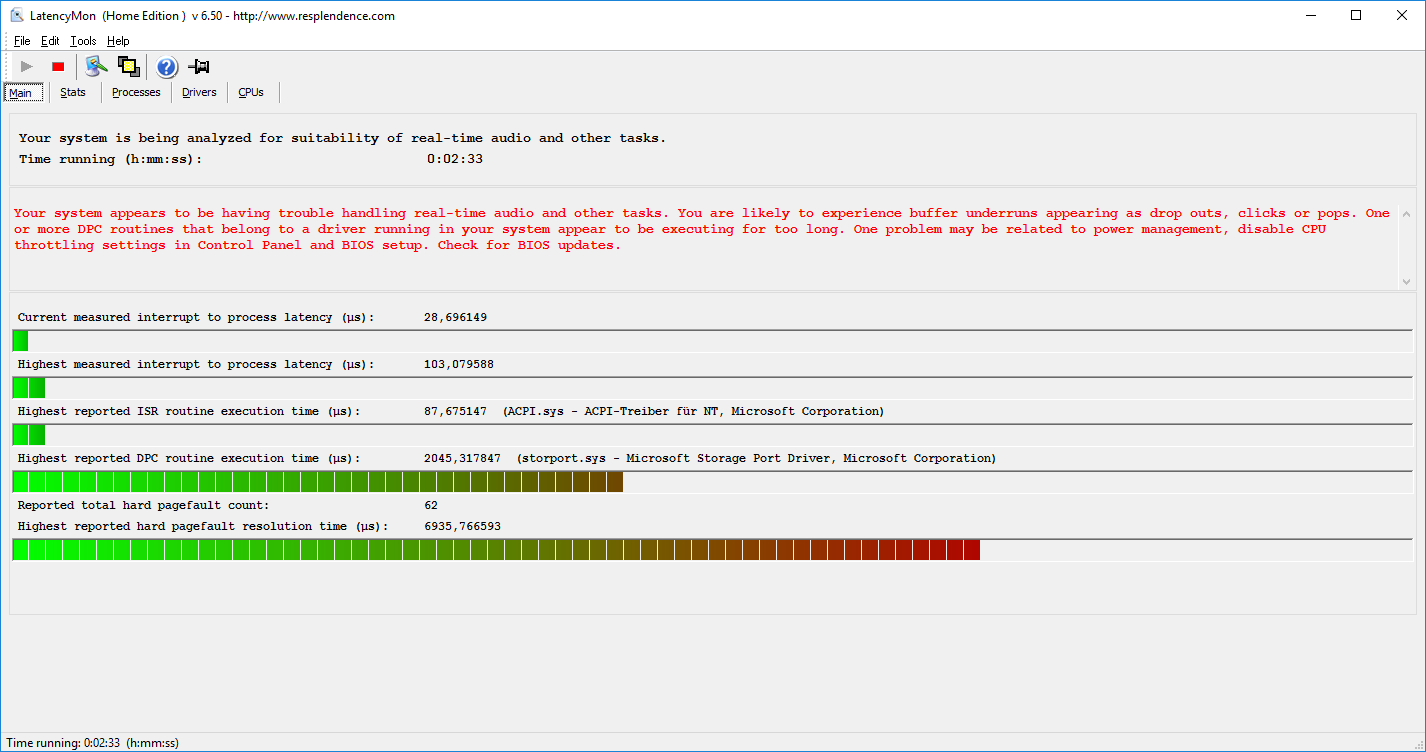
Vi blev ganska överraskade av att datorn ibland fick prestandahicka och vi misstänker en mjukvaruproblem. ULV-processorn kan utnyttja sin maximala potential i teorin, men den slår förr eller senare i sitt temperaturtak. Den betydande prestandabegränsningen vid batteridrift är också onödig. eftersom processorn inte ens kan behålla sin basfrekvens. Vi hoppas att problemet åtgärdas snart.
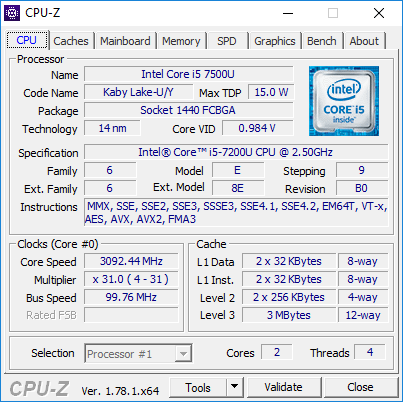
Lenovo ThinkPad T570-20H90002GE
- 04/15/2017 v6 (old)
Andreas Osthoff
Price comparison
