Test: Lenovo ThinkPad E490 - Radeon GPU:n är för mycket för kylningen (Sammanfattning)
Gradering | Datum | Modell | Vikt | Höjd | Storlek | Upplösning | Pris |
|---|---|---|---|---|---|---|---|
| 84.6 % v7 (old) | 05/2020 | Lenovo ThinkPad E490-20N90004GE i7-8565U, Radeon RX 550X (Laptop) | 1.9 kg | 19.9 mm | 14.00" | 1920x1080 | |
| 84.2 % v7 (old) | 11/2020 | Lenovo ThinkPad E495-20NE000JGE R5 3500U, Vega 8 | 1.8 kg | 19.9 mm | 14.00" | 1920x1080 | |
| 86.3 % v6 (old) | 03/2019 | HP ProBook 440 G6-5TK01EA i7-8565U, UHD Graphics 620 | 1.6 kg | 18 mm | 14.00" | 1920x1080 | |
| 85.6 % v7 (old) | 04/2020 | Schenker VIA 14 i5-10210U, UHD Graphics 620 | 1.1 kg | 16.5 mm | 14.00" | 1920x1080 | |
| 84.5 % v7 (old) | 03/2020 | Lenovo ThinkPad E14 20RA001MGE i5-10210U, UHD Graphics 620 | 1.6 kg | 17.9 mm | 14.00" | 1920x1080 |

| SD Card Reader | |
| average JPG Copy Test (av. of 3 runs) | |
| Lenovo ThinkPad E495-20NE000JGE (Toshiba Exceria Pro M501) | |
| Schenker VIA 14 | |
| HP ProBook 440 G6-5TK01EA (Toshiba Exceria Pro SDXC 64 GB UHS-II) | |
| Lenovo ThinkPad E490-20N90004GE (Toshiba Exceria Pro M501) | |
| Genomsnitt av klass Office (19.8 - 198.5, n=22, senaste 2 åren) | |
| maximum AS SSD Seq Read Test (1GB) | |
| Lenovo ThinkPad E495-20NE000JGE (Toshiba Exceria Pro M501) | |
| Schenker VIA 14 (Toshiba Exceria pro M501 64 GB UHS-II) | |
| Lenovo ThinkPad E490-20N90004GE (Toshiba Exceria Pro M501) | |
| HP ProBook 440 G6-5TK01EA (Toshiba Exceria Pro SDXC 64 GB UHS-II) | |
| Genomsnitt av klass Office (27.4 - 249, n=21, senaste 2 åren) | |
| |||||||||||||||||||||||||
Distribution av ljusstyrkan: 85 %
Mitt på batteriet: 278 cd/m²
Kontrast: 1463:1 (Svärta: 0.19 cd/m²)
ΔE ColorChecker Calman: 5.1 | ∀{0.5-29.43 Ø4.71}
calibrated: 4.5
ΔE Greyscale Calman: 2.7 | ∀{0.09-98 Ø4.96}
58.4% sRGB (Argyll 1.6.3 3D)
37.1% AdobeRGB 1998 (Argyll 1.6.3 3D)
40.27% AdobeRGB 1998 (Argyll 3D)
58.6% sRGB (Argyll 3D)
38.98% Display P3 (Argyll 3D)
Gamma: 2.21
CCT: 6685 K
| Lenovo ThinkPad E490-20N90004GE B140HAN04.2, IPS, 1920x1080, 14" | Lenovo ThinkPad E495-20NE000JGE N140HCA-EAC, IPS, 1920x1080, 14" | HP ProBook 440 G6-5TK01EA LG Philips, LGD05F1, IPS, 1920x1080, 14" | Schenker VIA 14 B140HAN06.2, a-Si AHVA-IPS LED, 1920x1080, 14" | Lenovo ThinkPad E14 20RA001MGE NV140FHM-N48, IPS LED, 1920x1080, 14" | |
|---|---|---|---|---|---|
| Display | 9% | -2% | 76% | 3% | |
| Display P3 Coverage (%) | 38.98 | 42.37 9% | 38.08 -2% | 69.8 79% | 40.31 3% |
| sRGB Coverage (%) | 58.6 | 63.5 8% | 57.2 -2% | 99.6 70% | 60 2% |
| AdobeRGB 1998 Coverage (%) | 40.27 | 43.8 9% | 39.37 -2% | 71.6 78% | 41.65 3% |
| Response Times | 2% | 7% | -28% | -25% | |
| Response Time Grey 50% / Grey 80% * (ms) | 44 ? | 40.8 ? 7% | 41.6 ? 5% | 60.8 ? -38% | 52 ? -18% |
| Response Time Black / White * (ms) | 30 ? | 30.8 ? -3% | 27.2 ? 9% | 35.2 ? -17% | 39.2 ? -31% |
| PWM Frequency (Hz) | 25000 ? | 1250 ? | |||
| Screen | 1% | -13% | 36% | -1% | |
| Brightness middle (cd/m²) | 278 | 241 -13% | 256 -8% | 335 21% | 305 10% |
| Brightness (cd/m²) | 257 | 230 -11% | 238 -7% | 309 20% | 292 14% |
| Brightness Distribution (%) | 85 | 75 -12% | 85 0% | 84 -1% | 89 5% |
| Black Level * (cd/m²) | 0.19 | 0.17 11% | 0.23 -21% | 0.17 11% | 0.17 11% |
| Contrast (:1) | 1463 | 1418 -3% | 1113 -24% | 1971 35% | 1794 23% |
| Colorchecker dE 2000 * | 5.1 | 4.7 8% | 6.2 -22% | 2.3 55% | 5.9 -16% |
| Colorchecker dE 2000 max. * | 19.3 | 19.7 -2% | 18.2 6% | 5 74% | 18.4 5% |
| Colorchecker dE 2000 calibrated * | 4.5 | 4.2 7% | 5.2 -16% | 1 78% | 4.6 -2% |
| Greyscale dE 2000 * | 2.7 | 2.6 4% | 3.8 -41% | 3.9 -44% | 4.4 -63% |
| Gamma | 2.21 100% | 2.12 104% | 2.5 88% | 2.19 100% | 2.05 107% |
| CCT | 6685 97% | 6507 100% | 6643 98% | 6556 99% | 6921 94% |
| Color Space (Percent of AdobeRGB 1998) (%) | 37.1 | 40.3 9% | 36.1 -3% | 65.5 77% | 38.2 3% |
| Color Space (Percent of sRGB) (%) | 58.4 | 63.3 8% | 56.9 -3% | 99.6 71% | 59.6 2% |
| Totalt genomsnitt (program/inställningar) | 4% /
2% | -3% /
-8% | 28% /
36% | -8% /
-3% |
* ... mindre är bättre
Visa svarstider
| ↔ Svarstid svart till vitt | ||
|---|---|---|
| 30 ms ... stiga ↗ och falla ↘ kombinerat | ↗ 17.2 ms stiga | 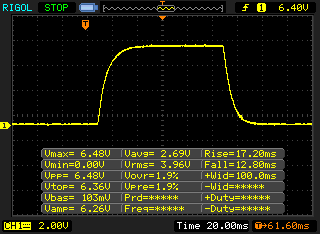 |
| ↘ 12.8 ms hösten | ||
| Skärmen visar långsamma svarsfrekvenser i våra tester och kommer att vara otillfredsställande för spelare. I jämförelse sträcker sig alla testade enheter från 0.1 (minst) till 240 (maximalt) ms. » 80 % av alla enheter är bättre. Detta innebär att den uppmätta svarstiden är sämre än genomsnittet av alla testade enheter (19.8 ms). | ||
| ↔ Svarstid 50 % grått till 80 % grått | ||
| 44 ms ... stiga ↗ och falla ↘ kombinerat | ↗ 22 ms stiga | 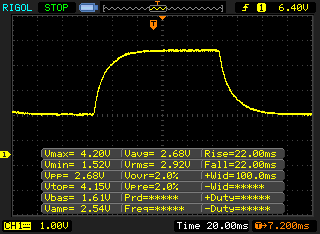 |
| ↘ 22 ms hösten | ||
| Skärmen visar långsamma svarsfrekvenser i våra tester och kommer att vara otillfredsställande för spelare. I jämförelse sträcker sig alla testade enheter från 0.165 (minst) till 636 (maximalt) ms. » 73 % av alla enheter är bättre. Detta innebär att den uppmätta svarstiden är sämre än genomsnittet av alla testade enheter (30.9 ms). | ||
Skärmflimmer / PWM (Puls-Width Modulation)
| Skärmflimmer / PWM upptäcktes inte | 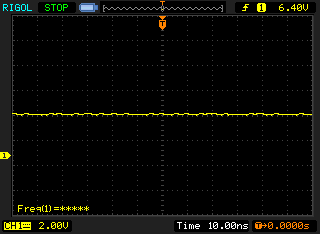 | ||
Som jämförelse: 52 % av alla testade enheter använder inte PWM för att dämpa skärmen. Om PWM upptäcktes mättes ett medelvärde av 7744 (minst: 5 - maximum: 343500) Hz. | |||
Cinebench R15: CPU Single 64Bit | CPU Multi 64Bit
Blender: v2.79 BMW27 CPU
7-Zip 18.03: 7z b 4 -mmt1 | 7z b 4
Geekbench 5.5: Single-Core | Multi-Core
HWBOT x265 Benchmark v2.2: 4k Preset
R Benchmark 2.5: Overall mean
| Cinebench R20 / CPU (Single Core) | |
| Genomsnitt av klass Office (345 - 816, n=75, senaste 2 åren) | |
| Lenovo ThinkPad E14 20RA001MGE | |
| Genomsnitt Intel Core i7-8565U (342 - 472, n=20) | |
| Lenovo ThinkPad E490-20N90004GE | |
| Schenker VIA 14 | |
| Lenovo ThinkPad E495-20NE000JGE | |
| Cinebench R20 / CPU (Multi Core) | |
| Genomsnitt av klass Office (648 - 8840, n=75, senaste 2 åren) | |
| Lenovo ThinkPad E490-20N90004GE | |
| Lenovo ThinkPad E495-20NE000JGE | |
| Genomsnitt Intel Core i7-8565U (954 - 1645, n=20) | |
| Lenovo ThinkPad E14 20RA001MGE | |
| Schenker VIA 14 | |
| Cinebench R15 / CPU Single 64Bit | |
| Genomsnitt av klass Office (99.5 - 316, n=77, senaste 2 åren) | |
| HP ProBook 440 G6-5TK01EA | |
| Lenovo ThinkPad E490-20N90004GE | |
| Genomsnitt Intel Core i7-8565U (138.3 - 193, n=51) | |
| Lenovo ThinkPad E14 20RA001MGE | |
| Schenker VIA 14 | |
| Lenovo ThinkPad E495-20NE000JGE | |
| Cinebench R15 / CPU Multi 64Bit | |
| Genomsnitt av klass Office (250 - 3380, n=77, senaste 2 åren) | |
| Schenker VIA 14 | |
| Lenovo ThinkPad E495-20NE000JGE | |
| Lenovo ThinkPad E490-20N90004GE | |
| Genomsnitt Intel Core i7-8565U (452 - 815, n=52) | |
| HP ProBook 440 G6-5TK01EA | |
| Lenovo ThinkPad E14 20RA001MGE | |
| Blender / v2.79 BMW27 CPU | |
| Lenovo ThinkPad E490-20N90004GE | |
| Schenker VIA 14 | |
| Lenovo ThinkPad E14 20RA001MGE | |
| HP ProBook 440 G6-5TK01EA | |
| Genomsnitt Intel Core i7-8565U (687 - 1175, n=22) | |
| Lenovo ThinkPad E495-20NE000JGE | |
| Genomsnitt av klass Office (158 - 1940, n=76, senaste 2 åren) | |
| 7-Zip 18.03 / 7z b 4 -mmt1 | |
| Genomsnitt av klass Office (3387 - 6469, n=77, senaste 2 åren) | |
| HP ProBook 440 G6-5TK01EA | |
| Genomsnitt Intel Core i7-8565U (2029 - 5923, n=23) | |
| Schenker VIA 14 | |
| Lenovo ThinkPad E14 20RA001MGE | |
| Lenovo ThinkPad E495-20NE000JGE | |
| Lenovo ThinkPad E490-20N90004GE | |
| 7-Zip 18.03 / 7z b 4 | |
| Genomsnitt av klass Office (7098 - 76886, n=77, senaste 2 åren) | |
| Genomsnitt Intel Core i7-8565U (10531 - 24847, n=23) | |
| HP ProBook 440 G6-5TK01EA | |
| Lenovo ThinkPad E495-20NE000JGE | |
| Lenovo ThinkPad E14 20RA001MGE | |
| Schenker VIA 14 | |
| Lenovo ThinkPad E490-20N90004GE | |
| Geekbench 5.5 / Single-Core | |
| Genomsnitt av klass Office (811 - 2175, n=73, senaste 2 åren) | |
| Genomsnitt Intel Core i7-8565U (1108 - 1163, n=2) | |
| Lenovo ThinkPad E490-20N90004GE | |
| Schenker VIA 14 | |
| Lenovo ThinkPad E14 20RA001MGE | |
| Geekbench 5.5 / Multi-Core | |
| Genomsnitt av klass Office (1483 - 16999, n=73, senaste 2 åren) | |
| Schenker VIA 14 | |
| Lenovo ThinkPad E490-20N90004GE | |
| Lenovo ThinkPad E14 20RA001MGE | |
| Genomsnitt Intel Core i7-8565U (2839 - 3308, n=2) | |
| HWBOT x265 Benchmark v2.2 / 4k Preset | |
| Genomsnitt av klass Office (2.21 - 26, n=76, senaste 2 åren) | |
| Genomsnitt Intel Core i7-8565U (3.24 - 5.5, n=22) | |
| HP ProBook 440 G6-5TK01EA | |
| Lenovo ThinkPad E14 20RA001MGE | |
| Lenovo ThinkPad E495-20NE000JGE | |
| Schenker VIA 14 | |
| Lenovo ThinkPad E490-20N90004GE | |
| R Benchmark 2.5 / Overall mean | |
| Genomsnitt Intel Core i7-8565U (0.682 - 0.851, n=2) | |
| Lenovo ThinkPad E14 20RA001MGE | |
| Schenker VIA 14 | |
| Lenovo ThinkPad E490-20N90004GE | |
| Genomsnitt av klass Office (0.393 - 0.888, n=76, senaste 2 åren) | |
* ... mindre är bättre
| PCMark 8 Home Score Accelerated v2 | 4704 poäng | |
| PCMark 8 Creative Score Accelerated v2 | 5792 poäng | |
| PCMark 8 Work Score Accelerated v2 | 5256 poäng | |
| PCMark 10 Score | 4533 poäng | |
Hjälp | ||

| 3DMark 06 Standard Score | 21483 poäng | |
| 3DMark Vantage P Result | 14409 poäng | |
| 3DMark 11 Performance | 5565 poäng | |
| 3DMark Cloud Gate Standard Score | 10371 poäng | |
| 3DMark Fire Strike Score | 3258 poäng | |
| 3DMark Time Spy Score | 1167 poäng | |
Hjälp | ||
| låg | med. | hög | ultra | |
|---|---|---|---|---|
| BioShock Infinite (2013) | 165.7 | 101.5 | 83.8 | 29.1 |
| The Witcher 3 (2015) | 62.3 | 39 | 20.2 | 12.5 |
| Dota 2 Reborn (2015) | 74.8 | 69.6 | 52.1 | 49.1 |
| Rise of the Tomb Raider (2016) | 65.7 | 39.8 | 20.2 | |
| Battlefield 1 (2016) | 69.1 | 52.2 | 23.8 | |
| For Honor (2017) | 75.7 | 26.5 | 25.3 | 16.3 |
| Ghost Recon Wildlands (2017) | 46.9 | 20.5 | 13.6 | |
| X-Plane 11.11 (2018) | 11 | 9.57 | 9.23 | |
| Far Cry 5 (2018) | 47 | 21 | 18 | 15 |
Ljudnivå
| Låg belastning |
| 29.3 / 29.3 / 29.3 dB(A) |
| Hårddisk |
| 30.2 dB(A) |
| Hög belastning |
| 34.2 / 34.2 dB(A) |
 | ||
30 dB tyst 40 dB(A) hörbar 50 dB(A) högt ljud |
||
min: | ||
(-) Den maximala temperaturen på ovansidan är 53.1 °C / 128 F, jämfört med genomsnittet av 34.3 °C / 94 F , allt från 21.2 till 62.5 °C för klassen Office.
(-) Botten värms upp till maximalt 63.8 °C / 147 F, jämfört med genomsnittet av 36.8 °C / 98 F
(+) Vid tomgångsbruk är medeltemperaturen för ovansidan 24.5 °C / 76 F, jämfört med enhetsgenomsnittet på 29.5 °C / ### class_avg_f### F.
(±) När du spelar The Witcher 3 är medeltemperaturen för ovansidan 37.7 °C / 100 F, jämfört med enhetsgenomsnittet på 29.5 °C / ## #class_avg_f### F.
(+) Handledsstöden och pekplattan är kallare än hudtemperaturen med maximalt 29.4 °C / 84.9 F och är därför svala att ta på.
(±) Medeltemperaturen för handledsstödsområdet på liknande enheter var 27.6 °C / 81.7 F (-1.8 °C / -3.2 F).
Lenovo ThinkPad E490-20N90004GE ljudanalys
(-) | inte särskilt höga högtalare (71.5 dB)
Bas 100 - 315 Hz
(±) | reducerad bas - i genomsnitt 13.5% lägre än medianen
(-) | basen är inte linjär (15.7% delta till föregående frekvens)
Mellan 400 - 2000 Hz
(±) | högre mellan - i genomsnitt 6.5% högre än median
(±) | linjäriteten för mids är genomsnittlig (10.2% delta till föregående frekvens)
Högsta 2 - 16 kHz
(+) | balanserade toppar - endast 3.1% från medianen
(±) | linjäriteten för toppar är genomsnittlig (12.1% delta till föregående frekvens)
Totalt 100 - 16 000 Hz
(±) | linjäriteten för det totala ljudet är genomsnittlig (23.4% skillnad mot median)
Jämfört med samma klass
» 66% av alla testade enheter i den här klassen var bättre, 8% liknande, 26% sämre
» Den bästa hade ett delta på 7%, genomsnittet var 21%, sämst var 53%
Jämfört med alla testade enheter
» 70% av alla testade enheter var bättre, 6% liknande, 24% sämre
» Den bästa hade ett delta på 4%, genomsnittet var 23%, sämst var 134%
HP ProBook 440 G6-5TK01EA ljudanalys
(±) | högtalarljudstyrkan är genomsnittlig men bra (78.1 dB)
Bas 100 - 315 Hz
(-) | nästan ingen bas - i genomsnitt 17.2% lägre än medianen
(±) | linjäriteten för basen är genomsnittlig (12.1% delta till föregående frekvens)
Mellan 400 - 2000 Hz
(+) | balanserad mellan - endast 3.3% från medianen
(+) | mids är linjära (6.7% delta till föregående frekvens)
Högsta 2 - 16 kHz
(±) | högre toppar - i genomsnitt 5.7% högre än medianen
(±) | linjäriteten för toppar är genomsnittlig (7.1% delta till föregående frekvens)
Totalt 100 - 16 000 Hz
(±) | linjäriteten för det totala ljudet är genomsnittlig (20.8% skillnad mot median)
Jämfört med samma klass
» 49% av alla testade enheter i den här klassen var bättre, 9% liknande, 42% sämre
» Den bästa hade ett delta på 7%, genomsnittet var 21%, sämst var 53%
Jämfört med alla testade enheter
» 56% av alla testade enheter var bättre, 8% liknande, 36% sämre
» Den bästa hade ett delta på 4%, genomsnittet var 23%, sämst var 134%
| Av/Standby | |
| Låg belastning | |
| Hög belastning |
|
Förklaring:
min: | |
För
Emot
Omdöme – En Radeon GPU är för mycket för E490
Läs den fullständiga versionen av den här recensionen på engelska här.
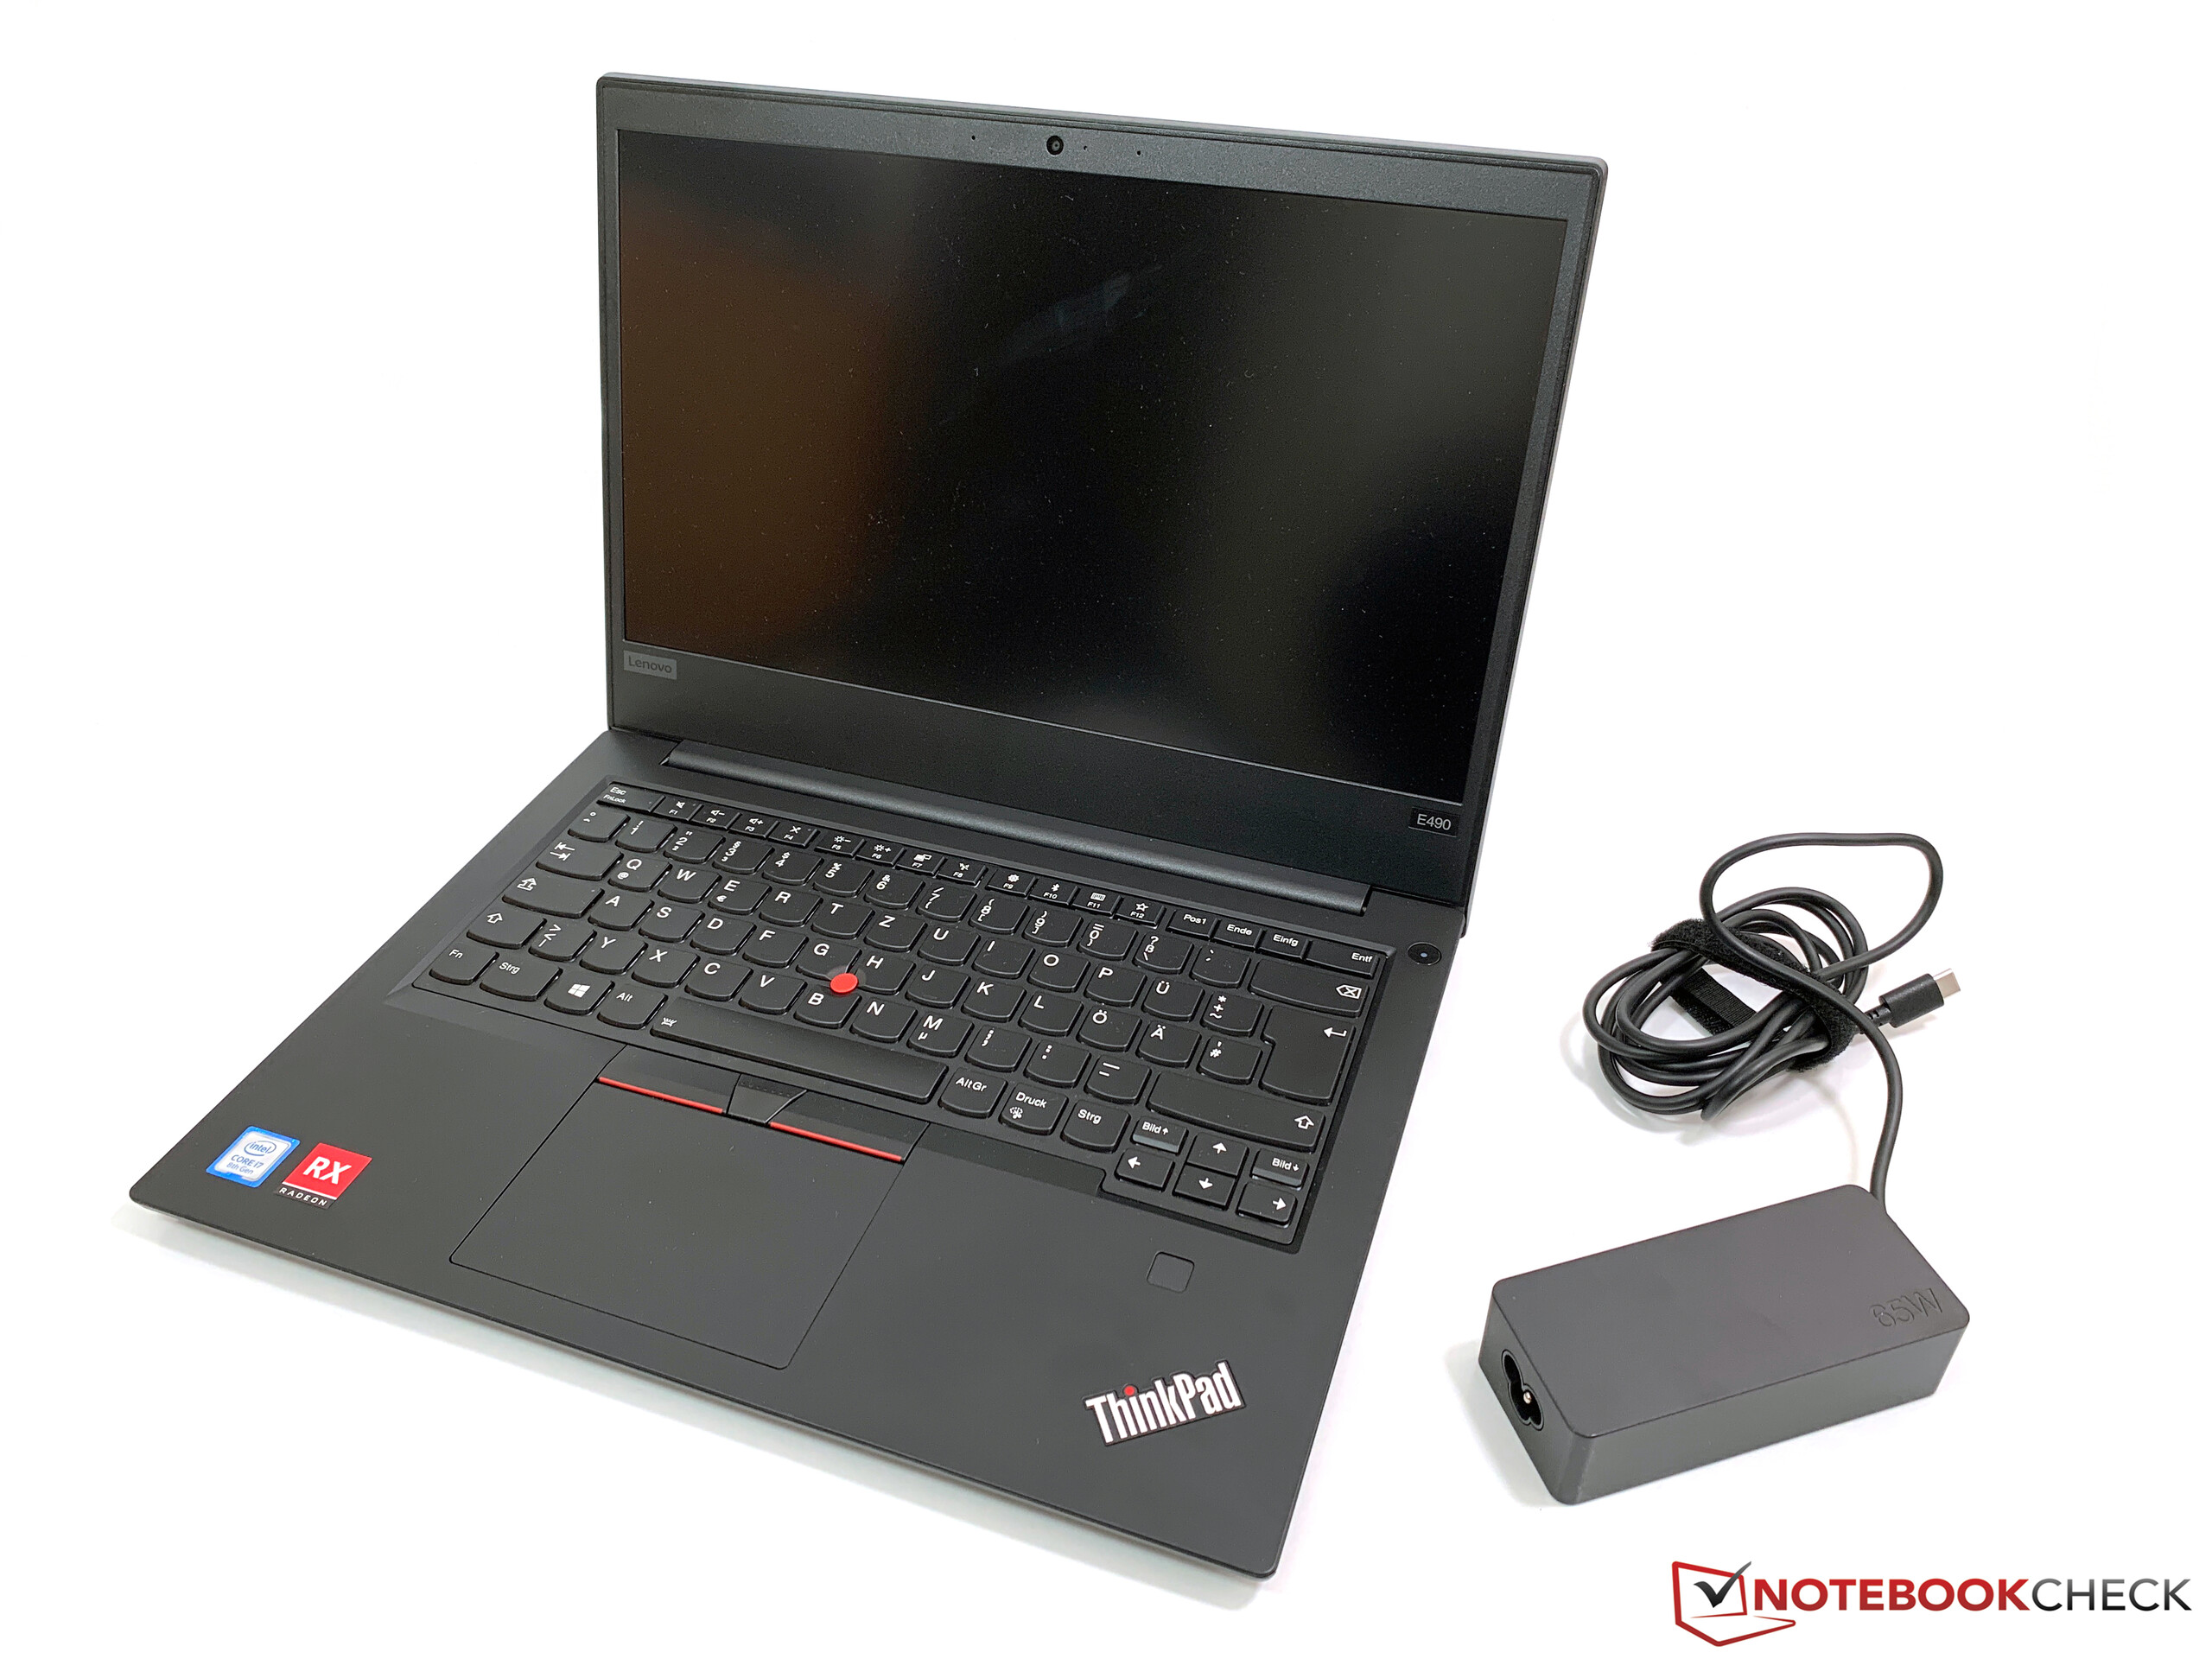
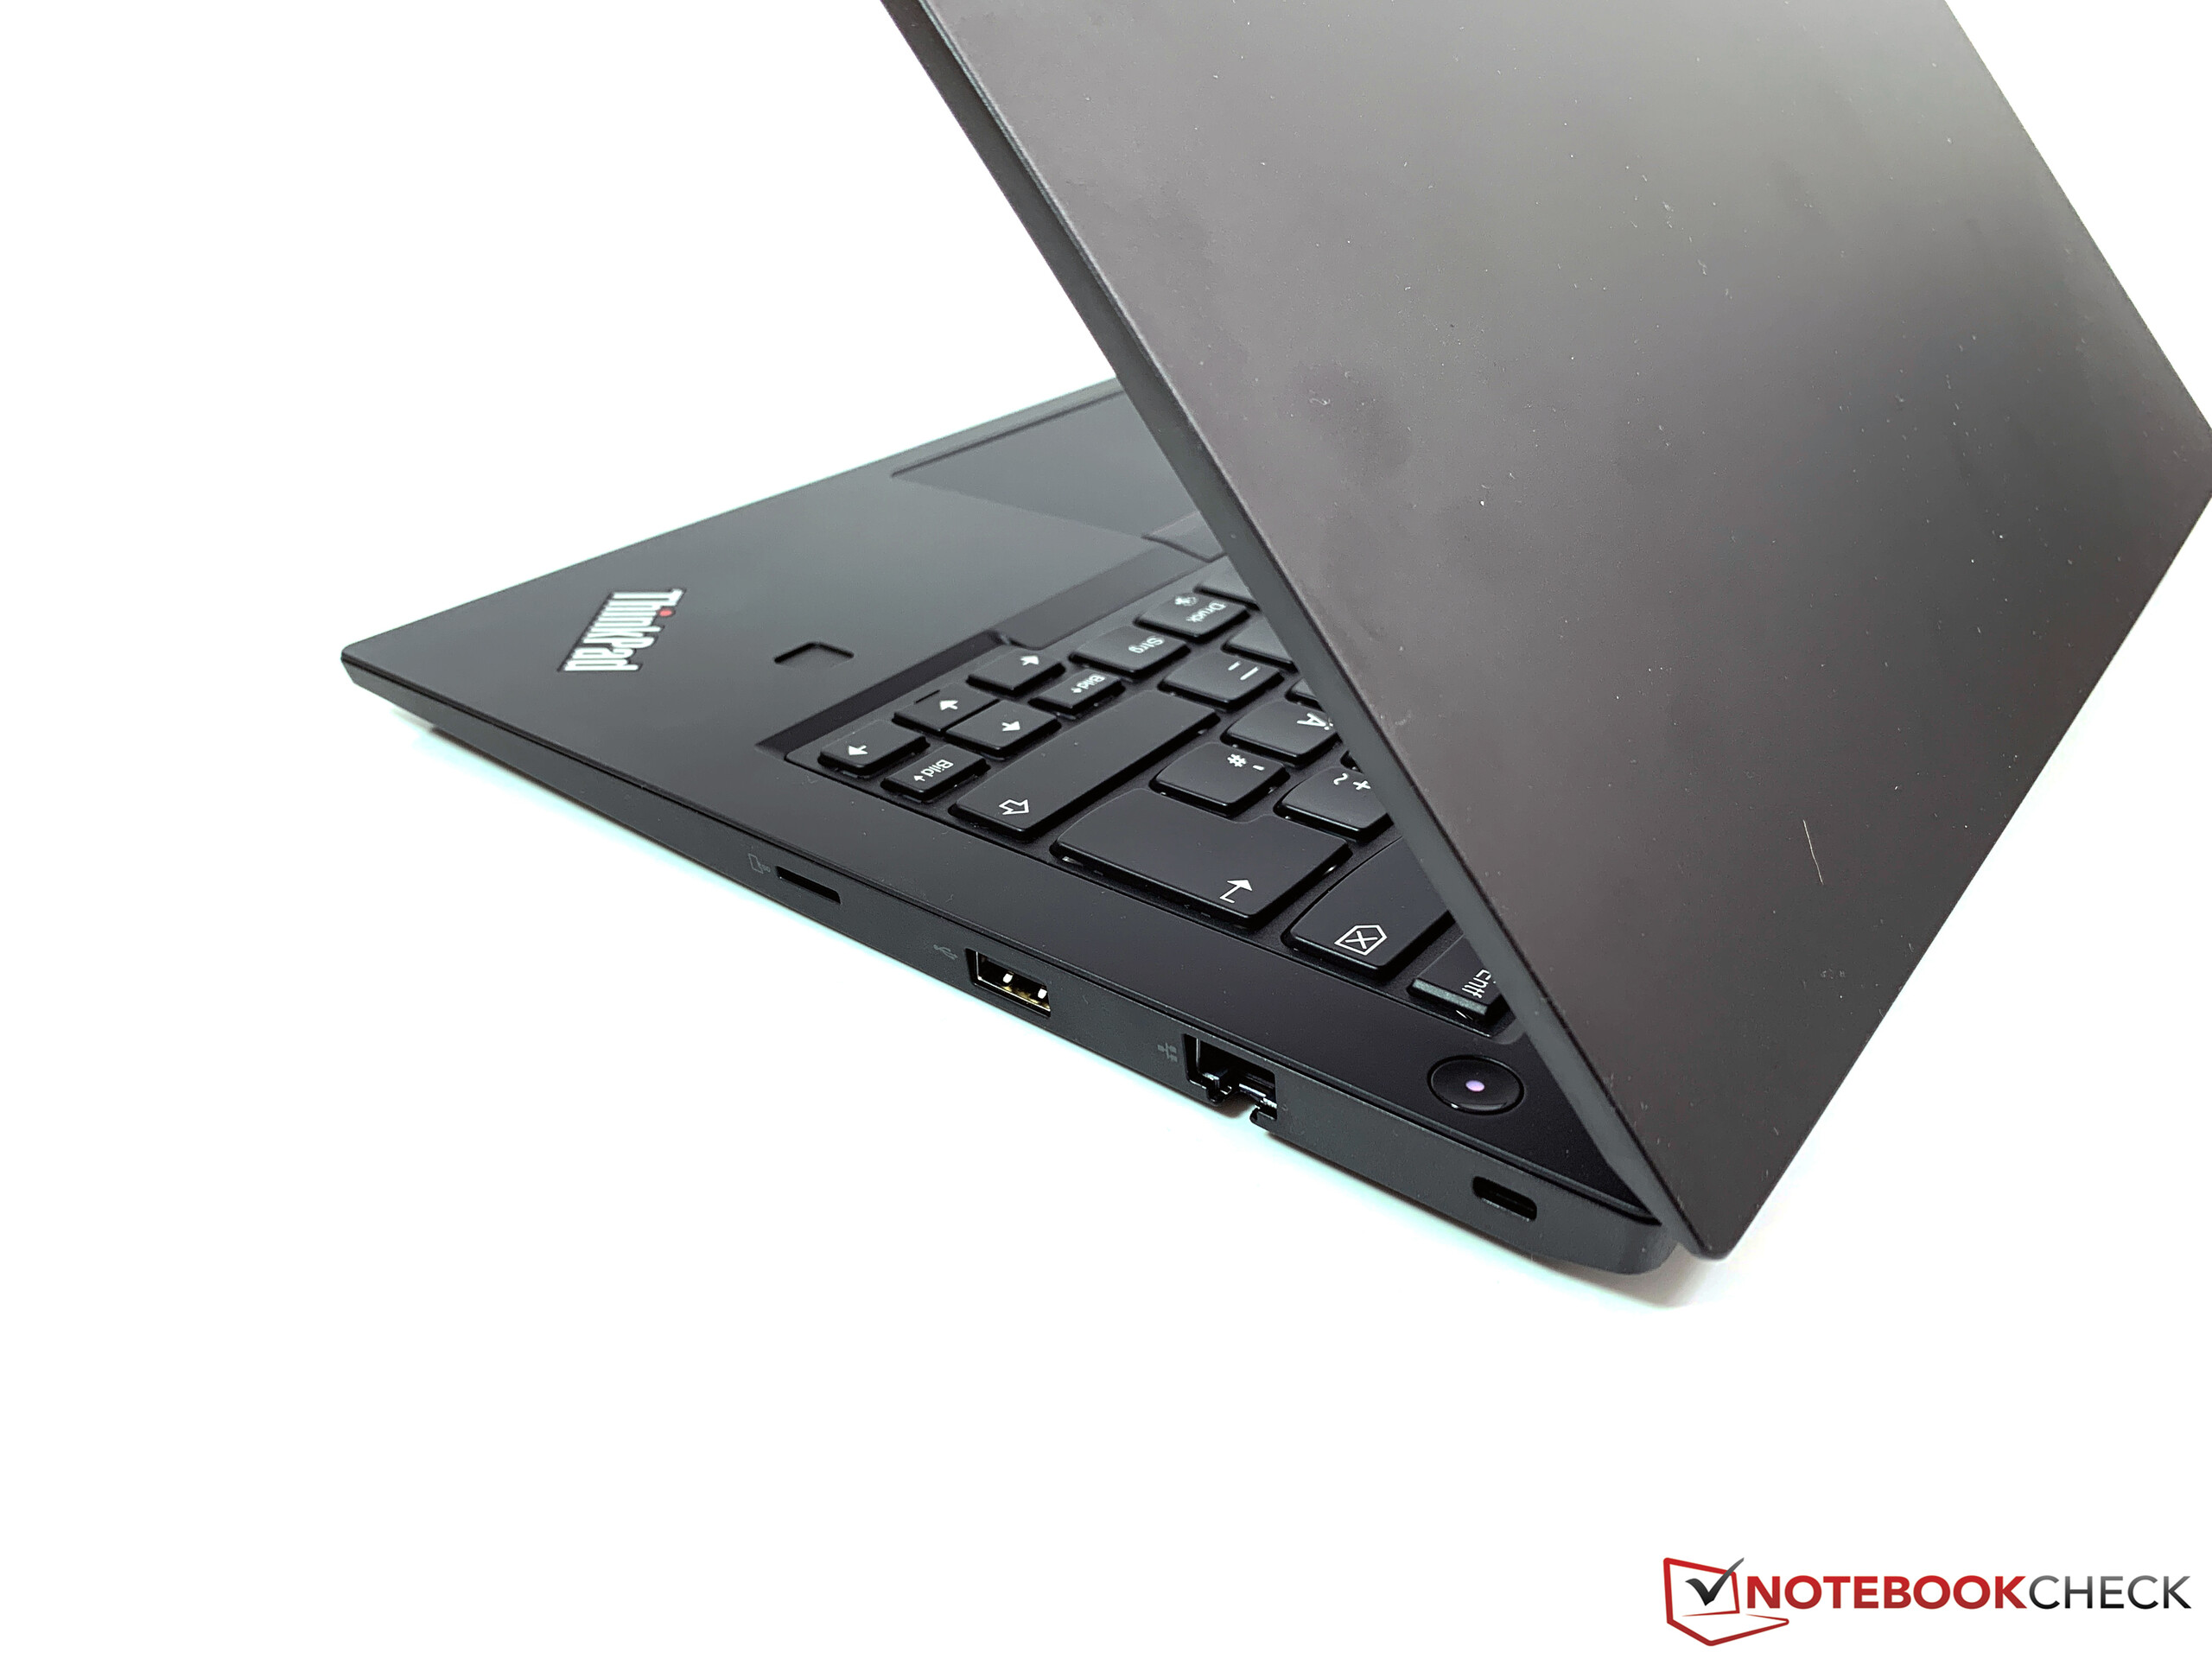
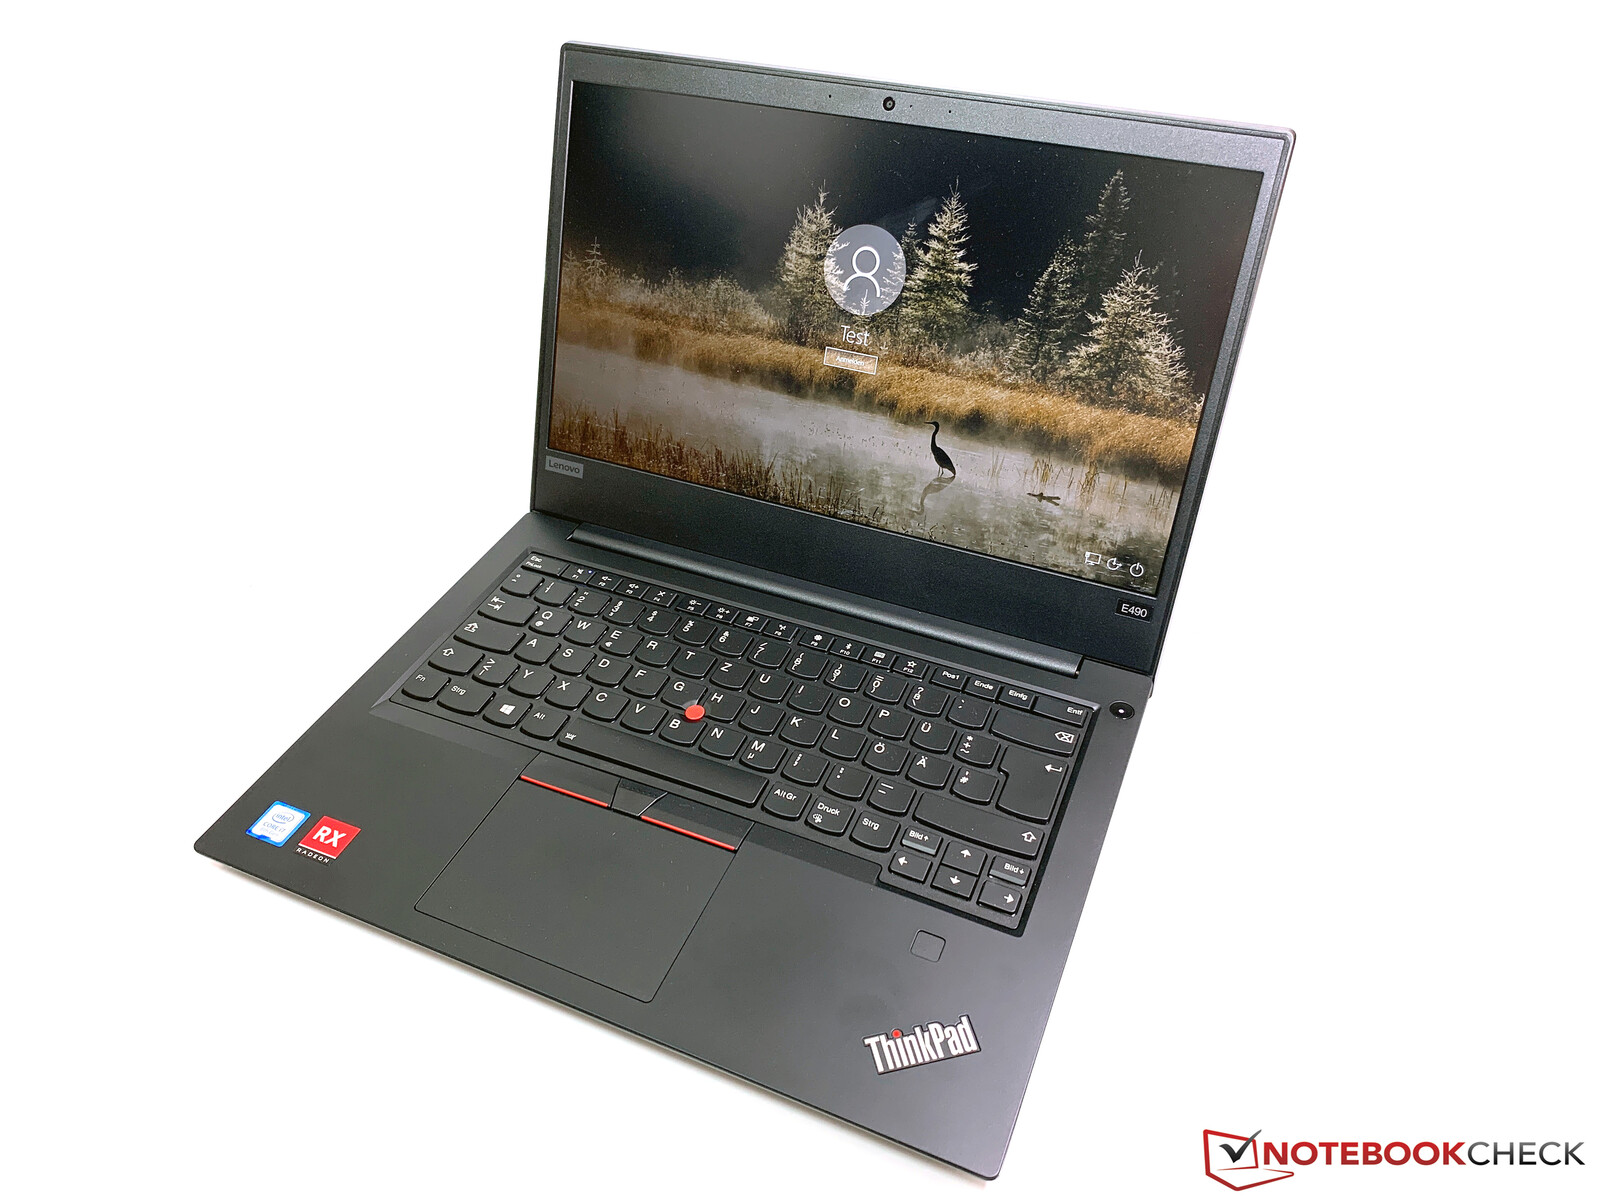
Med ett dedikerat AMD-grafikkort får ThinkPad E490 en märkbar ökning i GPU-prestanda, så denna kontorslaptop kan också hantera lite enklare spel. Men du får i gengäld leva med höga yttemperaturer. Upp till 60 °C är mycket och det märks att kyllösningen är otillräcklig. Fläkten är fortfarande jämförelsevis tyst, så det verkar som att Lenovo tillåter höga temperaturer till förmån för en tystare enhet. Man bör vara medveten om värmen och inte placera enheten i knät vid belastning.
Mer GPU-prestanda, men också högre temperaturer: ThinkPad E490 är ett hyfsat val om du vill spela lite spel efter jobbet.
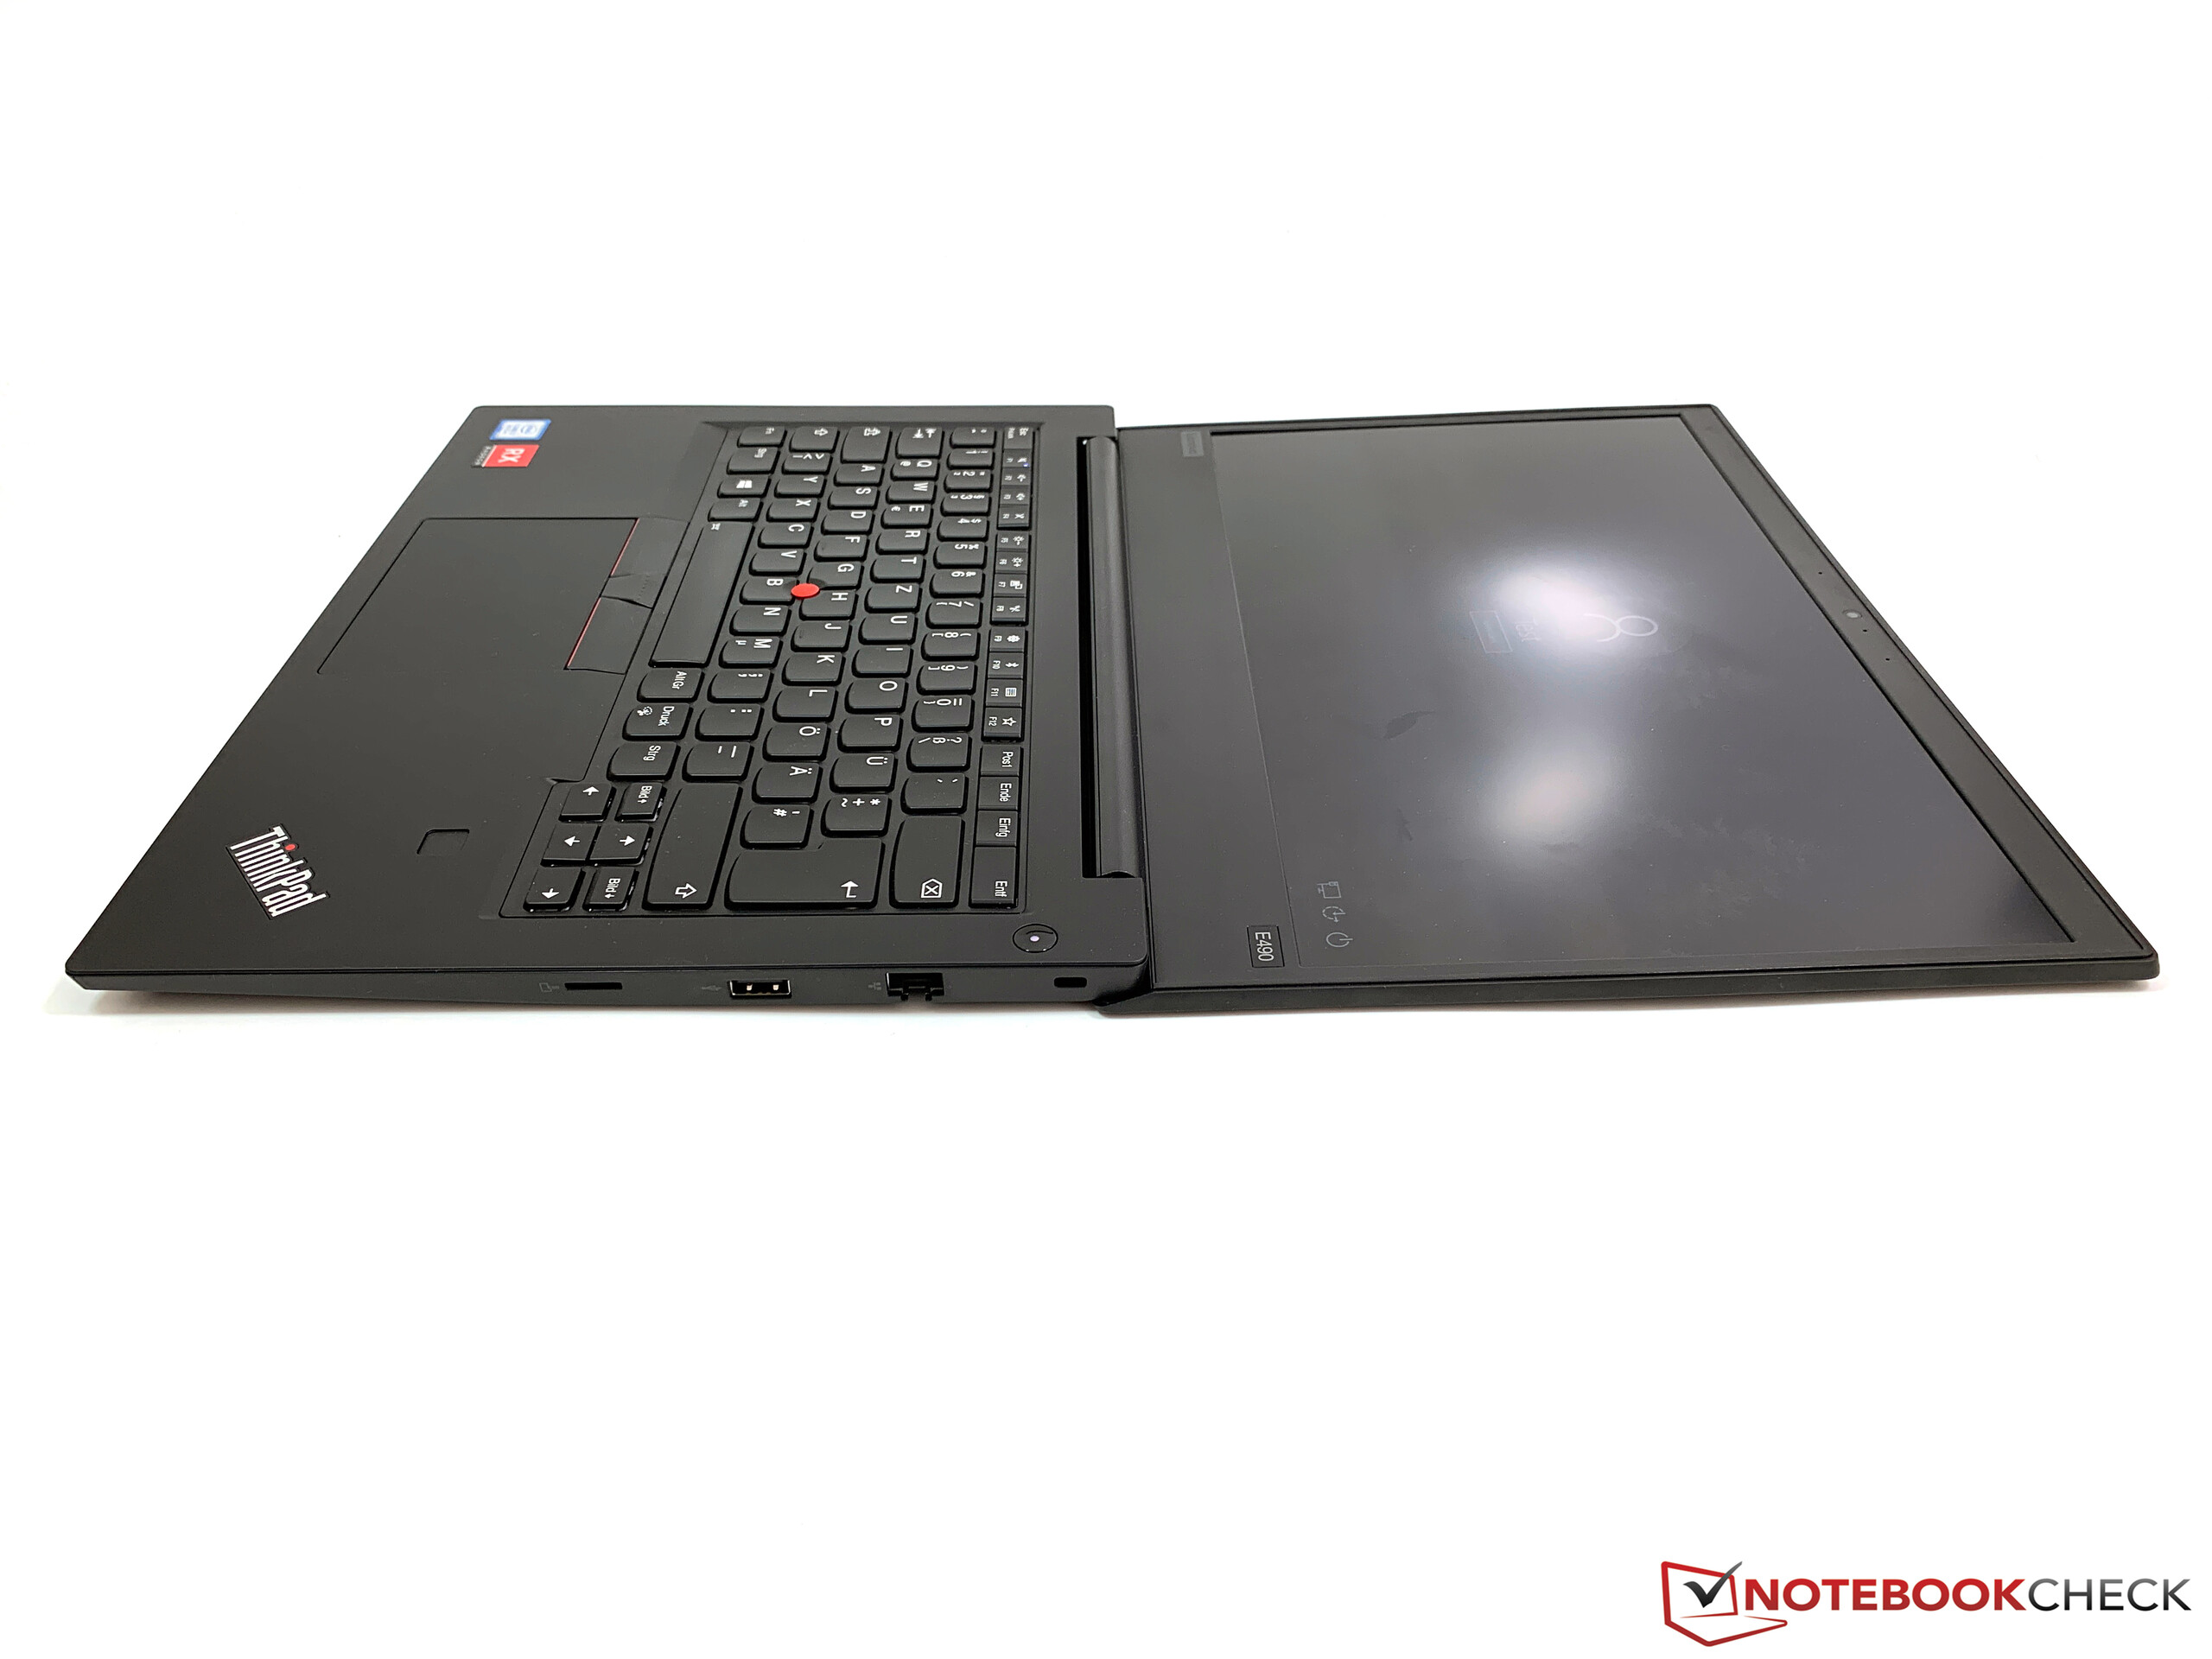
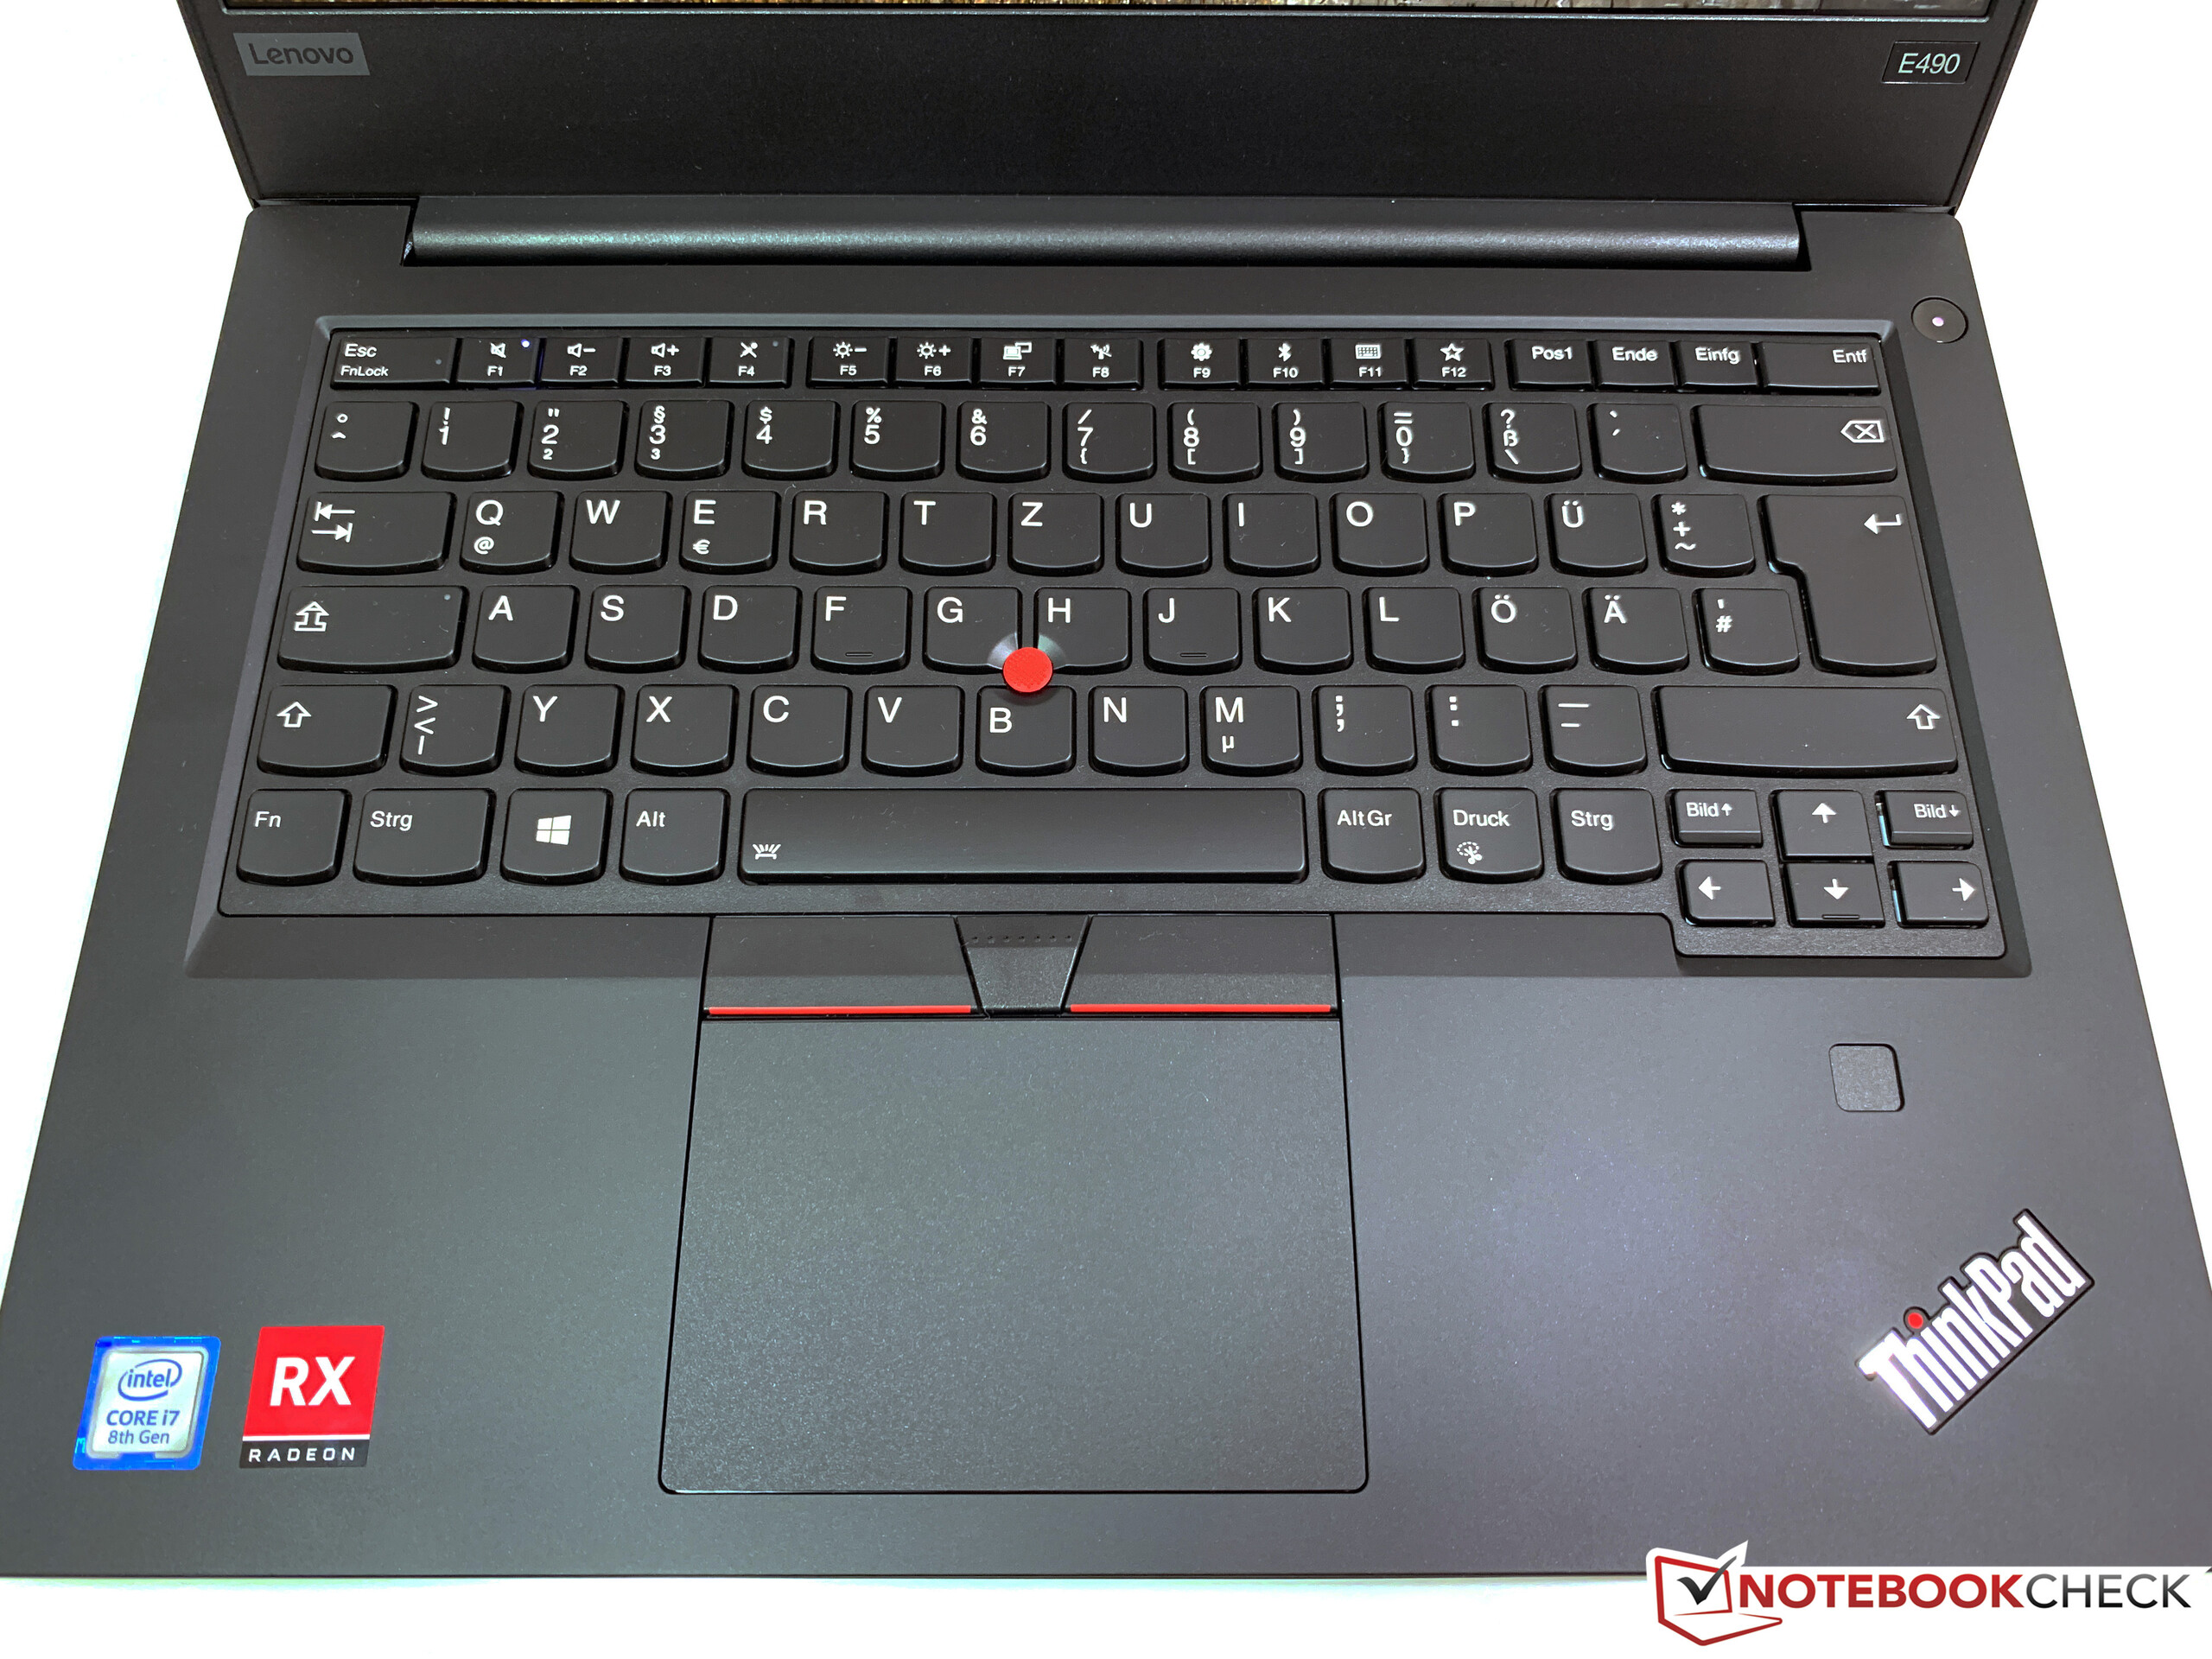
I övrigt har den samma fördelar och nackdelar som E490 och E495. Den största höjdpunkten med ThinkPad är onekligen det utmärkta tangentbordet, men skärmen är lite av ett lotteri på grund av att olika tillverkare levererar skärmarna. Om du inte vill spela spel rekommenderar vi att du tittar på ThinkPad E495 eller nya ThinkPad E14 med iGPU.
Lenovo ThinkPad E490-20N90004GE
- 05/18/2020 v7 (old)
Andreas Osthoff
Price comparison
