Test: Lenovo ThinkPad E15 - För mycket prestanda och för lite kylning (Sammanfattning)
Gradering | Datum | Modell | Vikt | Höjd | Storlek | Upplösning | Pris |
|---|---|---|---|---|---|---|---|
| 82.1 % v7 (old) | 03/2020 | Lenovo ThinkPad E15 20RD0011GE i7-10510U, Radeon RX 640 | 1.8 kg | 18.9 mm | 15.60" | 1920x1080 | |
| 87.6 % v6 (old) | 04/2019 | Lenovo ThinkPad E590-20NB0012GE i7-8565U, Radeon RX 550X (Laptop) | 1.9 kg | 19.9 mm | 15.60" | 1920x1080 | |
| 86.6 % v7 (old) | 07/2019 | Lenovo ThinkPad T590-20N4002VGE i7-8565U, GeForce MX250 | 1.9 kg | 19.95 mm | 15.60" | 1920x1080 | |
| 81.1 % v6 (old) | 07/2019 | Dell Vostro 15-5581 i5-8265U, GeForce MX130 | 2 kg | 18.04 mm | 15.60" | 1920x1080 | |
| 80.1 % v7 (old) | 02/2020 | MSI Modern 15 A10RB i7-10510U, GeForce MX250 | 1.6 kg | 15.9 mm | 15.60" | 1920x1080 |
| |||||||||||||||||||||||||
Distribution av ljusstyrkan: 81 %
Mitt på batteriet: 284 cd/m²
Kontrast: 1286:1 (Svärta: 0.22 cd/m²)
ΔE ColorChecker Calman: 7.9 | ∀{0.5-29.43 Ø4.73}
calibrated: 5.8
ΔE Greyscale Calman: 6.6 | ∀{0.09-98 Ø4.97}
57.1% sRGB (Argyll 1.6.3 3D)
37% AdobeRGB 1998 (Argyll 1.6.3 3D)
41.59% AdobeRGB 1998 (Argyll 3D)
57.7% sRGB (Argyll 3D)
40.25% Display P3 (Argyll 3D)
Gamma: 2.18
CCT: 5735 K
| Lenovo ThinkPad E15 20RD0011GE NV156FHM-N48, IPS LED, 1920x1080, 15.6" | Lenovo ThinkPad E590-20NB0012GE Lenovo B156HAN02.1, IPS, 1920x1080, 15.6" | Lenovo ThinkPad T590-20N4002VGE LP156WFC-SPD1, aSi IPS LED, 1920x1080, 15.6" | Dell Vostro 15-5581 156CL04 1G2XW, IPS, 1920x1080, 15.6" | MSI Modern 15 A10RB Chi Mei N156HCE-EN1, IPS, 1920x1080, 15.6" | |
|---|---|---|---|---|---|
| Display | 1% | -2% | -2% | 61% | |
| Display P3 Coverage (%) | 40.25 | 39.88 -1% | 38.79 -4% | 38.86 -3% | 66 64% |
| sRGB Coverage (%) | 57.7 | 59.9 4% | 58.3 1% | 58.5 1% | 92.1 60% |
| AdobeRGB 1998 Coverage (%) | 41.59 | 41.21 -1% | 40.11 -4% | 40.15 -3% | 66.5 60% |
| Response Times | 7% | 25% | 26% | 9% | |
| Response Time Grey 50% / Grey 80% * (ms) | 49.6 ? | 47.2 ? 5% | 37.2 ? 25% | 36 ? 27% | 43.2 ? 13% |
| Response Time Black / White * (ms) | 36 ? | 32.8 ? 9% | 27.2 ? 24% | 27 ? 25% | 34.4 ? 4% |
| PWM Frequency (Hz) | 1250 ? | 208 ? | 26040 ? | ||
| Screen | 15% | 12% | 19% | 32% | |
| Brightness middle (cd/m²) | 283 | 284 0% | 276 -2% | 231 -18% | 289.4 2% |
| Brightness (cd/m²) | 258 | 272 5% | 262 2% | 213 -17% | 273 6% |
| Brightness Distribution (%) | 81 | 92 14% | 88 9% | 87 7% | 82 1% |
| Black Level * (cd/m²) | 0.22 | 0.21 5% | 0.23 -5% | 0.13 41% | 0.27 -23% |
| Contrast (:1) | 1286 | 1352 5% | 1200 -7% | 1777 38% | 1072 -17% |
| Colorchecker dE 2000 * | 7.9 | 5.3 33% | 5.6 29% | 4.81 39% | 2.32 71% |
| Colorchecker dE 2000 max. * | 23.6 | 18.9 20% | 16.4 31% | 8.33 65% | 5.76 76% |
| Colorchecker dE 2000 calibrated * | 5.8 | 4.4 24% | 4.7 19% | 4.2 28% | 2.49 57% |
| Greyscale dE 2000 * | 6.6 | 3.2 52% | 3 55% | 5.19 21% | 3 55% |
| Gamma | 2.18 101% | 2.41 91% | 2.18 101% | 2.33 94% | 2.22 99% |
| CCT | 5735 113% | 6736 96% | 7075 92% | 7088 92% | 6867 95% |
| Color Space (Percent of AdobeRGB 1998) (%) | 37 | 37.9 2% | 36.9 0% | 37 0% | 59.8 62% |
| Color Space (Percent of sRGB) (%) | 57.1 | 59.7 5% | 58.1 2% | 58 2% | 92 61% |
| Totalt genomsnitt (program/inställningar) | 8% /
11% | 12% /
11% | 14% /
16% | 34% /
35% |
* ... mindre är bättre
Visa svarstider
| ↔ Svarstid svart till vitt | ||
|---|---|---|
| 36 ms ... stiga ↗ och falla ↘ kombinerat | ↗ 18.8 ms stiga | 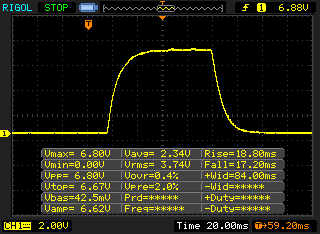 |
| ↘ 17.2 ms hösten | ||
| Skärmen visar långsamma svarsfrekvenser i våra tester och kommer att vara otillfredsställande för spelare. I jämförelse sträcker sig alla testade enheter från 0.1 (minst) till 240 (maximalt) ms. » 94 % av alla enheter är bättre. Detta innebär att den uppmätta svarstiden är sämre än genomsnittet av alla testade enheter (19.9 ms). | ||
| ↔ Svarstid 50 % grått till 80 % grått | ||
| 49.6 ms ... stiga ↗ och falla ↘ kombinerat | ↗ 24.4 ms stiga | 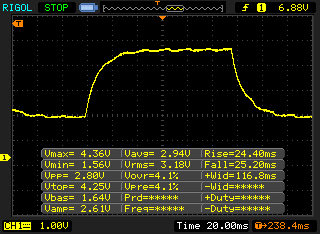 |
| ↘ 25.2 ms hösten | ||
| Skärmen visar långsamma svarsfrekvenser i våra tester och kommer att vara otillfredsställande för spelare. I jämförelse sträcker sig alla testade enheter från 0.165 (minst) till 636 (maximalt) ms. » 85 % av alla enheter är bättre. Detta innebär att den uppmätta svarstiden är sämre än genomsnittet av alla testade enheter (31.1 ms). | ||
Skärmflimmer / PWM (Puls-Width Modulation)
| Skärmflimmer / PWM upptäckt | 1250 Hz | ≤ 99 % ljusstyrka inställning | 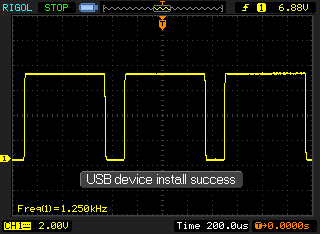 |
Displayens bakgrundsbelysning flimrar vid 1250 Hz (i värsta fall, t.ex. med PWM) Flimrande upptäckt vid en ljusstyrkeinställning på 99 % och lägre. Det ska inte finnas något flimmer eller PWM över denna ljusstyrkeinställning. Frekvensen för 1250 Hz är ganska hög, så de flesta användare som är känsliga för PWM bör inte märka något flimmer. Som jämförelse: 52 % av alla testade enheter använder inte PWM för att dämpa skärmen. Om PWM upptäcktes mättes ett medelvärde av 7798 (minst: 5 - maximum: 343500) Hz. | |||
| PCMark 8 Home Score Accelerated v2 | 4045 poäng | |
| PCMark 8 Work Score Accelerated v2 | 5142 poäng | |
| PCMark 10 Score | 5023 poäng | |
Hjälp | ||
| Lenovo ThinkPad E15 20RD0011GE Samsung PM991 MZALQ512HALU | Lenovo ThinkPad E590-20NB0012GE Toshiba KBG30ZMT256G | Lenovo ThinkPad T590-20N4002VGE Toshiba XG6 KXG60ZNV512G | Dell Vostro 15-5581 SK hynix BC501 HFM128GDJTNG-831 | MSI Modern 15 A10RB WDC PC SN730 SDBPNTY-512G | Genomsnitt Samsung PM991 MZALQ512HALU | |
|---|---|---|---|---|---|---|
| CrystalDiskMark 5.2 / 6 | -28% | 17% | -48% | 55% | -3% | |
| Write 4K (MB/s) | 144.4 | 111.2 -23% | 126.2 -13% | 129.3 -10% | 208.4 44% | 129.5 ? -10% |
| Read 4K (MB/s) | 52.3 | 49.01 -6% | 48.93 -6% | 41.02 -22% | 51 -2% | 45.1 ? -14% |
| Write Seq (MB/s) | 946 | 586 -38% | 1345 42% | 203.4 -78% | 2687 184% | 1172 ? 24% |
| Read Seq (MB/s) | 1608 | 783 -51% | 1373 -15% | 271.2 -83% | 2168 35% | 1496 ? -7% |
| Write 4K Q32T1 (MB/s) | 592 | 263 -56% | 383.8 -35% | 252.3 -57% | 489.2 -17% | 448 ? -24% |
| Read 4K Q32T1 (MB/s) | 397.7 | 481.5 21% | 434.8 9% | 281.4 -29% | 600 51% | 415 ? 4% |
| Write Seq Q32T1 (MB/s) | 1364 | 784 -43% | 2966 117% | 319.8 -77% | 2699 98% | 1397 ? 2% |
| Read Seq Q32T1 (MB/s) | 2301 | 1602 -30% | 3230 40% | 1589 -31% | 3374 47% | 2307 ? 0% |

| 3DMark 06 Standard Score | 20261 poäng | |
| 3DMark Vantage P Result | 14141 poäng | |
| 3DMark 11 Performance | 5243 poäng | |
| 3DMark Ice Storm Standard Score | 61367 poäng | |
| 3DMark Cloud Gate Standard Score | 13593 poäng | |
| 3DMark Fire Strike Score | 3049 poäng | |
| 3DMark Time Spy Score | 1100 poäng | |
Hjälp | ||
| The Witcher 3 - 1920x1080 High Graphics & Postprocessing (Nvidia HairWorks Off) | |
| Genomsnitt av klass Office (23.7 - 39.9, n=4, senaste 2 åren) | |
| MSI Modern 15 A10RB | |
| Lenovo ThinkPad T590-20N4002VGE | |
| Lenovo ThinkPad E590-20NB0012GE | |
| Genomsnitt AMD Radeon RX 640 (19.7 - 19.9, n=2) | |
| Lenovo ThinkPad E15 20RD0011GE | |
| låg | med. | hög | ultra | |
|---|---|---|---|---|
| BioShock Infinite (2013) | 150.5 | 94.1 | 74.4 | 27.3 |
| The Witcher 3 (2015) | 63.2 | 38.4 | 19.7 | 11.3 |
| Dota 2 Reborn (2015) | 110 | 95.5 | 51.7 | 48.2 |
| Rise of the Tomb Raider (2016) | 64.7 | 28.6 | 19.8 | |
| Far Cry 5 (2018) | 48 | 21 | ||
| Shadow of the Tomb Raider (2018) | 42 | 22 | ||
| Assassin´s Creed Odyssey (2018) | 39 | 20 | ||
| Battlefield V (2018) | 61.8 | 29.8 | 23.2 | |
| Apex Legends (2019) | 72 | 27 | 20 | |
| Far Cry New Dawn (2019) | 37 | 17 | ||
| The Division 2 (2019) | 52 | 18 | ||
| Anno 1800 (2019) | 61.8 | 20.5 | ||
| Total War: Three Kingdoms (2019) | 51.4 | 16.9 | ||
| F1 2019 (2019) | 55 | 23 | ||
| FIFA 20 (2019) | 112.6 | |||
| Ghost Recon Breakpoint (2019) | 29 | |||
| GRID 2019 (2019) | 60.6 | 20.4 | ||
| Need for Speed Heat (2019) | 31.7 | 14.3 | ||
| Star Wars Jedi Fallen Order (2019) | 25.9 |
Ljudnivå
| Låg belastning |
| 29.2 / 29.2 / 31.7 dB(A) |
| Hög belastning |
| 34.8 / 34.8 dB(A) |
 | ||
30 dB tyst 40 dB(A) hörbar 50 dB(A) högt ljud |
||
min: | ||
(-) Den maximala temperaturen på ovansidan är 46.1 °C / 115 F, jämfört med genomsnittet av 34.3 °C / 94 F , allt från 21.2 till 62.5 °C för klassen Office.
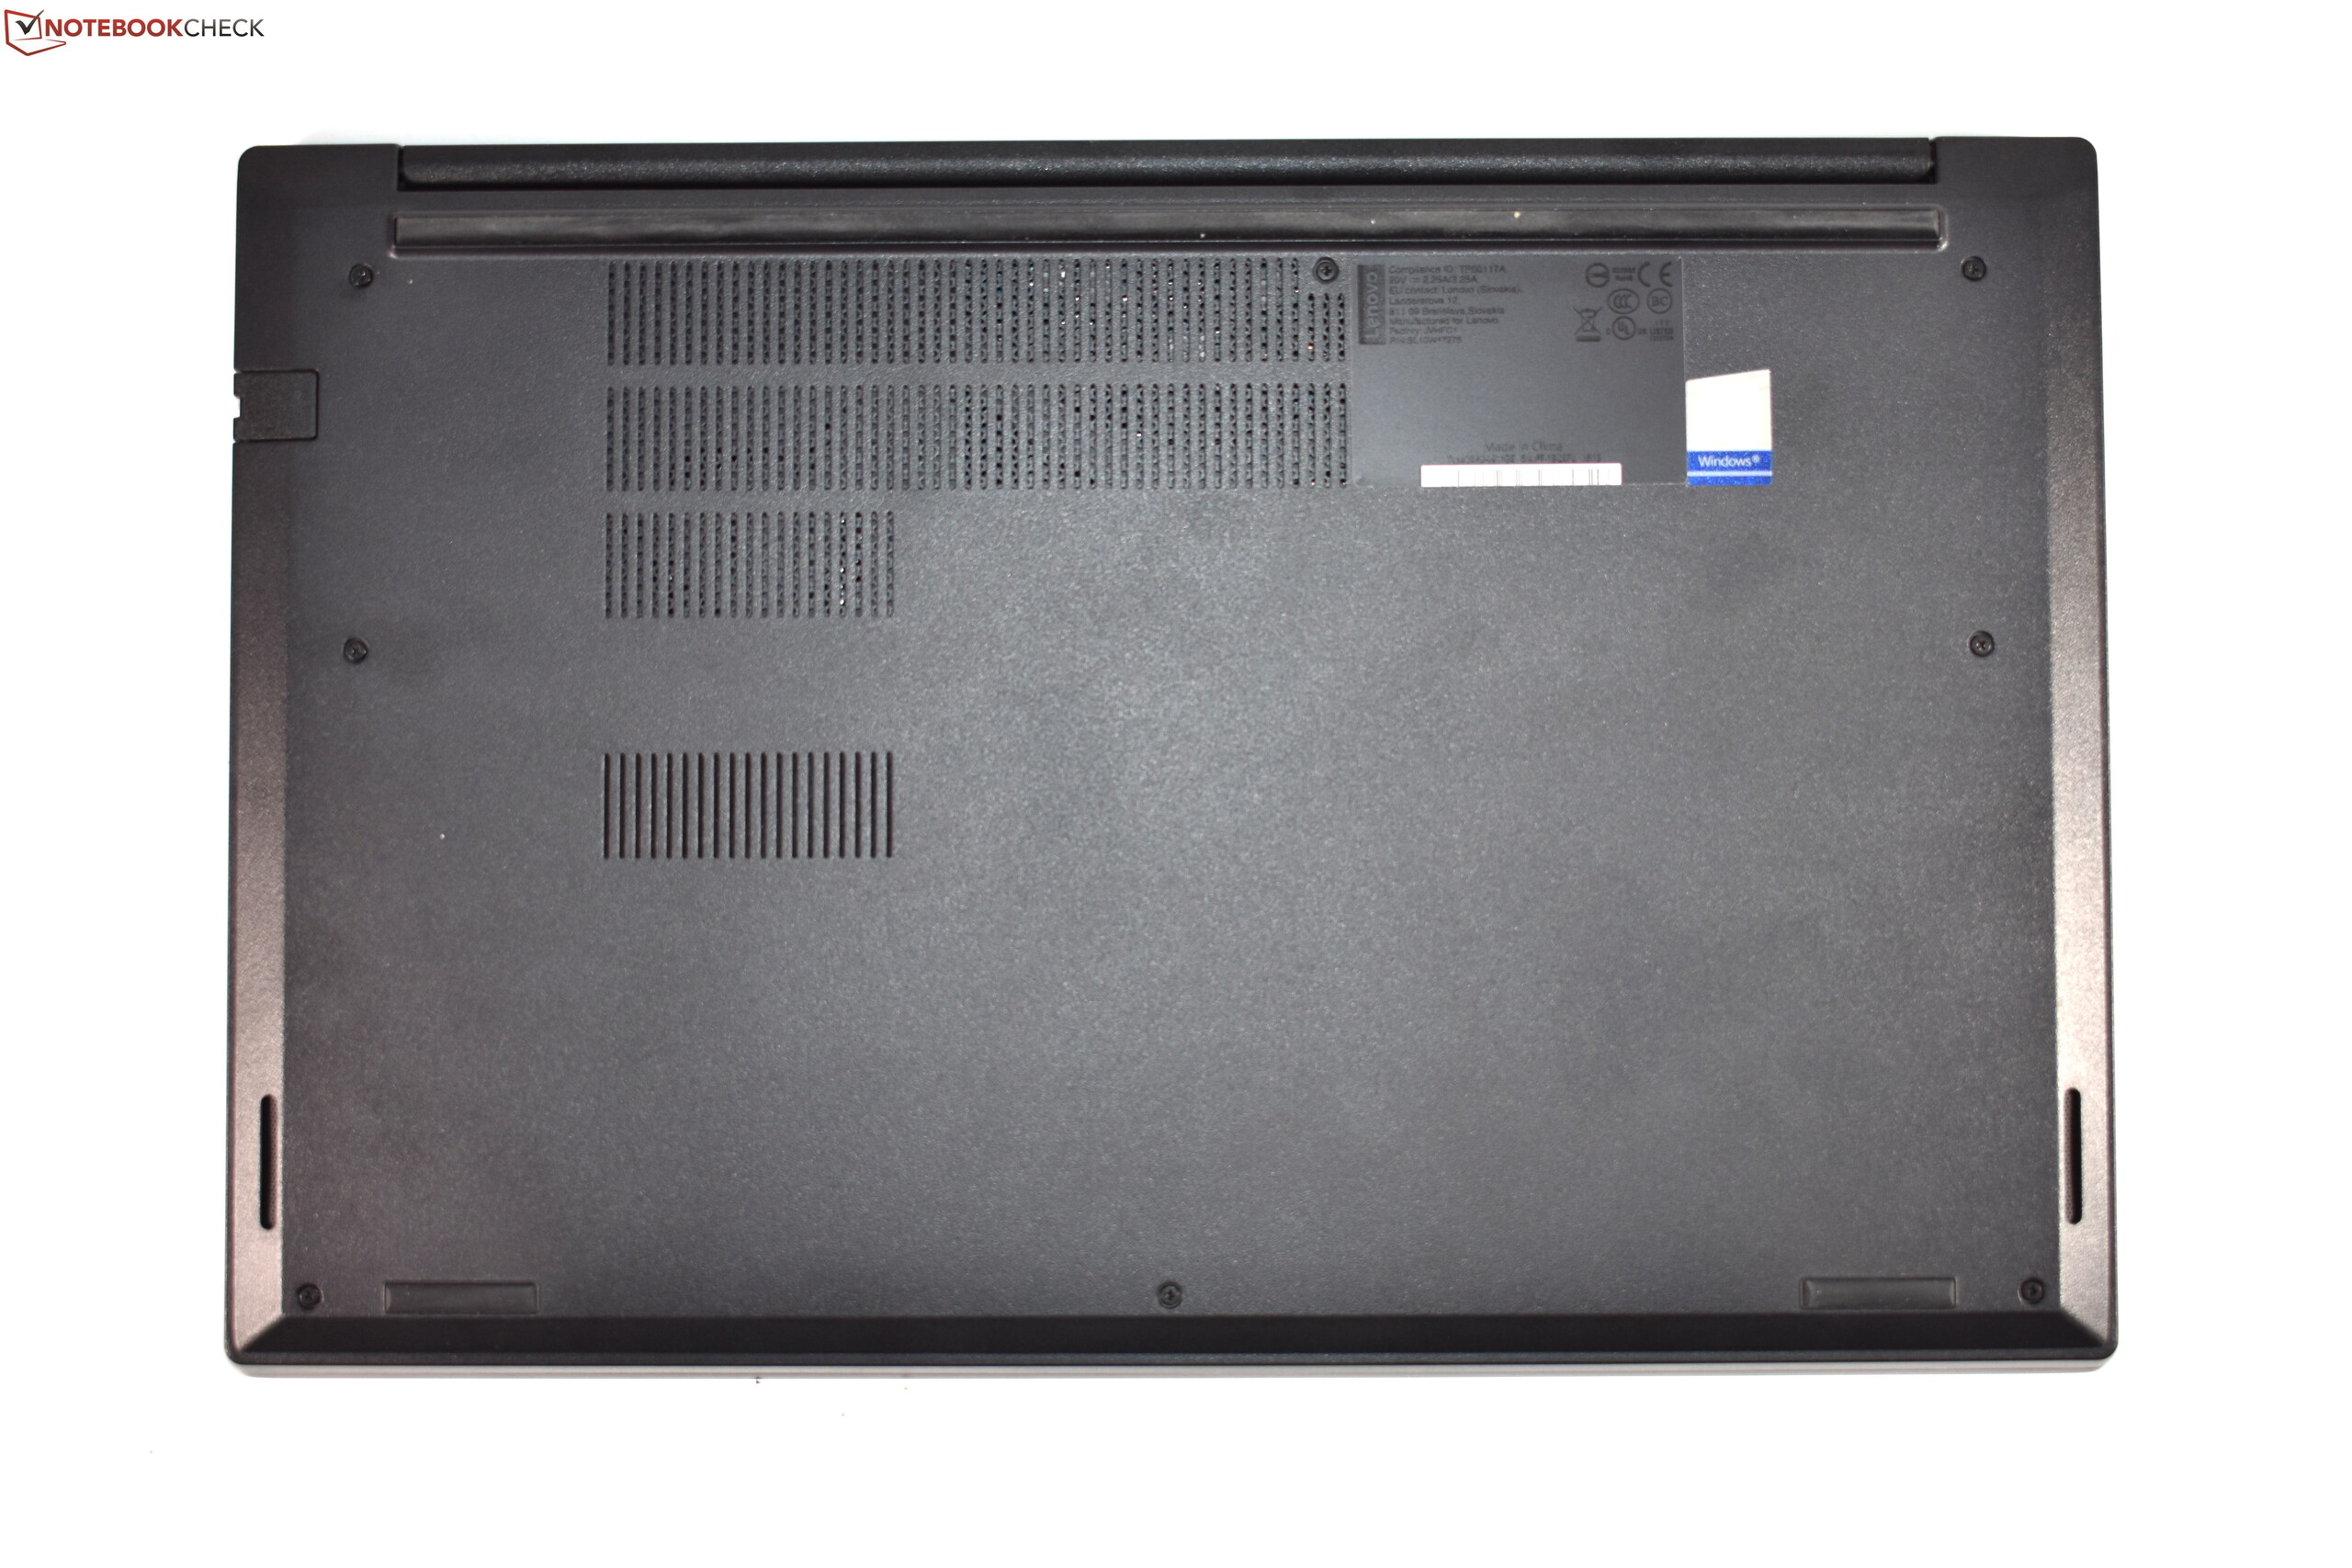
(-) Botten värms upp till maximalt 67.8 °C / 154 F, jämfört med genomsnittet av 36.8 °C / 98 F
(+) Vid tomgångsbruk är medeltemperaturen för ovansidan 23.9 °C / 75 F, jämfört med enhetsgenomsnittet på 29.5 °C / ### class_avg_f### F.
(±) När du spelar The Witcher 3 är medeltemperaturen för ovansidan 35.9 °C / 97 F, jämfört med enhetsgenomsnittet på 29.5 °C / ## #class_avg_f### F.
(+) Handledsstöden och pekplattan är kallare än hudtemperaturen med maximalt 27.8 °C / 82 F och är därför svala att ta på.
(±) Medeltemperaturen för handledsstödsområdet på liknande enheter var 27.5 °C / 81.5 F (-0.3 °C / -0.5 F).
| Av/Standby | |
| Låg belastning | |
| Hög belastning |
|
Förklaring:
min: | |
| Lenovo ThinkPad E15 20RD0011GE i7-10510U, Radeon RX 640, Samsung PM991 MZALQ512HALU, IPS LED, 1920x1080, 15.6" | Lenovo ThinkPad E590-20NB0012GE i7-8565U, Radeon RX 550X (Laptop), Toshiba KBG30ZMT256G, IPS, 1920x1080, 15.6" | Lenovo ThinkPad T590-20N4002VGE i7-8565U, GeForce MX250, Toshiba XG6 KXG60ZNV512G, aSi IPS LED, 1920x1080, 15.6" | Dell Vostro 15-5581 i5-8265U, GeForce MX130, SK hynix BC501 HFM128GDJTNG-831, IPS, 1920x1080, 15.6" | MSI Modern 15 A10RB i7-10510U, GeForce MX250, WDC PC SN730 SDBPNTY-512G, IPS, 1920x1080, 15.6" | Genomsnitt AMD Radeon RX 640 | Genomsnitt av klass Office | |
|---|---|---|---|---|---|---|---|
| Power Consumption | -11% | -24% | -9% | -72% | -2% | -6% | |
| Idle Minimum * (Watt) | 3.2 | 3.48 -9% | 4.1 -28% | 5 -56% | 6.6 -106% | 3.25 ? -2% | 4.4 ? -38% |
| Idle Average * (Watt) | 6.8 | 7.2 -6% | 8.3 -22% | 7.9 -16% | 9.9 -46% | 6.5 ? 4% | 7.32 ? -8% |
| Idle Maximum * (Watt) | 9.5 | 10.2 -7% | 11.8 -24% | 11.2 -18% | 14.7 -55% | 8.95 ? 6% | 8.56 ? 10% |
| Load Average * (Watt) | 44 | 59.6 -35% | 61.6 -40% | 34 23% | 82.9 -88% | 51.6 ? -17% | 42.5 ? 3% |
| Load Maximum * (Watt) | 66.4 | 65.1 2% | 69.4 -5% | 50.2 24% | 109.3 -65% | 66.5 ? -0% | 64.1 ? 3% |
| Witcher 3 ultra * (Watt) | 49 | 54.4 | 59.4 |
* ... mindre är bättre
| Lenovo ThinkPad E15 20RD0011GE i7-10510U, Radeon RX 640, 45 Wh | Lenovo ThinkPad E590-20NB0012GE i7-8565U, Radeon RX 550X (Laptop), 45 Wh | Lenovo ThinkPad T590-20N4002VGE i7-8565U, GeForce MX250, 57 Wh | Dell Vostro 15-5581 i5-8265U, GeForce MX130, 42 Wh | MSI Modern 15 A10RB i7-10510U, GeForce MX250, 52 Wh | Genomsnitt av klass Office | |
|---|---|---|---|---|---|---|
| Batteridrifttid | -8% | 47% | -21% | -12% | 37% | |
| H.264 (h) | 10.4 | 9 -13% | 12.1 16% | 6.6 -37% | 15 ? 44% | |
| WiFi v1.3 (h) | 7.5 | 7.1 -5% | 10.5 40% | 6.8 -9% | 6.5 -13% | 12.9 ? 72% |
| Load (h) | 1.9 | 1.8 -5% | 3.5 84% | 1.6 -16% | 1.7 -11% | 1.807 ? -5% |
| Reader / Idle (h) | 18.9 | 12.5 | 15.4 | 23.7 ? |
För
Emot
Läs den fullständiga versionen av den här recensionen på engelska här.
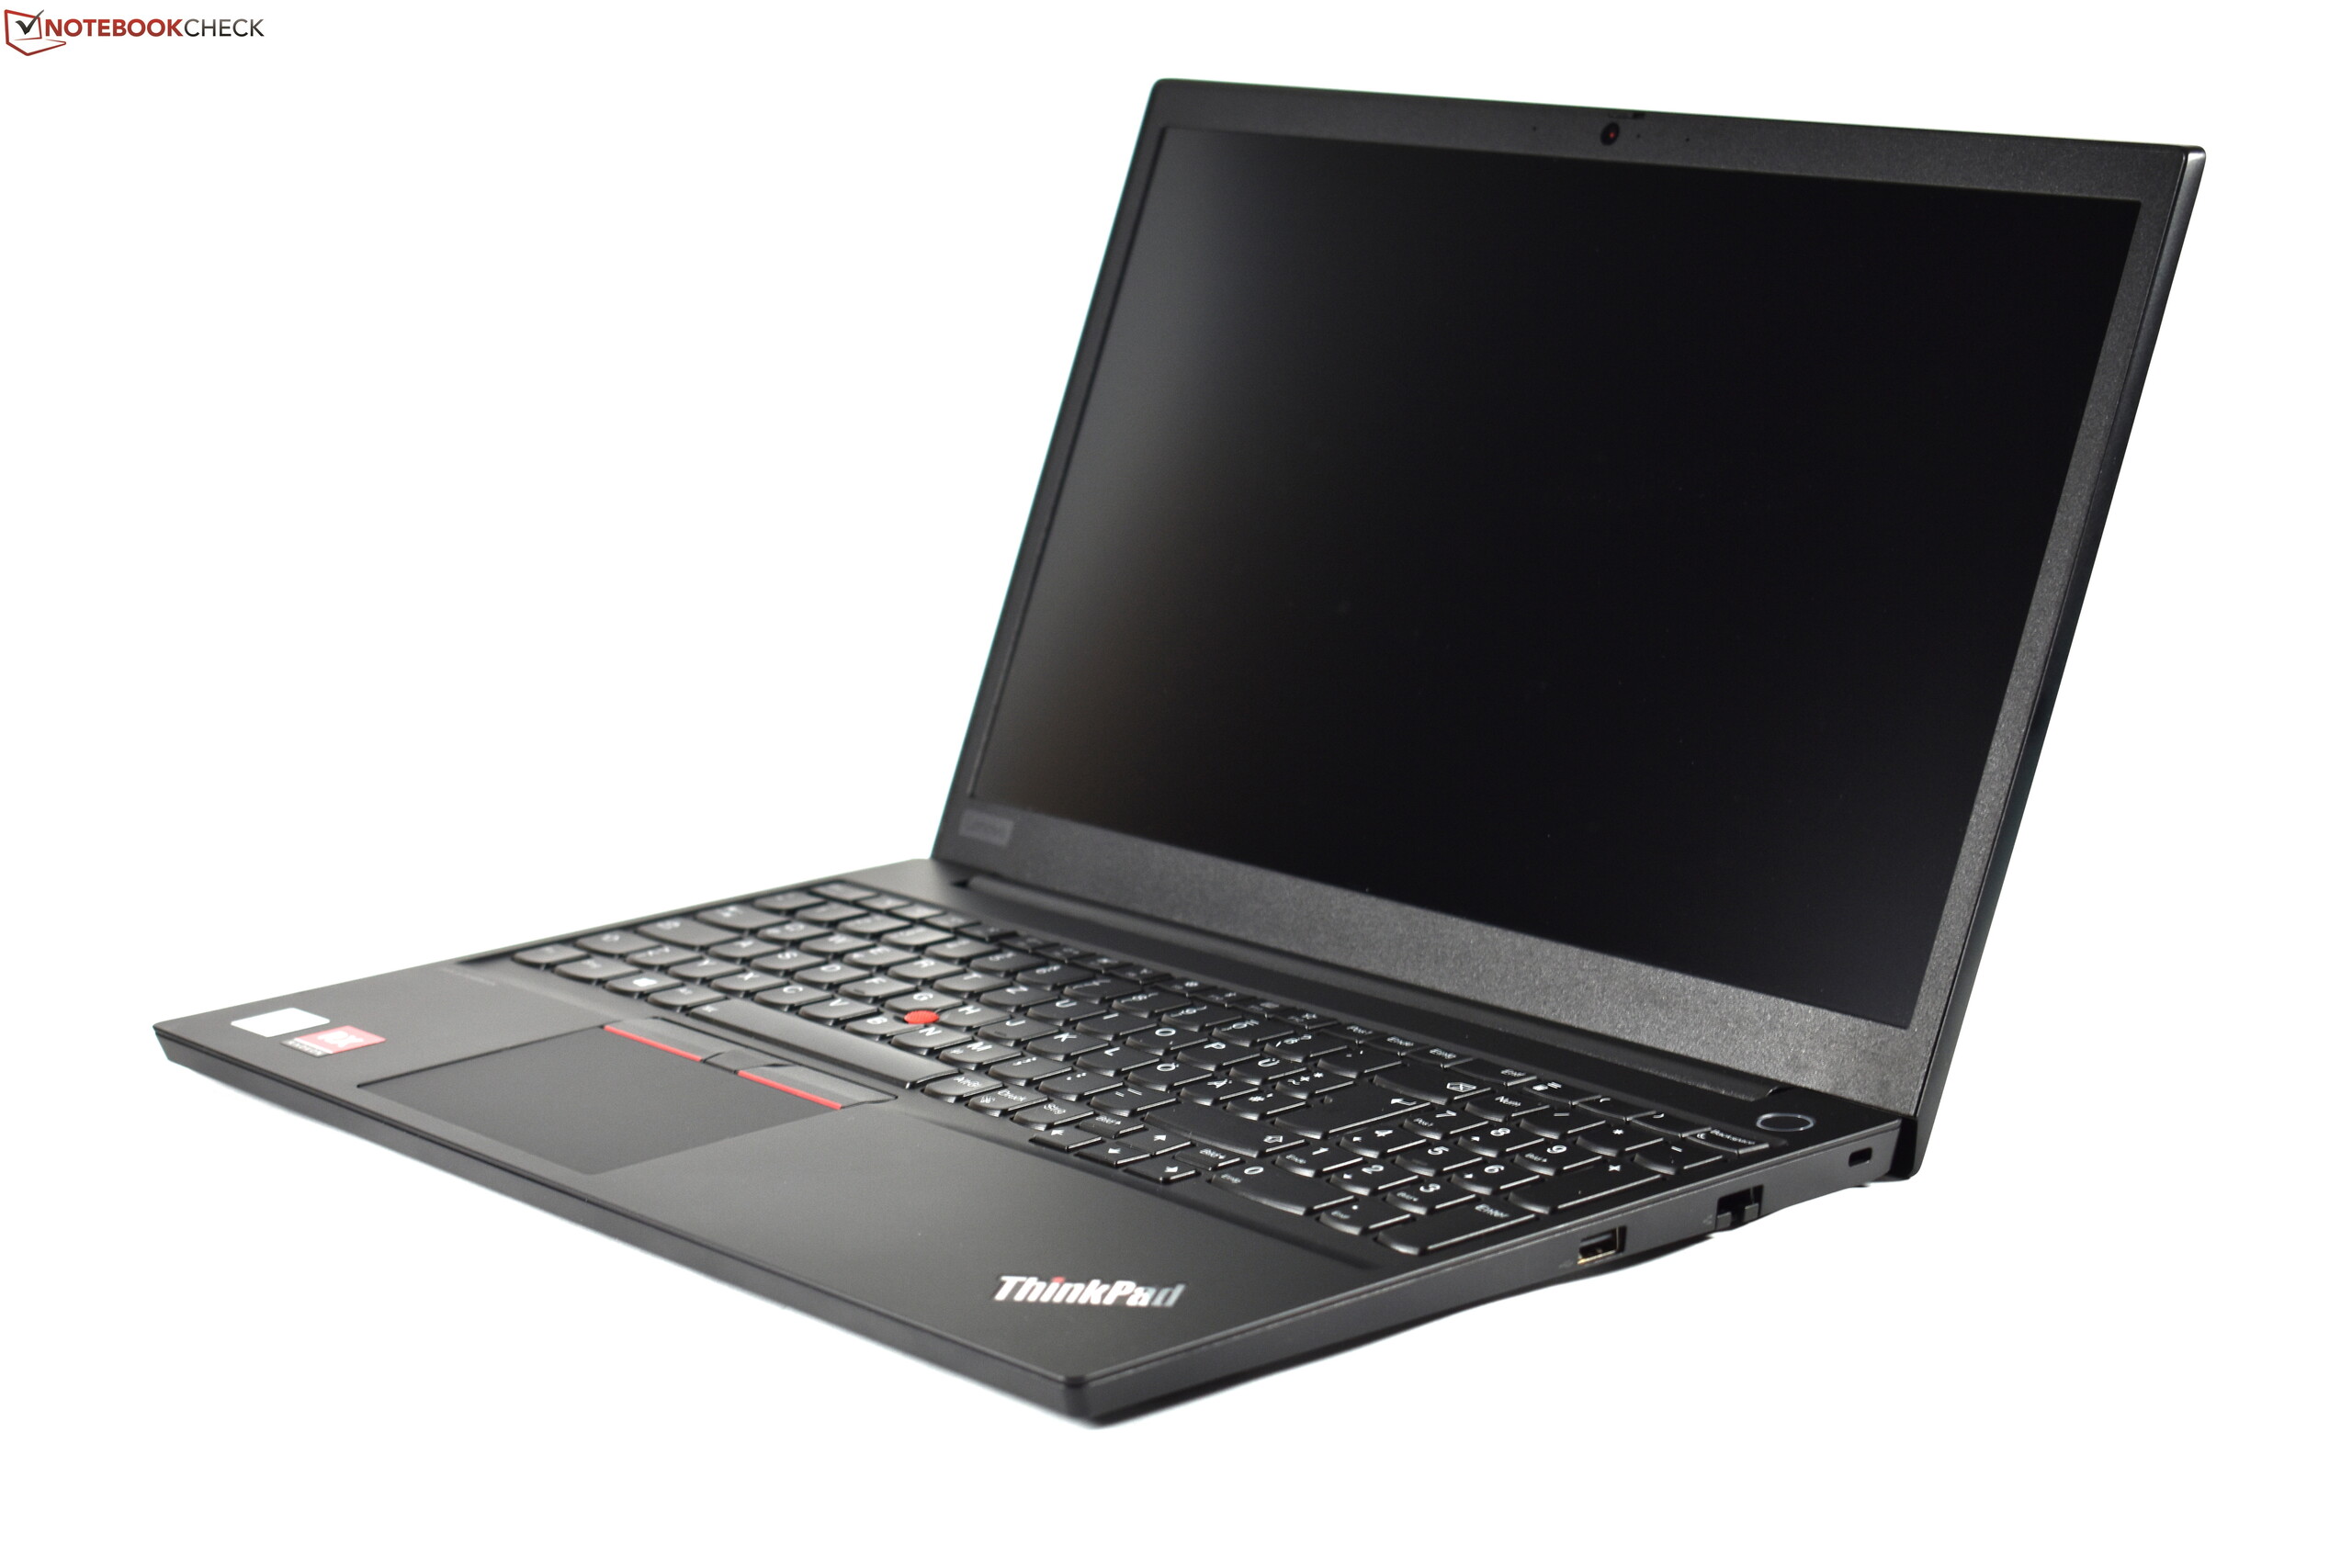
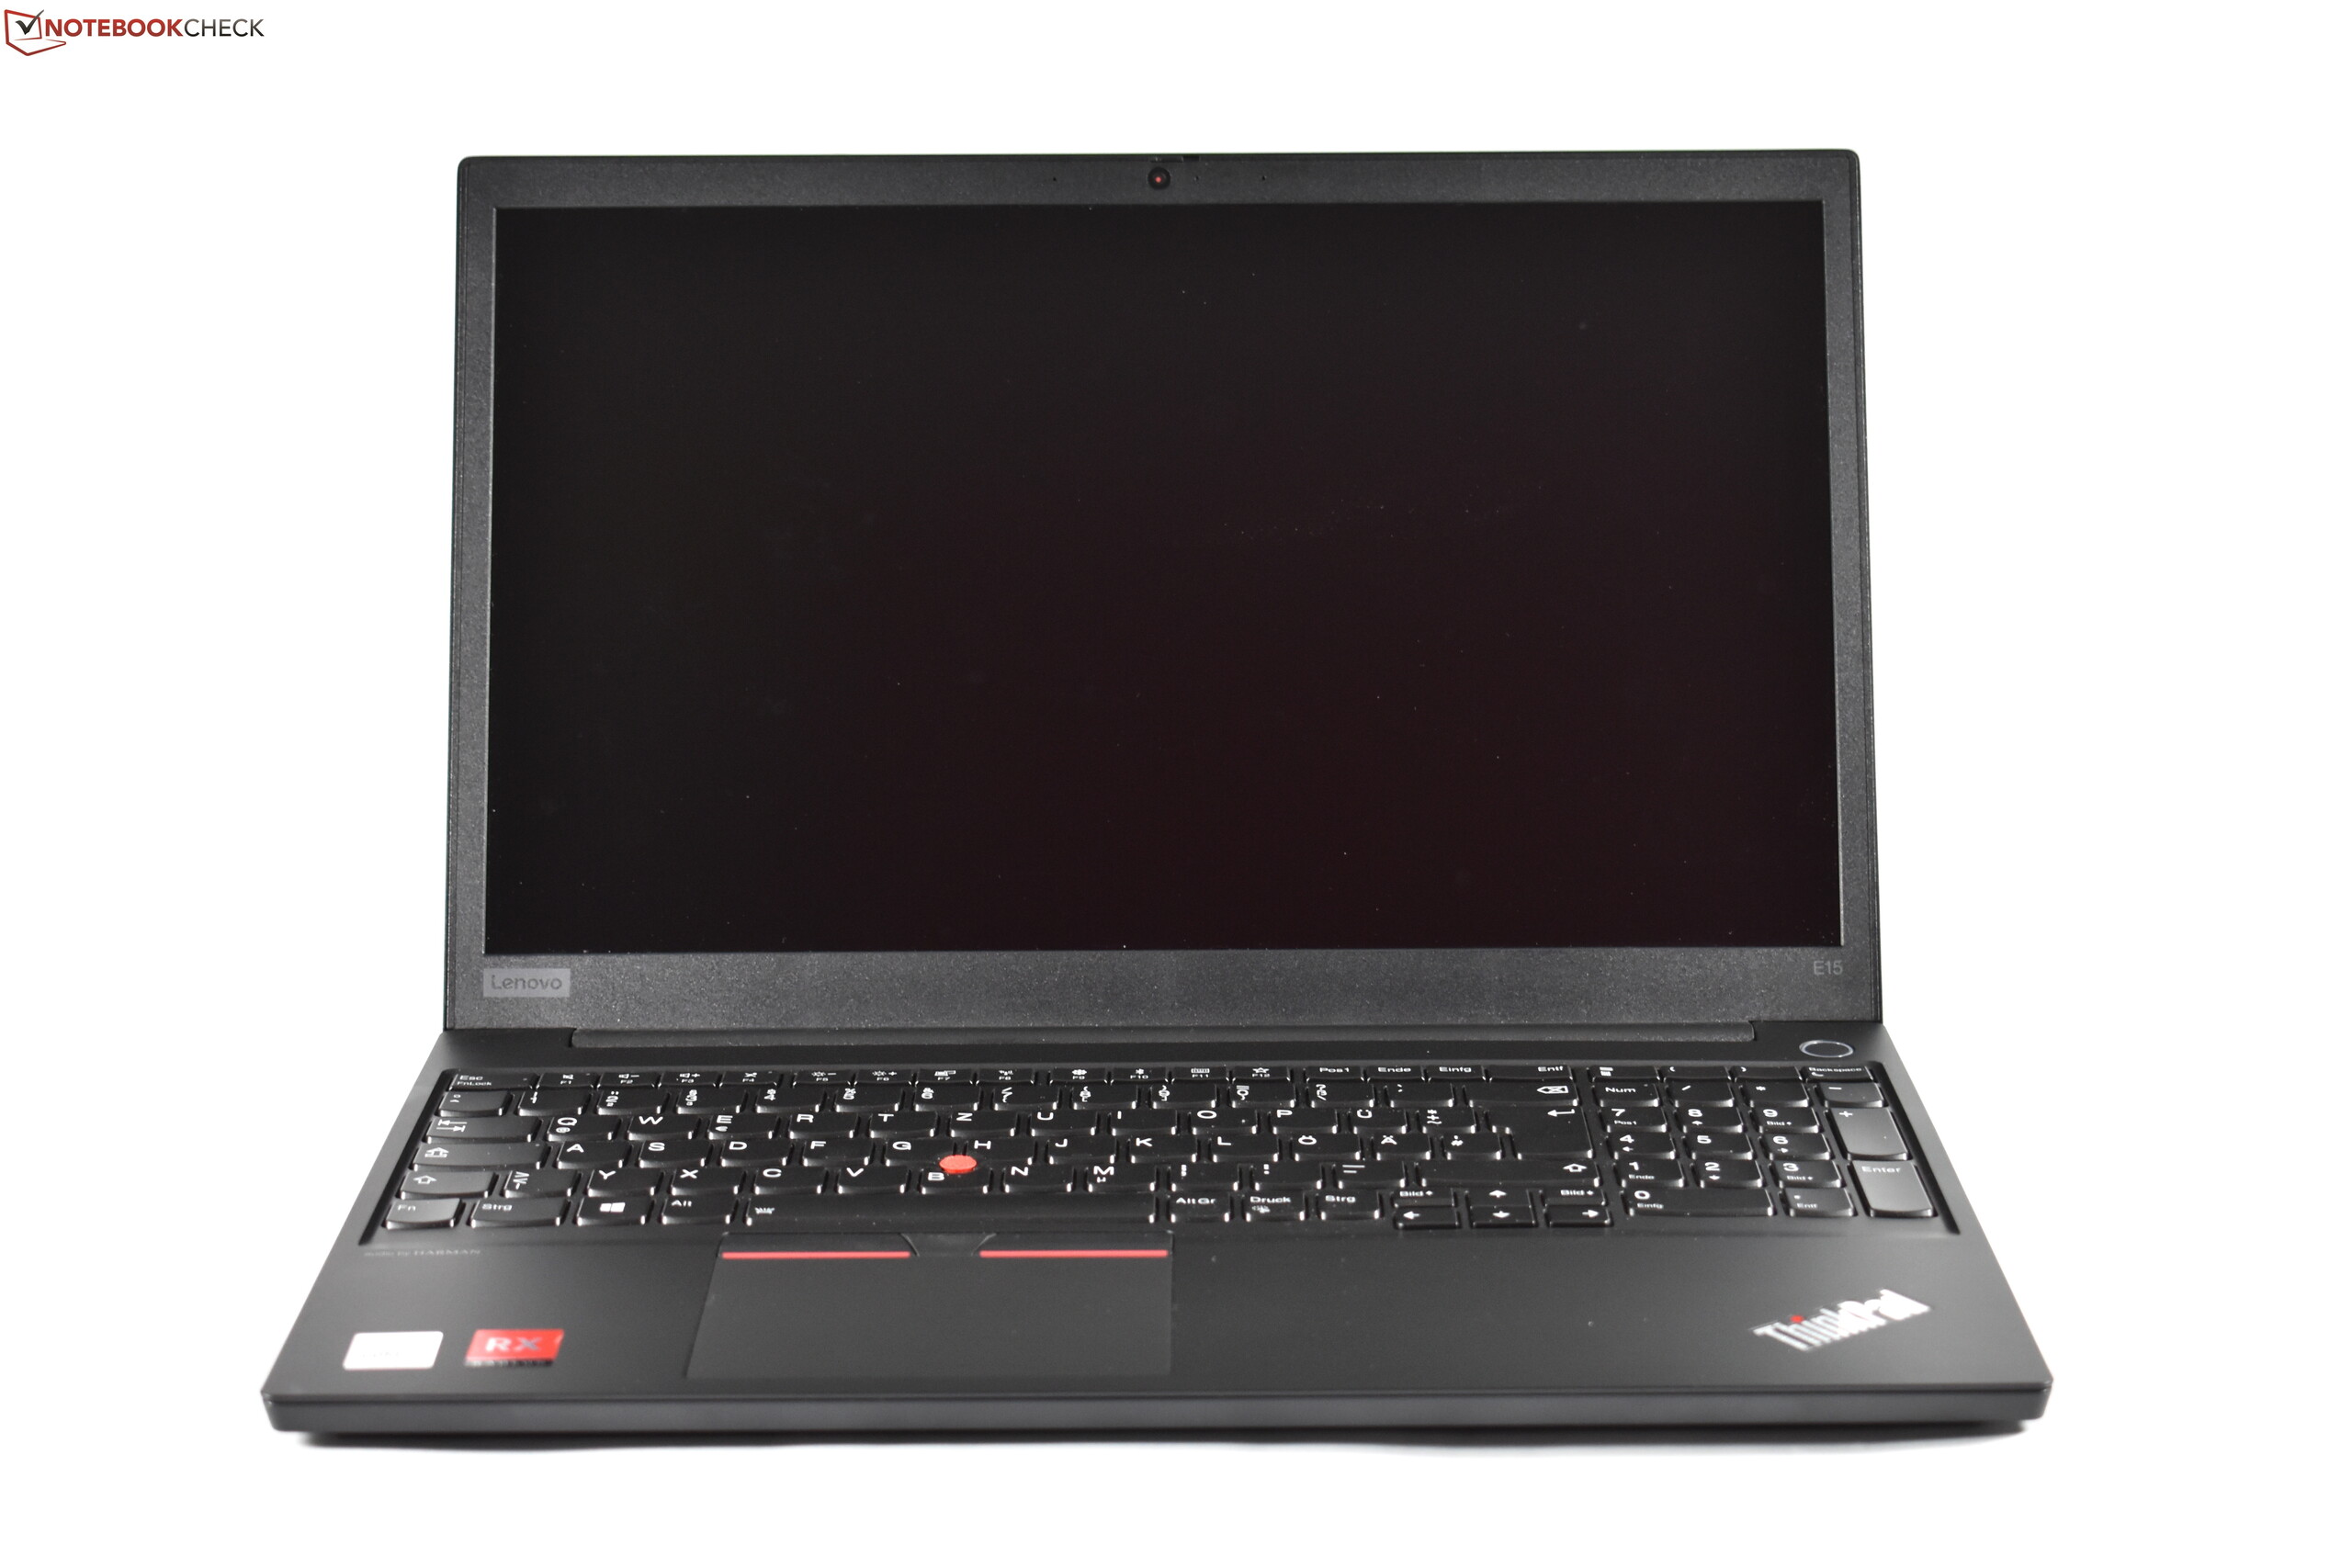
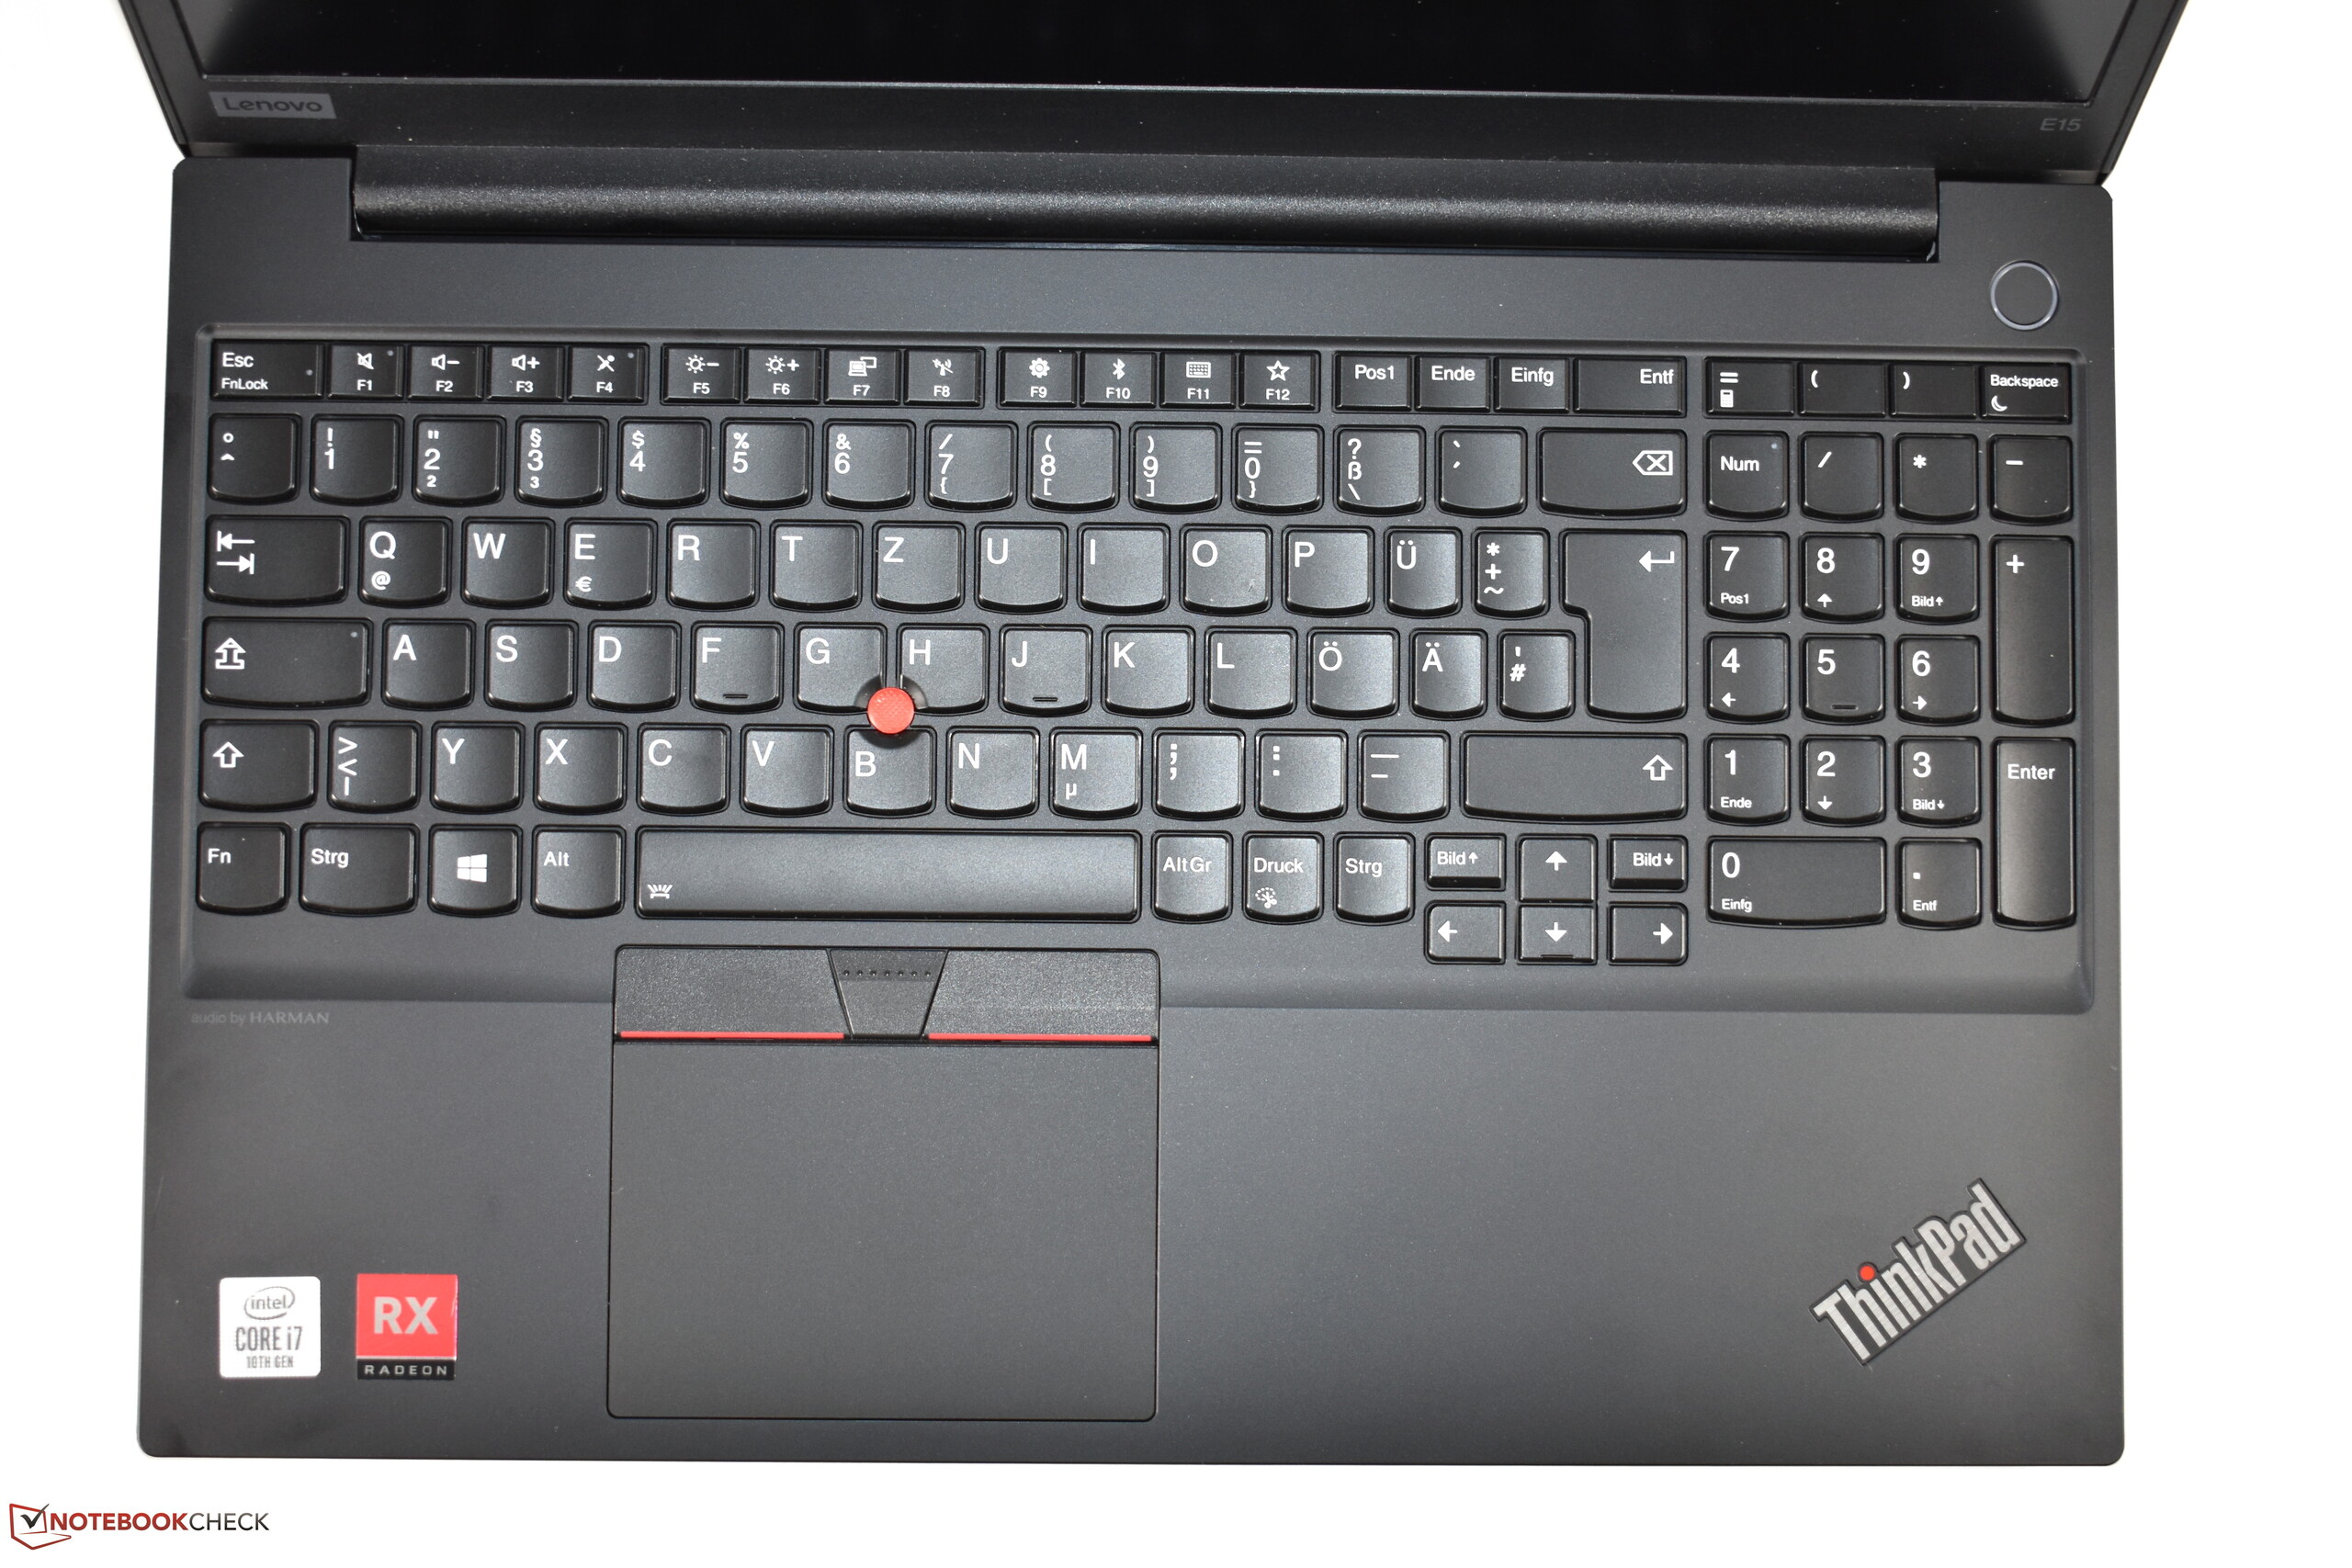
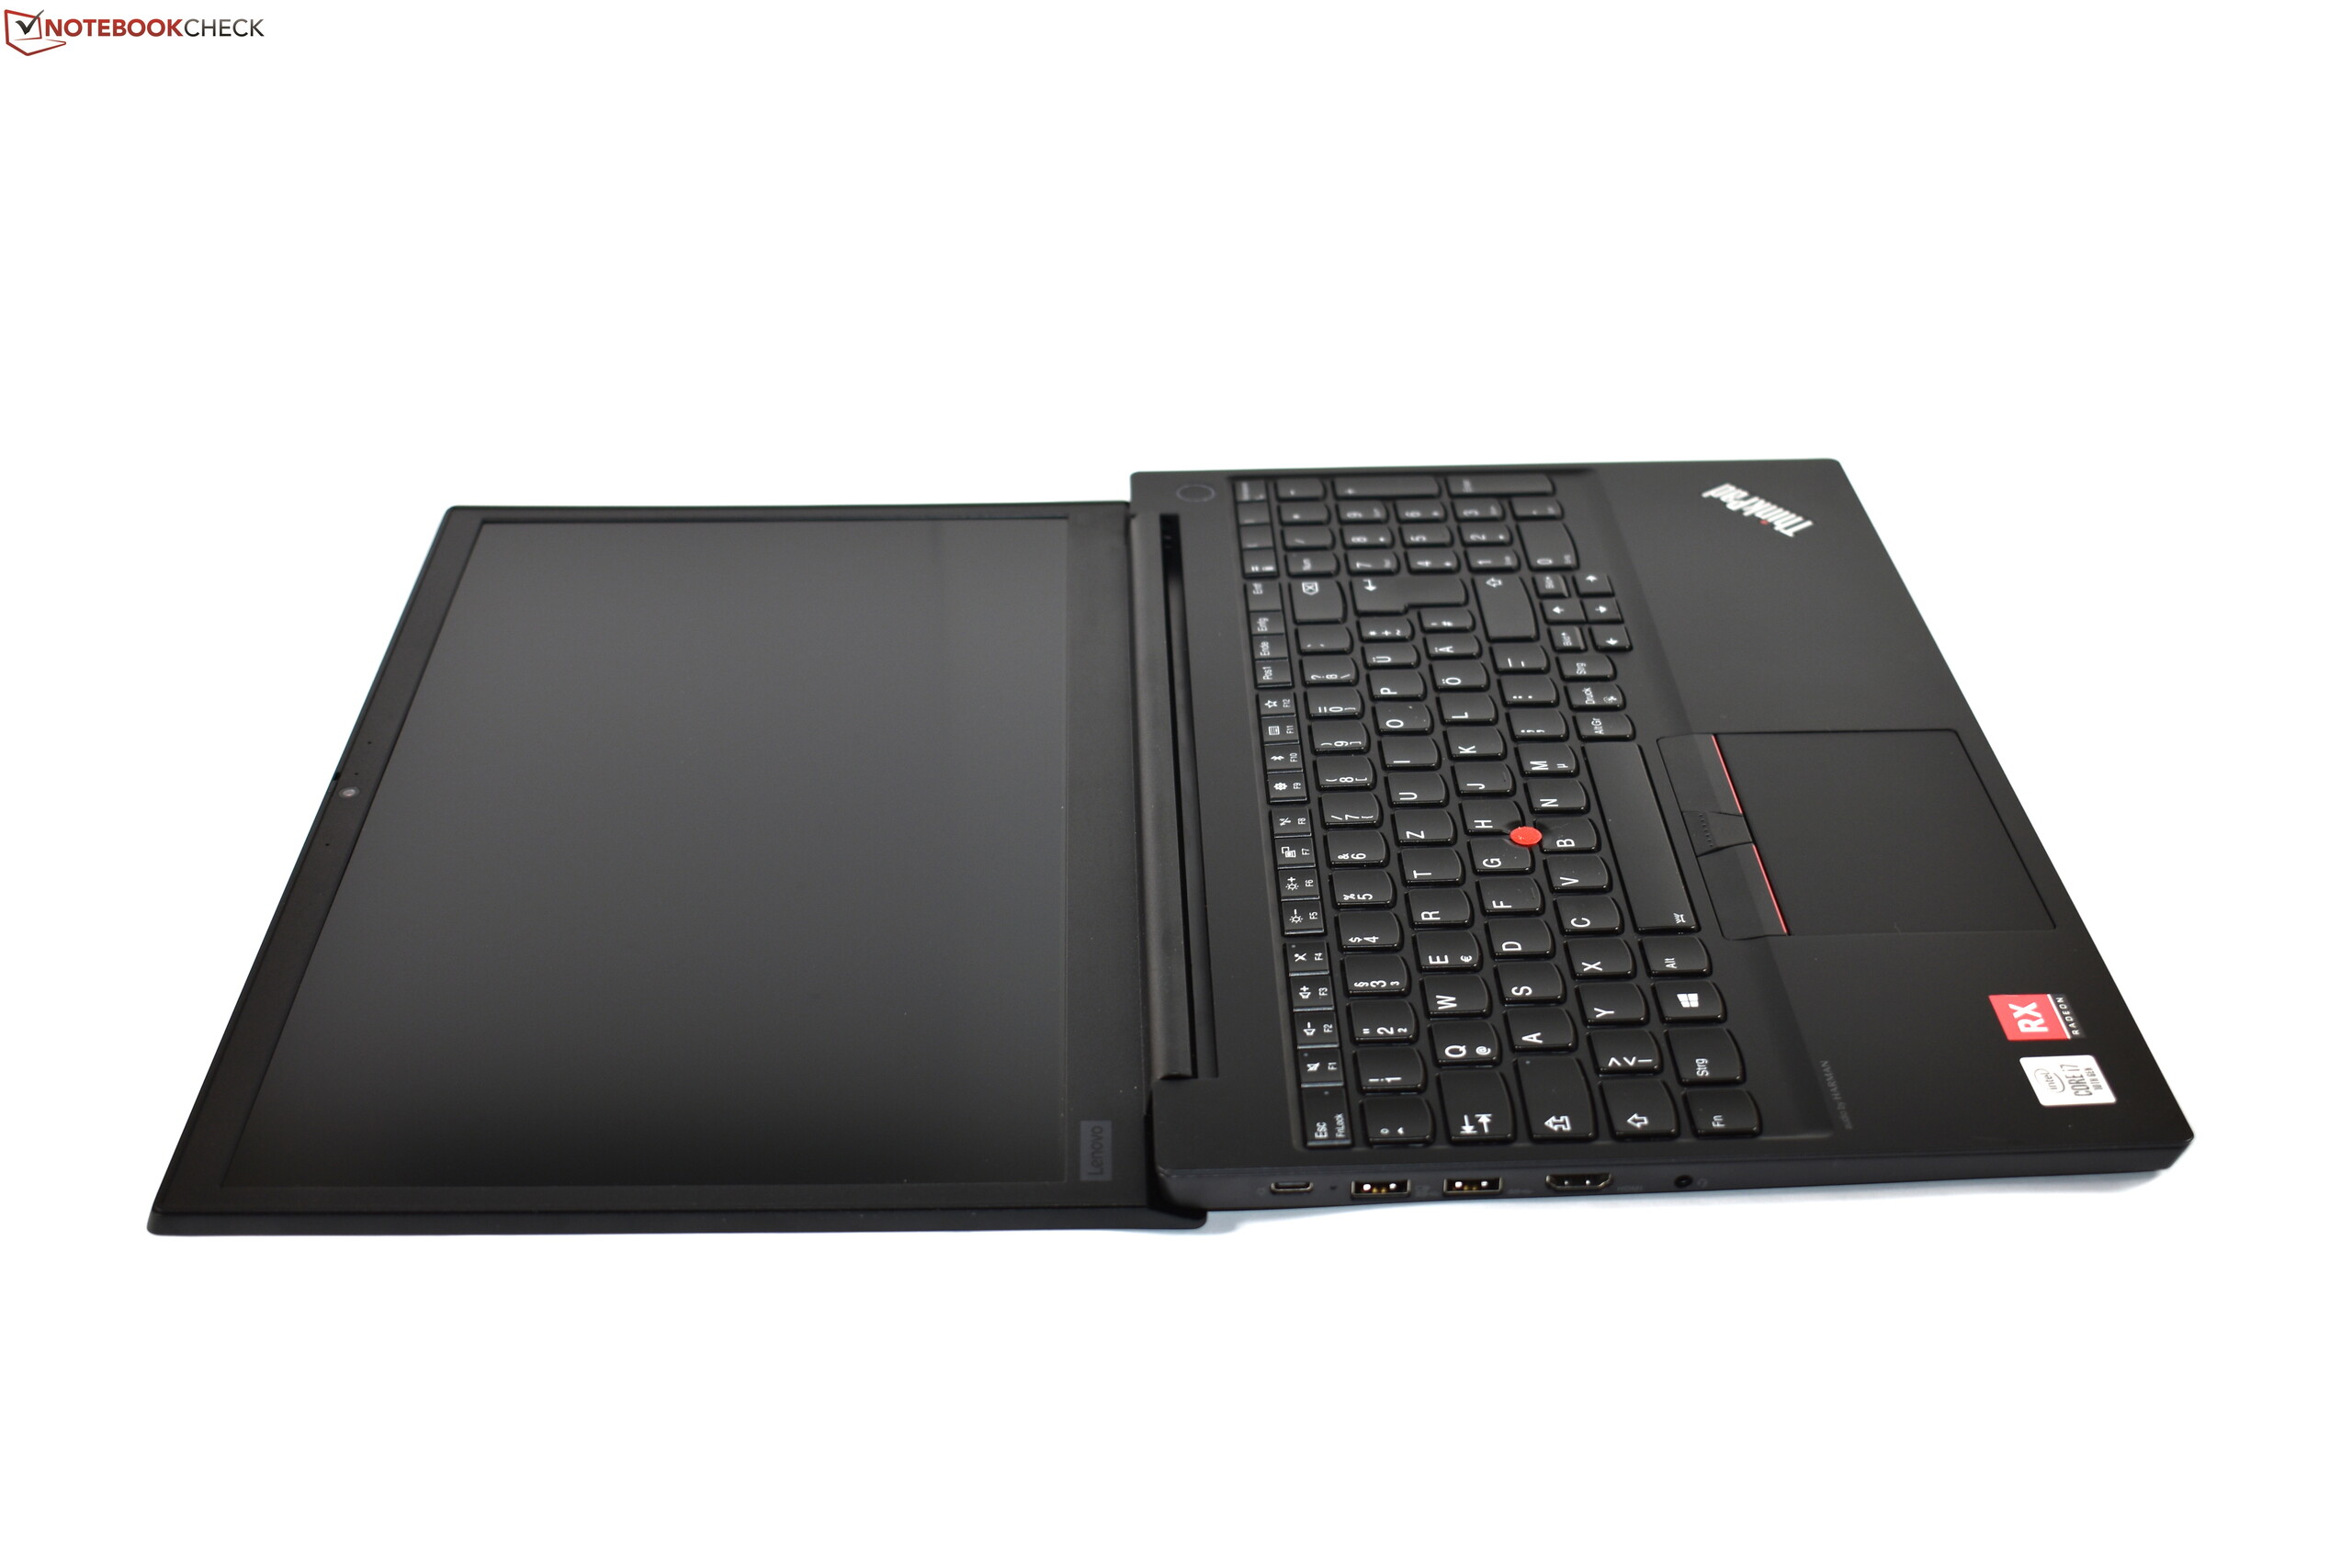
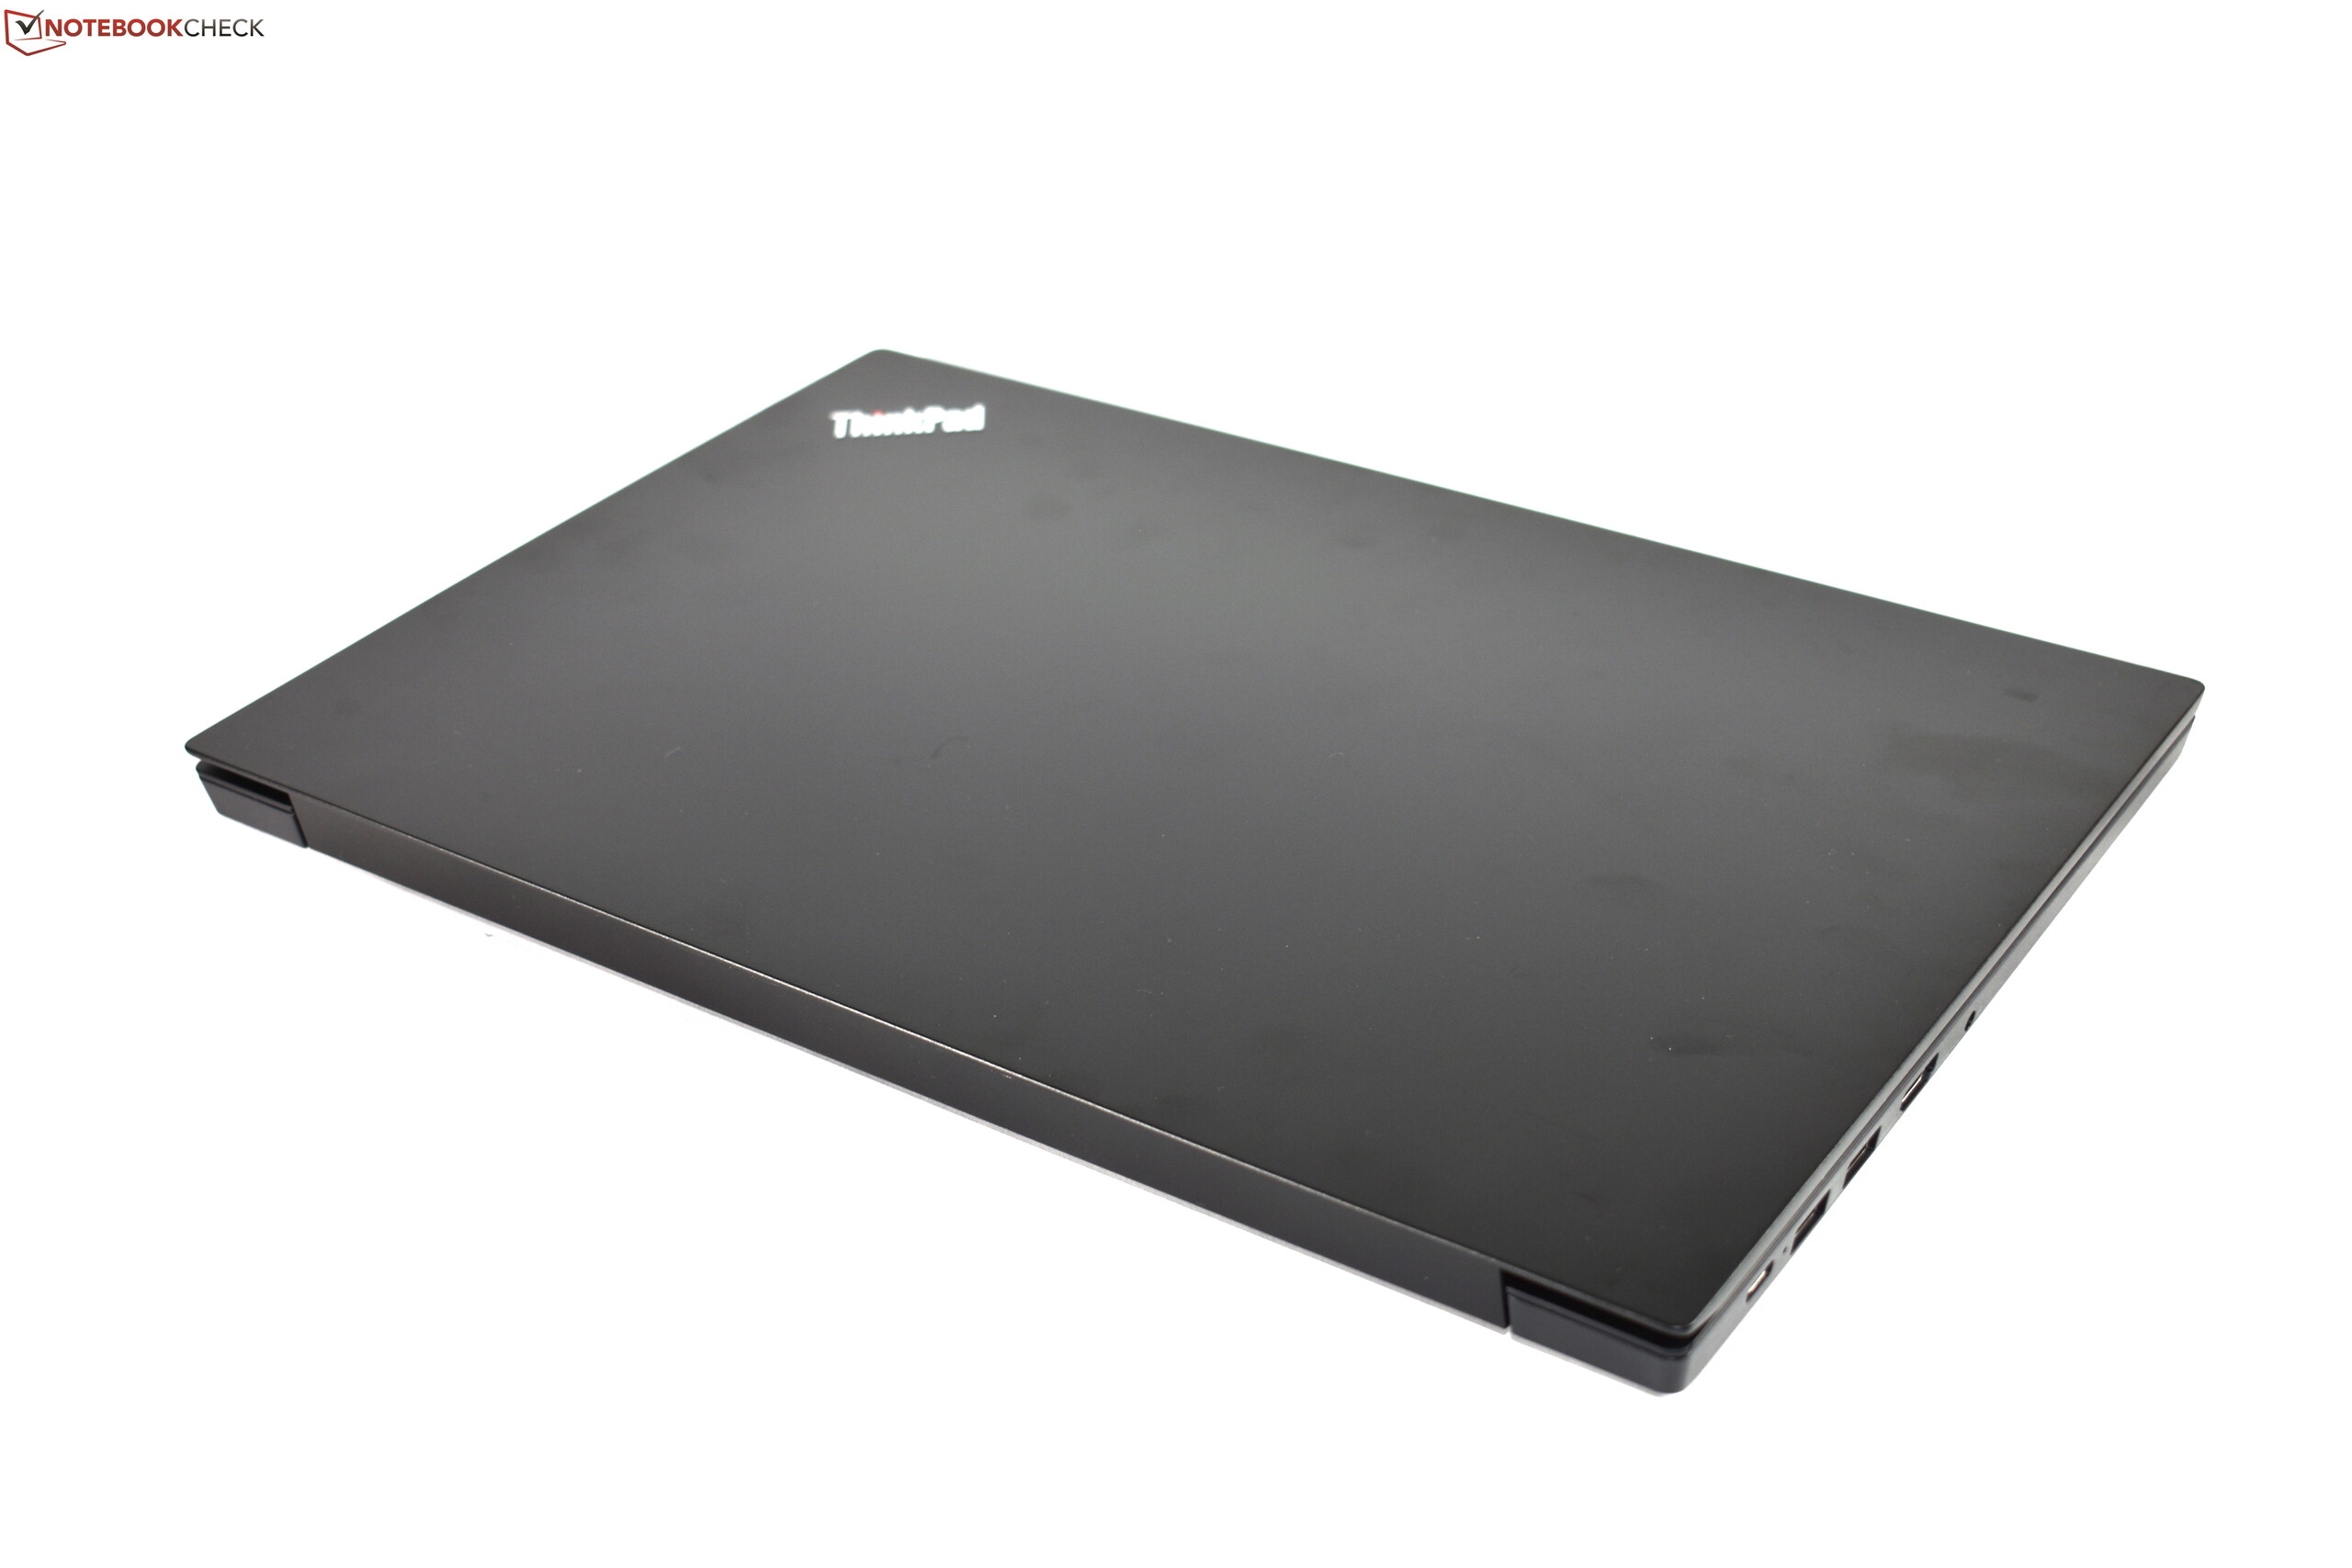
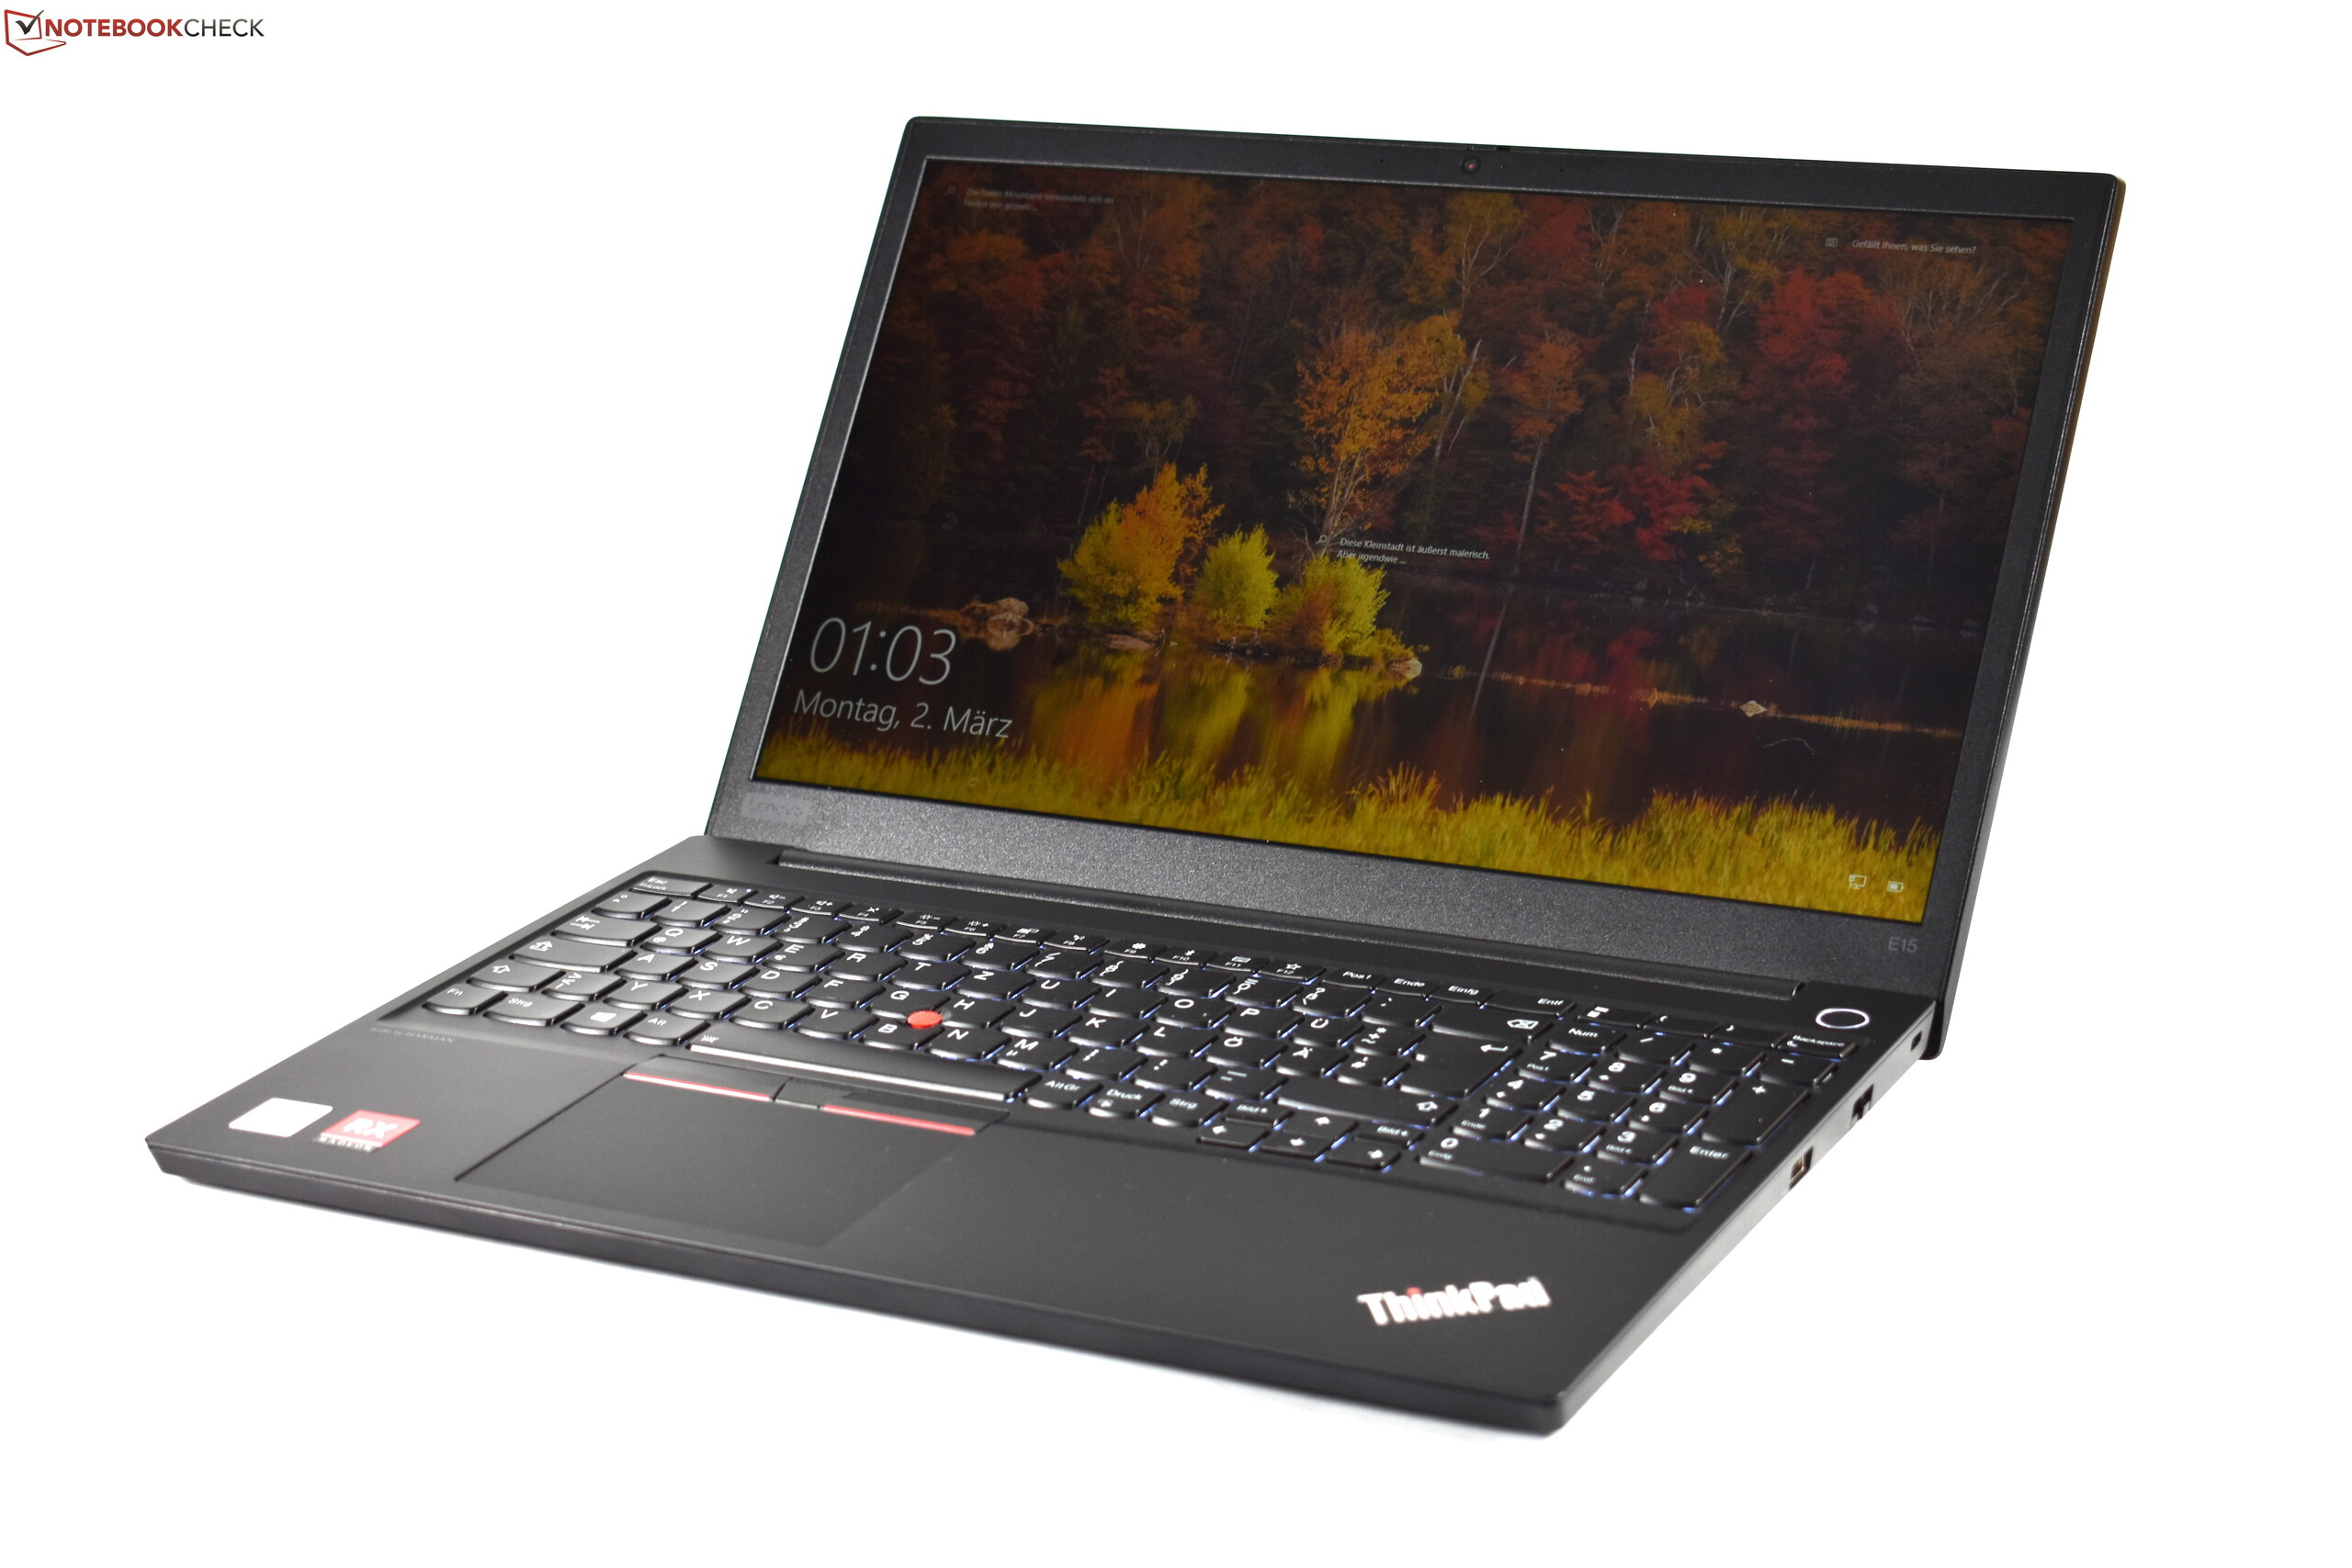
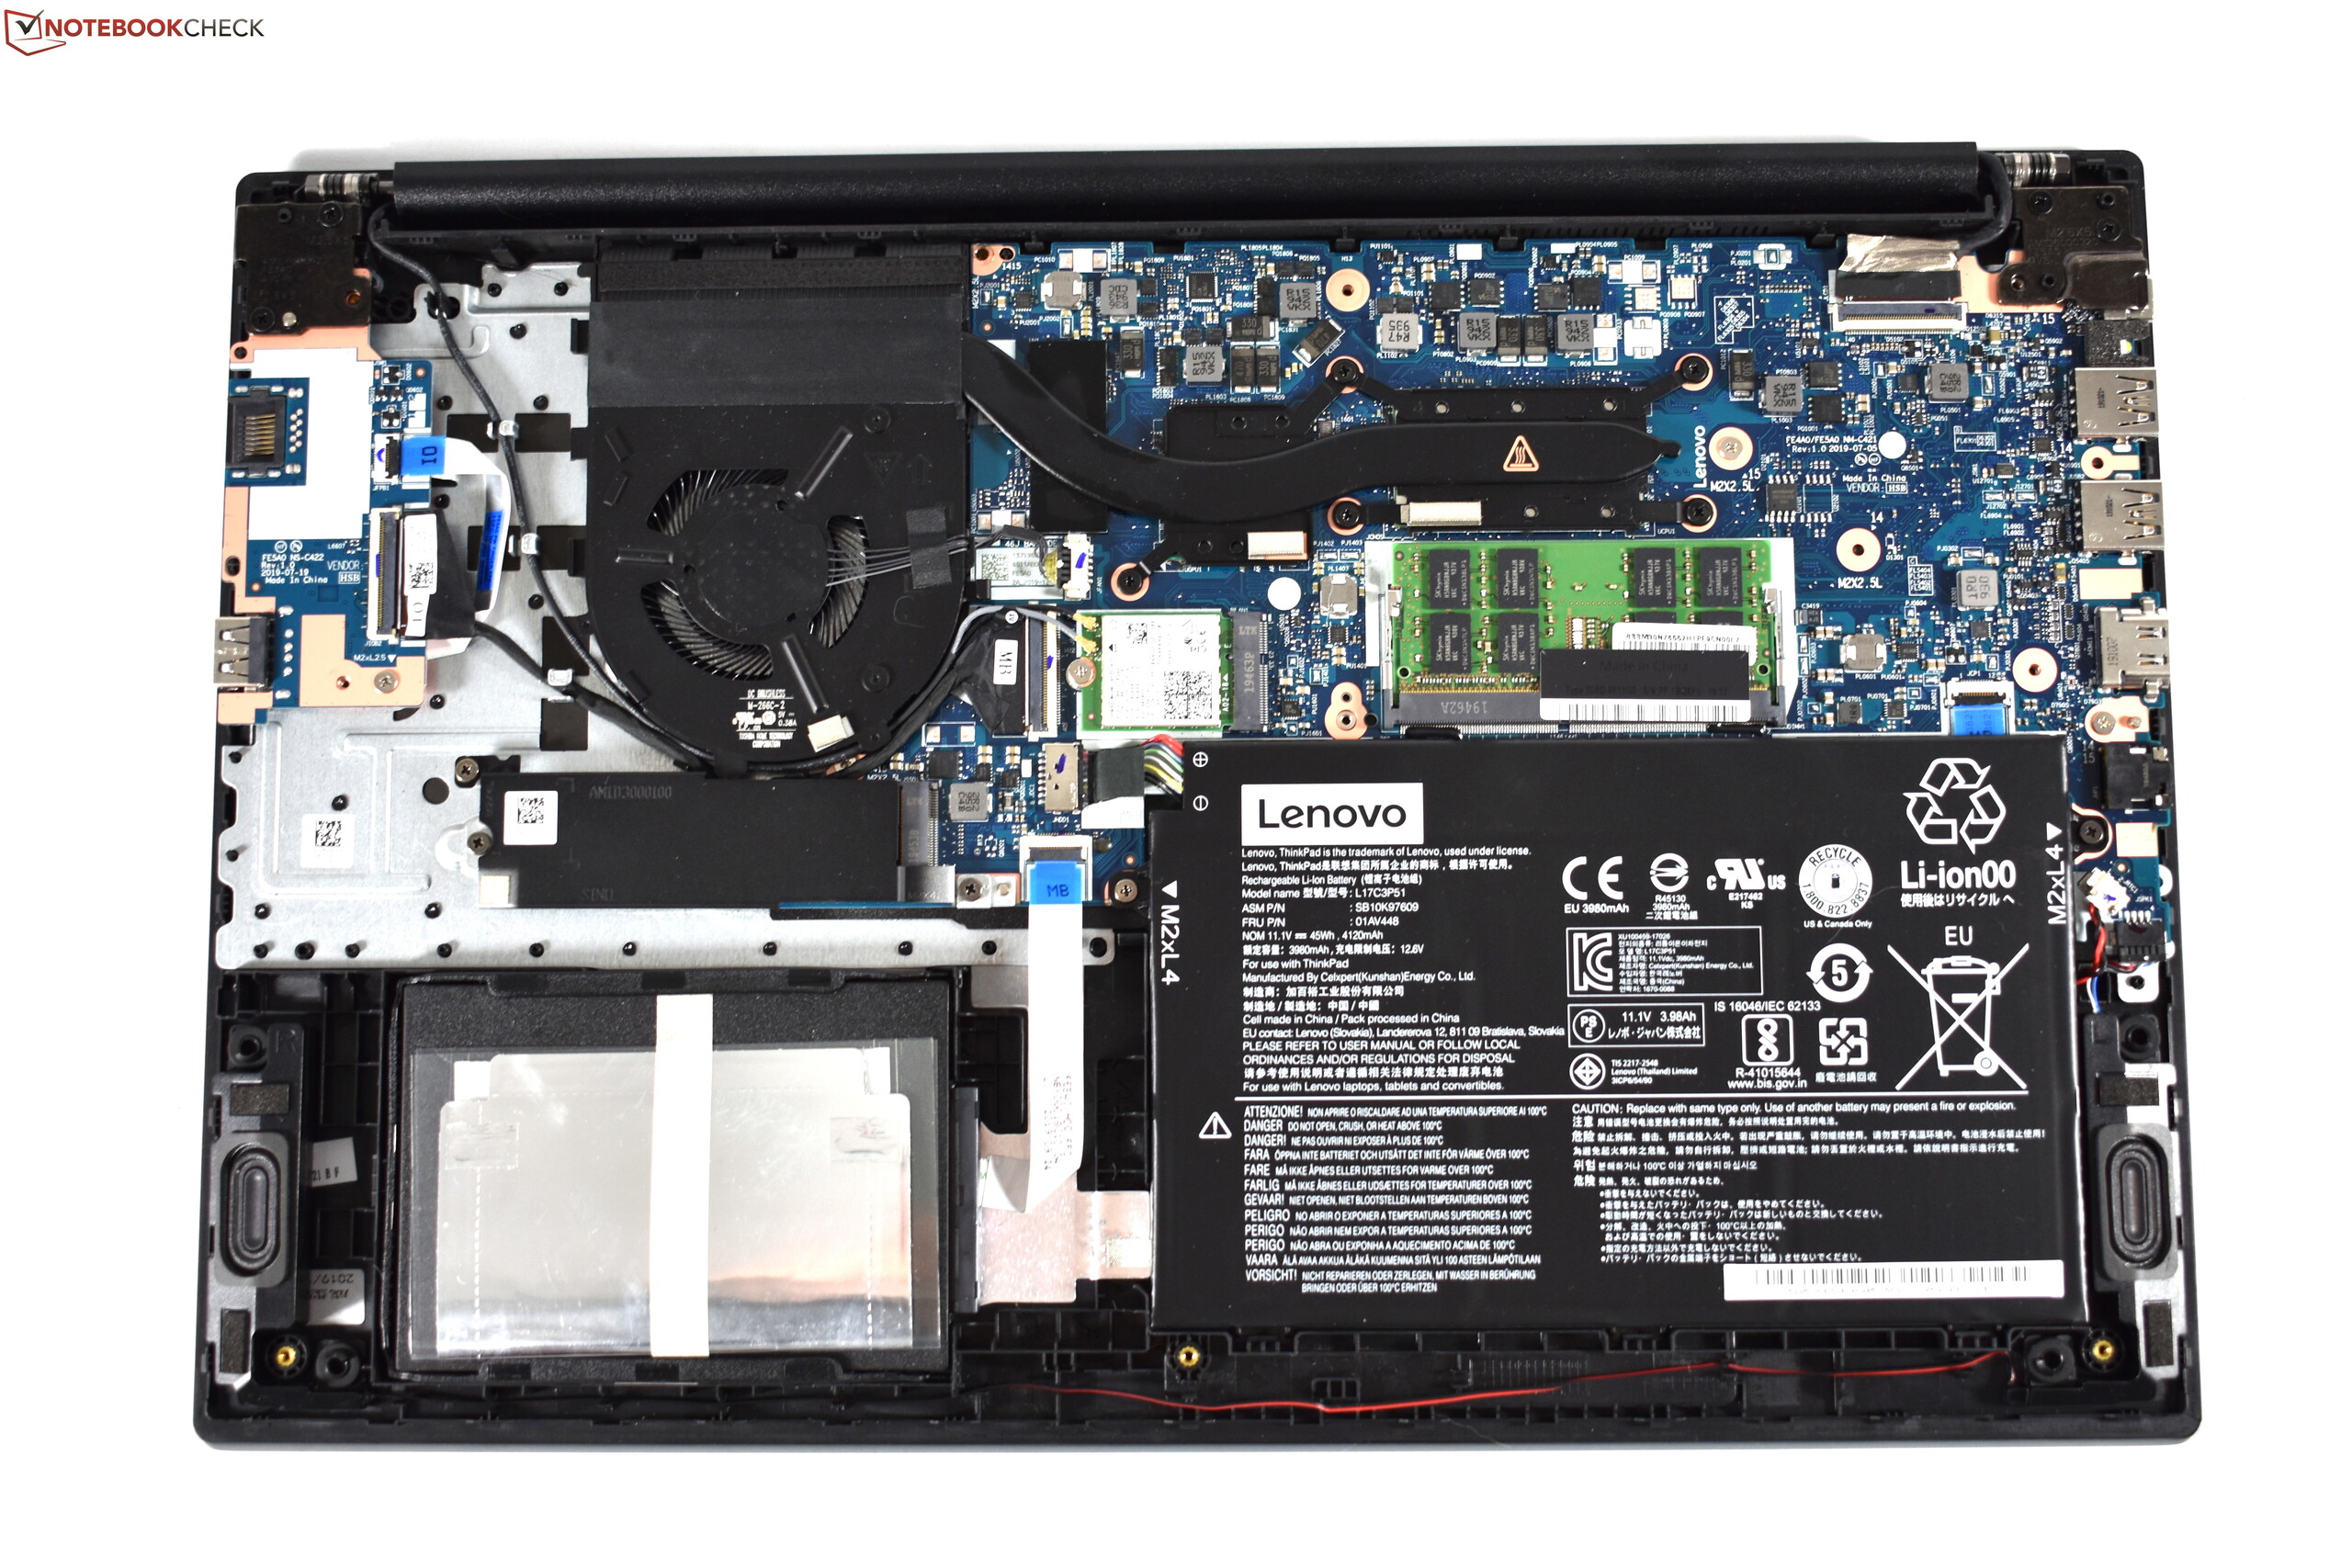
På namnet låter det som att Lenovo ThinkPad E15 är ett enormt steg framåt jämfört med Lenovo ThinkPad E590, men ThinkPad E15 påminner mycket om sin föregångare. Det grundläggande konceptet har inte ändrats men Lenovo har arbetat en del på detaljerna. Den har fortfarande det utmärkta ThinkPad-tangentbordet och en TrackPoint-enhet, vilket är sällsynt i det här prisskiktet. Chassit, som är gjort av aluminium och plast, är robust och uppgraderingsmöjligheterna är exemplariska – åtminstone när det kommer till masslagring.
I likhet med den mindre ThinkPad E14 innebär det tunnare chassit att en del funktioner har försvunnit. En av dem är microSD-platsen. Vi saknar verkligen också den andra RAM-platsen. Det som skiljer E15 från sitt mindre syskon är faktum att de saknade funktionerna inte är det största problemet. För problemet med ThinkPad E15 är att kylsystemet helt enkelt är överbelastat. I stress-testet fick vår ThinkPad strypa både CPU och GPU en hel del. Strypningen kan också ske vid vardagsbruk eller i det här fallet när man spelar spel. Dessutom blir chassit extremt varmt. På ett extra varmt ställe mätte vi upp 65 °C. Detta hände förvisso bara i stress-testet, men i det mindre krävande The Witcher 3-testet blev chassit nästan lika varmt.
För varm: En dedikerad GPU borde bara ingå om den kan kylas ordentligt vid belastning. Så är tyvärr inte fallet med Lenovo ThinkPad E15.
I slutändan kan vi inte rekommendera Lenovo ThinkPad E15 med en dGPU. AMD-chippet är helt enkelt malplacerat om det inte får tillräckligt med kylning. iGPU-versionen kan däremot vara mer prisvärd – som en större version av ThinkPad E14 eller som en bra laptop för hemmakontoret.
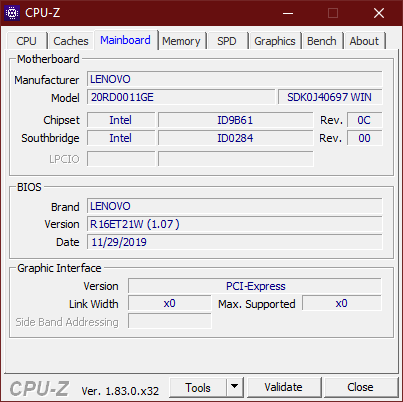
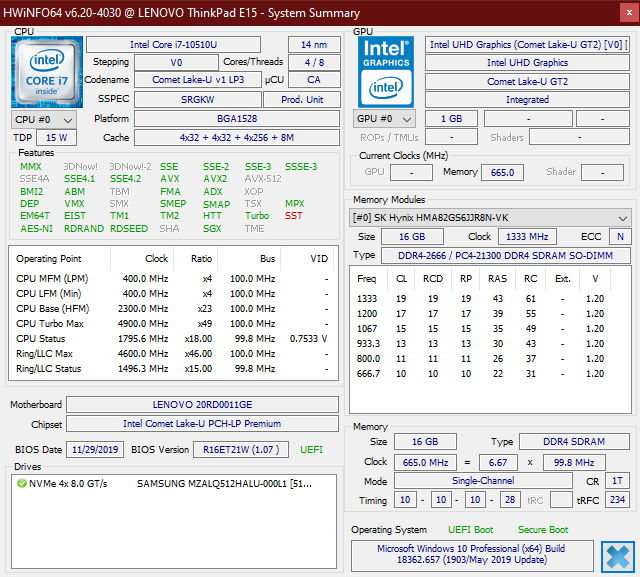
Lenovo ThinkPad E15 20RD0011GE
- 03/17/2020 v7 (old)
Benjamin Herzig
Price comparison
