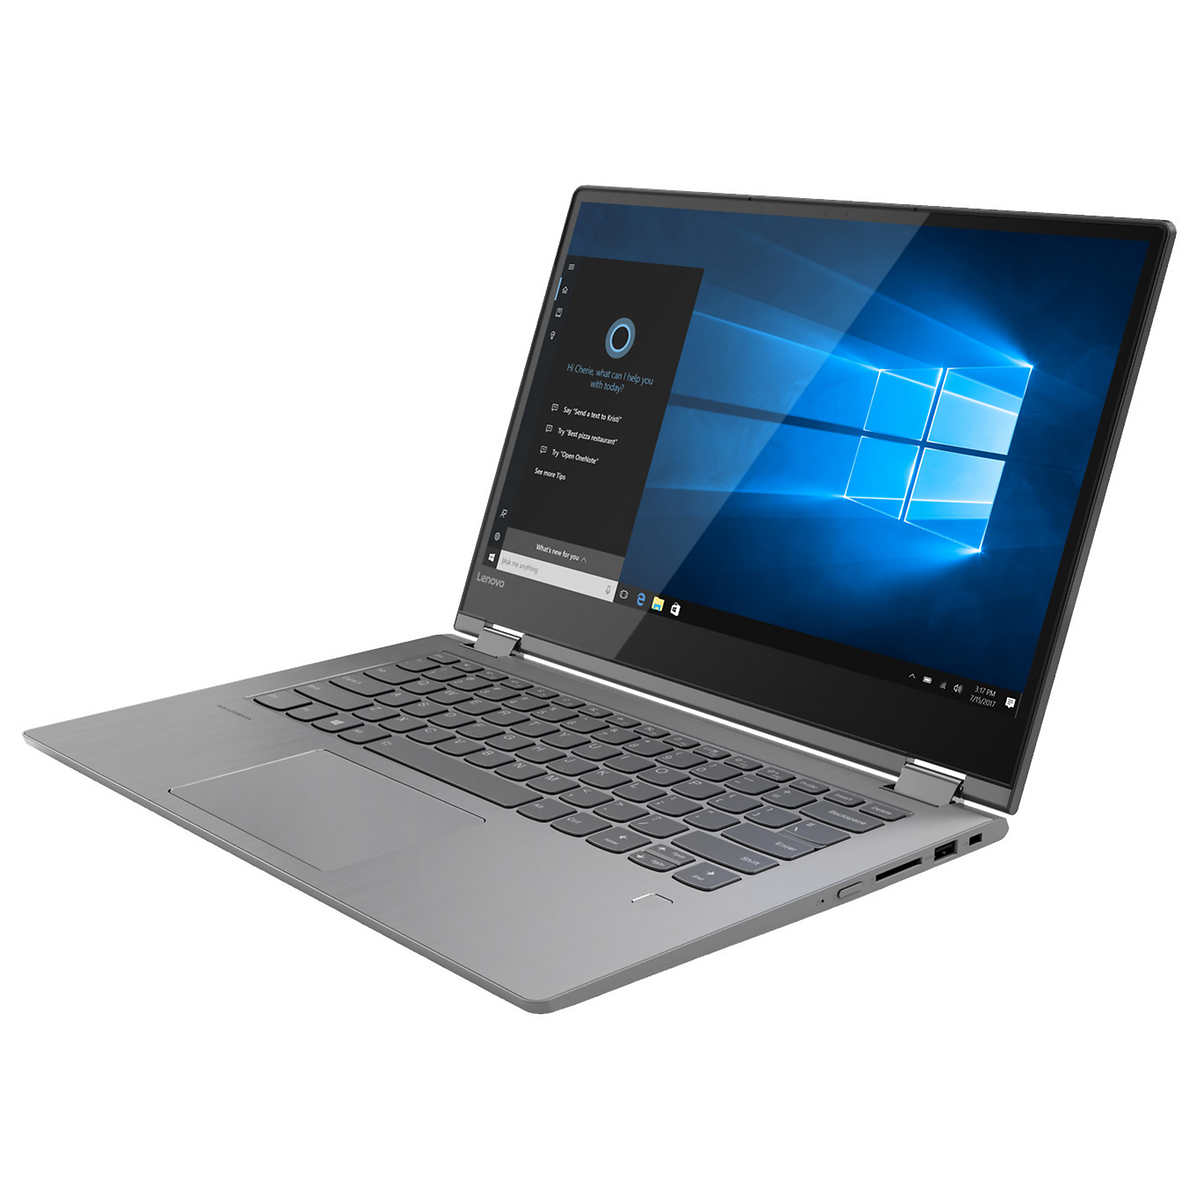
Test: Lenovo Flex 6-14IKB (i5 8250U, GeForce MX130) Omvandlingsbar (Sammanfattning)
| SD Card Reader | |
| average JPG Copy Test (av. of 3 runs) | |
| HP Pavilion x360 14-ba011ng (Toshiba Exceria Pro SDXC 64 GB UHS-II) | |
| Genomsnitt av klass Convertible (29.4 - 186, n=21, senaste 2 åren) | |
| Lenovo Flex 6-14IKB (Toshiba Exceria Pro SDXC 64 GB UHS-II) | |
| Asus VivoBook Flip 14 TP401NA (Toshiba Exceria Pro M501 microSDXC 64GB) | |
| Acer Spin 3 SP314-51-548L (Toshiba Exceria Pro SDXC 64 GB UHS-II) | |
| maximum AS SSD Seq Read Test (1GB) | |
| Genomsnitt av klass Convertible (67.5 - 254, n=20, senaste 2 åren) | |
| HP Pavilion x360 14-ba011ng (Toshiba Exceria Pro SDXC 64 GB UHS-II) | |
| Asus VivoBook Flip 14 TP401NA (Toshiba Exceria Pro M501 microSDXC 64GB) | |
| Lenovo Flex 6-14IKB (Toshiba Exceria Pro SDXC 64 GB UHS-II) | |
| Acer Spin 3 SP314-51-548L (Toshiba Exceria Pro SDXC 64 GB UHS-II) | |
| Networking | |
| iperf3 transmit AX12 | |
| Lenovo Flex 6-14IKB | |
| Lenovo Yoga 920-13IKB-80Y7 | |
| HP Pavilion x360 14-ba011ng | |
| Acer Spin 3 SP314-51-548L | |
| Asus VivoBook Flip 14 TP401NA | |
| iperf3 receive AX12 | |
| Lenovo Yoga 920-13IKB-80Y7 | |
| Lenovo Flex 6-14IKB | |
| Acer Spin 3 SP314-51-548L | |
| Asus VivoBook Flip 14 TP401NA | |
| HP Pavilion x360 14-ba011ng | |
| |||||||||||||||||||||||||
Distribution av ljusstyrkan: 91 %
Mitt på batteriet: 251.7 cd/m²
Kontrast: 1398:1 (Svärta: 0.18 cd/m²)
ΔE ColorChecker Calman: 5.17 | ∀{0.5-29.43 Ø4.71}
calibrated: 3.83
ΔE Greyscale Calman: 3.3 | ∀{0.09-98 Ø4.96}
60.4% sRGB (Argyll 1.6.3 3D)
38.6% AdobeRGB 1998 (Argyll 1.6.3 3D)
41.86% AdobeRGB 1998 (Argyll 3D)
60.5% sRGB (Argyll 3D)
40.49% Display P3 (Argyll 3D)
Gamma: 1.943
CCT: 6179 K
| Lenovo Flex 6-14IKB M140NWF5 R2, IPS, 14", 1920x1080 | Asus VivoBook Flip 14 TP401NA BOE CQ NV140FHM-N49, IPS, 14", 1920x1080 | Acer Spin 3 SP314-51-548L BOE CQ NV140FHM-N41, IPS, 14", 1920x1080 | HP Pavilion x360 14-ba011ng Chi Mei, IPS, 14", 1920x1080 | Lenovo Yoga 920-13IKB-80Y7 AU Optronics B139HAN03.0, IPS, 13.9", 1920x1080 | |
|---|---|---|---|---|---|
| Display | -1% | -2% | 3% | 53% | |
| Display P3 Coverage (%) | 40.49 | 40.21 -1% | 39.68 -2% | 41.82 3% | 62.5 54% |
| sRGB Coverage (%) | 60.5 | 59.6 -1% | 58.9 -3% | 61.6 2% | 91.7 52% |
| AdobeRGB 1998 Coverage (%) | 41.86 | 41.54 -1% | 41 -2% | 43.33 4% | 64.1 53% |
| Response Times | -8% | -11% | 15% | -8% | |
| Response Time Grey 50% / Grey 80% * (ms) | 43.2 ? | 42 ? 3% | 43 ? -0% | 41 ? 5% | 46 ? -6% |
| Response Time Black / White * (ms) | 28.8 ? | 34 ? -18% | 35 ? -22% | 22 ? 24% | 31.6 ? -10% |
| PWM Frequency (Hz) | 510 ? | 960 ? | 1000 | 25000 ? | |
| Screen | 3% | 7% | -17% | -10% | |
| Brightness middle (cd/m²) | 251.7 | 253 1% | 220 -13% | 252 0% | 297.9 18% |
| Brightness (cd/m²) | 249 | 239 -4% | 221 -11% | 237 -5% | 278 12% |
| Brightness Distribution (%) | 91 | 76 -16% | 78 -14% | 90 -1% | 81 -11% |
| Black Level * (cd/m²) | 0.18 | 0.21 -17% | 0.18 -0% | 0.21 -17% | 0.44 -144% |
| Contrast (:1) | 1398 | 1205 -14% | 1222 -13% | 1200 -14% | 677 -52% |
| Colorchecker dE 2000 * | 5.17 | 4.29 17% | 3.98 23% | 7.29 -41% | 5.1 1% |
| Colorchecker dE 2000 max. * | 26.18 | 8.74 67% | 7.69 71% | 17.55 33% | 11 58% |
| Colorchecker dE 2000 calibrated * | 3.83 | 5.93 -55% | 4 -4% | ||
| Greyscale dE 2000 * | 3.3 | 1.49 55% | 1.68 49% | 7.48 -127% | 6.7 -103% |
| Gamma | 1.943 113% | 2.29 96% | 2.37 93% | 2.45 90% | 2.9 76% |
| CCT | 6179 105% | 6611 98% | 6382 102% | 6953 93% | 6839 95% |
| Color Space (Percent of AdobeRGB 1998) (%) | 38.6 | 38 -2% | 38 -2% | 40 4% | 64.1 66% |
| Color Space (Percent of sRGB) (%) | 60.4 | 59 -2% | 58 -4% | 61 1% | 91.7 52% |
| Totalt genomsnitt (program/inställningar) | -2% /
1% | -2% /
3% | 0% /
-9% | 12% /
3% |
* ... mindre är bättre
Visa svarstider
| ↔ Svarstid svart till vitt | ||
|---|---|---|
| 28.8 ms ... stiga ↗ och falla ↘ kombinerat | ↗ 14.8 ms stiga | 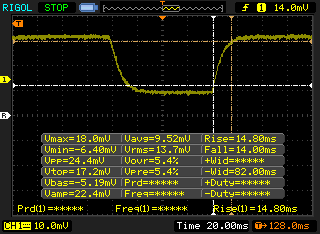 |
| ↘ 14 ms hösten | ||
| Skärmen visar relativt långsamma svarsfrekvenser i våra tester och kan vara för långsam för spelare. I jämförelse sträcker sig alla testade enheter från 0.1 (minst) till 240 (maximalt) ms. » 76 % av alla enheter är bättre. Detta innebär att den uppmätta svarstiden är sämre än genomsnittet av alla testade enheter (19.8 ms). | ||
| ↔ Svarstid 50 % grått till 80 % grått | ||
| 43.2 ms ... stiga ↗ och falla ↘ kombinerat | ↗ 18.8 ms stiga | 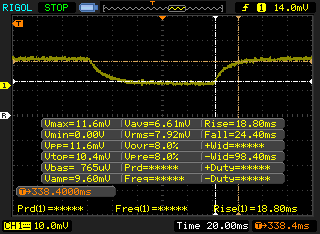 |
| ↘ 24.4 ms hösten | ||
| Skärmen visar långsamma svarsfrekvenser i våra tester och kommer att vara otillfredsställande för spelare. I jämförelse sträcker sig alla testade enheter från 0.165 (minst) till 636 (maximalt) ms. » 72 % av alla enheter är bättre. Detta innebär att den uppmätta svarstiden är sämre än genomsnittet av alla testade enheter (30.9 ms). | ||
Skärmflimmer / PWM (Puls-Width Modulation)
| Skärmflimmer / PWM upptäckt | 510 Hz | ≤ 99 % ljusstyrka inställning | 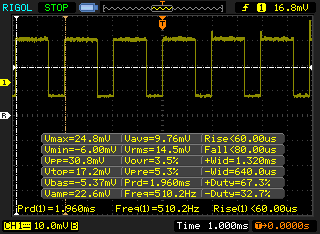 |
Displayens bakgrundsbelysning flimrar vid 510 Hz (i värsta fall, t.ex. med PWM) Flimrande upptäckt vid en ljusstyrkeinställning på 99 % och lägre. Det ska inte finnas något flimmer eller PWM över denna ljusstyrkeinställning. Frekvensen för 510 Hz är ganska hög, så de flesta användare som är känsliga för PWM bör inte märka något flimmer. Som jämförelse: 52 % av alla testade enheter använder inte PWM för att dämpa skärmen. Om PWM upptäcktes mättes ett medelvärde av 7744 (minst: 5 - maximum: 343500) Hz. | |||
| Cinebench R15 | |
| CPU Single 64Bit | |
| Genomsnitt av klass Convertible (149.8 - 317, n=48, senaste 2 åren) | |
| Lenovo Yoga 920-13IKB-80Y7 | |
| Acer Spin 3 SP314-51-548L | |
| Genomsnitt Intel Core i5-8250U (81 - 147, n=97) | |
| Lenovo Flex 6-14IKB | |
| HP Pavilion x360 14-ba011ng | |
| Asus VivoBook Flip 14 TP401NA | |
| CPU Multi 64Bit | |
| Genomsnitt av klass Convertible (478 - 4940, n=48, senaste 2 åren) | |
| Lenovo Yoga 920-13IKB-80Y7 | |
| Genomsnitt Intel Core i5-8250U (320 - 730, n=101) | |
| Acer Spin 3 SP314-51-548L | |
| Lenovo Flex 6-14IKB | |
| HP Pavilion x360 14-ba011ng | |
| Asus VivoBook Flip 14 TP401NA | |
| PCMark 8 - Home Score Accelerated v2 | |
| Genomsnitt av klass Convertible (n=1senaste 2 åren) | |
| Lenovo Yoga 920-13IKB-80Y7 | |
| Acer Spin 3 SP314-51-548L | |
| Genomsnitt Intel Core i5-8250U, NVIDIA GeForce MX130 (3207 - 3903, n=5) | |
| HP Pavilion x360 14-ba011ng | |
| Lenovo Flex 6-14IKB | |
| Asus VivoBook Flip 14 TP401NA | |
| PCMark 8 Home Score Accelerated v2 | 3207 poäng | |
| PCMark 10 Score | 3267 poäng | |
Hjälp | ||
| Lenovo Flex 6-14IKB Samsung PM961 MZVLW256HEHP | Acer Spin 3 SP314-51-548L Micron 1100 MTFDDAV256TBN | HP Pavilion x360 14-ba011ng Samsung CM871a MZNTY128HDHP | Lenovo Yoga 920-13IKB-80Y7 Samsung PM961 MZVLW256HEHP | Genomsnitt Samsung PM961 MZVLW256HEHP | |
|---|---|---|---|---|---|
| AS SSD | -50% | -56% | 14% | -94% | |
| Copy Game MB/s (MB/s) | 231.9 | 166.2 | 319.2 | 537 ? | |
| Copy Program MB/s (MB/s) | 158.8 | 65.1 | 463.3 | 343 ? | |
| Copy ISO MB/s (MB/s) | 329.8 | 211.3 | 1341 | 1004 ? | |
| Score Total (Points) | 2311 | 867 -62% | 974 -58% | 2536 10% | 2565 ? 11% |
| Score Write (Points) | 526 | 392 -25% | 261 -50% | 608 16% | 587 ? 12% |
| Score Read (Points) | 1200 | 311 -74% | 465 -61% | 1316 10% | 1378 ? 15% |
| Access Time Write * (ms) | 0.039 | 0.056 -44% | 0.076 -95% | 0.028 28% | 0.4637 ? -1089% |
| Access Time Read * (ms) | 0.062 | 0.091 -47% | 0.093 -50% | 0.044 29% | 0.06777 ? -9% |
| 4K-64 Write (MB/s) | 308.5 | 273.6 -11% | 128.4 -58% | 391.3 27% | 419 ? 36% |
| 4K-64 Read (MB/s) | 953 | 236.1 -75% | 381.4 -60% | 1039 9% | 1112 ? 17% |
| 4K Write (MB/s) | 96.4 | 77.9 -19% | 83.9 -13% | 128.1 33% | 91.6 ? -5% |
| 4K Read (MB/s) | 47.85 | 25.41 -47% | 32.19 -33% | 48.46 1% | 45.1 ? -6% |
| Seq Write (MB/s) | 1211 | 406.9 -66% | 491.5 -59% | 885 -27% | 960 ? -21% |
| Seq Read (MB/s) | 1984 | 491.1 -75% | 515 -74% | 2282 15% | 2019 ? 2% |
* ... mindre är bättre

| 3DMark 11 | |
| 1280x720 Performance GPU | |
| Genomsnitt av klass Convertible (1505 - 40732, n=48, senaste 2 åren) | |
| Genomsnitt NVIDIA GeForce MX130 (2476 - 3203, n=14) | |
| Lenovo Flex 6-14IKB | |
| HP Pavilion x360 14-ba011ng | |
| Lenovo Yoga 920-13IKB-80Y7 | |
| Acer Spin 3 SP314-51-548L | |
| Asus VivoBook Flip 14 TP401NA | |
| 1280x720 Performance Combined | |
| Genomsnitt av klass Convertible (1952 - 17837, n=47, senaste 2 åren) | |
| Genomsnitt NVIDIA GeForce MX130 (2169 - 3031, n=13) | |
| Lenovo Flex 6-14IKB | |
| HP Pavilion x360 14-ba011ng | |
| Lenovo Yoga 920-13IKB-80Y7 | |
| Acer Spin 3 SP314-51-548L | |
| Asus VivoBook Flip 14 TP401NA | |
| 3DMark 11 Performance | 3102 poäng | |
Hjälp | ||
| BioShock Infinite | |
| 1280x720 Very Low Preset (sortera efter värde) | |
| Lenovo Flex 6-14IKB | |
| Asus VivoBook Flip 14 TP401NA | |
| Acer Spin 3 SP314-51-548L | |
| HP Pavilion x360 14-ba011ng | |
| Lenovo Yoga 920-13IKB-80Y7 | |
| Genomsnitt NVIDIA GeForce MX130 (83.6 - 152.6, n=10) | |
| 1366x768 Medium Preset (sortera efter värde) | |
| Lenovo Flex 6-14IKB | |
| Asus VivoBook Flip 14 TP401NA | |
| Acer Spin 3 SP314-51-548L | |
| HP Pavilion x360 14-ba011ng | |
| Lenovo Yoga 920-13IKB-80Y7 | |
| Genomsnitt NVIDIA GeForce MX130 (57.3 - 84.5, n=10) | |
| 1366x768 High Preset (sortera efter värde) | |
| Lenovo Flex 6-14IKB | |
| Asus VivoBook Flip 14 TP401NA | |
| Acer Spin 3 SP314-51-548L | |
| HP Pavilion x360 14-ba011ng | |
| Lenovo Yoga 920-13IKB-80Y7 | |
| Genomsnitt NVIDIA GeForce MX130 (48 - 69, n=10) | |
| 1920x1080 Ultra Preset, DX11 (DDOF) (sortera efter värde) | |
| Lenovo Flex 6-14IKB | |
| Acer Spin 3 SP314-51-548L | |
| HP Pavilion x360 14-ba011ng | |
| Lenovo Yoga 920-13IKB-80Y7 | |
| Genomsnitt NVIDIA GeForce MX130 (22 - 48.7, n=10) | |
| låg | med. | hög | ultra | |
|---|---|---|---|---|
| BioShock Infinite (2013) | 115 | 61 | 48 | 22 |
Ljudnivå
| Låg belastning |
| 28.5 / 28.5 / 28.9 dB(A) |
| Hög belastning |
| 39.1 / 39.1 dB(A) |
 | ||
30 dB tyst 40 dB(A) hörbar 50 dB(A) högt ljud |
||
min: | ||
| Lenovo Flex 6-14IKB GeForce MX130, i5-8250U, Samsung PM961 MZVLW256HEHP | Acer Spin 3 SP314-51-548L UHD Graphics 620, i5-8250U, Micron 1100 MTFDDAV256TBN | HP Pavilion x360 14-ba011ng GeForce 940MX, i5-7200U, Samsung CM871a MZNTY128HDHP | Lenovo Yoga 920-13IKB-80Y7 UHD Graphics 620, i5-8550U, Samsung PM961 MZVLW256HEHP | |
|---|---|---|---|---|
| Noise | -5% | -7% | 4% | |
| av / miljö * (dB) | 28.5 | 30 -5% | 30 -5% | 28 2% |
| Idle Minimum * (dB) | 28.5 | 30 -5% | 31.2 -9% | 28 2% |
| Idle Average * (dB) | 28.5 | 30 -5% | 31.2 -9% | 28.8 -1% |
| Idle Maximum * (dB) | 28.9 | 30 -4% | 31.7 -10% | 30.3 -5% |
| Load Average * (dB) | 39.1 | 38.5 2% | 38.4 2% | 34.5 12% |
| Load Maximum * (dB) | 39.1 | 44 -13% | 42.1 -8% | 34.3 12% |
* ... mindre är bättre
(+) Den maximala temperaturen på ovansidan är 35.8 °C / 96 F, jämfört med genomsnittet av 35.4 °C / 96 F , allt från 19.6 till 60 °C för klassen Convertible.
(-) Botten värms upp till maximalt 46 °C / 115 F, jämfört med genomsnittet av 36.9 °C / 98 F
(+) Vid tomgångsbruk är medeltemperaturen för ovansidan 25 °C / 77 F, jämfört med enhetsgenomsnittet på 30.3 °C / ### class_avg_f### F.
(+) Handledsstöden och pekplattan är kallare än hudtemperaturen med maximalt 23.4 °C / 74.1 F och är därför svala att ta på.
(+) Medeltemperaturen för handledsstödsområdet på liknande enheter var 28 °C / 82.4 F (+4.6 °C / 8.3 F).
Lenovo Flex 6-14IKB ljudanalys
(±) | högtalarljudstyrkan är genomsnittlig men bra (73.3 dB)
Bas 100 - 315 Hz
(-) | nästan ingen bas - i genomsnitt 16.3% lägre än medianen
(-) | basen är inte linjär (15.9% delta till föregående frekvens)
Mellan 400 - 2000 Hz
(+) | balanserad mellan - endast 2.7% från medianen
(+) | mids är linjära (6.9% delta till föregående frekvens)
Högsta 2 - 16 kHz
(+) | balanserade toppar - endast 3.9% från medianen
(±) | linjäriteten för toppar är genomsnittlig (10.8% delta till föregående frekvens)
Totalt 100 - 16 000 Hz
(±) | linjäriteten för det totala ljudet är genomsnittlig (24.8% skillnad mot median)
Jämfört med samma klass
» 75% av alla testade enheter i den här klassen var bättre, 6% liknande, 18% sämre
» Den bästa hade ett delta på 6%, genomsnittet var 20%, sämst var 57%
Jämfört med alla testade enheter
» 76% av alla testade enheter var bättre, 5% liknande, 19% sämre
» Den bästa hade ett delta på 4%, genomsnittet var 23%, sämst var 134%
Asus VivoBook Flip 14 TP401NA ljudanalys
(-) | inte särskilt höga högtalare (63.5 dB)
Bas 100 - 315 Hz
(±) | reducerad bas - i genomsnitt 9% lägre än medianen
(-) | basen är inte linjär (17.4% delta till föregående frekvens)
Mellan 400 - 2000 Hz
(+) | balanserad mellan - endast 2.8% från medianen
(+) | mids är linjära (6.9% delta till föregående frekvens)
Högsta 2 - 16 kHz
(±) | högre toppar - i genomsnitt 5.1% högre än medianen
(+) | toppar är linjära (6.2% delta till föregående frekvens)
Totalt 100 - 16 000 Hz
(±) | linjäriteten för det totala ljudet är genomsnittlig (18.5% skillnad mot median)
Jämfört med samma klass
» 42% av alla testade enheter i den här klassen var bättre, 8% liknande, 51% sämre
» Den bästa hade ett delta på 6%, genomsnittet var 20%, sämst var 57%
Jämfört med alla testade enheter
» 42% av alla testade enheter var bättre, 8% liknande, 51% sämre
» Den bästa hade ett delta på 4%, genomsnittet var 23%, sämst var 134%
| Av/Standby | |
| Låg belastning | |
| Hög belastning |
|
Förklaring:
min: | |
| Lenovo Flex 6-14IKB i5-8250U, GeForce MX130, Samsung PM961 MZVLW256HEHP, IPS, 1920x1080, 14" | Asus VivoBook Flip 14 TP401NA Pentium N4200, HD Graphics 505, 128 GB eMMC Flash, IPS, 1920x1080, 14" | Acer Spin 3 SP314-51-548L i5-8250U, UHD Graphics 620, Micron 1100 MTFDDAV256TBN, IPS, 1920x1080, 14" | HP Pavilion x360 14-ba011ng i5-7200U, GeForce 940MX, Samsung CM871a MZNTY128HDHP, IPS, 1920x1080, 14" | Lenovo Yoga 920-13IKB-80Y7 i5-8550U, UHD Graphics 620, Samsung PM961 MZVLW256HEHP, IPS, 1920x1080, 13.9" | |
|---|---|---|---|---|---|
| Power Consumption | 30% | 28% | -17% | 13% | |
| Idle Minimum * (Watt) | 4.4 | 4.26 3% | 2.9 34% | 4.2 5% | 3.1 30% |
| Idle Average * (Watt) | 5.3 | 7.1 -34% | 5.2 2% | 7.2 -36% | 6.6 -25% |
| Idle Maximum * (Watt) | 9.4 | 7.44 21% | 5.4 43% | 9.8 -4% | 7 26% |
| Load Average * (Watt) | 43.6 | 1.4 97% | 29.4 33% | 44 -1% | 35.2 19% |
| Witcher 3 ultra * (Watt) | 34 | ||||
| Load Maximum * (Watt) | 40.5 | 15.6 61% | 29.6 27% | 61 -51% | 34.6 15% |
* ... mindre är bättre
| Lenovo Flex 6-14IKB i5-8250U, GeForce MX130, 45 Wh | Asus VivoBook Flip 14 TP401NA Pentium N4200, HD Graphics 505, 39 Wh | Acer Spin 3 SP314-51-548L i5-8250U, UHD Graphics 620, 52.5 Wh | HP Pavilion x360 14-ba011ng i5-7200U, GeForce 940MX, 41.5 Wh | Lenovo Yoga 920-13IKB-80Y7 i5-8550U, UHD Graphics 620, 70 Wh | |
|---|---|---|---|---|---|
| Batteridrifttid | |||||
| WiFi v1.3 (h) | 6.9 | 6.5 -6% | 8.3 20% | 6.2 -10% | 11.4 65% |
För
Emot
Läs den fullständiga versionen av den här recensionen på engelska här.
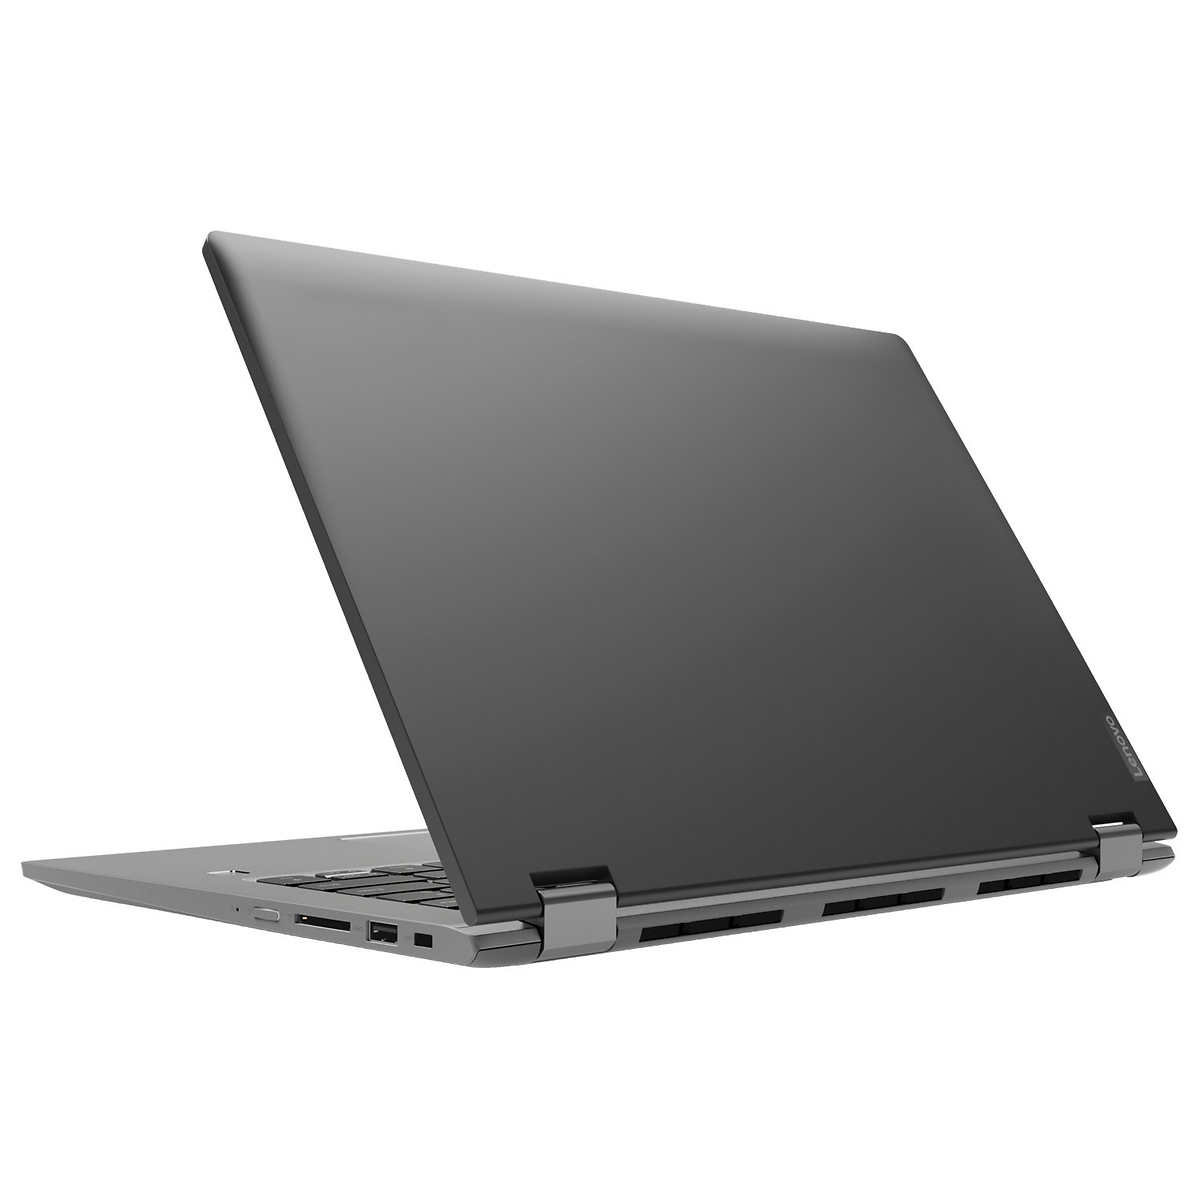
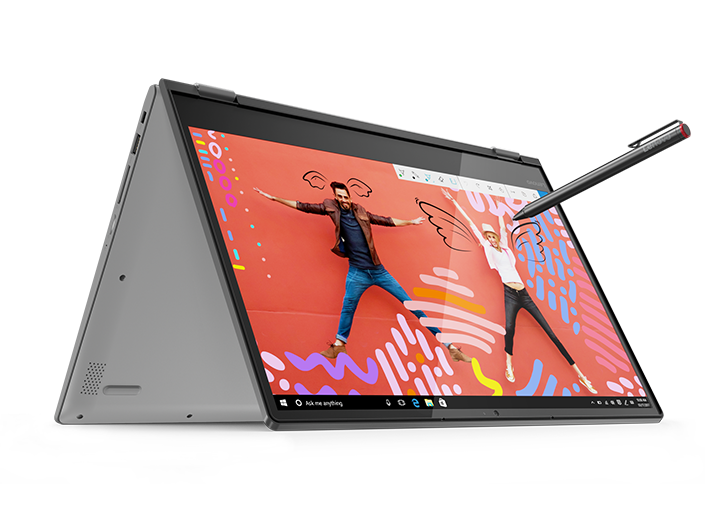
Lenovos Flex 6 14 är ytterligare en "mittemellan-variant" i mittenskiktet för den som letar efter en okomplicerad omvandlingsbar i måttlig storlek men som inte vill lägga pengar på ett toppskikts-alternativ som Yoga 920. Jämfört med sina dyrare syskon nöjer sig Flex 6 14 med ett klent plasthölje och tråkig design, men den har åtminstone ett handledsstöd i borstad metall och smal infattning för en modernare känsla. Inmatningsenheterna duger men skribenter som förväntar sig ett tangentbord från en lyxig Ultrabook bör spendera lite tid med Flex 6 14 innan beslut tas. På samma sätt så duger skärmen för inomhusbruk men utomhus tas dess blanka yta och svaga ljusstyrka snabbt över av störande reflektioner.
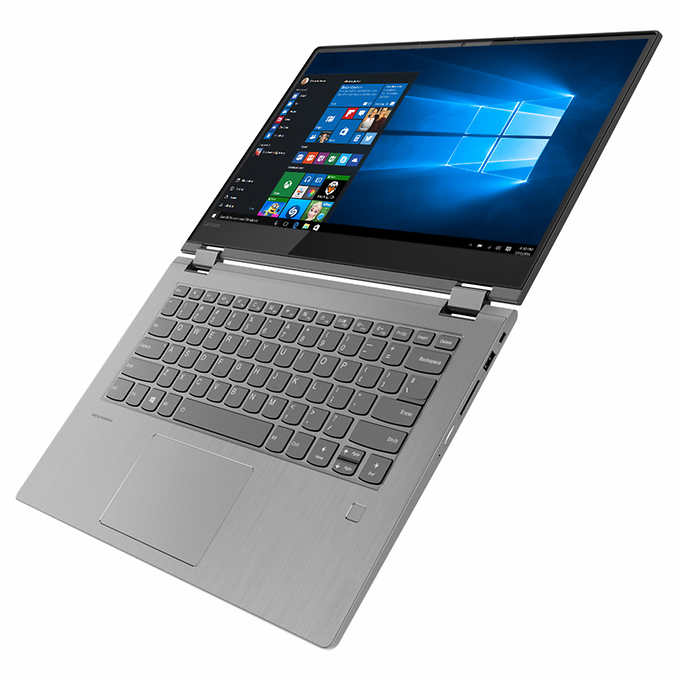
Lenovos Flex 6 14 passar den som är intresserad av en välpresterande omvandlingsbar med möjlighet till en aktiv stylus men som kanske inte är så noggrann med dyra inmatningsenheter, höljets design eller användning utomhus.
Bortsett från designkrångel så presterar Flex 6 14 fullt dugligt. Tack vare en 8:e generationens Core i5 CPU, en GeForce MX130 GPU, tillräckligt med fysiskt minne och en NVMe SSD så utklassar Flex många av sina kamrater i fråga om lagringsprestanda eller grafisk kapacitet. Det är inte en spellaptop, men det är bra att ha sådan flexibilitet då funktion framför form är dagens tema. Lenovos Active Pen som vår recensionskonfiguration inkluderade är en trevlig bonus för den som föredrar stylus-baserad inmatning eller teckning.
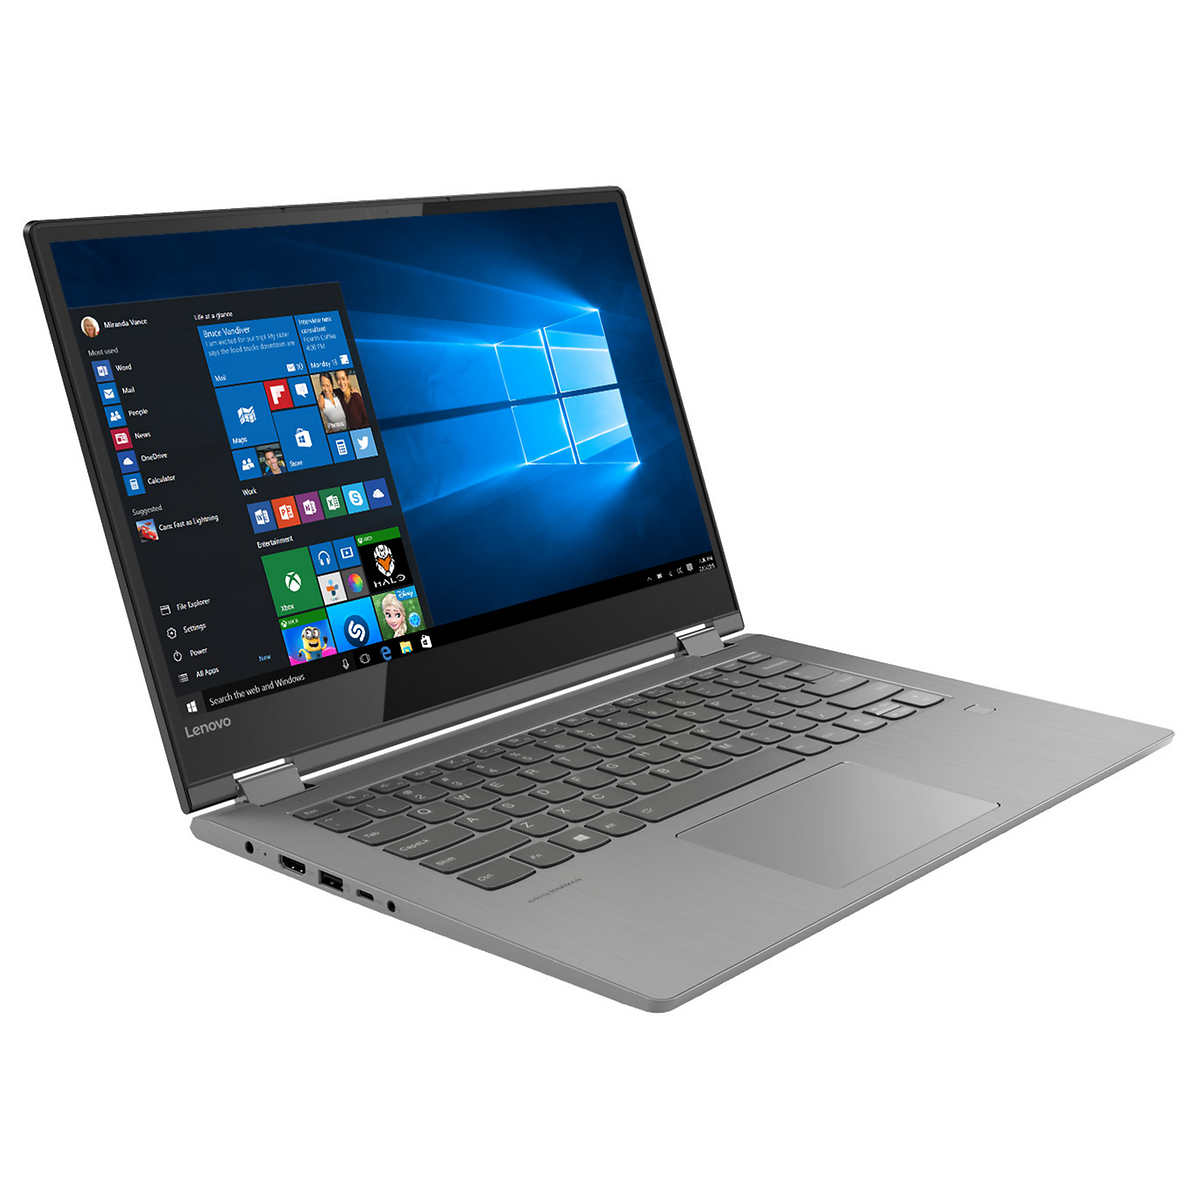
För 8.000 kronor passar Lenovos Flex 6 14 den som är intresserad av en välpresterande omvandlingsbar med möjlighet till en aktiv stylus men som kanske inte är så noggrann med dyra inmatningsenheter, höljets design eller användning utomhus. För några tusen kronor till löser nästa nivå av maskiner (Yoga 920, XPS 13) dom flesta av dessa brister - men med dagens uppdateringar på plats är Flex 6 14 mer lämpad som en mittenskikts-konkurrent än vad dess föregångare var.
Lenovo Flex 6-14IKB
- 06/09/2018 v6 (old)
Steve Schardein
Price comparison
