Test: Lenovo Flex 6 11 (Celeron N4000) Omvandlingsbar (Sammanfattning)
| SD Card Reader | |
| average JPG Copy Test (av. of 3 runs) | |
| Lenovo Flex 6-11IGM (Toshiba Exceria Pro SDXC 64 GB UHS-II) | |
| Lenovo Ideapad 120s-11IAP (Toshiba Exceria Pro M401) | |
| HP Pavilion x360 11t T5M27AV (Toshiba Exceria Pro SDXC 64 GB UHS-II) | |
| Acer TravelMate Spin B1 118-RN-P6BE (Toshiba Exceria Pro SDXC 64 GB UHS-II) | |
| maximum AS SSD Seq Read Test (1GB) | |
| Lenovo Flex 6-11IGM (Toshiba Exceria Pro SDXC 64 GB UHS-II) | |
| Lenovo Ideapad 120s-11IAP (Toshiba Exceria Pro M401) | |
| HP Pavilion x360 11t T5M27AV (Toshiba Exceria Pro SDXC 64 GB UHS-II) | |
| Acer TravelMate Spin B1 118-RN-P6BE (Toshiba Exceria Pro SDXC 64 GB UHS-II) | |
| Networking | |
| iperf3 transmit AX12 | |
| Acer TravelMate Spin B1 118-RN-P6BE | |
| Asus VivoBook Flip 12 TP203NAH-BP049T | |
| Lenovo Flex 6-11IGM | |
| Lenovo Ideapad 120s-11IAP | |
| HP Pavilion x360 11t T5M27AV | |
| iperf3 receive AX12 | |
| Acer TravelMate Spin B1 118-RN-P6BE | |
| Lenovo Ideapad 120s-11IAP | |
| Asus VivoBook Flip 12 TP203NAH-BP049T | |
| Lenovo Flex 6-11IGM | |
| HP Pavilion x360 11t T5M27AV | |
| |||||||||||||||||||||||||
Distribution av ljusstyrkan: 80 %
Mitt på batteriet: 257.4 cd/m²
Kontrast: 468:1 (Svärta: 0.55 cd/m²)
ΔE ColorChecker Calman: 11.97 | ∀{0.5-29.43 Ø4.71}
calibrated: 3.71
ΔE Greyscale Calman: 12.3 | ∀{0.09-98 Ø4.96}
63.7% sRGB (Argyll 1.6.3 3D)
40.7% AdobeRGB 1998 (Argyll 1.6.3 3D)
44.16% AdobeRGB 1998 (Argyll 3D)
63.9% sRGB (Argyll 3D)
42.72% Display P3 (Argyll 3D)
Gamma: 2.03
CCT: 13739 K
| Lenovo Flex 6-11IGM Chi Mei CMN1132, TN LED, 11.6", 1366x768 | Lenovo Ideapad 120s-11IAP AU Optronics AUO-B116XTN02.5 , TN LED, 11.6", 1366x768 | HP Pavilion x360 11t T5M27AV LG Philips LGD0497, IPS, 11.6", 1366x768 | Apple MacBook Air 11 inch 2015-03 APP9CF3, TN, 11", 1366x768 | Asus VivoBook Flip 12 TP203NAH-BP049T AU Optronics B116XAN04.3, IPS, 11.6", 1366x768 | Acer TravelMate Spin B1 118-RN-P6BE LM116LF3L02, IPS LED, 11.6", 1920x1080 | |
|---|---|---|---|---|---|---|
| Display | -9% | -4% | -5% | 4% | 61% | |
| Display P3 Coverage (%) | 42.72 | 39.03 -9% | 41.11 -4% | 40.56 -5% | 44.23 4% | 71.6 68% |
| sRGB Coverage (%) | 63.9 | 58.7 -8% | 61.8 -3% | 60.6 -5% | 66.3 4% | 97.5 53% |
| AdobeRGB 1998 Coverage (%) | 44.16 | 40.33 -9% | 42.47 -4% | 41.95 -5% | 45.73 4% | 71.6 62% |
| Response Times | -51% | -4% | -4% | -10% | ||
| Response Time Grey 50% / Grey 80% * (ms) | 33.6 ? | 72.8 ? -117% | 42.8 ? -27% | 39 ? -16% | 38 ? -13% | |
| Response Time Black / White * (ms) | 27.2 ? | 22.8 ? 16% | 22 ? 19% | 25 ? 8% | 29.2 ? -7% | |
| PWM Frequency (Hz) | 25000 ? | 1000 ? | ||||
| Screen | -4% | 26% | 44% | 51% | 63% | |
| Brightness middle (cd/m²) | 257.4 | 266.2 3% | 245.2 -5% | 368 43% | 253 -2% | 324 26% |
| Brightness (cd/m²) | 243 | 251 3% | 219 -10% | 349 44% | 245 1% | 290 19% |
| Brightness Distribution (%) | 80 | 90 13% | 79 -1% | 90 13% | 65 -19% | 80 0% |
| Black Level * (cd/m²) | 0.55 | 0.67 -22% | 0.32 42% | 0.493 10% | 0.17 69% | 0.23 58% |
| Contrast (:1) | 468 | 397 -15% | 766 64% | 746 59% | 1488 218% | 1409 201% |
| Colorchecker dE 2000 * | 11.97 | 12.4 -4% | 5.5 54% | 3.29 73% | 3.17 74% | 3.7 69% |
| Colorchecker dE 2000 max. * | 30.48 | 24.5 20% | 16.9 45% | 5.22 83% | 8.13 73% | 7.4 76% |
| Colorchecker dE 2000 calibrated * | 3.71 | |||||
| Greyscale dE 2000 * | 12.3 | 14.4 -17% | 2.9 76% | 3.06 75% | 2 84% | 4 67% |
| Gamma | 2.03 108% | 2.16 102% | 2.2 100% | 2.68 82% | 2.43 91% | 2.13 103% |
| CCT | 13739 47% | 19436 33% | 6157 106% | 6397 102% | 6850 95% | 6971 93% |
| Color Space (Percent of AdobeRGB 1998) (%) | 40.7 | 37 -9% | 39 -4% | 38.8 -5% | 42 3% | 63.7 57% |
| Color Space (Percent of sRGB) (%) | 63.7 | 59 -7% | 62 -3% | 66 4% | 97.3 53% | |
| Totalt genomsnitt (program/inställningar) | -21% /
-11% | 6% /
16% | 20% /
32% | 17% /
34% | 38% /
53% |
* ... mindre är bättre
Visa svarstider
| ↔ Svarstid svart till vitt | ||
|---|---|---|
| 27.2 ms ... stiga ↗ och falla ↘ kombinerat | ↗ 20.4 ms stiga | 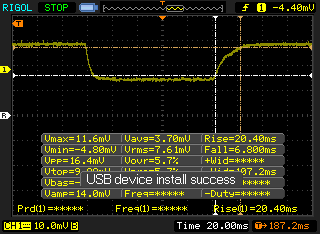 |
| ↘ 6.8 ms hösten | ||
| Skärmen visar relativt långsamma svarsfrekvenser i våra tester och kan vara för långsam för spelare. I jämförelse sträcker sig alla testade enheter från 0.1 (minst) till 240 (maximalt) ms. » 69 % av alla enheter är bättre. Detta innebär att den uppmätta svarstiden är sämre än genomsnittet av alla testade enheter (19.8 ms). | ||
| ↔ Svarstid 50 % grått till 80 % grått | ||
| 33.6 ms ... stiga ↗ och falla ↘ kombinerat | ↗ 20.4 ms stiga | 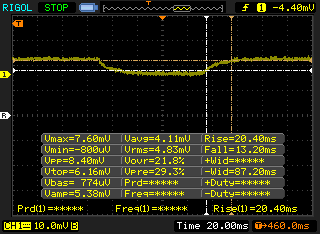 |
| ↘ 13.2 ms hösten | ||
| Skärmen visar långsamma svarsfrekvenser i våra tester och kommer att vara otillfredsställande för spelare. I jämförelse sträcker sig alla testade enheter från 0.165 (minst) till 636 (maximalt) ms. » 46 % av alla enheter är bättre. Det betyder att den uppmätta svarstiden liknar genomsnittet av alla testade enheter (31 ms). | ||
Skärmflimmer / PWM (Puls-Width Modulation)
| Skärmflimmer / PWM upptäckt | 25000 Hz | ≤ 24 % ljusstyrka inställning | 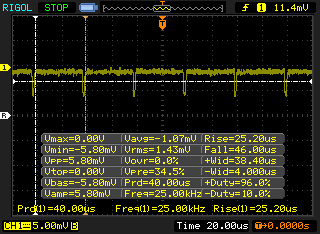 |
Displayens bakgrundsbelysning flimrar vid 25000 Hz (i värsta fall, t.ex. med PWM) Flimrande upptäckt vid en ljusstyrkeinställning på 24 % och lägre. Det ska inte finnas något flimmer eller PWM över denna ljusstyrkeinställning. Frekvensen för 25000 Hz är ganska hög, så de flesta användare som är känsliga för PWM bör inte märka något flimmer. Som jämförelse: 52 % av alla testade enheter använder inte PWM för att dämpa skärmen. Om PWM upptäcktes mättes ett medelvärde av 7754 (minst: 5 - maximum: 343500) Hz. | |||
| Cinebench R15 | |
| CPU Single 64Bit | |
| Huawei Matebook E | |
| Apple MacBook 12 (Early 2016) 1.1 GHz | |
| Apple MacBook 12 (Early 2016) 1.1 GHz | |
| Apple MacBook Air 11 inch 2015-03 | |
| Acer Swift 1 SF114-32-P8GG | |
| Lenovo Flex 6-11IGM | |
| Asus VivoBook Flip 12 TP203NAH-BP049T | |
| Acer TravelMate Spin B1 118-RN-P6BE | |
| Lenovo Ideapad 120s-11IAP | |
| HP Pavilion x360 11t T5M27AV | |
| CPU Multi 64Bit | |
| Huawei Matebook E | |
| Apple MacBook Air 11 inch 2015-03 | |
| Acer Swift 1 SF114-32-P8GG | |
| Apple MacBook 12 (Early 2016) 1.1 GHz | |
| Asus VivoBook Flip 12 TP203NAH-BP049T | |
| Lenovo Flex 6-11IGM | |
| Acer TravelMate Spin B1 118-RN-P6BE | |
| HP Pavilion x360 11t T5M27AV | |
| Lenovo Ideapad 120s-11IAP | |
| Cinebench R11.5 | |
| CPU Single 64Bit | |
| Apple MacBook Air 11 inch 2015-03 | |
| Apple MacBook 12 (Early 2016) 1.1 GHz | |
| Apple MacBook 12 (Early 2016) 1.1 GHz | |
| Acer Swift 1 SF114-32-P8GG | |
| Lenovo Flex 6-11IGM | |
| Lenovo Ideapad 120s-11IAP | |
| HP Pavilion x360 11t T5M27AV | |
| CPU Multi 64Bit | |
| Acer Swift 1 SF114-32-P8GG | |
| Apple MacBook Air 11 inch 2015-03 | |
| Apple MacBook 12 (Early 2016) 1.1 GHz | |
| Apple MacBook 12 (Early 2016) 1.1 GHz | |
| Lenovo Flex 6-11IGM | |
| HP Pavilion x360 11t T5M27AV | |
| Lenovo Ideapad 120s-11IAP | |
| PCMark 8 - Home Score Accelerated v2 | |
| Huawei Matebook E | |
| Apple MacBook 12 (Early 2016) 1.1 GHz | |
| Asus VivoBook Flip 12 TP203NAH-BP049T | |
| Lenovo Flex 6-11IGM | |
| Acer TravelMate Spin B1 118-RN-P6BE | |
| Lenovo Ideapad 120s-11IAP | |
| HP Pavilion x360 11t T5M27AV | |
| PCMark 10 - Score | |
| Lenovo Flex 6-11IGM | |
| Acer TravelMate Spin B1 118-RN-P6BE | |
| Lenovo Ideapad 120s-11IAP | |
| PCMark 8 Home Score Accelerated v2 | 2040 poäng | |
| PCMark 10 Score | 1438 poäng | |
Hjälp | ||
| Lenovo Flex 6-11IGM SanDisk DF4064 | Lenovo Ideapad 120s-11IAP 64 GB eMMC Flash | Lenovo Yoga 730-13IKB-81CT Toshiba XG5 KXG50ZNV256G | HP Pavilion 17z 1EX13AV Avolusion MD1TBLSSHD | Genomsnitt SanDisk DF4064 | |
|---|---|---|---|---|---|
| CrystalDiskMark 5.2 / 6 | -22% | 800% | -68% | -13% | |
| Write 4K (MB/s) | 14.29 | 12.19 -15% | 148.5 939% | 1.322 -91% | 12.7 ? -11% |
| Read 4K (MB/s) | 13.12 | 6.61 -50% | 27.48 109% | 0.545 -96% | 9.18 ? -30% |
| Write Seq (MB/s) | 117.9 | 108.2 -8% | 395.5 235% | 89.1 -24% | 108 ? -8% |
| Read Seq (MB/s) | 295.7 | 167.1 -43% | 1967 565% | 91.4 -69% | 219 ? -26% |
| Write 4K Q32T1 (MB/s) | 13.82 | 15.38 11% | 345 2396% | 1.239 -91% | 14.8 ? 7% |
| Read 4K Q32T1 (MB/s) | 37.36 | 31.28 -16% | 377.9 912% | 1.548 -96% | 34.3 ? -8% |
| Write Seq Q32T1 (MB/s) | 105.5 | 96.2 -9% | 425.5 303% | 90.3 -14% | 101 ? -4% |
| Read Seq Q32T1 (MB/s) | 240.7 | 134.1 -44% | 2500 939% | 88.3 -63% | 184.6 ? -23% |

| 3DMark 11 | |
| 1280x720 Performance GPU | |
| Apple MacBook Air 11 inch 2015-03 | |
| Apple MacBook 12 (Early 2016) 1.1 GHz | |
| Asus VivoBook Flip 12 TP203NAH-BP049T | |
| Lenovo Flex 6-11IGM | |
| Lenovo Ideapad 120s-11IAP | |
| Acer TravelMate Spin B1 118-RN-P6BE | |
| HP Pavilion x360 11t T5M27AV | |
| 1280x720 Performance Combined | |
| Apple MacBook Air 11 inch 2015-03 | |
| Apple MacBook 12 (Early 2016) 1.1 GHz | |
| Lenovo Flex 6-11IGM | |
| Lenovo Ideapad 120s-11IAP | |
| Asus VivoBook Flip 12 TP203NAH-BP049T | |
| HP Pavilion x360 11t T5M27AV | |
| Acer TravelMate Spin B1 118-RN-P6BE | |
| 3DMark 11 Performance | 572 poäng | |
Hjälp | ||
| låg | med. | hög | ultra | |
|---|---|---|---|---|
| BioShock Infinite (2013) | 19.9 | 9.2 |
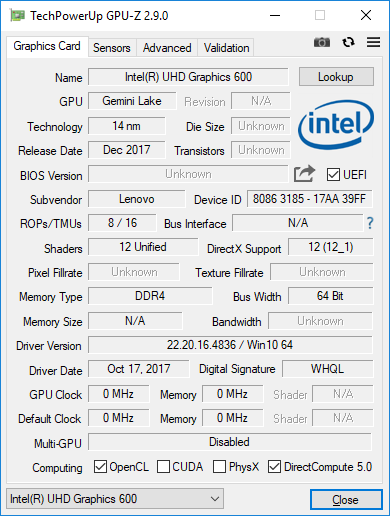
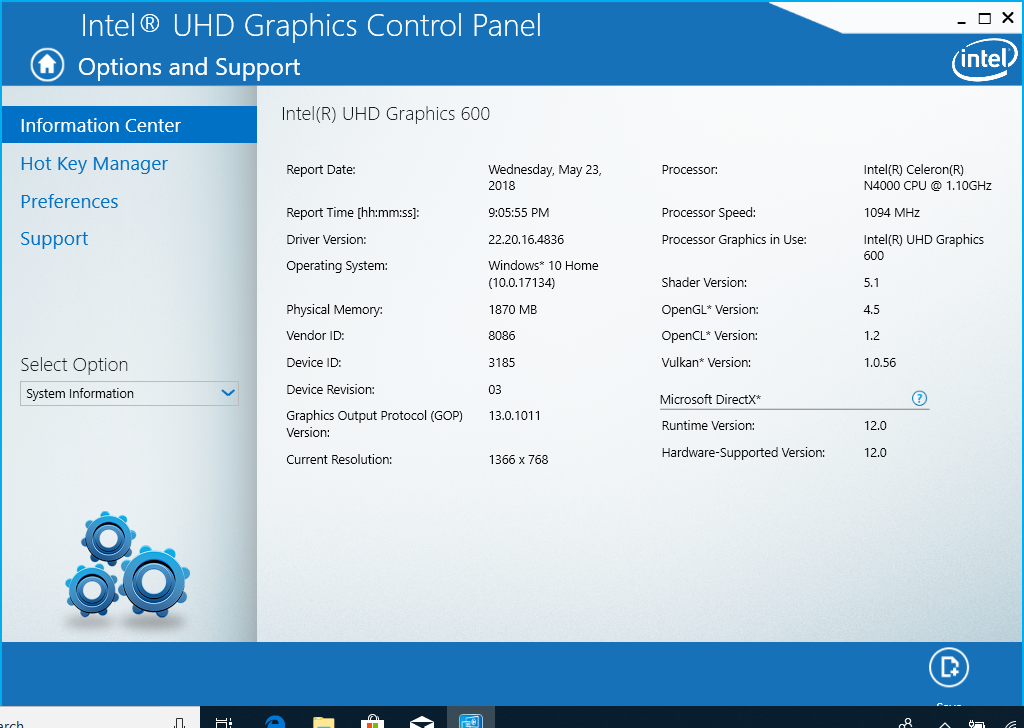
| Lenovo Flex 6-11IGM UHD Graphics 600, Celeron N4000, SanDisk DF4064 | Apple MacBook Air 11 inch 2015-03 HD Graphics 6000, 5250U, Apple SSD SM0128F | Lenovo Ideapad 120s-11IAP HD Graphics 500, Celeron N3350, 64 GB eMMC Flash | HP Pavilion x360 11t T5M27AV HD Graphics 405 (Braswell), N3710, Toshiba MQ01ABF050 | Asus VivoBook Flip 12 TP203NAH-BP049T HD Graphics 505, Pentium N4200, Seagate Mobile HDD 1TB ST1000LM035 | Acer TravelMate Spin B1 118-RN-P6BE HD Graphics 505, Pentium N4200, SK Hynix HFS256G39TND-N210A | Apple MacBook 12 (Early 2016) 1.1 GHz HD Graphics 515, 6Y30, Apple SSD AP0256 | |
|---|---|---|---|---|---|---|---|
| Noise | |||||||
| Idle Minimum * (dB) | 29 | 31.7 | |||||
| Idle Average * (dB) | 29 | 31.7 | |||||
| Idle Maximum * (dB) | 29 | 31.7 | |||||
| Load Average * (dB) | 35.2 | 31.7 | |||||
| Load Maximum * (dB) | 43.1 | 31.7 | |||||
| av / miljö * (dB) | 30.8 |
* ... mindre är bättre
(+) Den maximala temperaturen på ovansidan är 38.4 °C / 101 F, jämfört med genomsnittet av 35.9 °C / 97 F , allt från 21.4 till 59 °C för klassen Subnotebook.
(±) Botten värms upp till maximalt 44.8 °C / 113 F, jämfört med genomsnittet av 39.2 °C / 103 F
(+) Vid tomgångsbruk är medeltemperaturen för ovansidan 22.4 °C / 72 F, jämfört med enhetsgenomsnittet på 30.8 °C / ### class_avg_f### F.
(+) Handledsstöden och pekplattan är kallare än hudtemperaturen med maximalt 31.8 °C / 89.2 F och är därför svala att ta på.
(-) Medeltemperaturen för handledsstödsområdet på liknande enheter var 28.2 °C / 82.8 F (-3.6 °C / -6.4 F).
| Av/Standby | |
| Låg belastning | |
| Hög belastning |
|
Förklaring:
min: | |
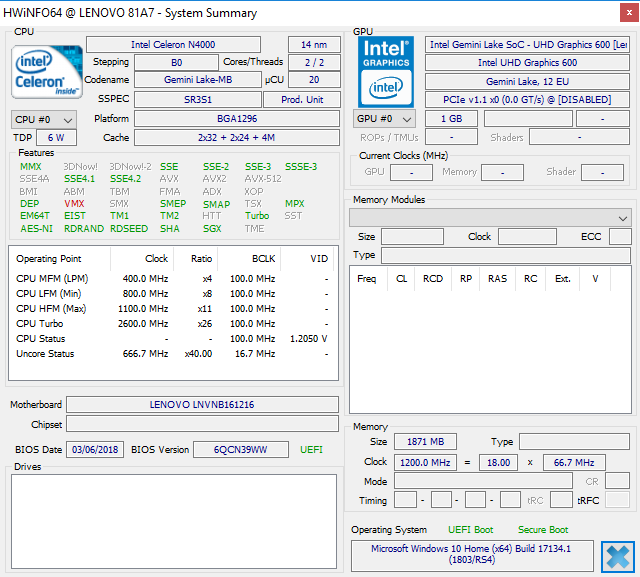
| Lenovo Flex 6-11IGM Celeron N4000, UHD Graphics 600, SanDisk DF4064, TN LED, 1366x768, 11.6" | Apple MacBook Air 11 inch 2015-03 5250U, HD Graphics 6000, Apple SSD SM0128F, TN, 1366x768, 11" | Lenovo Ideapad 120s-11IAP Celeron N3350, HD Graphics 500, 64 GB eMMC Flash, TN LED, 1366x768, 11.6" | HP Pavilion x360 11t T5M27AV N3710, HD Graphics 405 (Braswell), Toshiba MQ01ABF050, IPS, 1366x768, 11.6" | Asus VivoBook Flip 12 TP203NAH-BP049T Pentium N4200, HD Graphics 505, Seagate Mobile HDD 1TB ST1000LM035, IPS, 1366x768, 11.6" | Acer TravelMate Spin B1 118-RN-P6BE Pentium N4200, HD Graphics 505, SK Hynix HFS256G39TND-N210A, IPS LED, 1920x1080, 11.6" | |
|---|---|---|---|---|---|---|
| Power Consumption | -60% | 14% | -66% | -57% | -23% | |
| Idle Minimum * (Watt) | 2.7 | 2.5 7% | 2.8 -4% | 7.7 -185% | 5.7 -111% | 3.25 -20% |
| Idle Average * (Watt) | 4.5 | 5.1 -13% | 4.2 7% | 8.4 -87% | 7.8 -73% | 6.1 -36% |
| Idle Maximum * (Watt) | 5.7 | 6.1 -7% | 5.1 11% | 9.4 -65% | 8.7 -53% | 6.8 -19% |
| Load Average * (Watt) | 13.7 | 37.6 -174% | 11.8 14% | 14.7 -7% | 21 -53% | 15.1 -10% |
| Load Maximum * (Watt) | 20.3 | 43.4 -114% | 12.1 40% | 17.3 15% | 19 6% | 26.3 -30% |
* ... mindre är bättre
| Lenovo Flex 6-11IGM Celeron N4000, UHD Graphics 600, 36 Wh | Apple MacBook Air 11 inch 2015-03 5250U, HD Graphics 6000, 38 Wh | Lenovo Ideapad 120s-11IAP Celeron N3350, HD Graphics 500, 32 Wh | HP Pavilion x360 11t T5M27AV N3710, HD Graphics 405 (Braswell), 34.6 Wh | Asus VivoBook Flip 12 TP203NAH-BP049T Pentium N4200, HD Graphics 505, 42 Wh | Acer TravelMate Spin B1 118-RN-P6BE Pentium N4200, HD Graphics 505, 48 Wh | Apple MacBook 12 (Early 2016) 1.1 GHz 6Y30, HD Graphics 515, 41.4 Wh | |
|---|---|---|---|---|---|---|---|
| Batteridrifttid | -2% | -17% | -47% | -30% | -33% | -3% | |
| WiFi v1.3 (h) | 8.7 | 8.5 -2% | 7.2 -17% | 4.6 -47% | 6.1 -30% | 5.8 -33% | 8.4 -3% |
| Load (h) | 1.5 | 3.8 | 2.5 | 3.9 | |||
| Reader / Idle (h) | 15.3 | 7.5 |
För
Emot
Läs den fullständiga versionen av den här recensionen på engelska här.
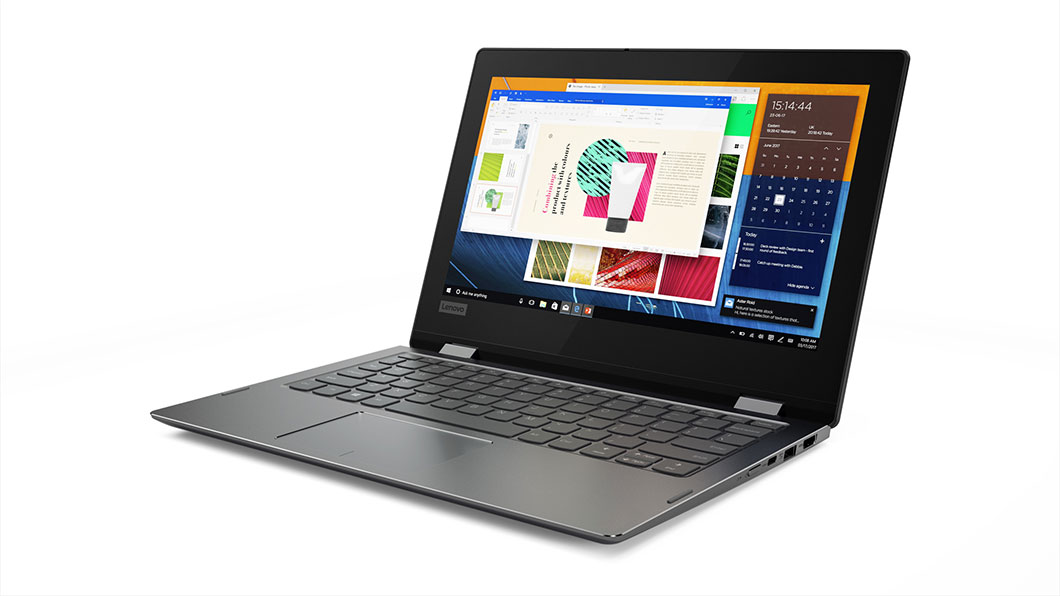
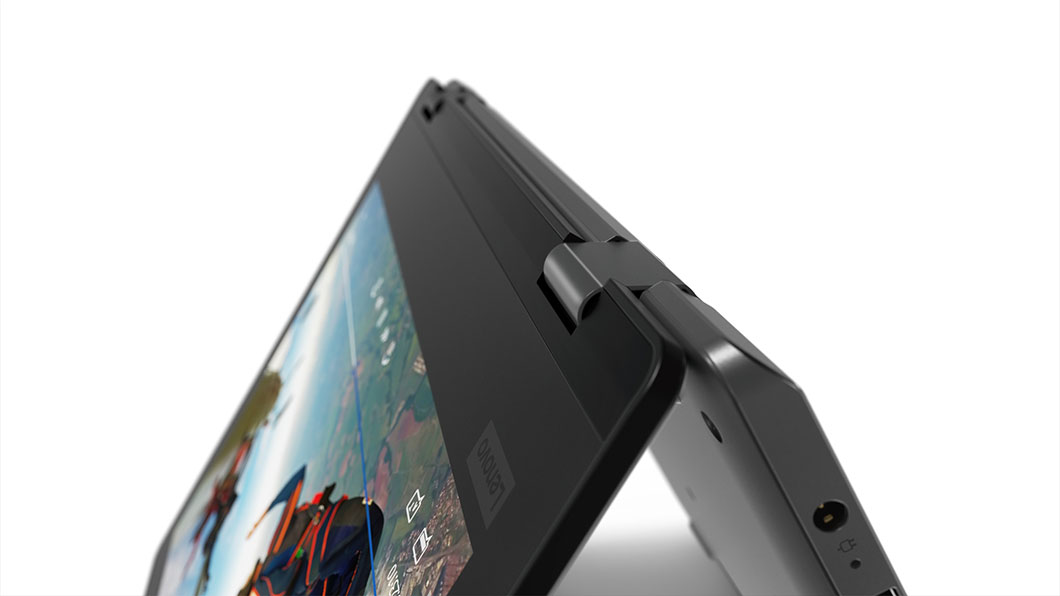
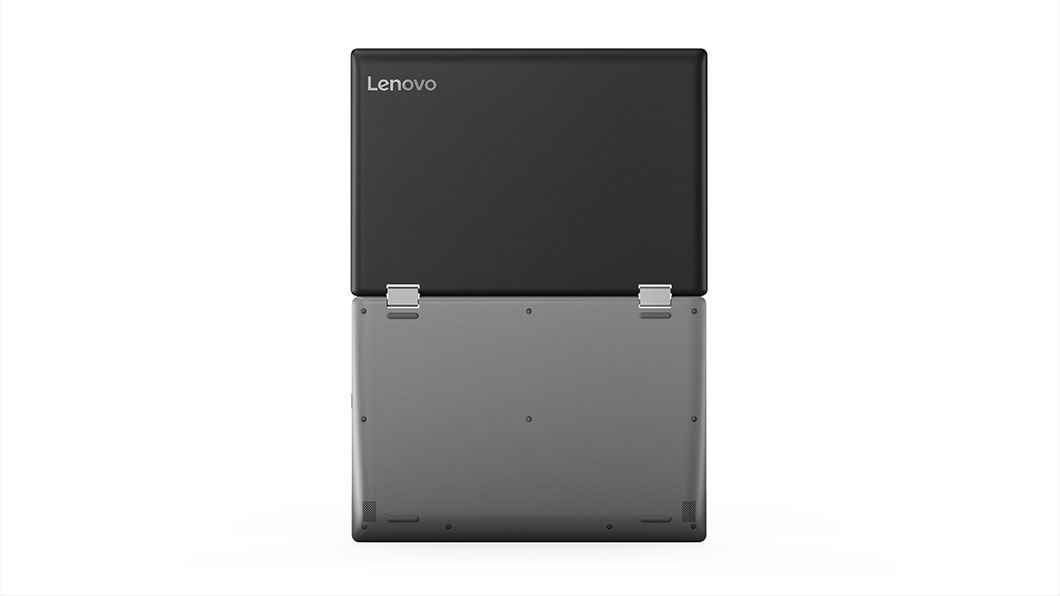
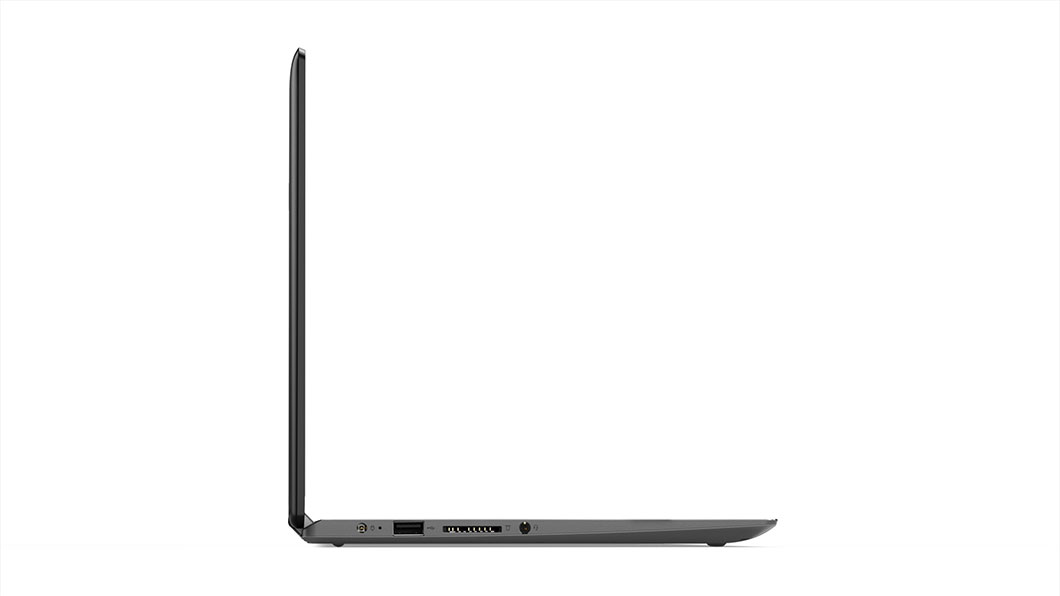
När vi tittar på netbook-modeller för under 2 500 kronor förväntar vi oss att dom ska vara pålitliga och mångsidiga ersättningar för användarens primära laptop eller PC. Flex 6 11 passar detta ändamål perfekt med sin relativt starka konstruktion, långa batteritid, respektabla antal portar och mångsidiga 2-i-1 formfaktor.
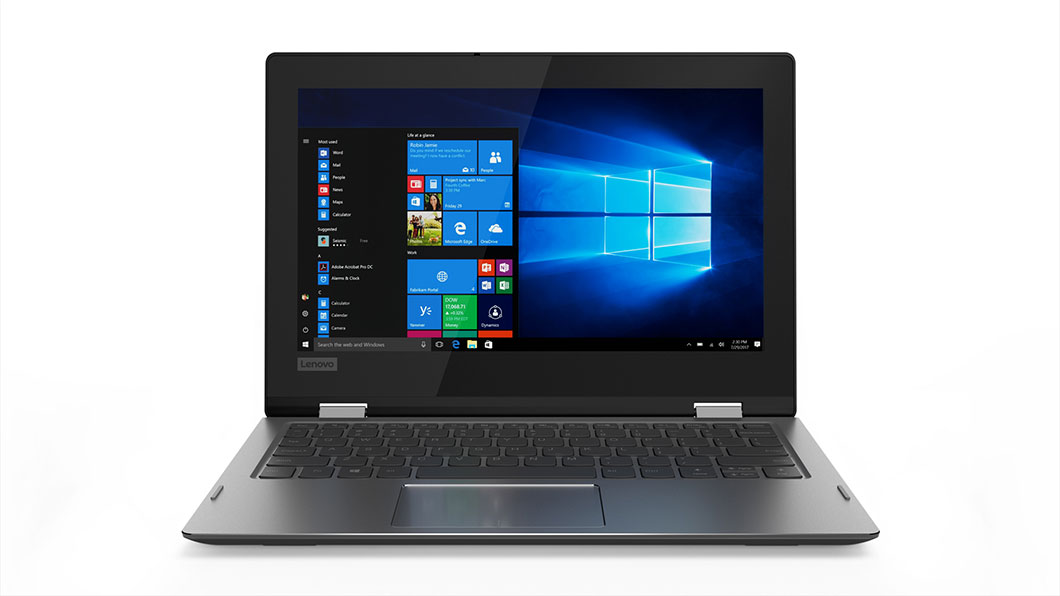
Den huvudsakliga nackdelen som hindrar oss från att fullt ut rekommendera Flex 6 11 är dess TN-skärm på 768p. Dom begränsade betraktningsvinklarna begränsar 2-i-1 förmågan då färger och kontrast påverkas allvarligt i surfplatteläge. Till och med den konkurrerande HP Pavilion x360 11 levereras med en IPS-panel på 768p som helt undviker detta problem. Det är förbryllande att det inte finns några IPS-alternativ för denna Lenovo-modell, särskilt då nästan varje billig Android-surfplatta är utrustad med en IPS-skärm.
Vi hoppas att framtida revideringar kommer att ha ett bakgrundsbelyst tangentbord, en mer ljusstark skärm, bättre Turbo Boost-prestanda, SIM som tillval, tunnare infattning för att reducera vikten och en IPS-panel som standard.
Flex 6 11 fungerar bra som en sekundär laptop för multimedia och lätt ordbehandling. Tyvärr så gör den TN-panel vi blir påtvingade på grund av kostnadsbesparingar att surfplatteläget nästan blir oanvändbart i praktiken.
Lenovo Flex 6-11IGM
- 05/29/2018 v6 (old)
Allen Ngo
Price comparison
