Test: Huawei Y5 2018 Smartphone (Sammanfattning)
| Networking | |
| iperf3 transmit AX12 | |
| Xiaomi Mi A1 | |
| Sony Xperia L1 | |
| Umidigi A1 Pro | |
| Huawei Y5 2018 | |
| Lenovo Moto E4 Plus | |
| iperf3 receive AX12 | |
| Xiaomi Mi A1 | |
| Sony Xperia L1 | |
| Umidigi A1 Pro | |
| Huawei Y5 2018 | |
| Lenovo Moto E4 Plus | |


| |||||||||||||||||||||||||
Distribution av ljusstyrkan: 91 %
Mitt på batteriet: 475 cd/m²
Kontrast: 625:1 (Svärta: 0.76 cd/m²)
ΔE ColorChecker Calman: 9.12 | ∀{0.5-29.43 Ø4.73}
ΔE Greyscale Calman: 12 | ∀{0.09-98 Ø4.97}
96.4% sRGB (Calman 2D)
Gamma: 2.342
CCT: 9861 K
| Huawei Y5 2018 IPS, 1440x720, 5.5" | Lenovo Moto E4 Plus IPS, 1280x720, 5.5" | Sony Xperia L1 IPS, 1280x720, 5.5" | Umidigi A1 Pro IPS, 1440x720, 5.5" | Xiaomi Mi A1 IPS, 1920x1080, 5.5" | |
|---|---|---|---|---|---|
| Screen | 35% | 30% | 65% | 43% | |
| Brightness middle (cd/m²) | 475 | 425 -11% | 479 1% | 594 25% | 503 6% |
| Brightness (cd/m²) | 470 | 425 -10% | 478 2% | 570 21% | 478 2% |
| Brightness Distribution (%) | 91 | 93 2% | 94 3% | 86 -5% | 88 -3% |
| Black Level * (cd/m²) | 0.76 | 0.37 51% | 0.58 24% | 0.22 71% | 0.37 51% |
| Contrast (:1) | 625 | 1149 84% | 826 32% | 2700 332% | 1359 117% |
| Colorchecker dE 2000 * | 9.12 | 4.7 48% | 4.5 51% | 6.63 27% | 3.92 57% |
| Colorchecker dE 2000 max. * | 18.86 | 8.3 56% | 7.5 60% | 13.99 26% | 7.86 58% |
| Greyscale dE 2000 * | 12 | 4.6 62% | 4.1 66% | 9.2 23% | 4.9 59% |
| Gamma | 2.342 94% | 2.17 101% | 2.03 108% | 2.24 98% | 2.223 99% |
| CCT | 9861 66% | 7445 87% | 7139 91% | 8663 75% | 7884 82% |
* ... mindre är bättre
Skärmflimmer / PWM (Puls-Width Modulation)
| Skärmflimmer / PWM upptäckt | 166.7 Hz | ≤ 25 % ljusstyrka inställning | 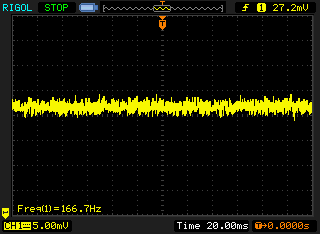 |
Displayens bakgrundsbelysning flimrar vid 166.7 Hz (i värsta fall, t.ex. med PWM) Flimrande upptäckt vid en ljusstyrkeinställning på 25 % och lägre. Det ska inte finnas något flimmer eller PWM över denna ljusstyrkeinställning. Frekvensen för 166.7 Hz är relativt låg, så känsliga användare kommer sannolikt att märka flimmer och uppleva ansträngda ögon vid den angivna ljusstyrkeinställningen och nedan. Som jämförelse: 52 % av alla testade enheter använder inte PWM för att dämpa skärmen. Om PWM upptäcktes mättes ett medelvärde av 7798 (minst: 5 - maximum: 343500) Hz. | |||
Visa svarstider
| ↔ Svarstid svart till vitt | ||
|---|---|---|
| 18 ms ... stiga ↗ och falla ↘ kombinerat | ↗ 7 ms stiga | 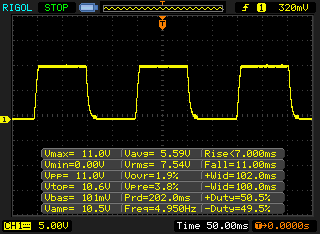 |
| ↘ 11 ms hösten | ||
| Skärmen visar bra svarsfrekvens i våra tester, men kan vara för långsam för konkurrenskraftiga spelare. I jämförelse sträcker sig alla testade enheter från 0.1 (minst) till 240 (maximalt) ms. » 40 % av alla enheter är bättre. Det betyder att den uppmätta svarstiden liknar genomsnittet av alla testade enheter (19.9 ms). | ||
| ↔ Svarstid 50 % grått till 80 % grått | ||
| 41 ms ... stiga ↗ och falla ↘ kombinerat | ↗ 22 ms stiga | 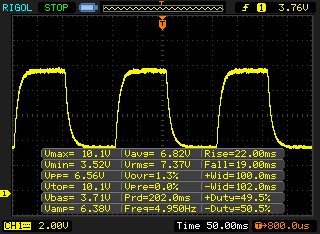 |
| ↘ 19 ms hösten | ||
| Skärmen visar långsamma svarsfrekvenser i våra tester och kommer att vara otillfredsställande för spelare. I jämförelse sträcker sig alla testade enheter från 0.165 (minst) till 636 (maximalt) ms. » 65 % av alla enheter är bättre. Detta innebär att den uppmätta svarstiden är sämre än genomsnittet av alla testade enheter (31.1 ms). | ||
| AnTuTu v6 - Total Score (sortera efter värde) | |
| Huawei Y5 2018 | |
| Lenovo Moto E4 Plus | |
| Sony Xperia L1 | |
| Umidigi A1 Pro | |
| Xiaomi Mi A1 | |
| Genomsnitt Mediatek MT6739 (25012 - 38060, n=13) | |
| AnTuTu v7 - Total Score (sortera efter värde) | |
| Huawei Y5 2018 | |
| Umidigi A1 Pro | |
| Xiaomi Mi A1 | |
| Genomsnitt Mediatek MT6739 (26874 - 46951, n=13) | |
| PCMark for Android | |
| Work performance score (sortera efter värde) | |
| Huawei Y5 2018 | |
| Lenovo Moto E4 Plus | |
| Sony Xperia L1 | |
| Umidigi A1 Pro | |
| Xiaomi Mi A1 | |
| Genomsnitt Mediatek MT6739 (3742 - 5136, n=11) | |
| Work 2.0 performance score (sortera efter värde) | |
| Huawei Y5 2018 | |
| Lenovo Moto E4 Plus | |
| Sony Xperia L1 | |
| Umidigi A1 Pro | |
| Xiaomi Mi A1 | |
| Genomsnitt Mediatek MT6739 (2467 - 5377, n=16) | |
| JetStream 1.1 - 1.1 Total | |
| Xiaomi Mi A1 | |
| Umidigi A1 Pro (Chrome 66) | |
| Huawei Y5 2018 (Chrome 67) | |
| Sony Xperia L1 (Chrome 59) | |
| Genomsnitt Mediatek MT6739 (13.4 - 18.5, n=14) | |
| Lenovo Moto E4 Plus (Chrome 60) | |
| Octane V2 - Total Score | |
| Genomsnitt av klass Smartphone (2800 - 126661, n=157, senaste 2 åren) | |
| Xiaomi Mi A1 | |
| Umidigi A1 Pro (Chrome 66) | |
| Huawei Y5 2018 (Chrome 67) | |
| Genomsnitt Mediatek MT6739 (2093 - 3386, n=15) | |
| Sony Xperia L1 (Chrome 59) | |
| Lenovo Moto E4 Plus (Chrome 60) | |
| Mozilla Kraken 1.1 - Total | |
| Lenovo Moto E4 Plus (Chrome 60) | |
| Huawei Y5 2018 (Chrome 67) | |
| Genomsnitt Mediatek MT6739 (13599 - 18154, n=16) | |
| Umidigi A1 Pro (Chrome 66) | |
| Sony Xperia L1 (Chrome 59) | |
| Xiaomi Mi A1 | |
| Genomsnitt av klass Smartphone (257 - 28190, n=135, senaste 2 åren) | |
* ... mindre är bättre
| Huawei Y5 2018 | Lenovo Moto E4 Plus | Sony Xperia L1 | Umidigi A1 Pro | Xiaomi Mi A1 | Genomsnitt 16 GB eMMC Flash | Genomsnitt av klass Smartphone | |
|---|---|---|---|---|---|---|---|
| AndroBench 3-5 | 4% | -45% | -7% | 65% | -31% | 2106% | |
| Sequential Read 256KB (MB/s) | 245.3 | 194.4 -21% | 181.9 -26% | 269.2 10% | 277.4 13% | 164.5 ? -33% | 2251 ? 818% |
| Sequential Write 256KB (MB/s) | 47.8 | 42 -12% | 40.2 -16% | 44.4 -7% | 202.4 323% | 43 ? -10% | 1932 ? 3942% |
| Random Read 4KB (MB/s) | 39 | 19.15 -51% | 13.6 -65% | 29.6 -24% | 78.1 100% | 21.7 ? -44% | 310 ? 695% |
| Random Write 4KB (MB/s) | 11.8 | 29.4 149% | 5.9 -50% | 10.2 -14% | 7.19 -39% | 8.08 ? -32% | 362 ? 2968% |
| Sequential Read 256KB SDCard (MB/s) | 81.7 ? | 66.3 -19% | 37.81 ? -54% | 81 ? -1% | 83.6 2% | 59.1 ? -28% | |
| Sequential Write 256KB SDCard (MB/s) | 62.3 ? | 46.6 -25% | 26.25 ? -58% | 58.8 ? -6% | 57.9 -7% | 39.8 ? -36% |
(+) Den maximala temperaturen på ovansidan är 37.1 °C / 99 F, jämfört med genomsnittet av 35.3 °C / 96 F , allt från 21.9 till 247 °C för klassen Smartphone.
(+) Botten värms upp till maximalt 37.7 °C / 100 F, jämfört med genomsnittet av 34 °C / 93 F
(+) Vid tomgångsbruk är medeltemperaturen för ovansidan 31 °C / 88 F, jämfört med enhetsgenomsnittet på 32.9 °C / ### class_avg_f### F.
Huawei Y5 2018 ljudanalys
(-) | inte särskilt höga högtalare (63.6 dB)
Bas 100 - 315 Hz
(-) | nästan ingen bas - i genomsnitt 21.8% lägre än medianen
(+) | basen är linjär (6.2% delta till föregående frekvens)
Mellan 400 - 2000 Hz
(±) | högre mellan - i genomsnitt 6% högre än median
(±) | linjäriteten för mids är genomsnittlig (11.9% delta till föregående frekvens)
Högsta 2 - 16 kHz
(+) | balanserade toppar - endast 3.4% från medianen
(+) | toppar är linjära (5.9% delta till föregående frekvens)
Totalt 100 - 16 000 Hz
(±) | linjäriteten för det totala ljudet är genomsnittlig (27.8% skillnad mot median)
Jämfört med samma klass
» 73% av alla testade enheter i den här klassen var bättre, 5% liknande, 23% sämre
» Den bästa hade ett delta på 11%, genomsnittet var 34%, sämst var 134%
Jämfört med alla testade enheter
» 84% av alla testade enheter var bättre, 3% liknande, 13% sämre
» Den bästa hade ett delta på 4%, genomsnittet var 24%, sämst var 134%
Xiaomi Mi A1 ljudanalys
(+) | högtalare kan spela relativt högt (86.2 dB)
Bas 100 - 315 Hz
(-) | nästan ingen bas - i genomsnitt 29.7% lägre än medianen
(±) | linjäriteten för basen är genomsnittlig (11.2% delta till föregående frekvens)
Mellan 400 - 2000 Hz
(+) | balanserad mellan - endast 3.2% från medianen
(+) | mids är linjära (5.2% delta till föregående frekvens)
Högsta 2 - 16 kHz
(+) | balanserade toppar - endast 3.2% från medianen
(+) | toppar är linjära (3.1% delta till föregående frekvens)
Totalt 100 - 16 000 Hz
(±) | linjäriteten för det totala ljudet är genomsnittlig (19.2% skillnad mot median)
Jämfört med samma klass
» 26% av alla testade enheter i den här klassen var bättre, 9% liknande, 66% sämre
» Den bästa hade ett delta på 11%, genomsnittet var 34%, sämst var 134%
Jämfört med alla testade enheter
» 46% av alla testade enheter var bättre, 7% liknande, 47% sämre
» Den bästa hade ett delta på 4%, genomsnittet var 24%, sämst var 134%
| Av/Standby | |
| Låg belastning | |
| Hög belastning |
|
Förklaring:
min: | |
| Huawei Y5 2018 3020 mAh | Lenovo Moto E4 Plus 5000 mAh | Sony Xperia L1 2620 mAh | Umidigi A1 Pro 3150 mAh | Xiaomi Mi A1 3080 mAh | Genomsnitt Mediatek MT6739 | Genomsnitt av klass Smartphone | |
|---|---|---|---|---|---|---|---|
| Power Consumption | 26% | 3% | -15% | -38% | -7% | -2% | |
| Idle Minimum * (Watt) | 1.3 | 0.89 32% | 0.89 32% | 1.8 -38% | 2.2 -69% | 1.522 ? -17% | 0.875 ? 33% |
| Idle Average * (Watt) | 1.7 | 1.87 -10% | 2.05 -21% | 2.3 -35% | 2.8 -65% | 2.17 ? -28% | 1.47 ? 14% |
| Idle Maximum * (Watt) | 2.5 | 1.98 21% | 2.18 13% | 3.2 -28% | 3.4 -36% | 2.86 ? -14% | 1.659 ? 34% |
| Load Average * (Watt) | 5.5 | 3.04 45% | 6.02 -9% | 4.7 15% | 6.2 -13% | 4.73 ? 14% | 6.8 ? -24% |
| Load Maximum * (Watt) | 6.8 | 4.01 41% | 6.94 -2% | 6 12% | 7.2 -6% | 5.99 ? 12% | 11.3 ? -66% |
* ... mindre är bättre
| Huawei Y5 2018 3020 mAh | Lenovo Moto E4 Plus 5000 mAh | Sony Xperia L1 2620 mAh | Umidigi A1 Pro 3150 mAh | Xiaomi Mi A1 3080 mAh | |
|---|---|---|---|---|---|
| Batteridrifttid | 15% | -17% | -11% | -7% | |
| WiFi v1.3 (h) | 11.4 | 13.1 15% | 9.5 -17% | 10.1 -11% | 10.6 -7% |
| Reader / Idle (h) | 23.3 | ||||
| H.264 (h) | 10.9 | ||||
| Load (h) | 3.7 |
För
Emot
Läs den fullständiga versionen av den här recensionen på engelska här.
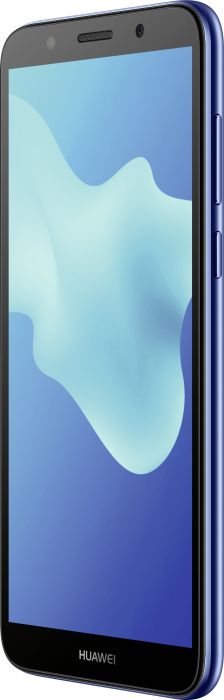
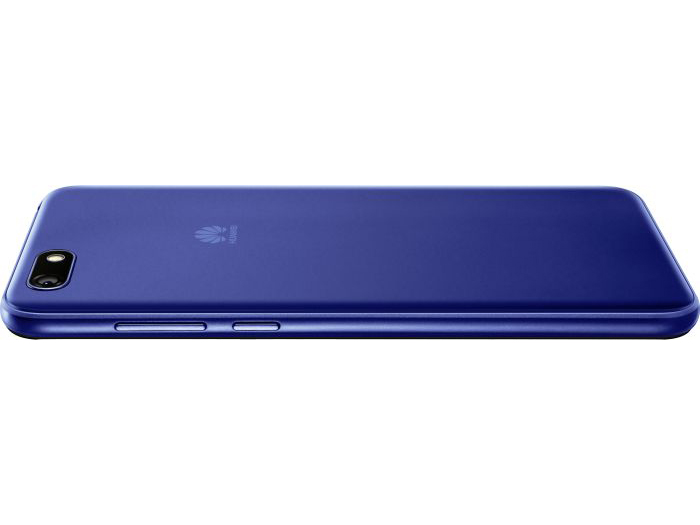
Huawei har skärt ned på alla möjliga kostnader med Huawei Y5 2018: Hörlursdelen som på samma gång tjänar som en medelmåttig högtalare, det enkla plasthöljet och avsaknaden av stöd för 5 GHz WLAN är några exempel. Men i gengäld kan man betala mindre än 1.200 kronor för en smartphone med en modern tunn infattning, bra batteritid och skapliga enkla kameror.
Lågt pris och skapliga funktioner: Huawei Y5 2018 är en budgettelefon med värdighet.
Med tanke på att innehåll och appar ofta tar tid att ladda så får man inte vara noggrann med prestandan — men totalt sett erbjuder Huawei Y5 2018 ett bra förhållande mellan pris och prestanda. Den som önskar bättre hårdvara för samma pris kan ta en titt på Umidigi A1 Pro, som stödjer 5 GHz WLAN, har en snabbladdningsfunktion och är klädd i ett tjusigt hölje. Men dessa funktioner kommer i utbyte mot aningen kortare batteritid.
Huawei Y5 2018
- 07/17/2018 v6 (old)
Florian Wimmer