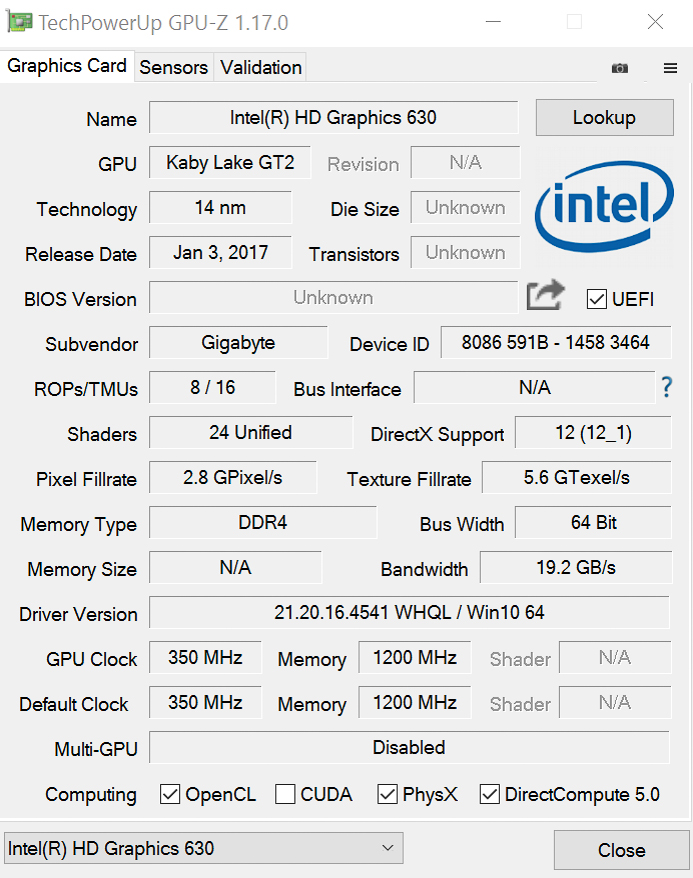
Test: Gigabyte Aero 14 (7700HQ, GTX 1060) (sammanfattning)
| SD Card Reader | |
| average JPG Copy Test (av. of 3 runs) | |
| Schenker XMG P407 | |
| Gigabyte Aero 14 | |
| MSI GS43VR 6RE-006US | |
| maximum AS SSD Seq Read Test (1GB) | |
| Schenker XMG P407 | |
| Gigabyte Aero 14 | |
| MSI GS43VR 6RE-006US | |
| Networking | |
| iperf3 transmit AX12 | |
| Razer Blade (2016) | |
| Gigabyte Aero 14 | |
| Schenker XMG P407 | |
| iperf3 receive AX12 | |
| Gigabyte Aero 14 | |
| Razer Blade (2016) | |
| Schenker XMG P407 | |
| |||||||||||||||||||||||||
Distribution av ljusstyrkan: 79 %
Mitt på batteriet: 290 cd/m²
Kontrast: 967:1 (Svärta: 0.3 cd/m²)
ΔE ColorChecker Calman: 4.59 | ∀{0.5-29.43 Ø4.71}
ΔE Greyscale Calman: 4.32 | ∀{0.09-98 Ø4.96}
92% sRGB (Argyll 1.6.3 3D)
59% AdobeRGB 1998 (Argyll 1.6.3 3D)
65.5% AdobeRGB 1998 (Argyll 3D)
91.8% sRGB (Argyll 3D)
64.4% Display P3 (Argyll 3D)
Gamma: 2.25
CCT: 7320 K
| Gigabyte Aero 14 LG Philips LP140QH1-SPF1 (LGD049A), , 2560x1440, 14" | MSI GS43VR 6RE-006US Name: LG Philips LP140WF3-SPD1, ID: LGD046D, , 1920x1080, 14" | Schenker XMG P407 LG Philips LP140WF3-SPD1 (LGD046D), , 1920x1080, 14" | Razer Blade (2016) Sharp LQ140Z1JW01 (SHP1401), , 3200x1800, 14" | |
|---|---|---|---|---|
| Display | -3% | -6% | 4% | |
| Display P3 Coverage (%) | 64.4 | 65.5 2% | 64.5 0% | 66.9 4% |
| sRGB Coverage (%) | 91.8 | 86.4 -6% | 82.1 -11% | 96.8 5% |
| AdobeRGB 1998 Coverage (%) | 65.5 | 63.1 -4% | 60 -8% | 68.2 4% |
| Response Times | 13% | -12% | -24% | |
| Response Time Grey 50% / Grey 80% * (ms) | 41 ? | 31.6 ? 23% | 47 ? -15% | 41 ? -0% |
| Response Time Black / White * (ms) | 25 ? | 24.4 ? 2% | 27 ? -8% | 37 ? -48% |
| PWM Frequency (Hz) | 200 ? | |||
| Screen | 10% | 3% | 30% | |
| Brightness middle (cd/m²) | 290 | 288.4 -1% | 298 3% | 328 13% |
| Brightness (cd/m²) | 257 | 282 10% | 282 10% | 328 28% |
| Brightness Distribution (%) | 79 | 83 5% | 80 1% | 69 -13% |
| Black Level * (cd/m²) | 0.3 | 0.35 -17% | 0.27 10% | 0.22 27% |
| Contrast (:1) | 967 | 824 -15% | 1104 14% | 1491 54% |
| Colorchecker dE 2000 * | 4.59 | 2.61 43% | 4.42 4% | 1.91 58% |
| Colorchecker dE 2000 max. * | 8.68 | 7.34 15% | 8.57 1% | 3.23 63% |
| Greyscale dE 2000 * | 4.32 | 1.18 73% | 4.11 5% | 1.69 61% |
| Gamma | 2.25 98% | 2.24 98% | 2.5 88% | 2.3 96% |
| CCT | 7320 89% | 6506 100% | 6329 103% | 6418 101% |
| Color Space (Percent of AdobeRGB 1998) (%) | 59 | 56.4 -4% | 54 -8% | 63 7% |
| Color Space (Percent of sRGB) (%) | 92 | 86.4 -6% | 82 -11% | 97 5% |
| Totalt genomsnitt (program/inställningar) | 7% /
8% | -5% /
-1% | 3% /
18% |
* ... mindre är bättre
Visa svarstider
| ↔ Svarstid svart till vitt | ||
|---|---|---|
| 25 ms ... stiga ↗ och falla ↘ kombinerat | ↗ 4 ms stiga | 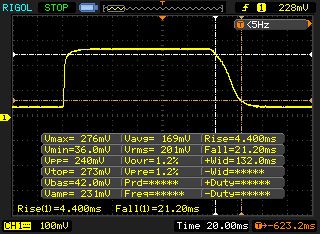 |
| ↘ 21 ms hösten | ||
| Skärmen visar relativt långsamma svarsfrekvenser i våra tester och kan vara för långsam för spelare. I jämförelse sträcker sig alla testade enheter från 0.1 (minst) till 240 (maximalt) ms. » 59 % av alla enheter är bättre. Detta innebär att den uppmätta svarstiden är sämre än genomsnittet av alla testade enheter (19.8 ms). | ||
| ↔ Svarstid 50 % grått till 80 % grått | ||
| 41 ms ... stiga ↗ och falla ↘ kombinerat | ↗ 17 ms stiga | 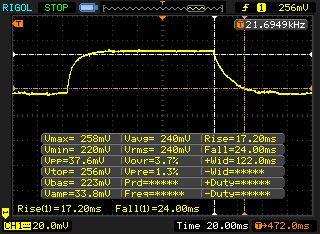 |
| ↘ 24 ms hösten | ||
| Skärmen visar långsamma svarsfrekvenser i våra tester och kommer att vara otillfredsställande för spelare. I jämförelse sträcker sig alla testade enheter från 0.165 (minst) till 636 (maximalt) ms. » 65 % av alla enheter är bättre. Detta innebär att den uppmätta svarstiden är sämre än genomsnittet av alla testade enheter (31 ms). | ||
Skärmflimmer / PWM (Puls-Width Modulation)
| Skärmflimmer / PWM upptäcktes inte | 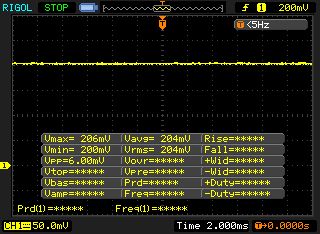 | ||
Som jämförelse: 52 % av alla testade enheter använder inte PWM för att dämpa skärmen. Om PWM upptäcktes mättes ett medelvärde av 7754 (minst: 5 - maximum: 343500) Hz. | |||
| Cinebench R15 | |
| CPU Single 64Bit | |
| Gigabyte Aero 14 | |
| Schenker XMG P407 | |
| Razer Blade (2016) | |
| MSI GS43VR 6RE-006US | |
| CPU Multi 64Bit | |
| Schenker XMG P407 | |
| Gigabyte Aero 14 | |
| MSI GS43VR 6RE-006US | |
| Razer Blade (2016) | |
| PCMark 8 | |
| Home Score Accelerated v2 | |
| Schenker XMG P407 | |
| MSI GS43VR 6RE-006US | |
| Gigabyte Aero 14 | |
| Razer Blade (2016) | |
| Work Score Accelerated v2 | |
| Schenker XMG P407 | |
| MSI GS43VR 6RE-006US | |
| Gigabyte Aero 14 | |
| Razer Blade (2016) | |
| PCMark 8 Home Score Accelerated v2 | 3717 poäng | |
| PCMark 8 Work Score Accelerated v2 | 4702 poäng | |
Hjälp | ||
| Gigabyte Aero 14 LiteOn CX2-8B256 | MSI GS43VR 6RE-006US SanDisk SD8SN8U1T001122 | Schenker XMG P407 Samsung SM961 MZVPW256 m.2 PCI-e | Razer Blade (2016) Samsung PM951 NVMe MZVLV512 | |
|---|---|---|---|---|
| CrystalDiskMark 3.0 | -68% | 19% | -12% | |
| Read Seq (MB/s) | 1584 | 335.3 -79% | 1345 -15% | 1296 -18% |
| Write Seq (MB/s) | 795 | 299 -62% | 1502 89% | 603 -24% |
| Read 512 (MB/s) | 985 | 223 -77% | 320.3 -67% | 655 -34% |
| Write 512 (MB/s) | 814 | 246.7 -70% | 1276 57% | 604 -26% |
| Read 4k (MB/s) | 44.93 | 17.68 -61% | 58.9 31% | 42.22 -6% |
| Write 4k (MB/s) | 131.2 | 35.31 -73% | 171 30% | 139.6 6% |
| Read 4k QD32 (MB/s) | 602 | 247.4 -59% | 625 4% | 573 -5% |
| Write 4k QD32 (MB/s) | 441 | 156.3 -65% | 539 22% | 480 9% |

| 3DMark - 1920x1080 Fire Strike Graphics | |
| MSI GS43VR 6RE-006US | |
| Gigabyte Aero 14 | |
| Razer Blade (2016) | |
| Schenker XMG P407 | |
| 3DMark 11 - 1280x720 Performance GPU | |
| MSI GS43VR 6RE-006US | |
| Gigabyte Aero 14 | |
| Razer Blade (2016) | |
| Schenker XMG P407 | |
| 3DMark 11 Performance | 11868 poäng | |
| 3DMark Cloud Gate Standard Score | 20574 poäng | |
| 3DMark Fire Strike Score | 9778 poäng | |
Hjälp | ||
| The Witcher 3 - 1920x1080 Ultra Graphics & Postprocessing (HBAO+) | |
| Gigabyte Aero 14 | |
| Razer Blade (2016) | |
| låg | med. | hög | ultra | |
|---|---|---|---|---|
| The Witcher 3 (2015) | 38.3 | |||
| Anno 2205 (2015) | 77.5 | 29 | ||
| The Division (2016) | 46.9 | 37.8 | ||
| For Honor (2017) | 56 () | 42 () | ||
| Ghost Recon Wildlands (2017) | 66.2 | 60.1 | 35.7 |
Ljudnivå
| Låg belastning |
| 31 / 32 / 33 dB(A) |
| Hög belastning |
| 42 / 53 dB(A) |
 | ||
30 dB tyst 40 dB(A) hörbar 50 dB(A) högt ljud |
||
min: | ||
(-) Den maximala temperaturen på ovansidan är 58.3 °C / 137 F, jämfört med genomsnittet av 36.8 °C / 98 F , allt från 21 till 71 °C för klassen Multimedia.
(-) Botten värms upp till maximalt 59.8 °C / 140 F, jämfört med genomsnittet av 39.1 °C / 102 F
(+) Vid tomgångsbruk är medeltemperaturen för ovansidan 22.9 °C / 73 F, jämfört med enhetsgenomsnittet på 31.3 °C / ### class_avg_f### F.
(-) När du spelar The Witcher 3 är medeltemperaturen för ovansidan 40.7 °C / 105 F, jämfört med enhetsgenomsnittet på 31.3 °C / ## #class_avg_f### F.
(+) Handledsstöden och pekplattan når maximal hudtemperatur (34.5 °C / 94.1 F) och är därför inte varma.
(-) Medeltemperaturen för handledsstödsområdet på liknande enheter var 28.7 °C / 83.7 F (-5.8 °C / -10.4 F).
Gigabyte Aero 14 ljudanalys
(±) | högtalarljudstyrkan är genomsnittlig men bra (79 dB)
Bas 100 - 315 Hz
(±) | reducerad bas - i genomsnitt 10.6% lägre än medianen
(±) | linjäriteten för basen är genomsnittlig (13.7% delta till föregående frekvens)
Mellan 400 - 2000 Hz
(+) | balanserad mellan - endast 3.6% från medianen
(±) | linjäriteten för mids är genomsnittlig (8% delta till föregående frekvens)
Högsta 2 - 16 kHz
(+) | balanserade toppar - endast 2.1% från medianen
(+) | toppar är linjära (5.1% delta till föregående frekvens)
Totalt 100 - 16 000 Hz
(+) | det totala ljudet är linjärt (12.8% skillnad mot median)
Jämfört med samma klass
» 24% av alla testade enheter i den här klassen var bättre, 5% liknande, 71% sämre
» Den bästa hade ett delta på 5%, genomsnittet var 17%, sämst var 45%
Jämfört med alla testade enheter
» 12% av alla testade enheter var bättre, 3% liknande, 85% sämre
» Den bästa hade ett delta på 4%, genomsnittet var 23%, sämst var 134%
Razer Blade (2016) ljudanalys
(±) | högtalarljudstyrkan är genomsnittlig men bra (79 dB)
Bas 100 - 315 Hz
(±) | reducerad bas - i genomsnitt 8.4% lägre än medianen
(±) | linjäriteten för basen är genomsnittlig (11.2% delta till föregående frekvens)
Mellan 400 - 2000 Hz
(+) | balanserad mellan - endast 4.6% från medianen
(+) | mids är linjära (4.3% delta till föregående frekvens)
Högsta 2 - 16 kHz
(+) | balanserade toppar - endast 4.3% från medianen
(+) | toppar är linjära (5.5% delta till föregående frekvens)
Totalt 100 - 16 000 Hz
(±) | linjäriteten för det totala ljudet är genomsnittlig (17.1% skillnad mot median)
Jämfört med samma klass
» 46% av alla testade enheter i den här klassen var bättre, 12% liknande, 43% sämre
» Den bästa hade ett delta på 6%, genomsnittet var 18%, sämst var 132%
Jämfört med alla testade enheter
» 31% av alla testade enheter var bättre, 8% liknande, 61% sämre
» Den bästa hade ett delta på 4%, genomsnittet var 23%, sämst var 134%
MSI GS43VR 6RE-006US ljudanalys
(±) | högtalarljudstyrkan är genomsnittlig men bra (76.7 dB)
Bas 100 - 315 Hz
(-) | nästan ingen bas - i genomsnitt 17.5% lägre än medianen
(±) | linjäriteten för basen är genomsnittlig (12% delta till föregående frekvens)
Mellan 400 - 2000 Hz
(+) | balanserad mellan - endast 3.9% från medianen
(±) | linjäriteten för mids är genomsnittlig (9.5% delta till föregående frekvens)
Högsta 2 - 16 kHz
(±) | högre toppar - i genomsnitt 6.4% högre än medianen
(±) | linjäriteten för toppar är genomsnittlig (8.5% delta till föregående frekvens)
Totalt 100 - 16 000 Hz
(±) | linjäriteten för det totala ljudet är genomsnittlig (28.9% skillnad mot median)
Jämfört med samma klass
» 95% av alla testade enheter i den här klassen var bättre, 2% liknande, 4% sämre
» Den bästa hade ett delta på 6%, genomsnittet var 18%, sämst var 132%
Jämfört med alla testade enheter
» 87% av alla testade enheter var bättre, 2% liknande, 11% sämre
» Den bästa hade ett delta på 4%, genomsnittet var 23%, sämst var 134%
Schenker XMG P407 ljudanalys
(±) | högtalarljudstyrkan är genomsnittlig men bra (78 dB)
Bas 100 - 315 Hz
(-) | nästan ingen bas - i genomsnitt 19.2% lägre än medianen
(±) | linjäriteten för basen är genomsnittlig (11% delta till föregående frekvens)
Mellan 400 - 2000 Hz
(+) | balanserad mellan - endast 4.4% från medianen
(±) | linjäriteten för mids är genomsnittlig (9.6% delta till föregående frekvens)
Högsta 2 - 16 kHz
(+) | balanserade toppar - endast 3.7% från medianen
(+) | toppar är linjära (5.5% delta till föregående frekvens)
Totalt 100 - 16 000 Hz
(±) | linjäriteten för det totala ljudet är genomsnittlig (20.5% skillnad mot median)
Jämfört med samma klass
» 73% av alla testade enheter i den här klassen var bättre, 5% liknande, 22% sämre
» Den bästa hade ett delta på 6%, genomsnittet var 18%, sämst var 132%
Jämfört med alla testade enheter
» 54% av alla testade enheter var bättre, 8% liknande, 38% sämre
» Den bästa hade ett delta på 4%, genomsnittet var 23%, sämst var 134%
| Av/Standby | |
| Låg belastning | |
| Hög belastning |
|
Förklaring:
min: | |
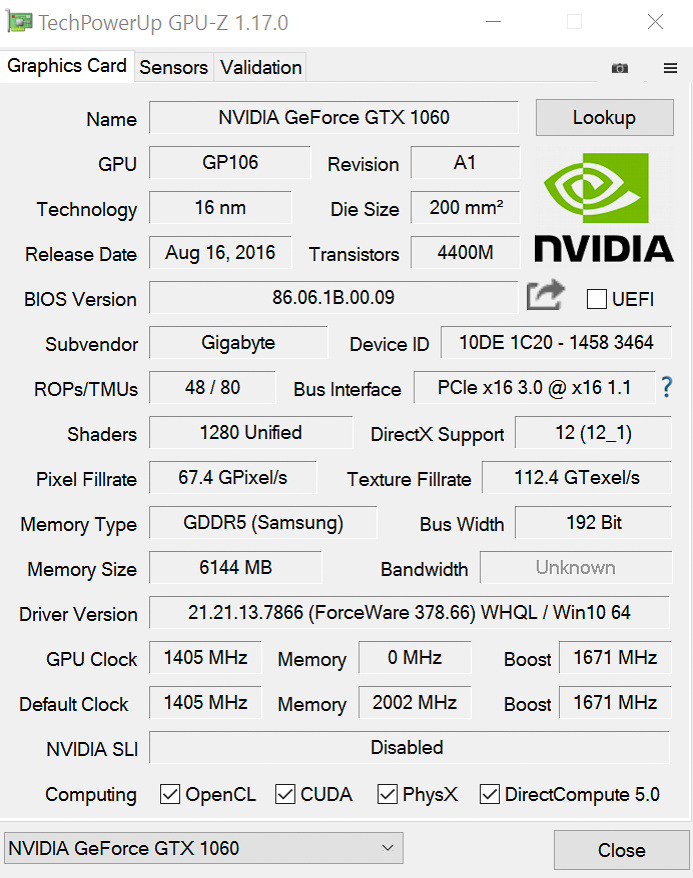
| Gigabyte Aero 14 i7-7700HQ, GeForce GTX 1060 Mobile | MSI GS43VR 6RE-006US 6700HQ, GeForce GTX 1060 Mobile | Schenker XMG P407 i7-7700HQ, GeForce GTX 1050 Ti Mobile | Razer Blade (2016) 6700HQ, GeForce GTX 1060 Mobile | |
|---|---|---|---|---|
| Power Consumption | -28% | -10% | -2% | |
| Idle Minimum * (Watt) | 8 | 12.1 -51% | 10 -25% | 9 -13% |
| Idle Average * (Watt) | 13 | 19 -46% | 15 -15% | 14 -8% |
| Idle Maximum * (Watt) | 20 | 19.5 2% | 24 -20% | 22 -10% |
| Load Average * (Watt) | 78 | 106.7 -37% | 82 -5% | 72 8% |
| Witcher 3 ultra * (Watt) | 110 | |||
| Load Maximum * (Watt) | 146 | 159 -9% | 124 15% | 124 15% |
* ... mindre är bättre
| Gigabyte Aero 14 i7-7700HQ, GeForce GTX 1060 Mobile, 94 Wh | MSI GS43VR 6RE-006US 6700HQ, GeForce GTX 1060 Mobile, 61 Wh | Schenker XMG P407 i7-7700HQ, GeForce GTX 1050 Ti Mobile, 45 Wh | Razer Blade (2016) 6700HQ, GeForce GTX 1060 Mobile, 70 Wh | |
|---|---|---|---|---|
| Batteridrifttid | -42% | -46% | -53% | |
| Reader / Idle (h) | 15.2 | 9.6 -37% | 7.4 -51% | |
| WiFi v1.3 (h) | 8.7 | 4.4 -49% | 4 -54% | 4.1 -53% |
| Load (h) | 2.2 | 1.3 -41% | 1.5 -32% | |
| H.264 (h) | 3.6 |
För
Emot
Läs originaltestet på engelska här.
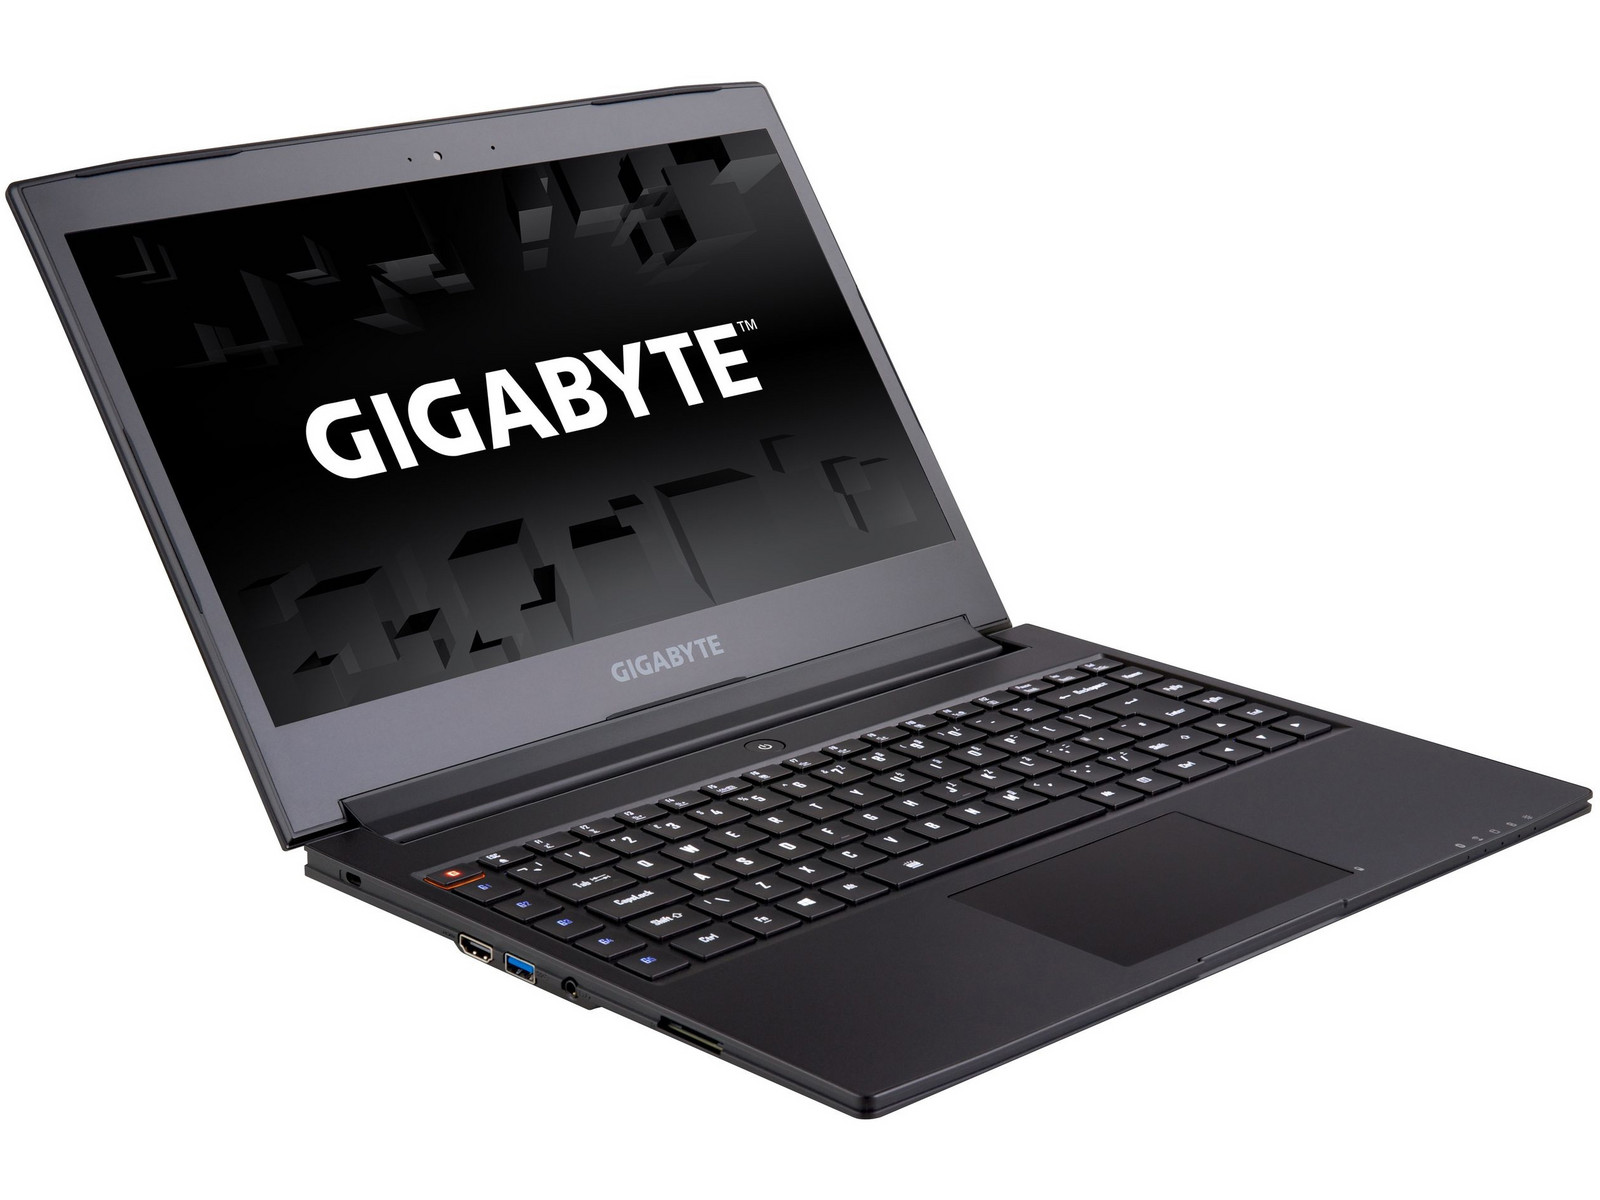
Allt är inte frid och fröjd med Aero 14, men de punkter som får kritik är förmodligen mindre relevanta för målgruppen. Men att fläkten väsnas konstant under medelhög belastning är irriterande.
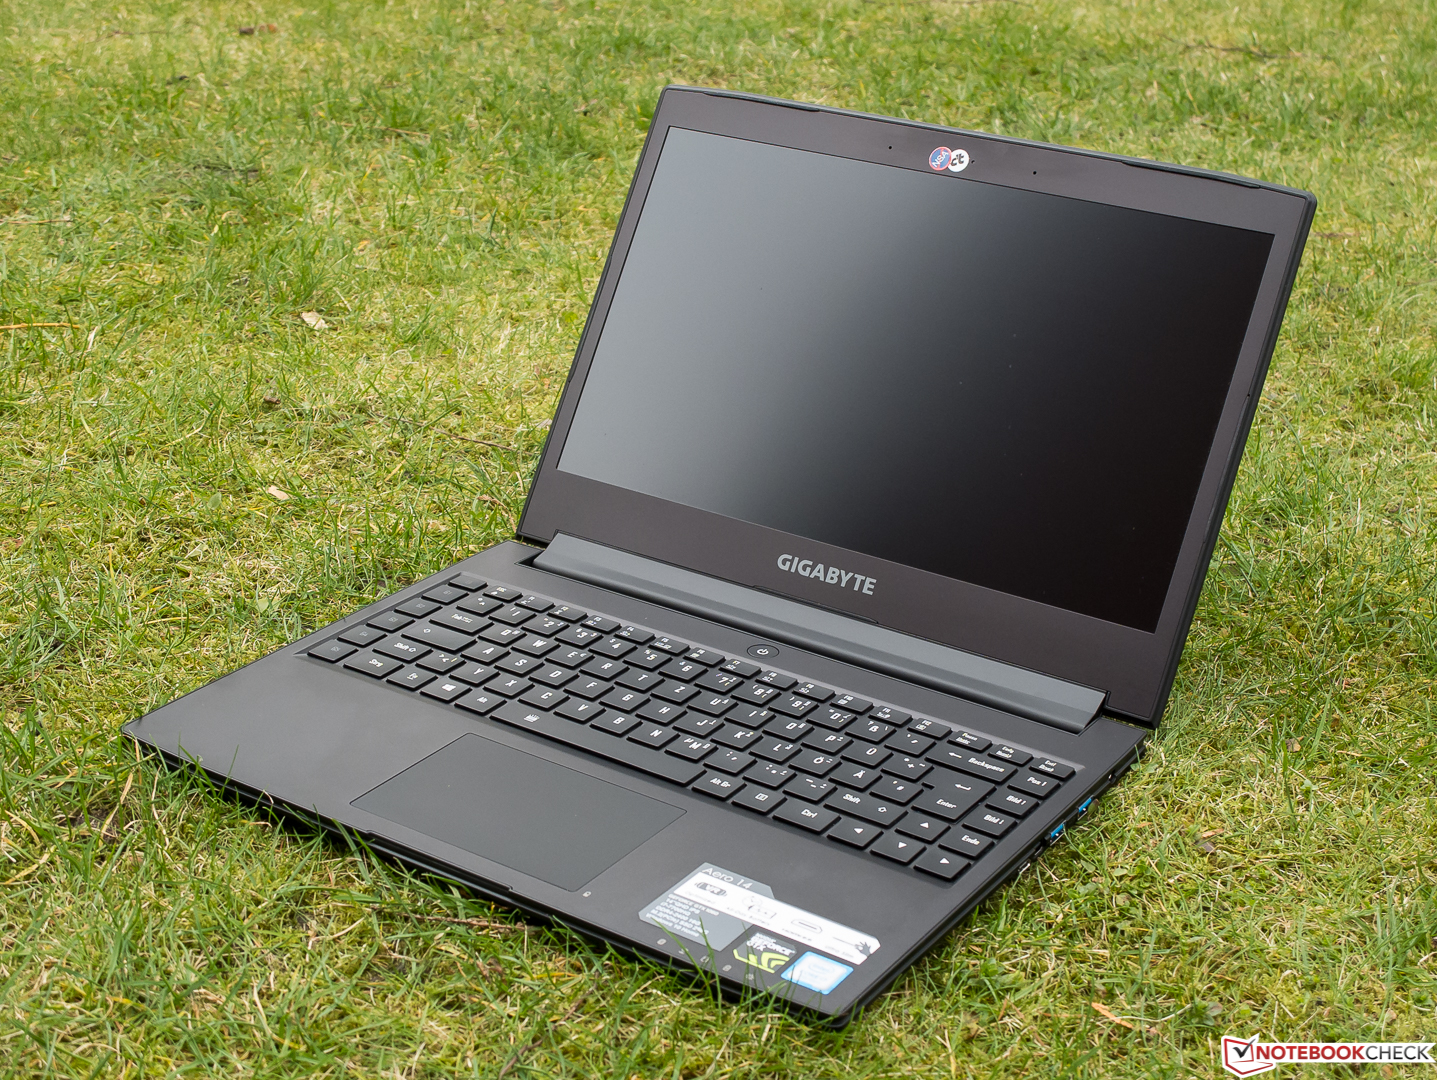
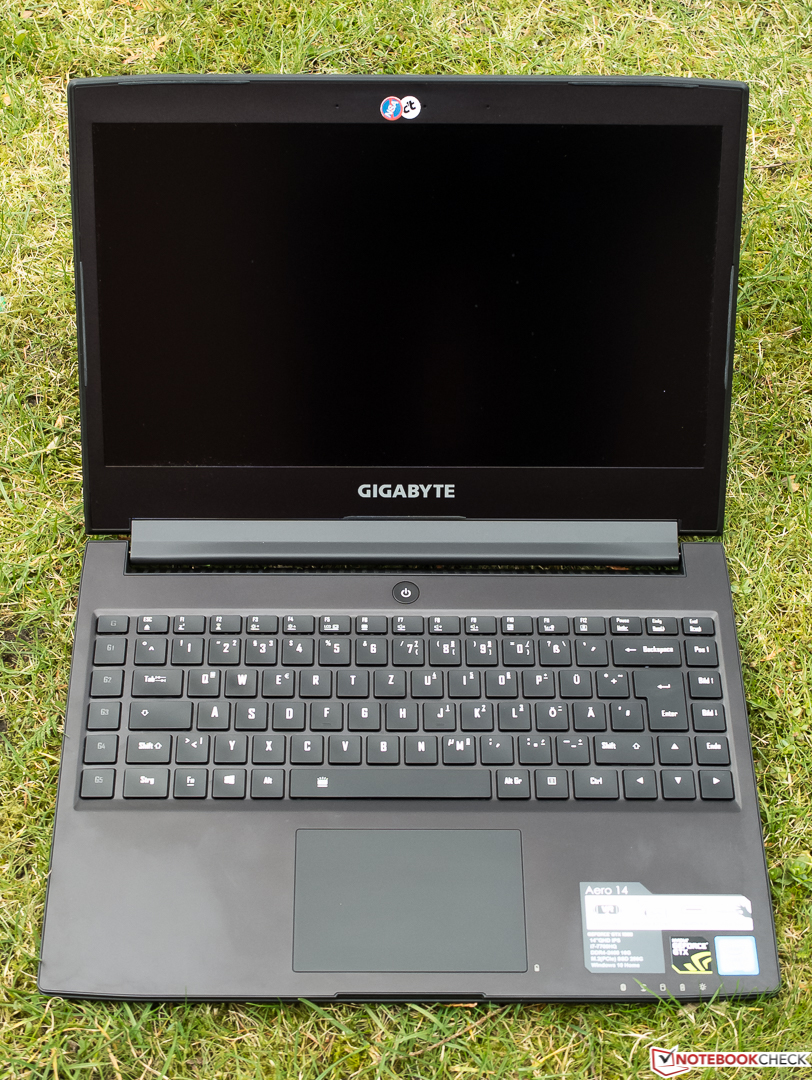
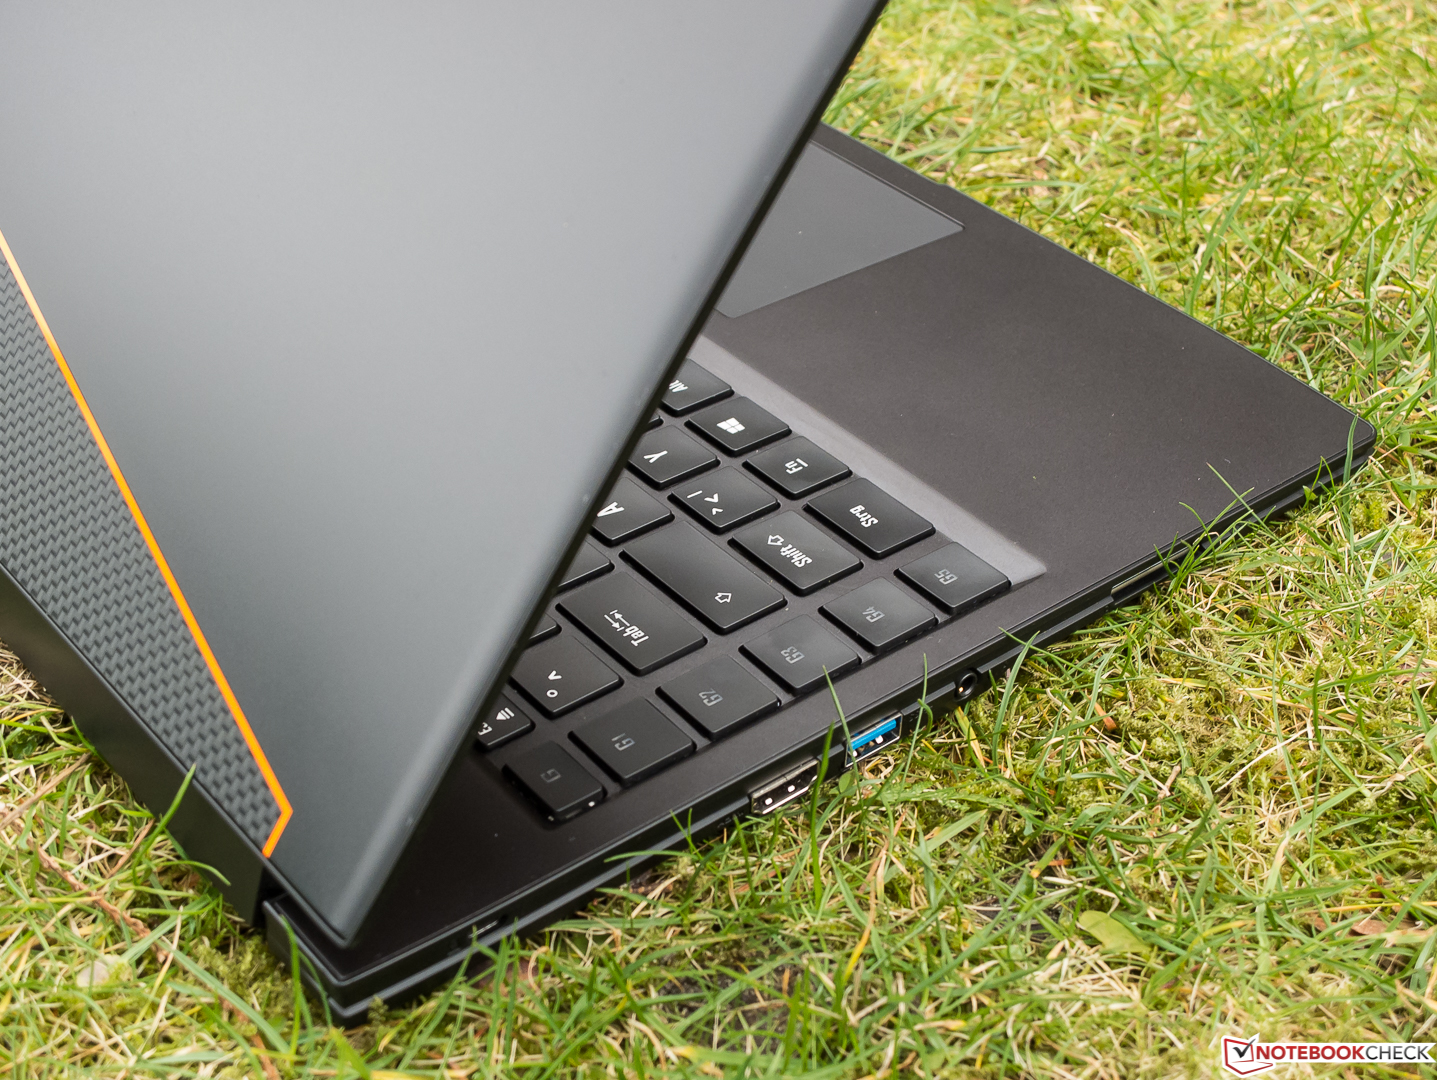
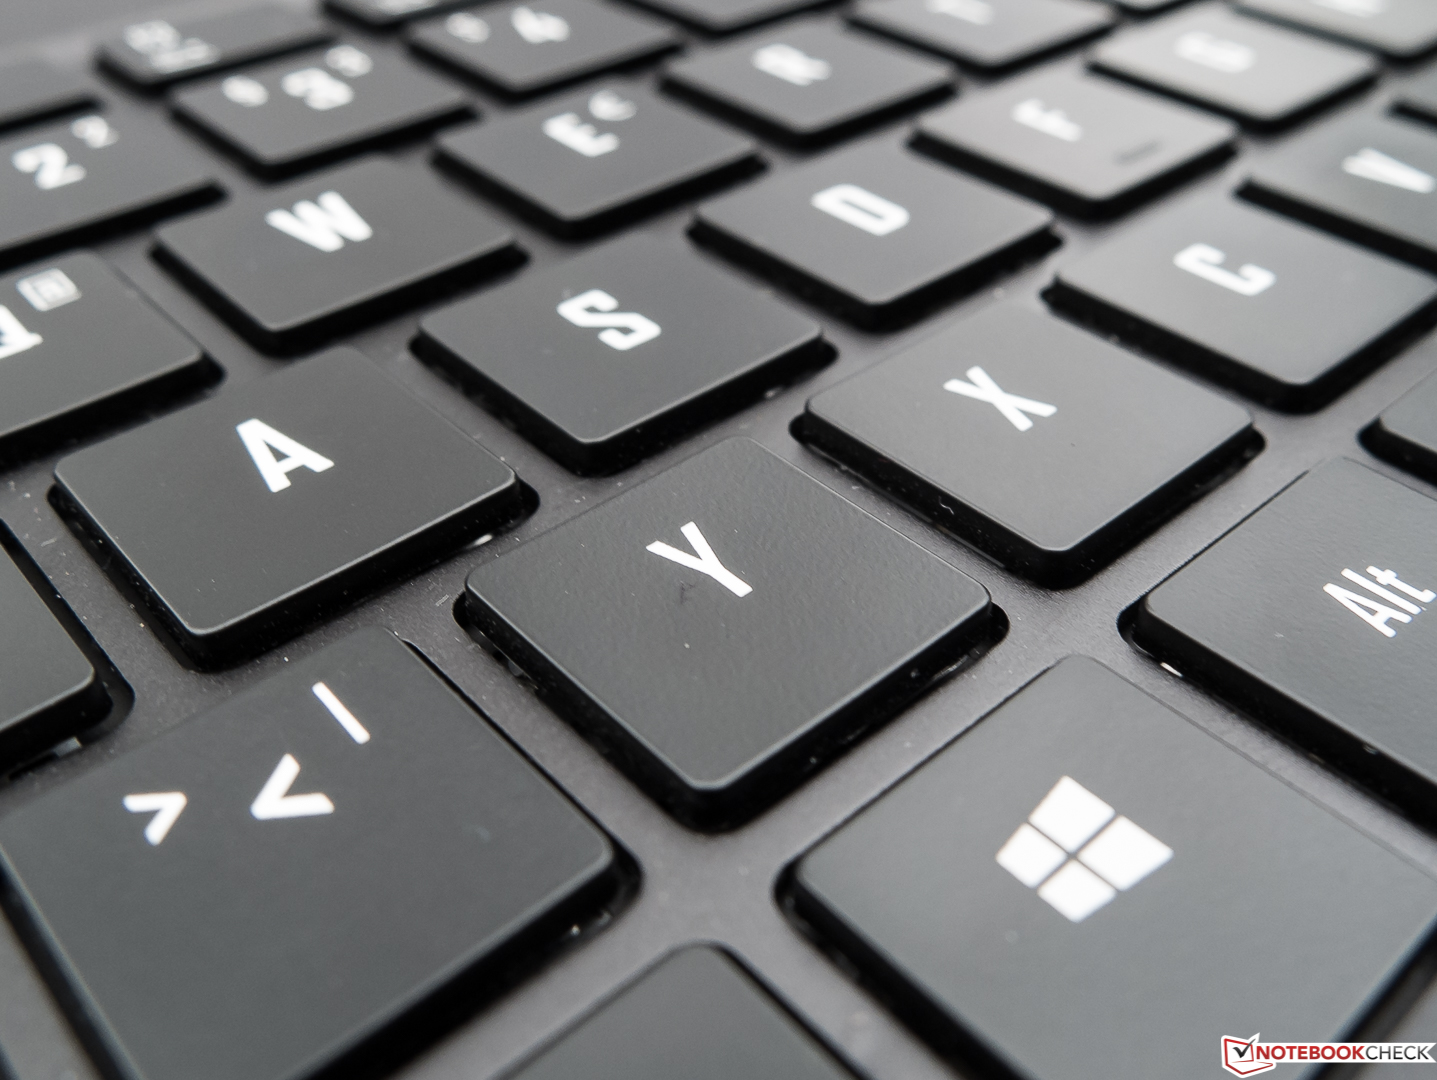
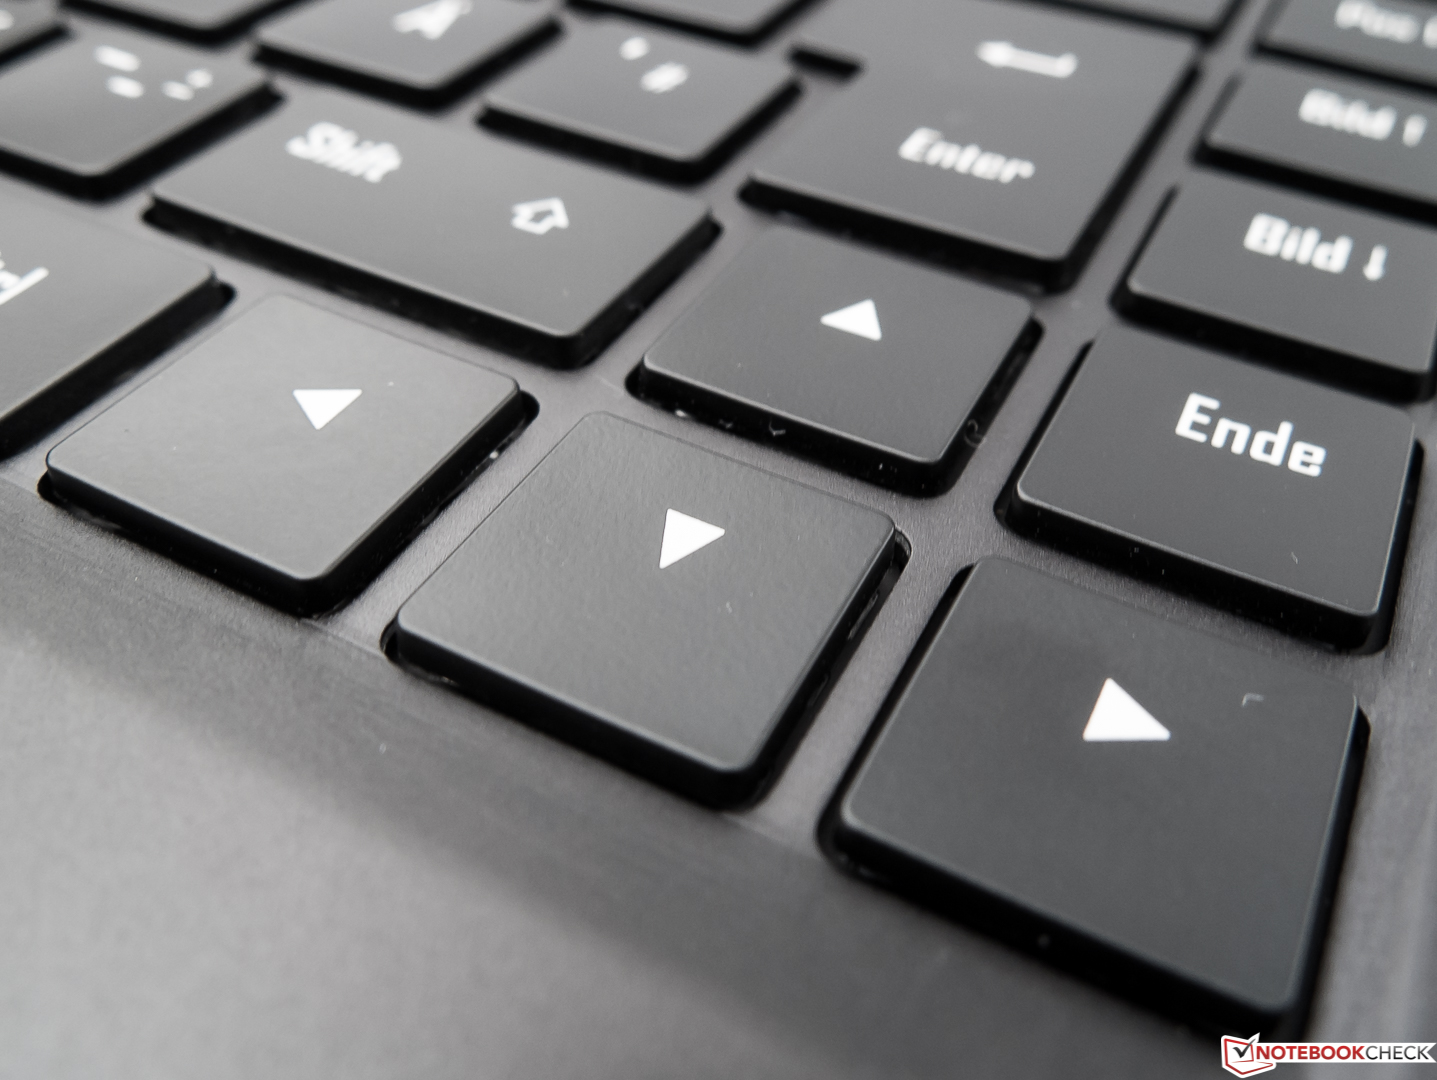
Utöver det gjorde Aero 14 ett mycket bra helhetsintryck. Trots det massiva batteriet är aluminiumchassit kompakt och lätt. Även om tangentbordslayouten inte är standard är den tydligt utformad med spel i åtanke (makrotangenter) – tangentbordet är anständigt även för kontorsarbete. Datorn har också fler portar än man kan önska sig, inklusive en USB-Ethernet-adapter som följer med i lådan. Vi har heller inga klagomål vad gäller prestandan.
Gigabyte Aero 14
- 06/30/2017 v6 (old)
Sven Kloevekorn
Price comparison
