Test: CUBOT R11 Smartphone (Sammanfattning)

| Networking | |
| iperf3 transmit AX12 | |
| Cubot R11 | |
| Nokia 1 | |
| Xiaomi Redmi 5A | |
| Lenovo Moto E4 | |
| Blackview A20 | |
| iperf3 receive AX12 | |
| Cubot R11 | |
| Nokia 1 | |
| Xiaomi Redmi 5A | |
| Blackview A20 | |
| Lenovo Moto E4 | |


| |||||||||||||||||||||||||
Distribution av ljusstyrkan: 72 %
Mitt på batteriet: 428 cd/m²
Kontrast: 486:1 (Svärta: 0.88 cd/m²)
ΔE ColorChecker Calman: 6.29 | ∀{0.5-29.43 Ø4.71}
ΔE Greyscale Calman: 6.9 | ∀{0.09-98 Ø4.96}
89.7% sRGB (Calman 2D)
Gamma: 2.718
CCT: 7296 K
| Cubot R11 IPS, 1440x720, 5.5" | Blackview A20 IPS, 960x480, 5.5" | Xiaomi Redmi 5A IPS, 1280x720, 5" | Lenovo Moto E4 IPS, 1280x720, 5" | Nokia 1 IPS, 854x480, 4.5" | |
|---|---|---|---|---|---|
| Screen | -18% | 20% | 53% | 54% | |
| Brightness middle (cd/m²) | 428 | 364 -15% | 503 18% | 488 14% | 256 -40% |
| Brightness (cd/m²) | 401 | 375 -6% | 499 24% | 474 18% | 251 -37% |
| Brightness Distribution (%) | 72 | 90 25% | 84 17% | 87 21% | 89 24% |
| Black Level * (cd/m²) | 0.88 | 0.71 19% | 0.73 17% | 0.3 66% | 0.12 86% |
| Contrast (:1) | 486 | 513 6% | 689 42% | 1627 235% | 2133 339% |
| Colorchecker dE 2000 * | 6.29 | 10.12 -61% | 5.44 14% | 5.4 14% | 4.82 23% |
| Colorchecker dE 2000 max. * | 13.2 | 19.63 -49% | 10.01 24% | 9 32% | 11.75 11% |
| Greyscale dE 2000 * | 6.9 | 11.1 -61% | 6.8 1% | 5.5 20% | 5.2 25% |
| Gamma | 2.718 81% | 2.722 81% | 2.451 90% | 2.27 97% | 2.3 96% |
| CCT | 7296 89% | 10121 64% | 6590 99% | 7397 88% | 7107 91% |
* ... mindre är bättre
Skärmflimmer / PWM (Puls-Width Modulation)
| Skärmflimmer / PWM upptäcktes inte | 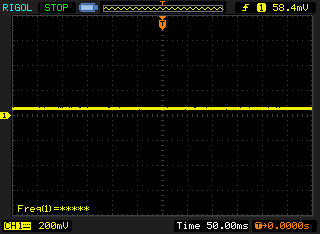 | ||
Som jämförelse: 52 % av alla testade enheter använder inte PWM för att dämpa skärmen. Om PWM upptäcktes mättes ett medelvärde av 7757 (minst: 5 - maximum: 343500) Hz. | |||
Visa svarstider
| ↔ Svarstid svart till vitt | ||
|---|---|---|
| 28 ms ... stiga ↗ och falla ↘ kombinerat | ↗ 15 ms stiga | 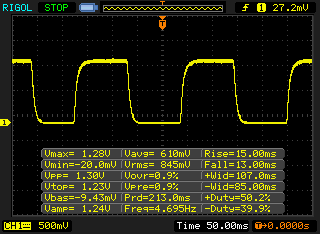 |
| ↘ 13 ms hösten | ||
| Skärmen visar relativt långsamma svarsfrekvenser i våra tester och kan vara för långsam för spelare. I jämförelse sträcker sig alla testade enheter från 0.1 (minst) till 240 (maximalt) ms. » 71 % av alla enheter är bättre. Detta innebär att den uppmätta svarstiden är sämre än genomsnittet av alla testade enheter (19.8 ms). | ||
| ↔ Svarstid 50 % grått till 80 % grått | ||
| 42 ms ... stiga ↗ och falla ↘ kombinerat | ↗ 21 ms stiga | 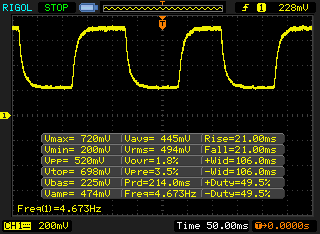 |
| ↘ 21 ms hösten | ||
| Skärmen visar långsamma svarsfrekvenser i våra tester och kommer att vara otillfredsställande för spelare. I jämförelse sträcker sig alla testade enheter från 0.165 (minst) till 636 (maximalt) ms. » 67 % av alla enheter är bättre. Detta innebär att den uppmätta svarstiden är sämre än genomsnittet av alla testade enheter (31 ms). | ||
| AnTuTu v6 - Total Score (sortera efter värde) | |
| Cubot R11 | |
| Blackview A20 | |
| Xiaomi Redmi 5A | |
| Lenovo Moto E4 | |
| Nokia 1 | |
| Genomsnitt Mediatek MT6580M (15185 - 25237, n=10) | |
| AnTuTu v7 - Total Score (sortera efter värde) | |
| Cubot R11 | |
| Blackview A20 | |
| Xiaomi Redmi 5A | |
| Nokia 1 | |
| Genomsnitt Mediatek MT6580M (17073 - 21088, n=4) | |
| PCMark for Android - Work performance score (sortera efter värde) | |
| Cubot R11 | |
| Blackview A20 | |
| Xiaomi Redmi 5A | |
| Lenovo Moto E4 | |
| Nokia 1 | |
| Genomsnitt Mediatek MT6580M (2516 - 3041, n=12) | |
| 3DMark | |
| 1280x720 offscreen Ice Storm Unlimited Score (sortera efter värde) | |
| Cubot R11 | |
| Blackview A20 | |
| Xiaomi Redmi 5A | |
| Lenovo Moto E4 | |
| Genomsnitt Mediatek MT6580M (2841 - 2946, n=12) | |
| 1280x720 offscreen Ice Storm Unlimited Graphics Score (sortera efter värde) | |
| Cubot R11 | |
| Blackview A20 | |
| Xiaomi Redmi 5A | |
| Lenovo Moto E4 | |
| Genomsnitt Mediatek MT6580M (2396 - 2485, n=12) | |
| 1280x720 offscreen Ice Storm Unlimited Physics (sortera efter värde) | |
| Cubot R11 | |
| Blackview A20 | |
| Xiaomi Redmi 5A | |
| Lenovo Moto E4 | |
| Genomsnitt Mediatek MT6580M (7498 - 8913, n=12) | |
| JetStream 1.1 - 1.1 Total | |
| Xiaomi Redmi 5A (Chrome 67) | |
| Lenovo Moto E4 (Chrome 60) | |
| Genomsnitt Mediatek MT6580M (10.8 - 14.5, n=10) | |
| Cubot R11 (Chrome 67) | |
| Nokia 1 (Chrome 66) | |
| Blackview A20 (Chrome 67) | |
| Octane V2 - Total Score | |
| Genomsnitt av klass Smartphone (2800 - 126661, n=142, senaste 2 åren) | |
| Xiaomi Redmi 5A (Chrome 67) | |
| Lenovo Moto E4 (Chrome 60) | |
| Cubot R11 (Chrome 67) | |
| Genomsnitt Mediatek MT6580M (1645 - 2280, n=10) | |
| Nokia 1 (Chrome 66) | |
| Blackview A20 (Chrome 67) | |
| Mozilla Kraken 1.1 - Total | |
| Cubot R11 (Chrome 67) | |
| Blackview A20 (Chrome 67) | |
| Nokia 1 (Chrome 66) | |
| Lenovo Moto E4 (Chrome 60) | |
| Genomsnitt Mediatek MT6580M (14579 - 21257, n=11) | |
| Xiaomi Redmi 5A (Chrome 67) | |
| Genomsnitt av klass Smartphone (257 - 28190, n=121, senaste 2 åren) | |
* ... mindre är bättre
| Cubot R11 | Blackview A20 | Xiaomi Redmi 5A | Lenovo Moto E4 | Nokia 1 | Genomsnitt 16 GB eMMC Flash | Genomsnitt av klass Smartphone | |
|---|---|---|---|---|---|---|---|
| AndroBench 3-5 | -12% | 293% | 215% | 13% | 158% | 2405% | |
| Sequential Read 256KB (MB/s) | 135.8 | 90.2 -34% | 293.8 116% | 187.6 38% | 208.3 53% | 164.5 ? 21% | 2225 ? 1538% |
| Sequential Write 256KB (MB/s) | 52 | 8 -85% | 49.86 -4% | 45.3 -13% | 51.8 0% | 43 ? -17% | 1903 ? 3560% |
| Random Read 4KB (MB/s) | 22.1 | 11.3 -49% | 42.32 91% | 18.7 -15% | 25.7 16% | 21.7 ? -2% | 311 ? 1307% |
| Random Write 4KB (MB/s) | 10.8 | 3.4 -69% | 9.28 -14% | 29.2 170% | 9.1 -16% | 8.08 ? -25% | 358 ? 3215% |
| Sequential Read 256KB SDCard (MB/s) | 10.8 ? | 20.6 ? 91% | 84.9 ? 686% | 65.4 506% | 59.1 ? 447% | ||
| Sequential Write 256KB SDCard (MB/s) | 6.38 ? | 11.2 ? 76% | 62.6 ? 881% | 44.9 604% | 39.8 ? 524% |
(±) Den maximala temperaturen på ovansidan är 41.2 °C / 106 F, jämfört med genomsnittet av 35.3 °C / 96 F , allt från 21.9 till 247 °C för klassen Smartphone.
(±) Botten värms upp till maximalt 40.3 °C / 105 F, jämfört med genomsnittet av 34 °C / 93 F
(+) Vid tomgångsbruk är medeltemperaturen för ovansidan 29.7 °C / 85 F, jämfört med enhetsgenomsnittet på 33 °C / ### class_avg_f### F.
Cubot R11 ljudanalys
(±) | högtalarljudstyrkan är genomsnittlig men bra (78 dB)
Bas 100 - 315 Hz
(-) | nästan ingen bas - i genomsnitt 57.8% lägre än medianen
(+) | basen är linjär (0% delta till föregående frekvens)
Mellan 400 - 2000 Hz
(-) | nästan inga mids - i genomsnitt 57.8% lägre än medianen
(+) | mids är linjära (0% delta till föregående frekvens)
Högsta 2 - 16 kHz
(-) | nästan inga toppar - i genomsnitt 57.8% lägre än medianen
(+) | toppar är linjära (0% delta till föregående frekvens)
Totalt 100 - 16 000 Hz
(-) | det totala ljudet är inte linjärt (119.8% skillnad mot median)
Jämfört med samma klass
» 89% av alla testade enheter i den här klassen var bättre, 8% liknande, 3% sämre
» Den bästa hade ett delta på 11%, genomsnittet var 34%, sämst var 134%
Jämfört med alla testade enheter
» 97% av alla testade enheter var bättre, 2% liknande, 1% sämre
» Den bästa hade ett delta på 4%, genomsnittet var 23%, sämst var 134%
Xiaomi Redmi 5A ljudanalys
(±) | högtalarljudstyrkan är genomsnittlig men bra (77.1 dB)
Bas 100 - 315 Hz
(-) | nästan ingen bas - i genomsnitt 31.8% lägre än medianen
(±) | linjäriteten för basen är genomsnittlig (10.7% delta till föregående frekvens)
Mellan 400 - 2000 Hz
(+) | balanserad mellan - endast 2.2% från medianen
(+) | mids är linjära (5.9% delta till föregående frekvens)
Högsta 2 - 16 kHz
(+) | balanserade toppar - endast 3.1% från medianen
(+) | toppar är linjära (3.1% delta till föregående frekvens)
Totalt 100 - 16 000 Hz
(±) | linjäriteten för det totala ljudet är genomsnittlig (28.5% skillnad mot median)
Jämfört med samma klass
» 75% av alla testade enheter i den här klassen var bättre, 4% liknande, 21% sämre
» Den bästa hade ett delta på 11%, genomsnittet var 34%, sämst var 134%
Jämfört med alla testade enheter
» 86% av alla testade enheter var bättre, 3% liknande, 11% sämre
» Den bästa hade ett delta på 4%, genomsnittet var 23%, sämst var 134%
| Av/Standby | |
| Låg belastning | |
| Hög belastning |
|
Förklaring:
min: | |
| Cubot R11 2800 mAh | Blackview A20 3000 mAh | Xiaomi Redmi 5A 3000 mAh | Lenovo Moto E4 2800 mAh | Nokia 1 2150 mAh | Genomsnitt Mediatek MT6580M | Genomsnitt av klass Smartphone | |
|---|---|---|---|---|---|---|---|
| Power Consumption | -8% | 8% | 2% | 12% | 0% | -22% | |
| Idle Minimum * (Watt) | 0.9 | 1.1 -22% | 1.2 -33% | 0.87 3% | 0.9 -0% | 0.805 ? 11% | 0.887 ? 1% |
| Idle Average * (Watt) | 1.5 | 1.5 -0% | 1.5 -0% | 2.38 -59% | 1.5 -0% | 1.736 ? -16% | 1.485 ? 1% |
| Idle Maximum * (Watt) | 2.2 | 2.3 -5% | 1.8 18% | 2.47 -12% | 2 9% | 2.1 ? 5% | 1.672 ? 24% |
| Load Average * (Watt) | 4.6 | 4.8 -4% | 2.9 37% | 2.63 43% | 3.5 24% | 4.82 ? -5% | 6.76 ? -47% |
| Load Maximum * (Watt) | 6 | 6.5 -8% | 4.8 20% | 3.86 36% | 4.3 28% | 5.68 ? 5% | 11.2 ? -87% |
* ... mindre är bättre
| Cubot R11 2800 mAh | Blackview A20 3000 mAh | Xiaomi Redmi 5A 3000 mAh | Lenovo Moto E4 2800 mAh | Nokia 1 2150 mAh | |
|---|---|---|---|---|---|
| Batteridrifttid | -12% | 58% | -18% | -13% | |
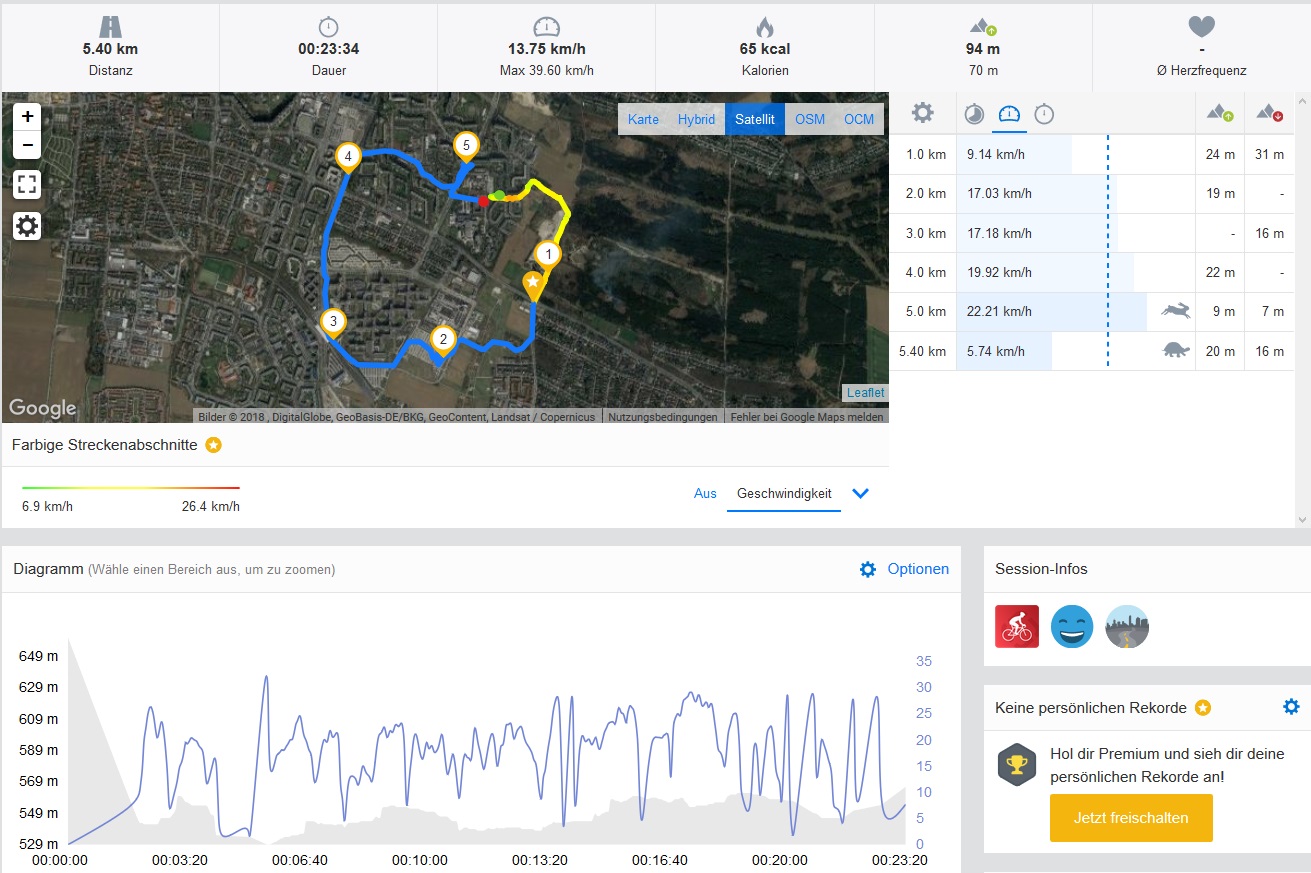
| WiFi v1.3 (h) | 10.6 | 9.3 -12% | 16.8 58% | 8.7 -18% | 9.2 -13% |
| Reader / Idle (h) | 21.7 | ||||
| H.264 (h) | 10.1 | ||||
| Load (h) | 5.3 |
För
Emot
Läs den fullständiga versionen av den här recensionen på engelska här.
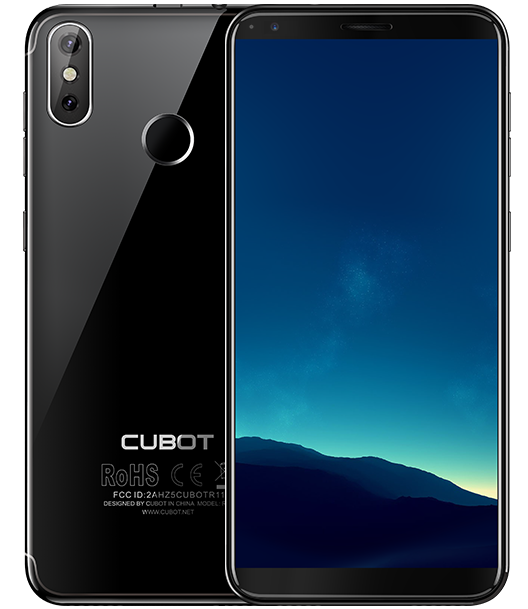
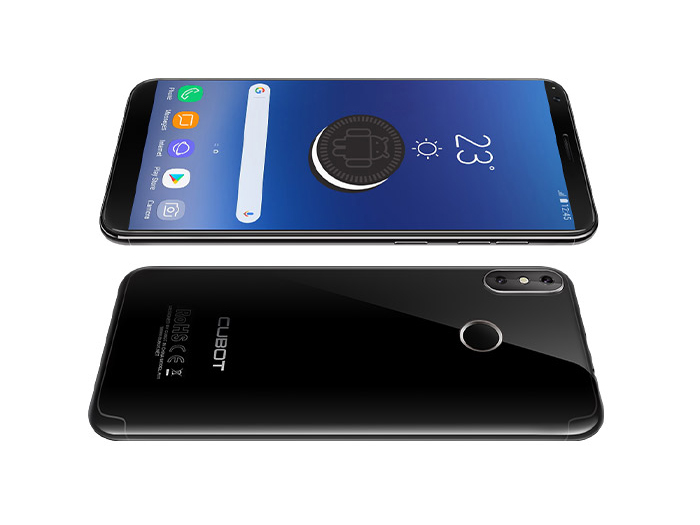
CUBOT R11 är en enhet för under 1.000 kronor som imponerar med ett robust hölje och lång batteritid. Men det finns många enheter för ett liknande pris som har mer kraft, bättre kameror och stöd för LTE. Men på plus-sidan har CUBOT R11 ett utbytbart batteri, 2:1-skärmförhållande och kompakta dimensioner. Det sistnämnda är en fördel för den som har små händer.
CUBOT R11 är en gedigen budget-smartphone som har bra batteritid, ett utbytbart batteri och ett robust hölje. En kraftigare SoC hade dock gjort underverk.
Sammanfattningsvis, CUBOT R11 är en typisk instegs-smartphone som lyckas bra på en del områden men är sämre på andra.
Cubot R11
- 07/26/2018 v6 (old)
Florian Wimmer
Price comparison
