Test: Asus ROG Flow X13 - Omvandlingsbar speldator med AMD Ryzen 9 5980H och RTX 3080 som tillval (Sammanfattning)
Testgrupp
Gradering | Datum | Modell | Vikt | Höjd | Storlek | Upplösning | Pris |
|---|---|---|---|---|---|---|---|
| 84.7 % v7 (old) | 02/2021 | Asus ROG Flow X13 GV301QH R9 5980HS, GeForce GTX 1650 Max-Q | 1.4 kg | 15.8 mm | 13.40" | 3840x2400 | |
| 86.9 % v7 (old) | 06/2020 | Microsoft Surface Book 3 13.5 i7-1065G7, GeForce GTX 1650 Max-Q | 1.6 kg | 23 mm | 13.50" | 3000x2000 | |
| 89.4 % v7 (old) | 12/2020 | HP Spectre x360 14t-ea000 i7-1165G7, Iris Xe G7 96EUs | 1.3 kg | 17.2 mm | 13.50" | 1920x1280 | |
| 87.1 % v7 (old) | 12/2020 | Lenovo Yoga 9i 14ITL5 i5-1135G7, Iris Xe G7 80EUs | 1.4 kg | 15.7 mm | 14.00" | 1920x1080 | |
| 88.1 % v7 (old) | 08/2020 | Acer Spin 5 SP513-54N-79EY i7-1065G7, Iris Plus Graphics G7 (Ice Lake 64 EU) | 1.2 kg | 14.9 mm | 13.50" | 2256x1504 | |
| 86.3 % v7 (old) | 10/2020 | Asus ZenBook Flip S UX371 i7-1165G7, Iris Xe G7 96EUs | 1.2 kg | 13.9 mm | 13.30" | 3840x2160 |

| |||||||||||||||||||||||||
Distribution av ljusstyrkan: 86 %
Mitt på batteriet: 207 cd/m²
Kontrast: 1561:1 (Svärta: 0.23 cd/m²)
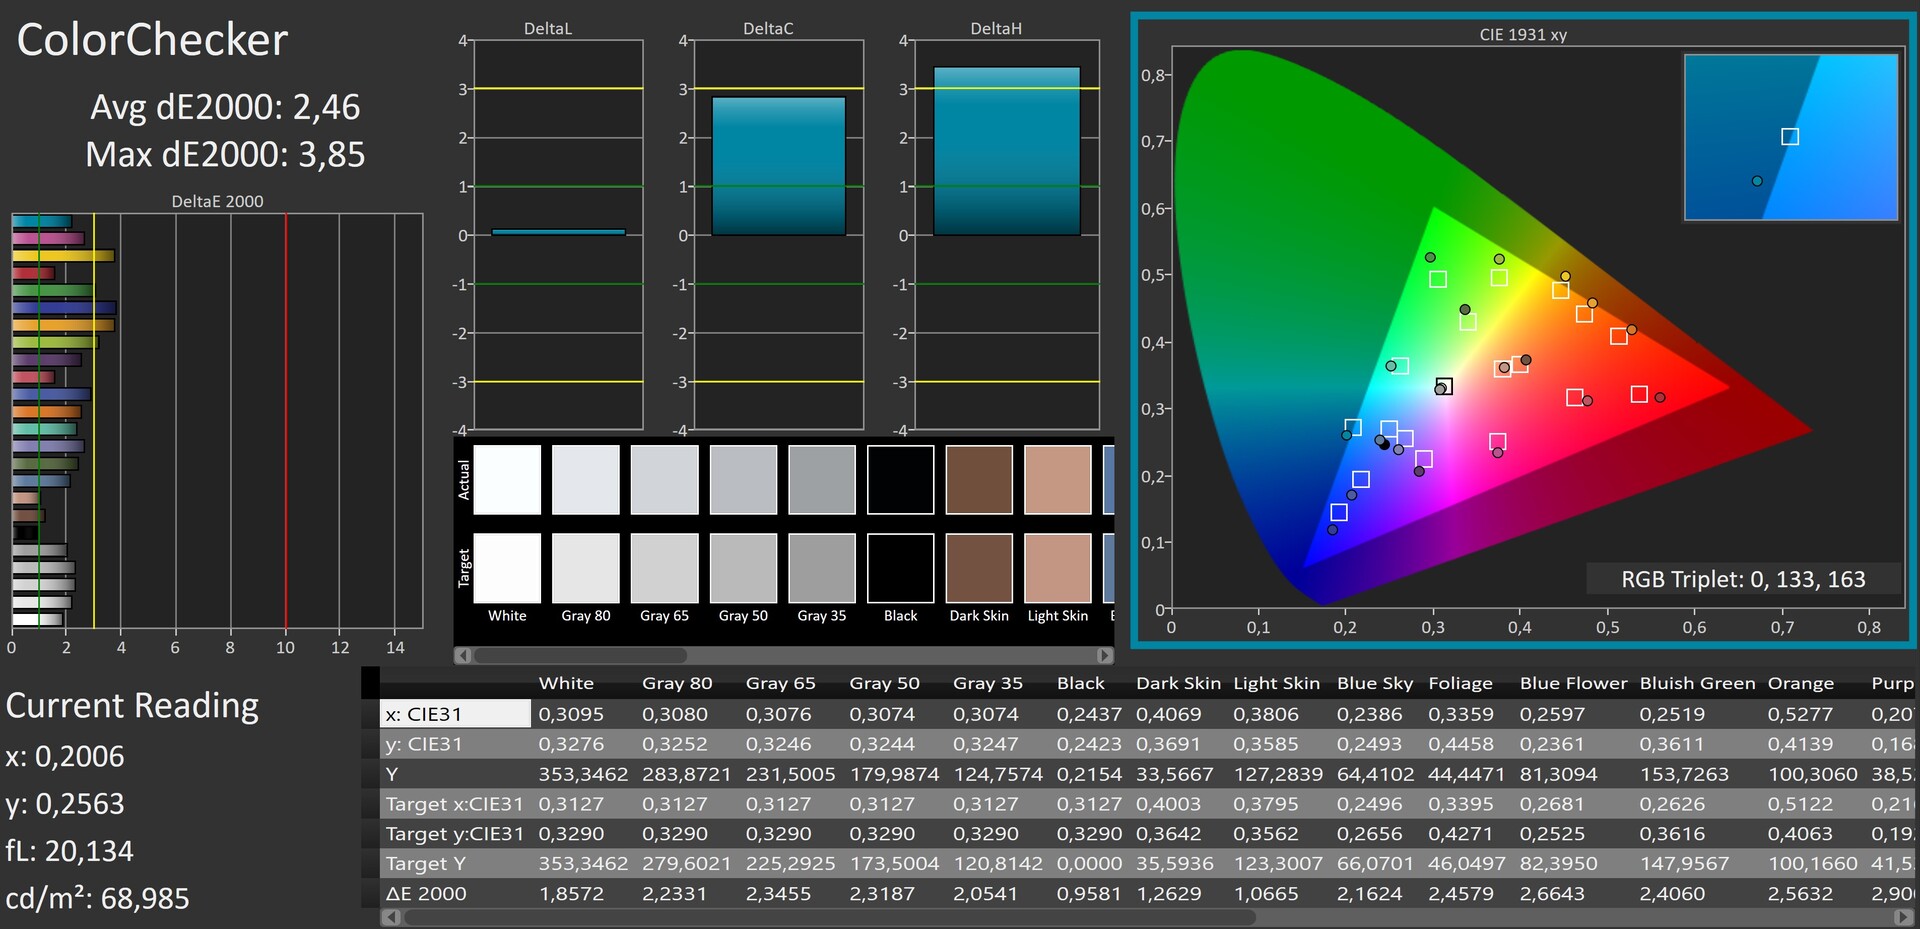
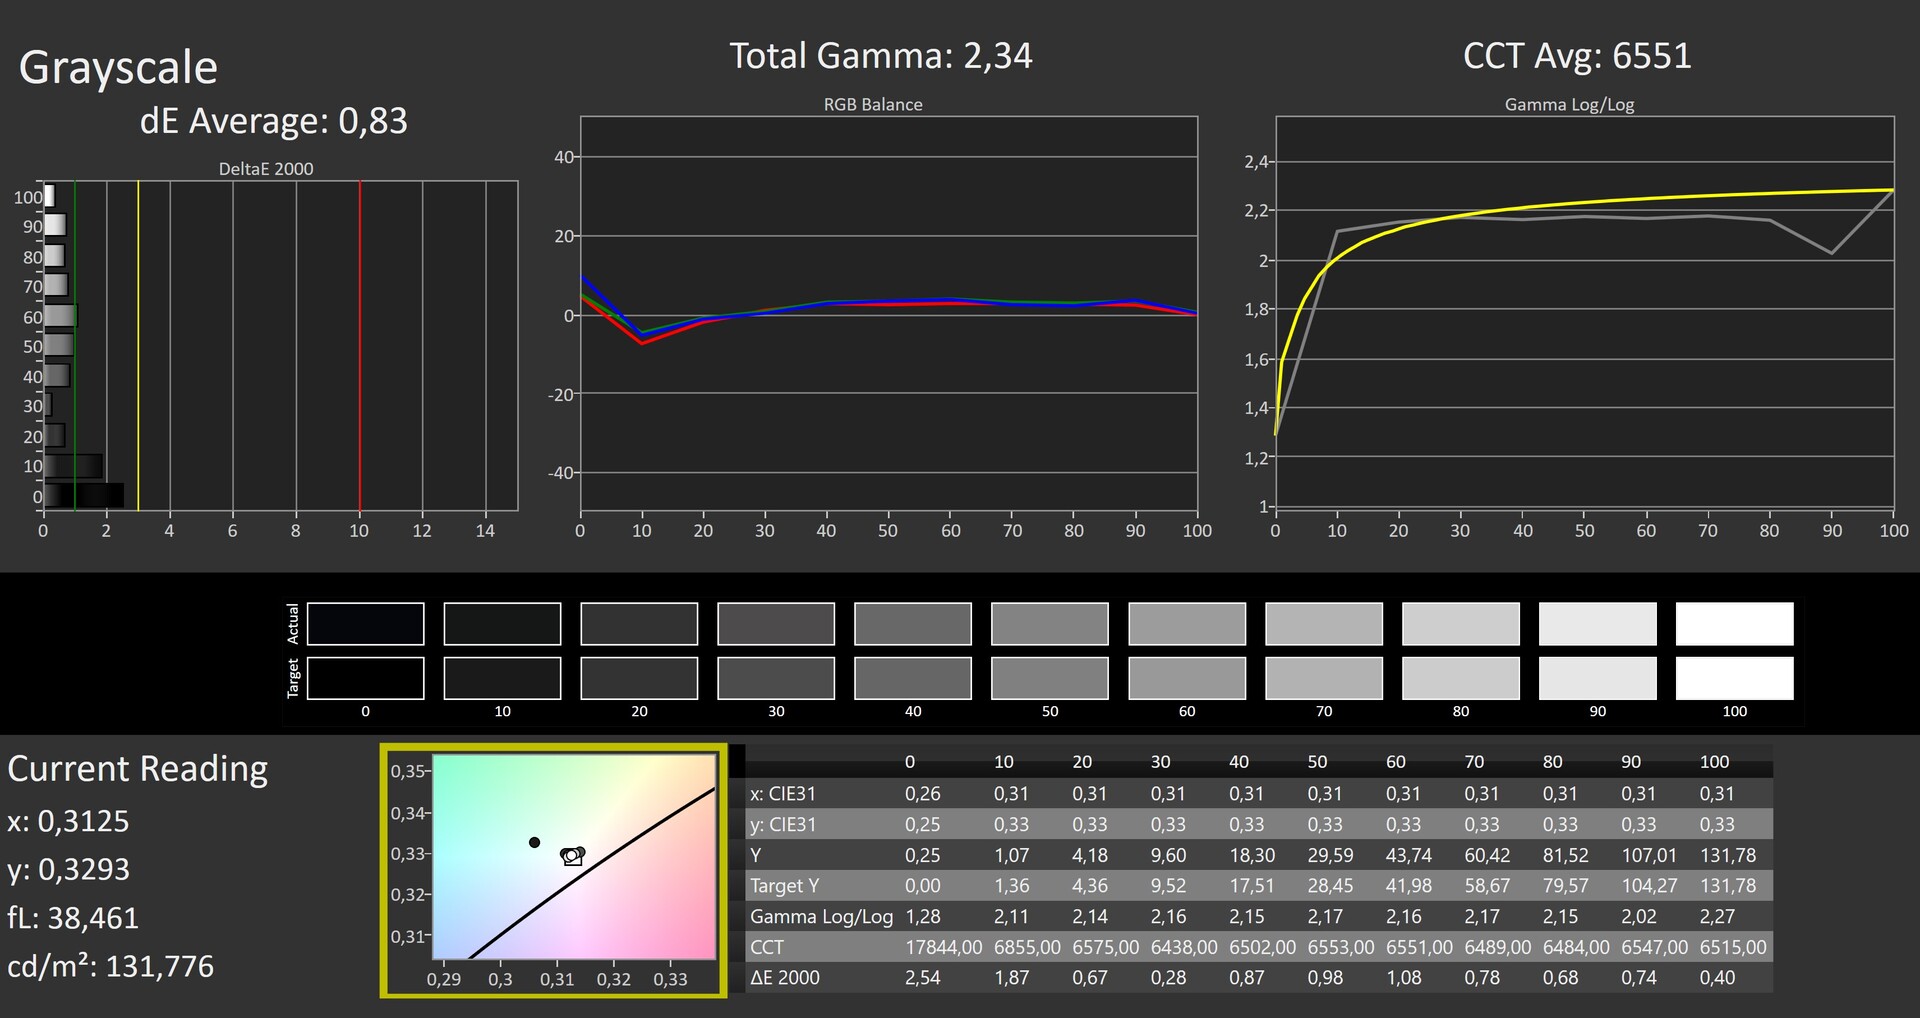
ΔE ColorChecker Calman: 2.46 | ∀{0.5-29.43 Ø4.72}
calibrated: 1.6
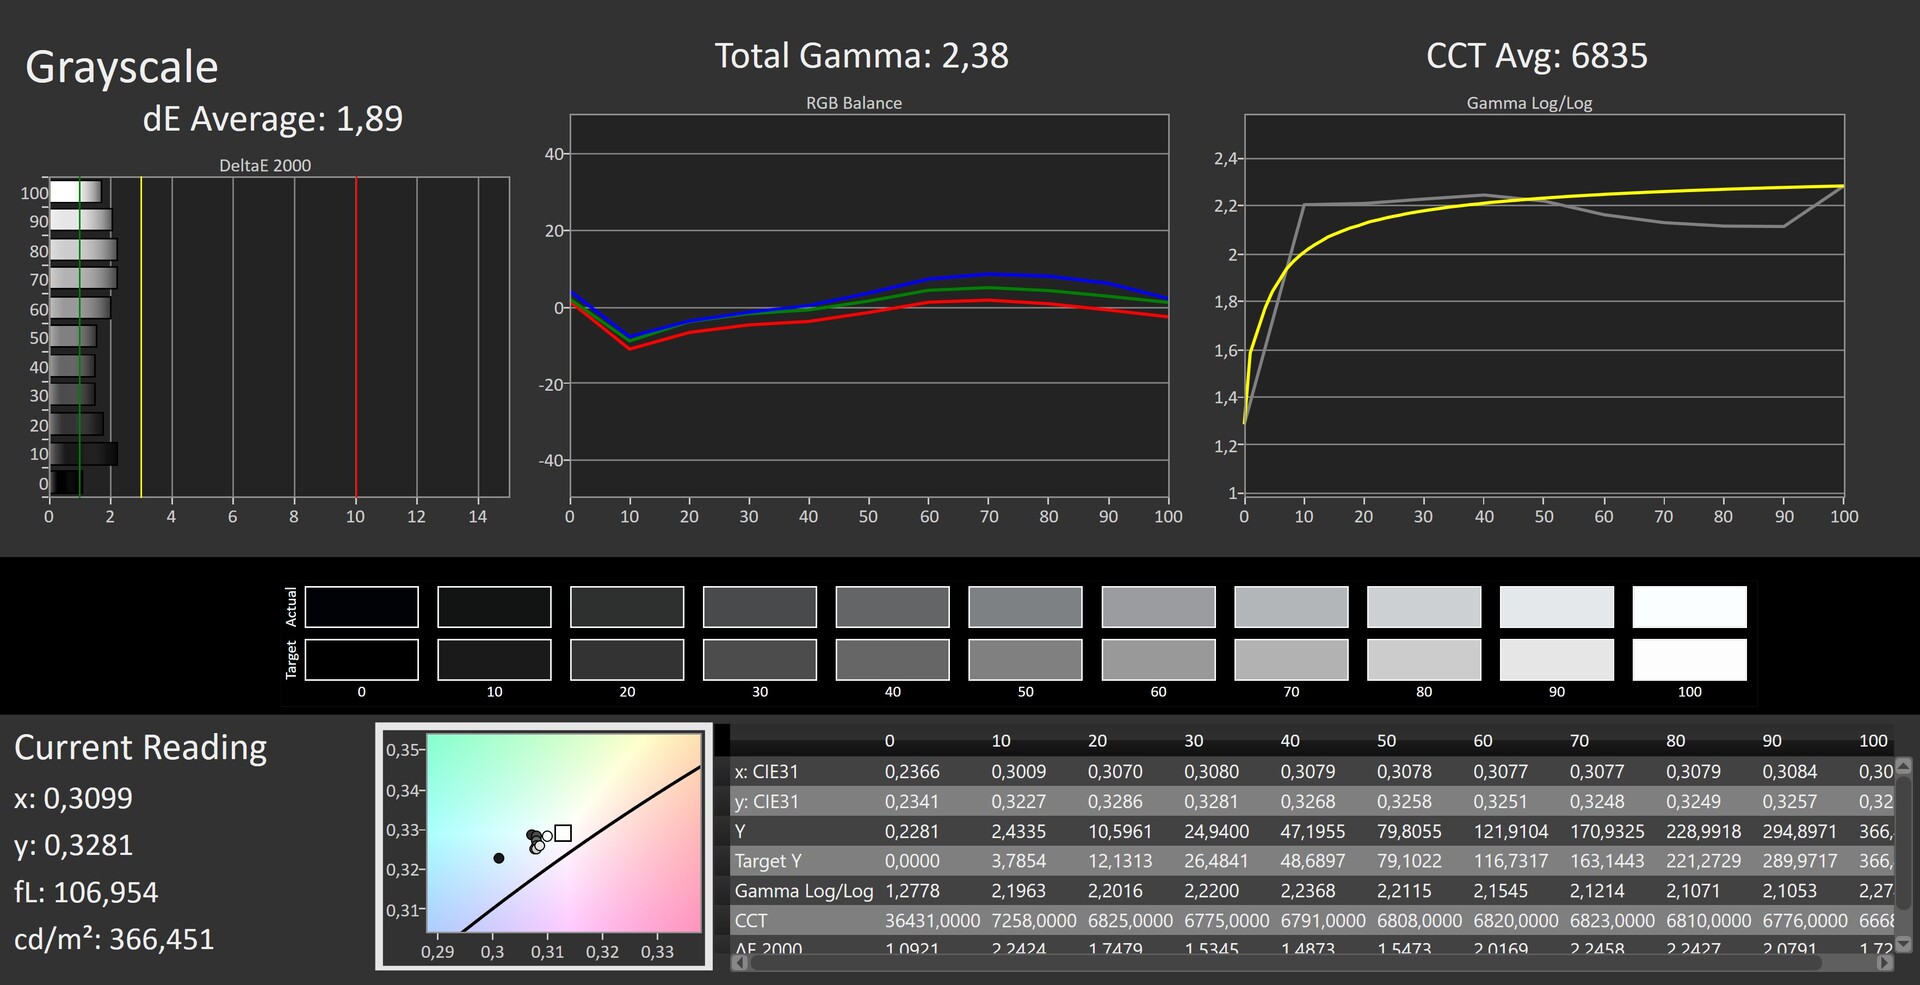
ΔE Greyscale Calman: 1.89 | ∀{0.09-98 Ø4.97}
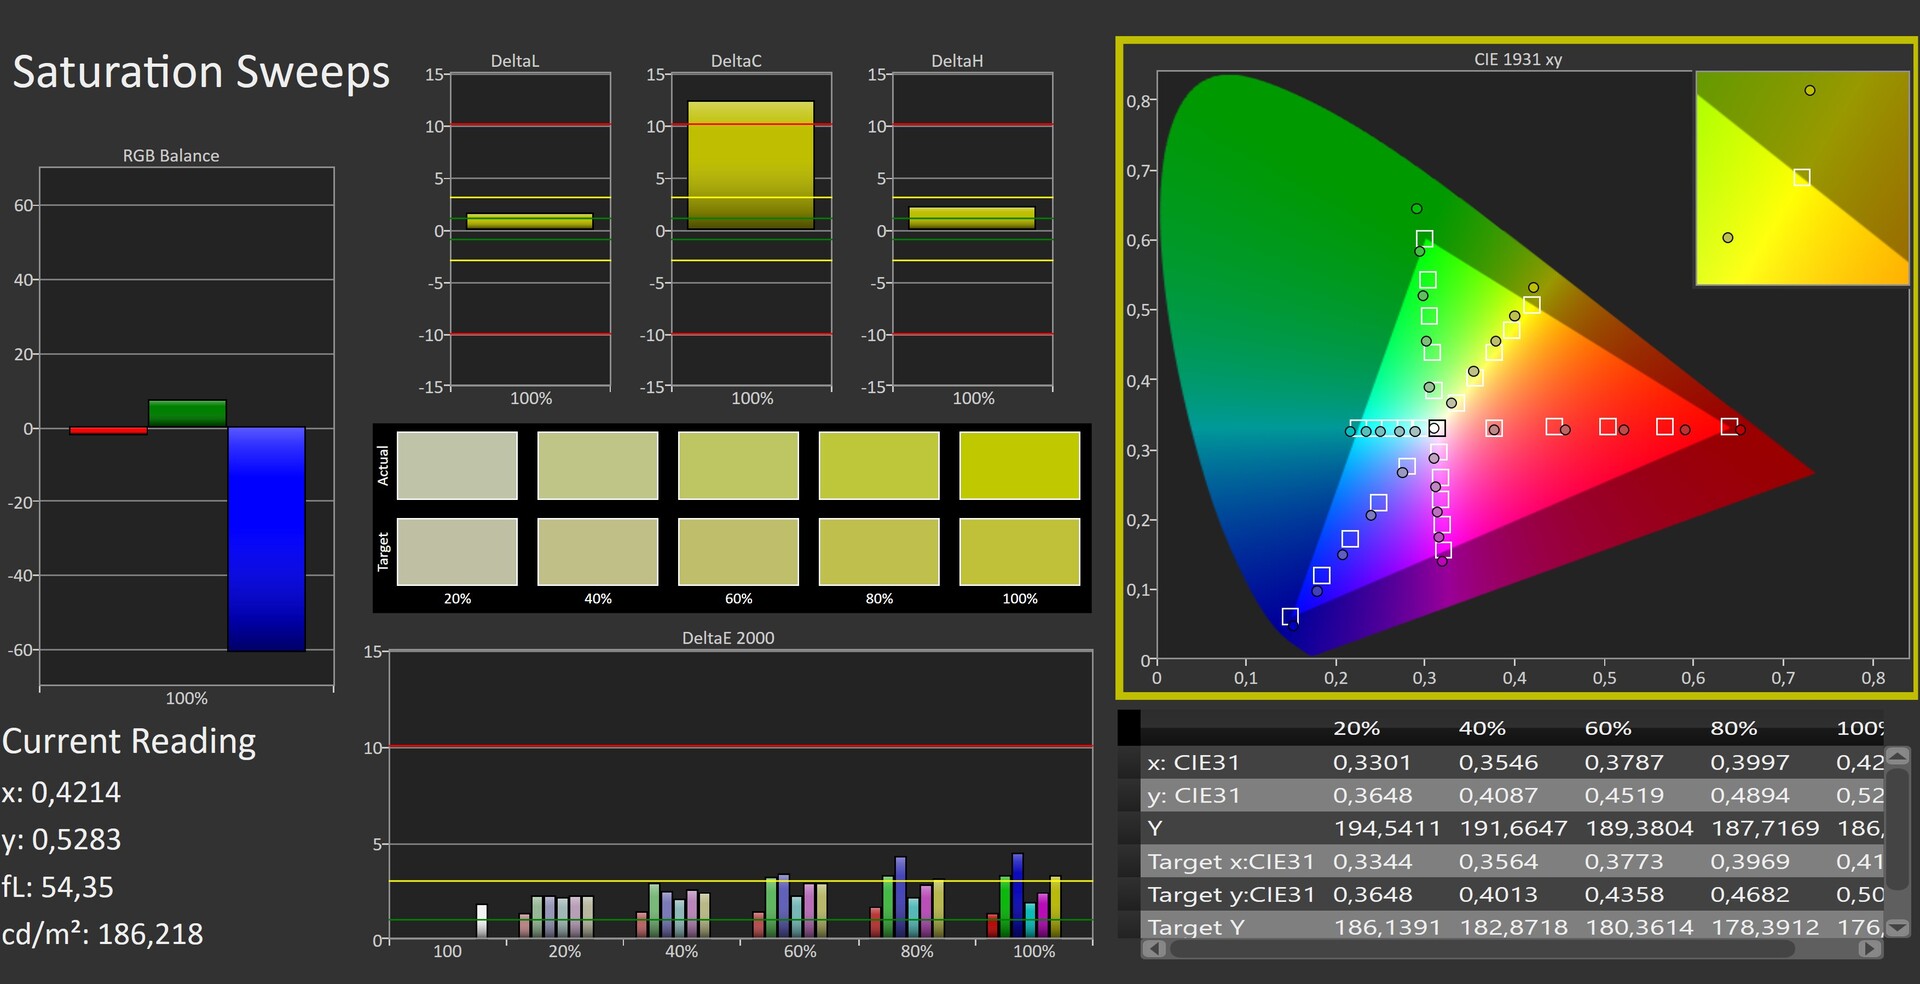
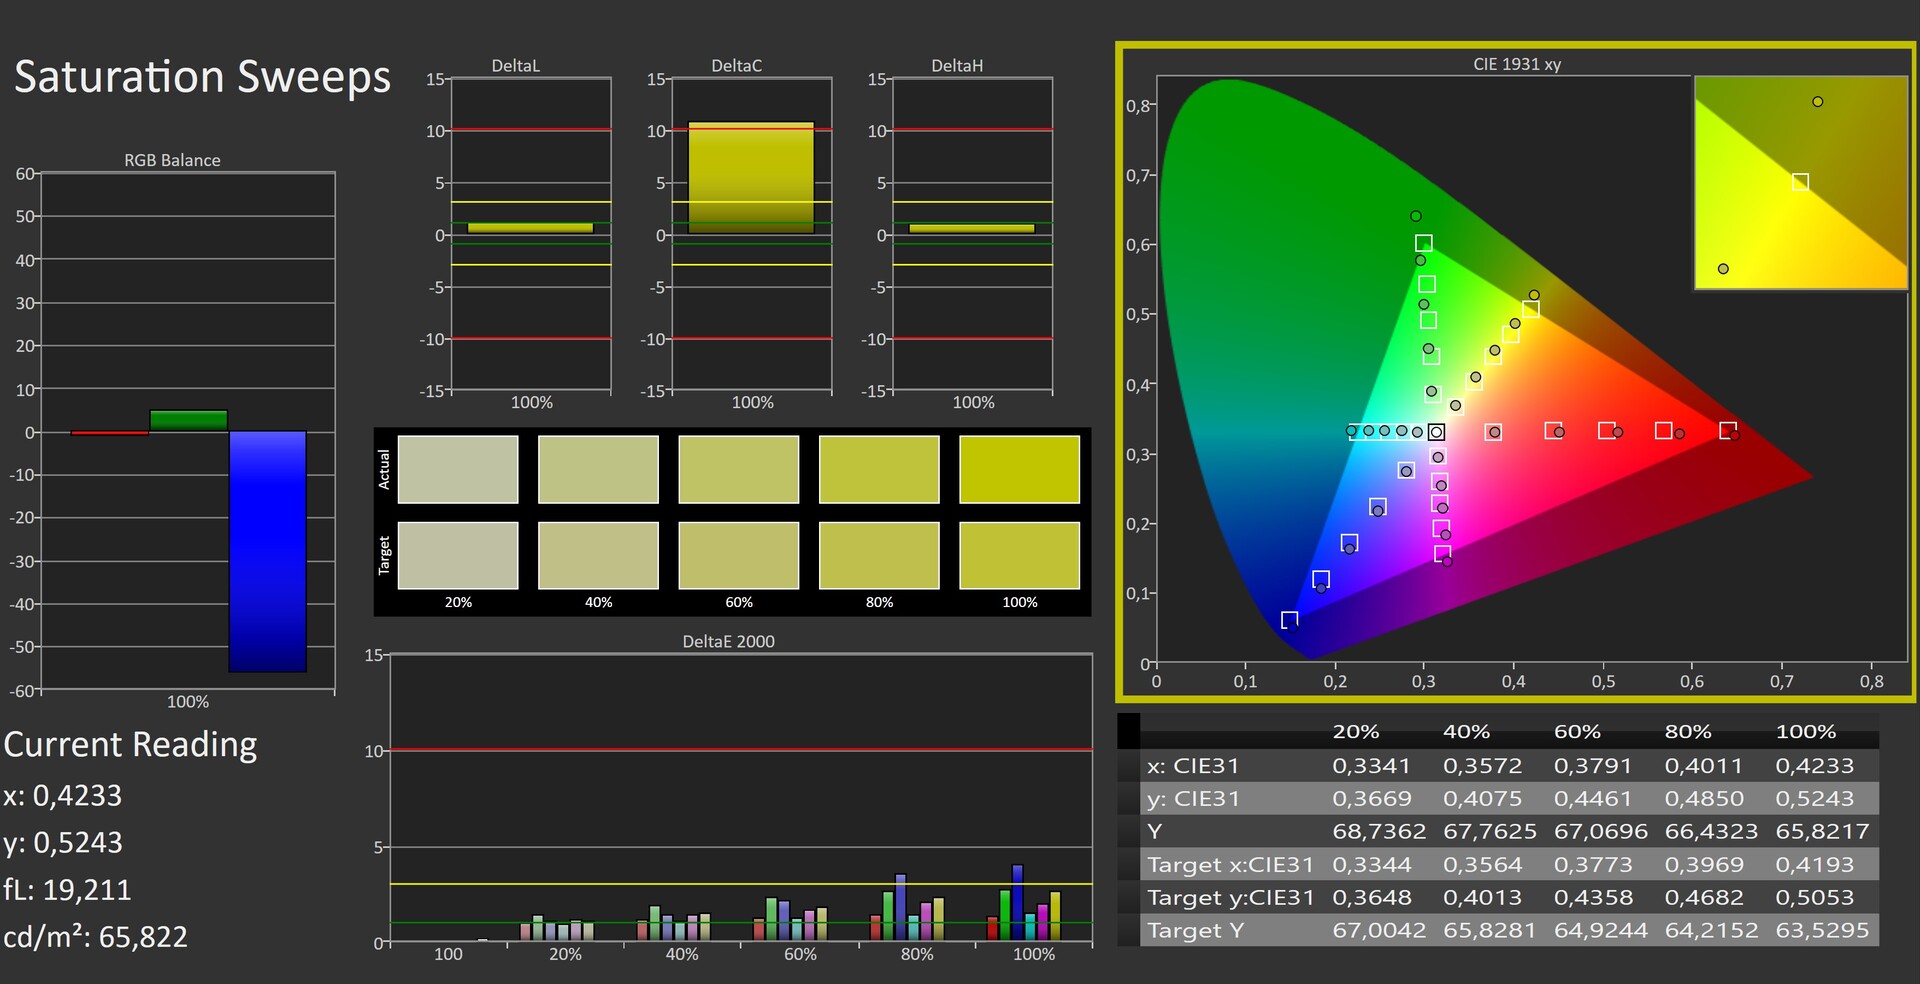
99.4% sRGB (Argyll 1.6.3 3D)
68.2% AdobeRGB 1998 (Argyll 1.6.3 3D)
76.8% AdobeRGB 1998 (Argyll 3D)
99.5% sRGB (Argyll 3D)
77.8% Display P3 (Argyll 3D)
Gamma: 2.38
CCT: 6835 K
| Asus ROG Flow X13 GV301QH LQ134R1JW51, IPS, 3840x2400, 13.4" | HP Spectre x360 14t-ea000 LG Philips LGD0663, IPS, 1920x1280, 13.5" | Lenovo Yoga 9i 14ITL5 LG Display LP140WF9-SPE2, IPS, 1920x1080, 14" | Acer Spin 5 SP513-54N-79EY BOE08BC, IPS, 2256x1504, 13.5" | Asus ZenBook Flip S UX371 SDC4147, OLED, 3840x2160, 13.3" | Microsoft Surface Book 3 13.5 Panasonic MEI96A2, IPS, 3000x2000, 13.5" | |
|---|---|---|---|---|---|---|
| Display | -9% | -12% | -6% | 20% | -12% | |
| Display P3 Coverage (%) | 77.8 | 65.8 -15% | 64.2 -17% | 69.4 -11% | 99.9 28% | 63.5 -18% |
| sRGB Coverage (%) | 99.5 | 98.2 -1% | 94.2 -5% | 99.6 0% | 100 1% | 95.1 -4% |
| AdobeRGB 1998 Coverage (%) | 76.8 | 67.9 -12% | 65 -15% | 71 -8% | 100 30% | 65.7 -14% |
| Response Times | -27% | -12% | 5% | 94% | -19% | |
| Response Time Grey 50% / Grey 80% * (ms) | 48 ? | 62 ? -29% | 55.2 ? -15% | 49 ? -2% | 2 ? 96% | 57 ? -19% |
| Response Time Black / White * (ms) | 32 ? | 39.6 ? -24% | 34.4 ? -8% | 28 ? 12% | 2.8 ? 91% | 38 ? -19% |
| PWM Frequency (Hz) | 208 ? | 59.5 ? | ||||
| Screen | -4% | -23% | 16% | 3% | -7% | |
| Brightness middle (cd/m²) | 359 | 443.5 24% | 365 2% | 454 26% | 365 2% | 391 9% |
| Brightness (cd/m²) | 331 | 394 19% | 346 5% | 426 29% | 372 12% | 367 11% |
| Brightness Distribution (%) | 86 | 78 -9% | 82 -5% | 91 6% | 91 6% | 86 0% |
| Black Level * (cd/m²) | 0.23 | 0.17 26% | 0.23 -0% | 0.33 -43% | 0.03 87% | 0.19 17% |
| Contrast (:1) | 1561 | 2609 67% | 1587 2% | 1376 -12% | 12167 679% | 2058 32% |
| Colorchecker dE 2000 * | 2.46 | 2.7 -10% | 3.65 -48% | 1.27 48% | 7.6 -209% | 3.07 -25% |
| Colorchecker dE 2000 max. * | 3.85 | 4.36 -13% | 6.69 -74% | 2.42 37% | 12.9 -235% | 4.74 -23% |
| Colorchecker dE 2000 calibrated * | 1.6 | 2.61 -63% | 1.61 -1% | 0.78 51% | 4.1 -156% | 1.52 5% |
| Greyscale dE 2000 * | 1.89 | 3.4 -80% | 4 -112% | 1.07 43% | 5.4 -186% | 3.6 -90% |
| Gamma | 2.38 92% | 2.09 105% | 2.33 94% | 2.39 92% | 1.6 138% | 2.29 96% |
| CCT | 6835 95% | 6144 106% | 6873 95% | 6530 100% | 6327 103% | 6330 103% |
| Color Space (Percent of AdobeRGB 1998) (%) | 68.2 | 62.1 -9% | 60.1 -12% | 65 -5% | 92 35% | 61 -11% |
| Color Space (Percent of sRGB) (%) | 99.4 | 98.5 -1% | 93.9 -6% | 100 1% | 100 1% | 95 -4% |
| Totalt genomsnitt (program/inställningar) | -13% /
-8% | -16% /
-19% | 5% /
11% | 39% /
18% | -13% /
-10% |
* ... mindre är bättre

Visa svarstider
| ↔ Svarstid svart till vitt | ||
|---|---|---|
| 32 ms ... stiga ↗ och falla ↘ kombinerat | ↗ 16 ms stiga | 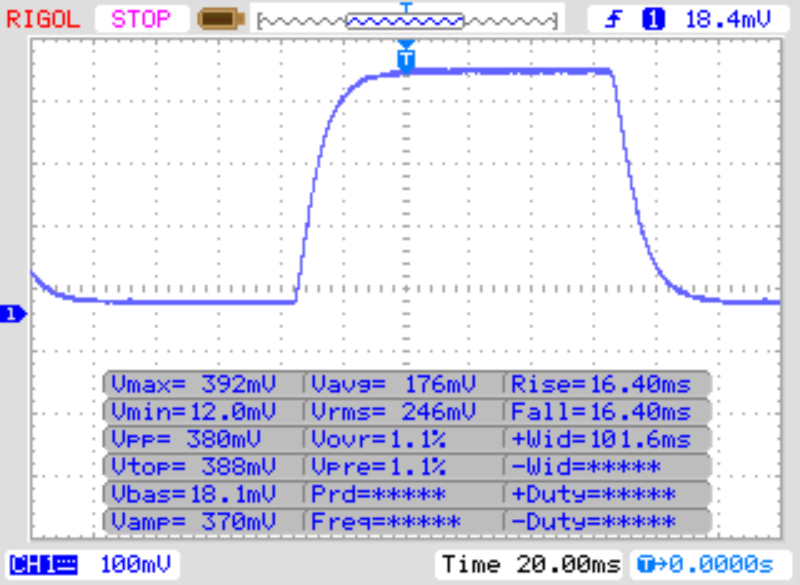 |
| ↘ 16 ms hösten | ||
| Skärmen visar långsamma svarsfrekvenser i våra tester och kommer att vara otillfredsställande för spelare. I jämförelse sträcker sig alla testade enheter från 0.1 (minst) till 240 (maximalt) ms. » 86 % av alla enheter är bättre. Detta innebär att den uppmätta svarstiden är sämre än genomsnittet av alla testade enheter (19.8 ms). | ||
| ↔ Svarstid 50 % grått till 80 % grått | ||
| 48 ms ... stiga ↗ och falla ↘ kombinerat | ↗ 23 ms stiga | 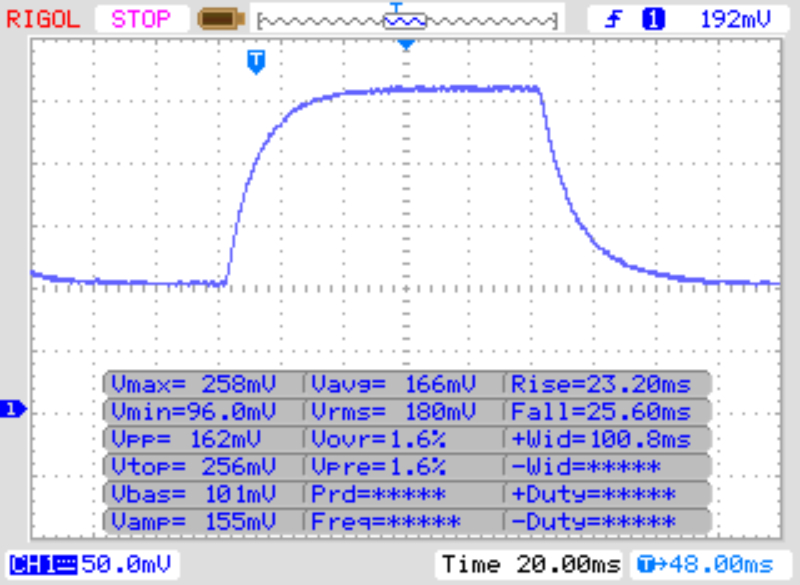 |
| ↘ 25 ms hösten | ||
| Skärmen visar långsamma svarsfrekvenser i våra tester och kommer att vara otillfredsställande för spelare. I jämförelse sträcker sig alla testade enheter från 0.165 (minst) till 636 (maximalt) ms. » 82 % av alla enheter är bättre. Detta innebär att den uppmätta svarstiden är sämre än genomsnittet av alla testade enheter (31 ms). | ||
Skärmflimmer / PWM (Puls-Width Modulation)
| Skärmflimmer / PWM upptäcktes inte | 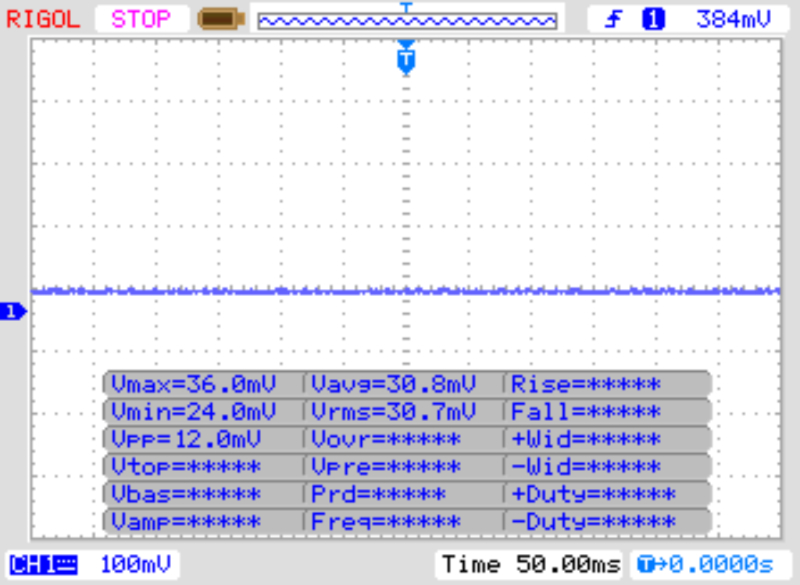 | ||
Som jämförelse: 52 % av alla testade enheter använder inte PWM för att dämpa skärmen. Om PWM upptäcktes mättes ett medelvärde av 7781 (minst: 5 - maximum: 343500) Hz. | |||
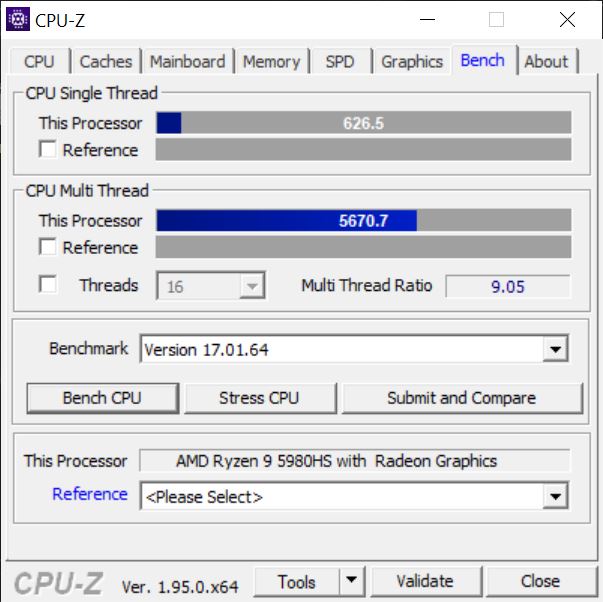
Cinebench R15: CPU Single 64Bit | CPU Multi 64Bit
Blender: v2.79 BMW27 CPU
7-Zip 18.03: 7z b 4 -mmt1 | 7z b 4
Geekbench 5.5: Single-Core | Multi-Core
HWBOT x265 Benchmark v2.2: 4k Preset
LibreOffice : 20 Documents To PDF
R Benchmark 2.5: Overall mean
| Cinebench R20 / CPU (Single Core) | |
| Genomsnitt av klass Convertible (273 - 834, n=50, senaste 2 åren) | |
| Asus ROG Flow X13 GV301QH | |
| Genomsnitt AMD Ryzen 9 5980HS (601 - 604, n=2) | |
| HP Spectre x360 14t-ea000 | |
| Lenovo Yoga 9i 14ITL5 | |
| Asus ZenBook Flip S UX371 | |
| Acer Spin 5 SP513-54N-79EY | |
| Microsoft Surface Book 3 13.5 | |
| Cinebench R20 / CPU (Multi Core) | |
| Asus ROG Flow X13 GV301QH | |
| Genomsnitt AMD Ryzen 9 5980HS (4349 - 4953, n=2) | |
| Genomsnitt av klass Convertible (595 - 12102, n=50, senaste 2 åren) | |
| Lenovo Yoga 9i 14ITL5 | |
| HP Spectre x360 14t-ea000 | |
| Acer Spin 5 SP513-54N-79EY | |
| Asus ZenBook Flip S UX371 | |
| Microsoft Surface Book 3 13.5 | |
| Cinebench R15 / CPU Single 64Bit | |
| Genomsnitt av klass Convertible (149.8 - 317, n=49, senaste 2 åren) | |
| Asus ROG Flow X13 GV301QH | |
| Genomsnitt AMD Ryzen 9 5980HS (n=1) | |
| Asus ZenBook Flip S UX371 | |
| HP Spectre x360 14t-ea000 | |
| Lenovo Yoga 9i 14ITL5 | |
| Microsoft Surface Book 3 13.5 | |
| Acer Spin 5 SP513-54N-79EY | |
| Cinebench R15 / CPU Multi 64Bit | |
| Asus ROG Flow X13 GV301QH | |
| Genomsnitt AMD Ryzen 9 5980HS (n=1) | |
| Genomsnitt av klass Convertible (478 - 4940, n=49, senaste 2 åren) | |
| HP Spectre x360 14t-ea000 | |
| Asus ZenBook Flip S UX371 | |
| Asus ZenBook Flip S UX371 | |
| Asus ZenBook Flip S UX371 | |
| Lenovo Yoga 9i 14ITL5 | |
| Acer Spin 5 SP513-54N-79EY | |
| Microsoft Surface Book 3 13.5 | |
| Blender / v2.79 BMW27 CPU | |
| Microsoft Surface Book 3 13.5 | |
| Asus ZenBook Flip S UX371 | |
| Acer Spin 5 SP513-54N-79EY | |
| Lenovo Yoga 9i 14ITL5 | |
| HP Spectre x360 14t-ea000 | |
| Genomsnitt av klass Convertible (105 - 1051, n=49, senaste 2 åren) | |
| Genomsnitt AMD Ryzen 9 5980HS (n=1) | |
| Asus ROG Flow X13 GV301QH | |
| 7-Zip 18.03 / 7z b 4 -mmt1 | |
| Asus ROG Flow X13 GV301QH | |
| Genomsnitt AMD Ryzen 9 5980HS (n=1) | |
| Genomsnitt av klass Convertible (3672 - 6655, n=49, senaste 2 åren) | |
| HP Spectre x360 14t-ea000 | |
| Lenovo Yoga 9i 14ITL5 | |
| Asus ZenBook Flip S UX371 | |
| Acer Spin 5 SP513-54N-79EY | |
| Microsoft Surface Book 3 13.5 | |
| 7-Zip 18.03 / 7z b 4 | |
| Asus ROG Flow X13 GV301QH | |
| Genomsnitt AMD Ryzen 9 5980HS (n=1) | |
| Genomsnitt av klass Convertible (12977 - 121368, n=49, senaste 2 åren) | |
| Lenovo Yoga 9i 14ITL5 | |
| HP Spectre x360 14t-ea000 | |
| Acer Spin 5 SP513-54N-79EY | |
| Asus ZenBook Flip S UX371 | |
| Microsoft Surface Book 3 13.5 | |
| Geekbench 5.5 / Single-Core | |
| Genomsnitt av klass Convertible (806 - 2275, n=49, senaste 2 åren) | |
| Asus ZenBook Flip S UX371 | |
| Asus ROG Flow X13 GV301QH | |
| Genomsnitt AMD Ryzen 9 5980HS (n=1) | |
| HP Spectre x360 14t-ea000 | |
| Lenovo Yoga 9i 14ITL5 | |
| Microsoft Surface Book 3 13.5 | |
| Acer Spin 5 SP513-54N-79EY | |
| Geekbench 5.5 / Multi-Core | |
| Genomsnitt av klass Convertible (1608 - 22023, n=49, senaste 2 åren) | |
| Asus ROG Flow X13 GV301QH | |
| Genomsnitt AMD Ryzen 9 5980HS (n=1) | |
| Asus ZenBook Flip S UX371 | |
| HP Spectre x360 14t-ea000 | |
| Lenovo Yoga 9i 14ITL5 | |
| Microsoft Surface Book 3 13.5 | |
| Acer Spin 5 SP513-54N-79EY | |
| HWBOT x265 Benchmark v2.2 / 4k Preset | |
| Asus ROG Flow X13 GV301QH | |
| Genomsnitt AMD Ryzen 9 5980HS (n=1) | |
| Genomsnitt av klass Convertible (3.43 - 36.2, n=49, senaste 2 åren) | |
| Lenovo Yoga 9i 14ITL5 | |
| HP Spectre x360 14t-ea000 | |
| Asus ZenBook Flip S UX371 | |
| Microsoft Surface Book 3 13.5 | |
| LibreOffice / 20 Documents To PDF | |
| Asus ROG Flow X13 GV301QH | |
| Genomsnitt AMD Ryzen 9 5980HS (n=1) | |
| Microsoft Surface Book 3 13.5 | |
| Asus ZenBook Flip S UX371 | |
| Acer Spin 5 SP513-54N-79EY | |
| Genomsnitt av klass Convertible (42.5 - 84.3, n=49, senaste 2 åren) | |
| HP Spectre x360 14t-ea000 | |
| Lenovo Yoga 9i 14ITL5 | |
| R Benchmark 2.5 / Overall mean | |
| Microsoft Surface Book 3 13.5 | |
| Asus ZenBook Flip S UX371 | |
| Lenovo Yoga 9i 14ITL5 | |
| HP Spectre x360 14t-ea000 | |
| Asus ROG Flow X13 GV301QH | |
| Genomsnitt AMD Ryzen 9 5980HS (n=1) | |
| Genomsnitt av klass Convertible (0.3915 - 0.84, n=49, senaste 2 åren) | |
* ... mindre är bättre
| PCMark 10 Score | 5971 poäng | |
Hjälp | ||
| DPC Latencies / LatencyMon - interrupt to process latency (max), Web, Youtube, Prime95 | |
| Asus ROG Flow X13 GV301QH | |
* ... mindre är bättre
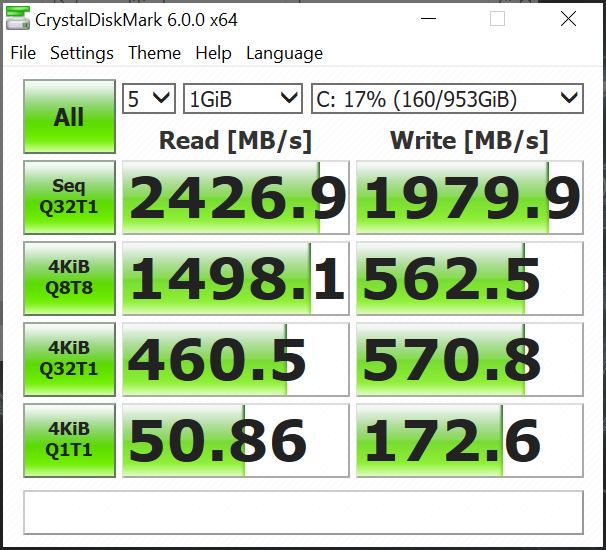
| Asus ROG Flow X13 GV301QH WDC PC SN530 SDBPNPZ-1T00 | Microsoft Surface Book 3 13.5 SK Hynix BC501 HFM512GDJTNG | HP Spectre x360 14t-ea000 Samsung SSD PM981a MZVLB512HBJQ | Lenovo Yoga 9i 14ITL5 Samsung SSD PM981a MZVLB256HBHQ | Acer Spin 5 SP513-54N-79EY Samsung PM991 MZVLQ1T0HALB | Asus ZenBook Flip S UX371 WDC PC SN730 SDBPNTY-1T00 | Genomsnitt WDC PC SN530 SDBPNPZ-1T00 | |
|---|---|---|---|---|---|---|---|
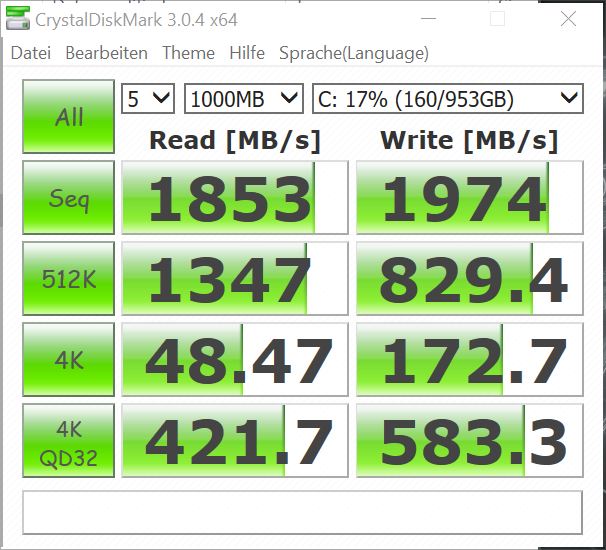
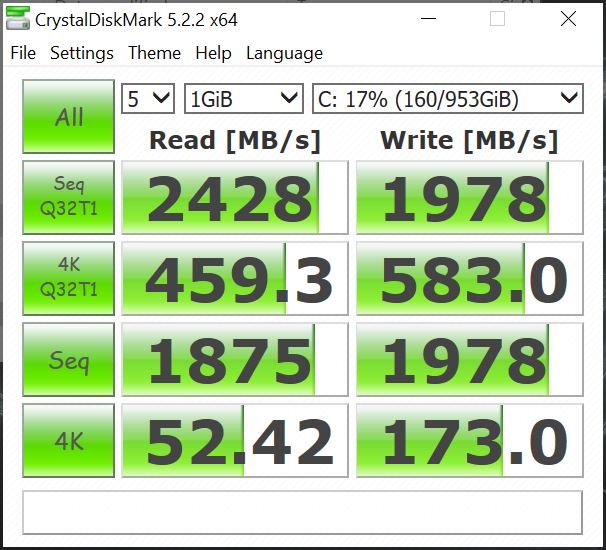
| CrystalDiskMark 5.2 / 6 | -44% | 1% | -1% | -1% | -9% | 0% | |
| Write 4K (MB/s) | 173 | 88.4 -49% | 82.2 -52% | 139.6 -19% | 168.4 -3% | 133.4 -23% | 182.7 ? 6% |
| Read 4K (MB/s) | 52.4 | 39.53 -25% | 45.7 -13% | 37.3 -29% | 55 5% | 36.52 -30% | 48.6 ? -7% |
| Write Seq (MB/s) | 1978 | 691 -65% | 2000 1% | 1827 -8% | 1901 -4% | 1979 ? 0% | |
| Read Seq (MB/s) | 1875 | 1032 -45% | 2206 18% | 2253 20% | 2027 8% | 1828 ? -3% | |
| Write 4K Q32T1 (MB/s) | 571 | 279.6 -51% | 451.2 -21% | 467.9 -18% | 476.1 -17% | 317.8 -44% | 498 ? -13% |
| Read 4K Q32T1 (MB/s) | 460.5 | 261.6 -43% | 351 -24% | 366.7 -20% | 506 10% | 299.1 -35% | 573 ? 24% |
| Write Seq Q32T1 (MB/s) | 1980 | 868 -56% | 2982 51% | 2349 19% | 1492 -25% | 2602 31% | 1980 ? 0% |
| Read Seq Q32T1 (MB/s) | 2427 | 2075 -15% | 3529 45% | 3540 46% | 2357 -3% | 3142 29% | 2336 ? -4% |
| Write 4K Q8T8 (MB/s) | 563 | 930 65% | 563 ? 0% | ||||
| Read 4K Q8T8 (MB/s) | 1498 | 963 -36% | 1498 ? 0% | ||||
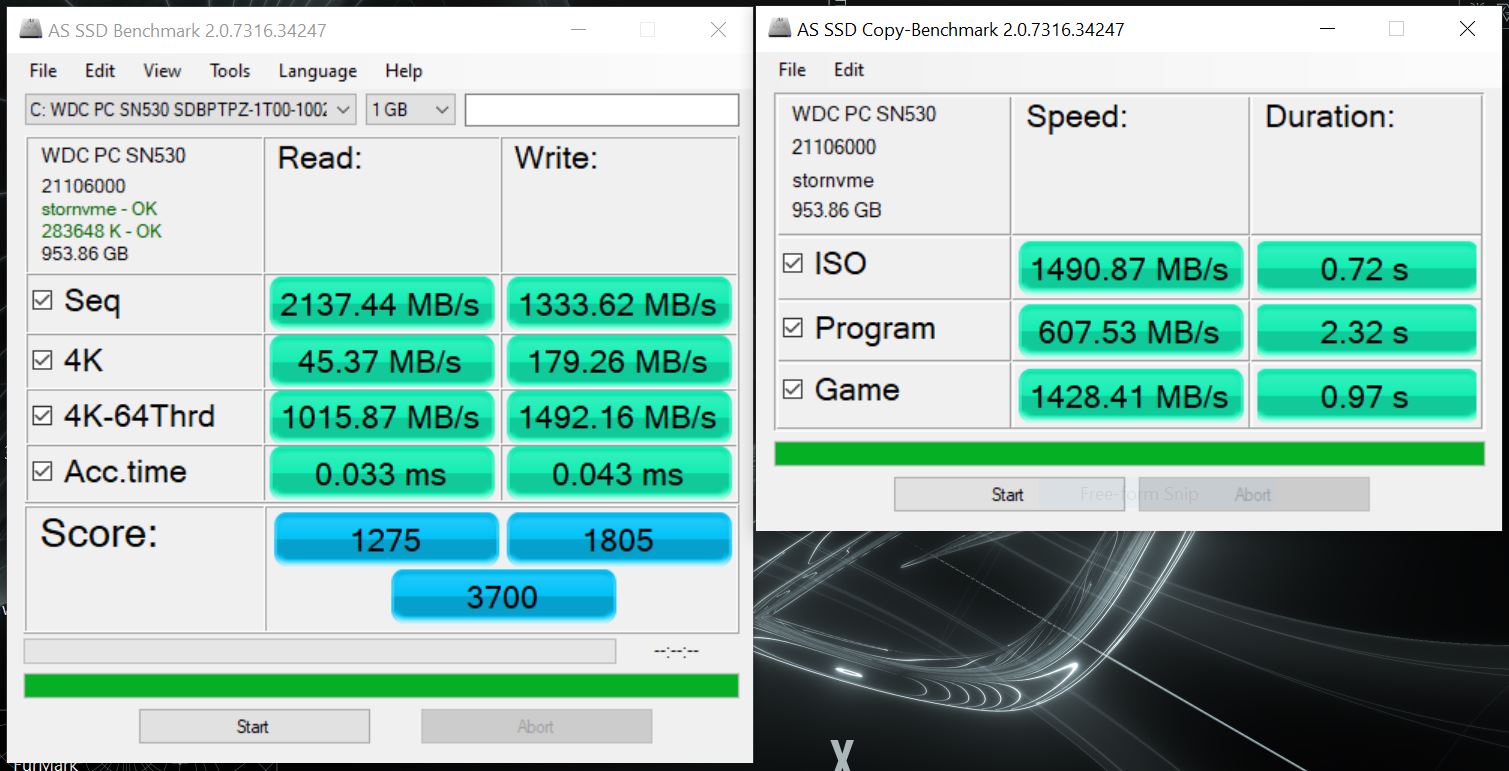
| AS SSD | -46% | -2% | -27% | -19% | -10% | -11% | |
| Seq Read (MB/s) | 2137 | 1707 -20% | 2188 2% | 2177 2% | 2071 -3% | 2726 28% | 2059 ? -4% |
| Seq Write (MB/s) | 1334 | 510 -62% | 1320 -1% | 813 -39% | 1462 10% | 1527 14% | 1812 ? 36% |
| 4K Read (MB/s) | 45.37 | 38.77 -15% | 53.5 18% | 53.2 17% | 49.82 10% | 45.44 0% | 37.4 ? -18% |
| 4K Write (MB/s) | 179.3 | 100.9 -44% | 123.7 -31% | 180 0% | 140.7 -22% | 152 -15% | 164.6 ? -8% |
| 4K-64 Read (MB/s) | 1016 | 630 -38% | 1010 -1% | 531 -48% | 869 -14% | 789 -22% | 765 ? -25% |
| 4K-64 Write (MB/s) | 1492 | 707 -53% | 1808 21% | 398.5 -73% | 729 -51% | 1345 -10% | 1431 ? -4% |
| Access Time Read * (ms) | 0.033 | 0.085 -158% | 0.055 -67% | 0.052 -58% | 0.069 -109% | 0.068 -106% | 0.0364 ? -10% |
| Access Time Write * (ms) | 0.043 | 0.035 19% | 0.076 -77% | 0.058 -35% | 0.028 35% | 0.028 35% | 0.07029 ? -63% |
| Score Read (Points) | 1275 | 839 -34% | 1282 1% | 802 -37% | 1126 -12% | 1107 -13% | 1008 ? -21% |
| Score Write (Points) | 1805 | 859 -52% | 2063 14% | 660 -63% | 1016 -44% | 1650 -9% | 1677 ? -7% |
| Score Total (Points) | 3700 | 2077 -44% | 3970 7% | 1822 -51% | 2700 -27% | 3274 -12% | 3337 ? -10% |
| Copy ISO MB/s (MB/s) | 1491 | 1644 10% | 1962 32% | 1574 6% | 1653 ? 11% | ||
| Copy Program MB/s (MB/s) | 608 | 920 51% | 522 -14% | 553 -9% | 528 ? -13% | ||
| Copy Game MB/s (MB/s) | 1428 | 1725 21% | 1258 -12% | 993 -30% | 1173 ? -18% | ||
| Totalt genomsnitt (program/inställningar) | -45% /
-45% | -1% /
-1% | -14% /
-18% | -10% /
-12% | -10% /
-9% | -6% /
-6% |
* ... mindre är bättre

DiskSpd Read Loop, Queue Depth 8
| 3DMark 11 Performance | 10920 poäng | |
| 3DMark Ice Storm Standard Score | 42185 poäng | |
| 3DMark Cloud Gate Standard Score | 23604 poäng | |
| 3DMark Fire Strike Score | 7784 poäng | |
| 3DMark Fire Strike Extreme Score | 3957 poäng | |
Hjälp | ||
| låg | med. | hög | ultra | QHD | |
|---|---|---|---|---|---|
| The Witcher 3 (2015) | 168 | 56.3 | 33 | ||
| Dota 2 Reborn (2015) | 132.5 | 120.1 | 110.8 | 105.6 | |
| Final Fantasy XV Benchmark (2018) | 91.2 | 45.7 | 33.1 | 23.4 | |
| X-Plane 11.11 (2018) | 88.1 | 77.6 | 64.4 | ||
| Far Cry 5 (2018) | 47 | 24 | 22 | 21 | |
| Far Cry New Dawn (2019) | 39 | 21 | 20 | 19 |
Ljudnivå
| Låg belastning |
| 30.5 / 30.5 / 32.1 dB(A) |
| Hög belastning |
| 43 / 41.3 dB(A) |
 | ||
30 dB tyst 40 dB(A) hörbar 50 dB(A) högt ljud |
||
min: | ||
(-) Den maximala temperaturen på ovansidan är 51.8 °C / 125 F, jämfört med genomsnittet av 35.4 °C / 96 F , allt från 19.6 till 60 °C för klassen Convertible.
(-) Botten värms upp till maximalt 52.8 °C / 127 F, jämfört med genomsnittet av 36.9 °C / 98 F
(±) Vid tomgångsbruk är medeltemperaturen för ovansidan 33.6 °C / 92 F, jämfört med enhetsgenomsnittet på 30.3 °C / ### class_avg_f### F.
(-) När du spelar The Witcher 3 är medeltemperaturen för ovansidan 40.2 °C / 104 F, jämfört med enhetsgenomsnittet på 30.3 °C / ## #class_avg_f### F.
(+) Handledsstöden och pekplattan når maximal hudtemperatur (33.3 °C / 91.9 F) och är därför inte varma.
(-) Medeltemperaturen för handledsstödsområdet på liknande enheter var 28 °C / 82.4 F (-5.3 °C / -9.5 F).
Asus ROG Flow X13 GV301QH ljudanalys
(-) | inte särskilt höga högtalare (61.3 dB)
Bas 100 - 315 Hz
(±) | reducerad bas - i genomsnitt 10.8% lägre än medianen
(-) | basen är inte linjär (18.2% delta till föregående frekvens)
Mellan 400 - 2000 Hz
(+) | balanserad mellan - endast 4.8% från medianen
(+) | mids är linjära (6% delta till föregående frekvens)
Högsta 2 - 16 kHz
(+) | balanserade toppar - endast 3% från medianen
(±) | linjäriteten för toppar är genomsnittlig (9.9% delta till föregående frekvens)
Totalt 100 - 16 000 Hz
(±) | linjäriteten för det totala ljudet är genomsnittlig (20.8% skillnad mot median)
Jämfört med samma klass
» 55% av alla testade enheter i den här klassen var bättre, 10% liknande, 35% sämre
» Den bästa hade ett delta på 6%, genomsnittet var 20%, sämst var 57%
Jämfört med alla testade enheter
» 56% av alla testade enheter var bättre, 8% liknande, 36% sämre
» Den bästa hade ett delta på 4%, genomsnittet var 24%, sämst var 134%
Lenovo Yoga 9i 14ITL5 ljudanalys
(+) | högtalare kan spela relativt högt (88.8 dB)
Bas 100 - 315 Hz
(±) | reducerad bas - i genomsnitt 9.4% lägre än medianen
(±) | linjäriteten för basen är genomsnittlig (8.7% delta till föregående frekvens)
Mellan 400 - 2000 Hz
(+) | balanserad mellan - endast 3.7% från medianen
(+) | mids är linjära (3.6% delta till föregående frekvens)
Högsta 2 - 16 kHz
(+) | balanserade toppar - endast 3% från medianen
(+) | toppar är linjära (4% delta till föregående frekvens)
Totalt 100 - 16 000 Hz
(+) | det totala ljudet är linjärt (9.5% skillnad mot median)
Jämfört med samma klass
» 5% av alla testade enheter i den här klassen var bättre, 1% liknande, 94% sämre
» Den bästa hade ett delta på 6%, genomsnittet var 20%, sämst var 57%
Jämfört med alla testade enheter
» 4% av alla testade enheter var bättre, 1% liknande, 95% sämre
» Den bästa hade ett delta på 4%, genomsnittet var 24%, sämst var 134%
| Av/Standby | |
| Låg belastning | |
| Hög belastning |
|
Förklaring:
min: | |
| Asus ROG Flow X13 GV301QH R9 5980HS, GeForce GTX 1650 Max-Q, WDC PC SN530 SDBPNPZ-1T00, IPS, 3840x2400, 13.4" | HP Spectre x360 14t-ea000 i7-1165G7, Iris Xe G7 96EUs, Samsung SSD PM981a MZVLB512HBJQ, IPS, 1920x1280, 13.5" | Lenovo Yoga 9i 14ITL5 i5-1135G7, Iris Xe G7 80EUs, Samsung SSD PM981a MZVLB256HBHQ, IPS, 1920x1080, 14" | Acer Spin 5 SP513-54N-79EY i7-1065G7, Iris Plus Graphics G7 (Ice Lake 64 EU), Samsung PM991 MZVLQ1T0HALB, IPS, 2256x1504, 13.5" | Asus ZenBook Flip S UX371 i7-1165G7, Iris Xe G7 96EUs, WDC PC SN730 SDBPNTY-1T00, OLED, 3840x2160, 13.3" | Microsoft Surface Book 3 13.5 i7-1065G7, GeForce GTX 1650 Max-Q, SK Hynix BC501 HFM512GDJTNG, IPS, 3000x2000, 13.5" | Genomsnitt NVIDIA GeForce GTX 1650 Max-Q | Genomsnitt av klass Convertible | |
|---|---|---|---|---|---|---|---|---|
| Power Consumption | 47% | 40% | 52% | 17% | 10% | -16% | 33% | |
| Idle Minimum * (Watt) | 7.4 | 3 59% | 3.3 55% | 2.8 62% | 6.1 18% | 4.8 35% | 7.75 ? -5% | 4.24 ? 43% |
| Idle Average * (Watt) | 10.3 | 5.1 50% | 6.7 35% | 5.4 48% | 10.6 -3% | 9.4 9% | 11.8 ? -15% | 7.03 ? 32% |
| Idle Maximum * (Watt) | 13.4 | 6.4 52% | 6.9 49% | 7.6 43% | 13.8 -3% | 11.2 16% | 16.6 ? -24% | 8.61 ? 36% |
| Load Average * (Watt) | 75.9 | 39.6 48% | 41.4 45% | 36.6 52% | 32.2 58% | 72 5% | 75.2 ? 1% | 43.9 ? 42% |
| Load Maximum * (Watt) | 78 | 56.2 28% | 64.7 17% | 37 53% | 64.7 17% | 90 -15% | 105.5 ? -35% | 67.2 ? 14% |
| Witcher 3 ultra * (Watt) | 39.6 | 39.3 | 28.3 |
* ... mindre är bättre
| Asus ROG Flow X13 GV301QH R9 5980HS, GeForce GTX 1650 Max-Q, 62 Wh | HP Spectre x360 14t-ea000 i7-1165G7, Iris Xe G7 96EUs, 66 Wh | Lenovo Yoga 9i 14ITL5 i5-1135G7, Iris Xe G7 80EUs, 60 Wh | Acer Spin 5 SP513-54N-79EY i7-1065G7, Iris Plus Graphics G7 (Ice Lake 64 EU), 55 Wh | Asus ZenBook Flip S UX371 i7-1165G7, Iris Xe G7 96EUs, 67 Wh | Microsoft Surface Book 3 13.5 i7-1065G7, GeForce GTX 1650 Max-Q, 69 Wh | Genomsnitt av klass Convertible | |
|---|---|---|---|---|---|---|---|
| Batteridrifttid | 129% | 109% | 72% | 33% | 48% | 99% | |
| Reader / Idle (h) | 10.4 | 36.4 250% | 37.7 263% | 21.7 109% | 16.5 59% | 27.7 ? 166% | |
| H.264 (h) | 6.9 | 10.5 52% | 8.7 26% | 15.3 ? 122% | |||
| WiFi v1.3 (h) | 5.8 | 11.8 103% | 9.9 71% | 10.8 86% | 6.7 16% | 6.6 14% | 12.1 ? 109% |
| Load (h) | 1.8 | 2.4 33% | 1.7 -6% | 2.5 39% | 2.8 56% | 3.1 72% | 1.779 ? -1% |

För
Emot
Omdöme - Kraftfull och utan like
Läs den fullständiga versionen av den här recensionen på engelska här.
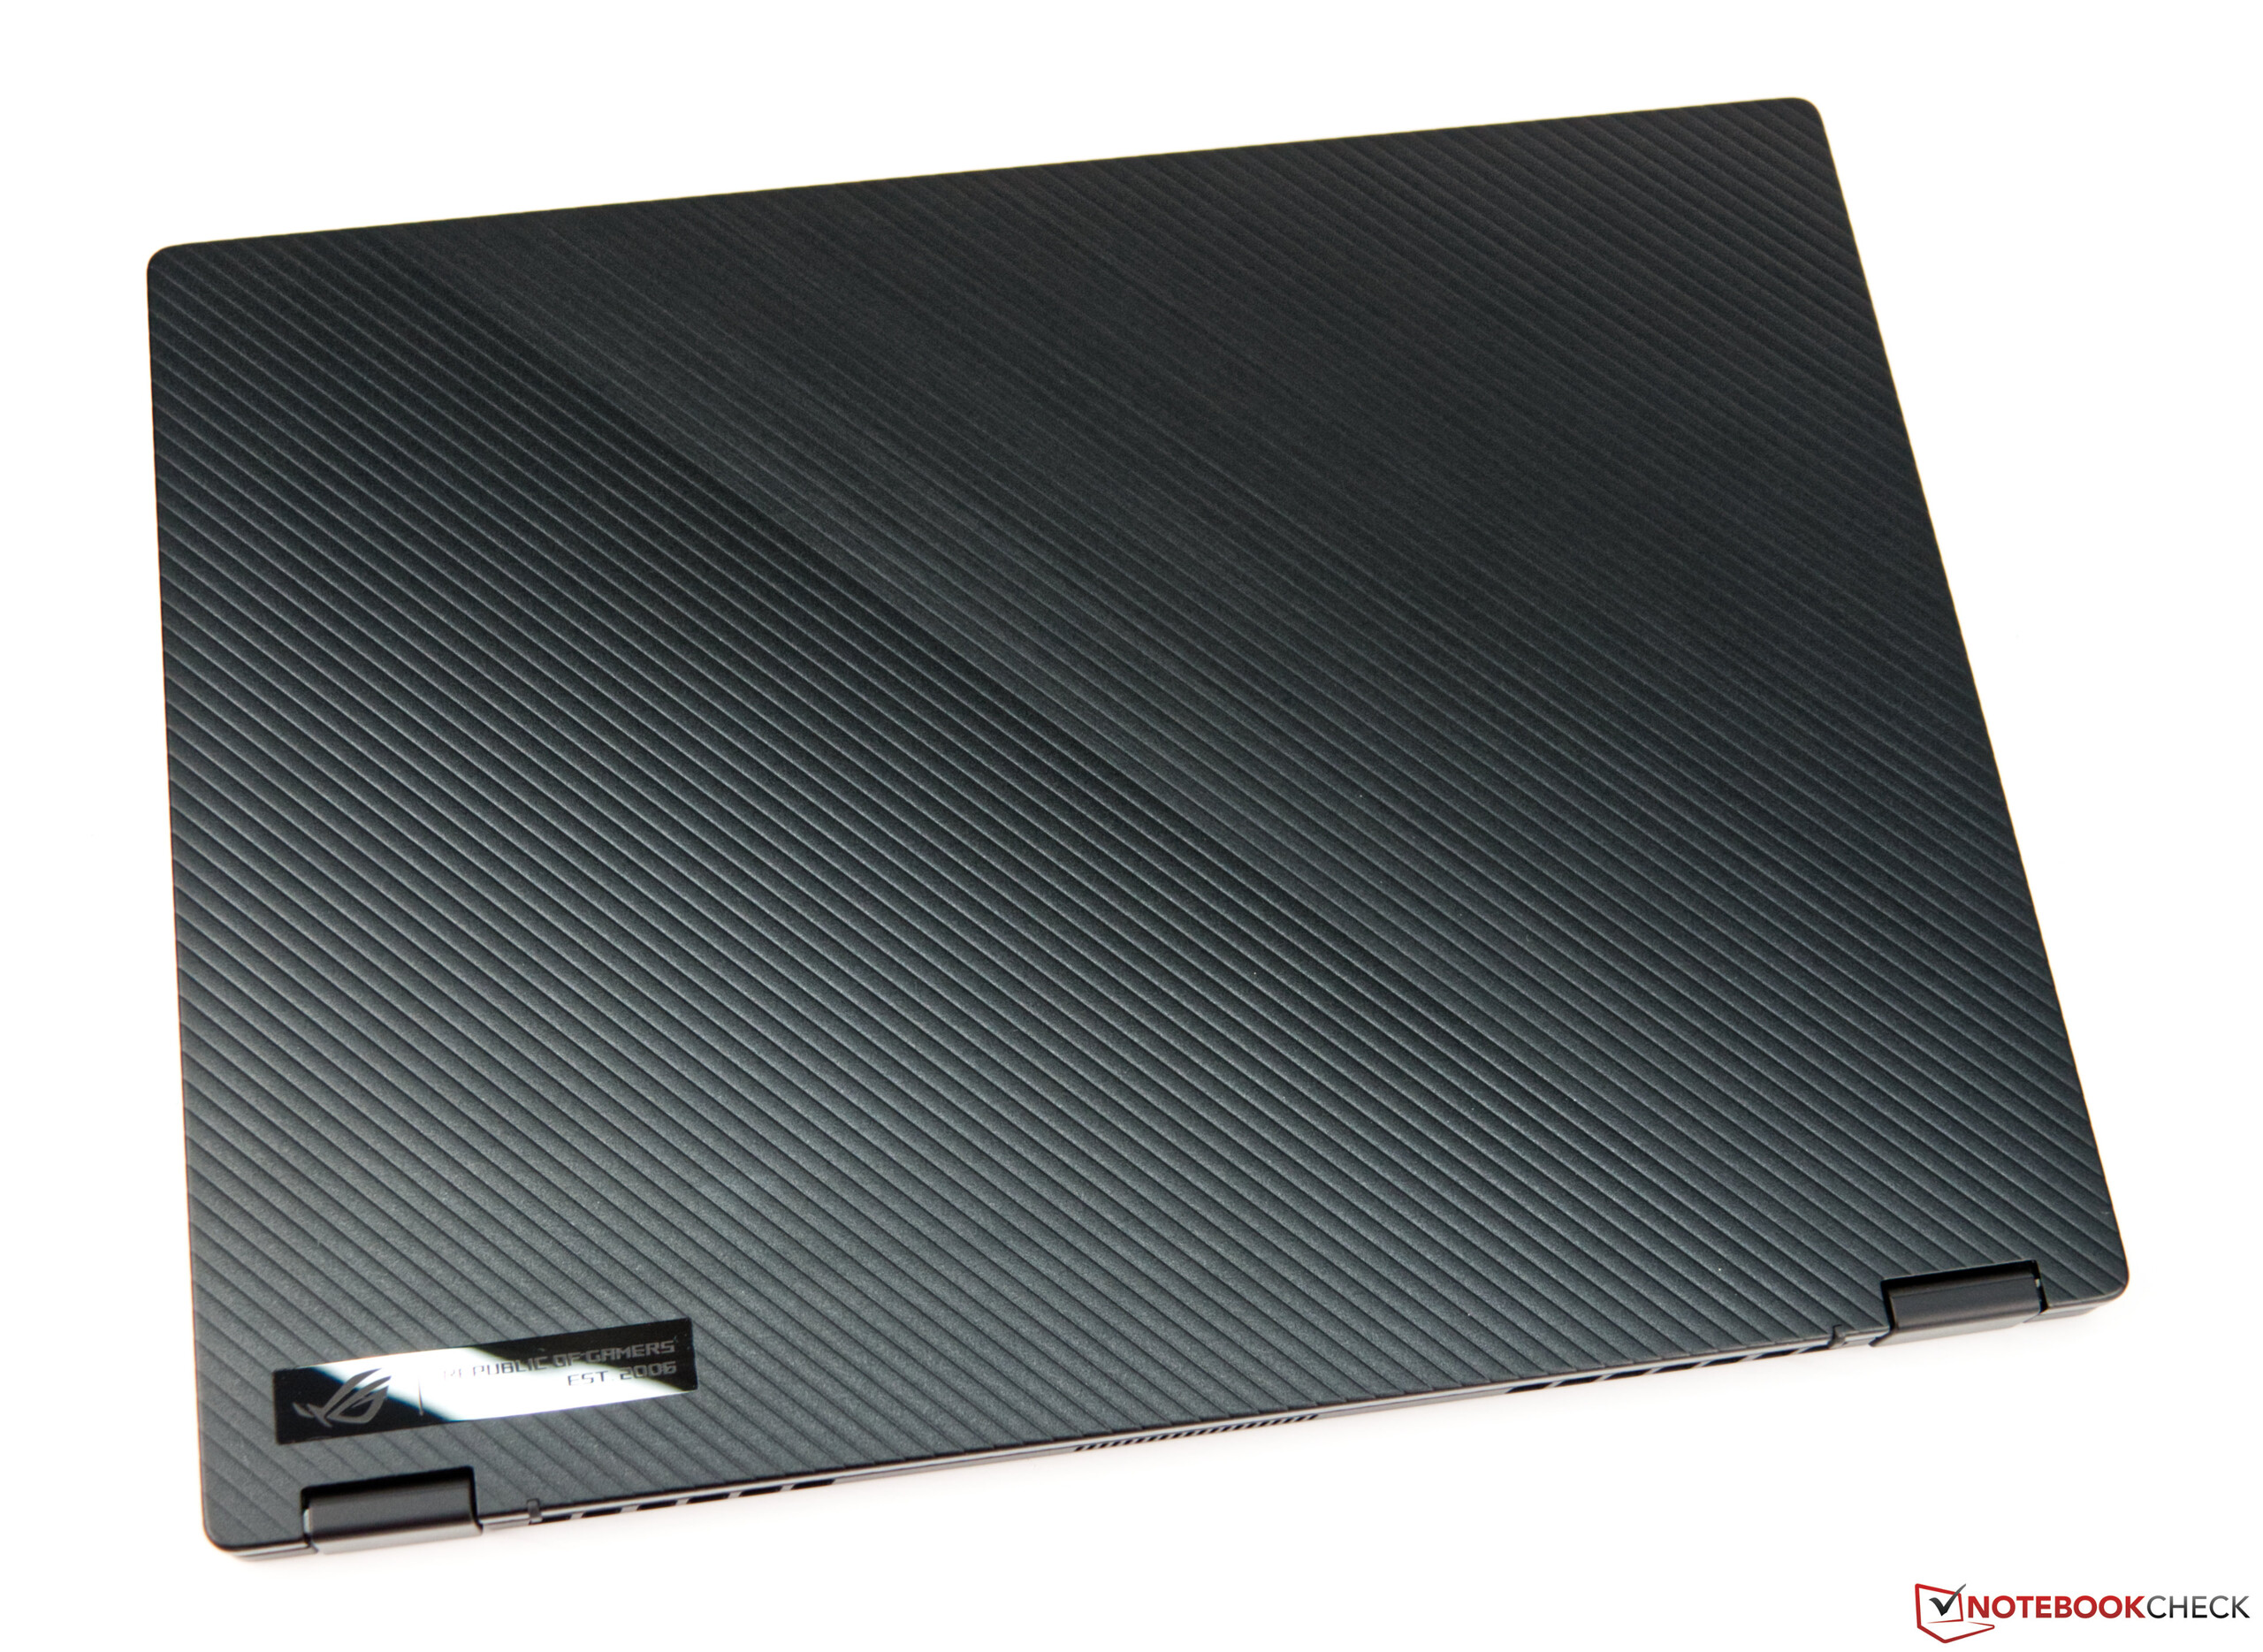
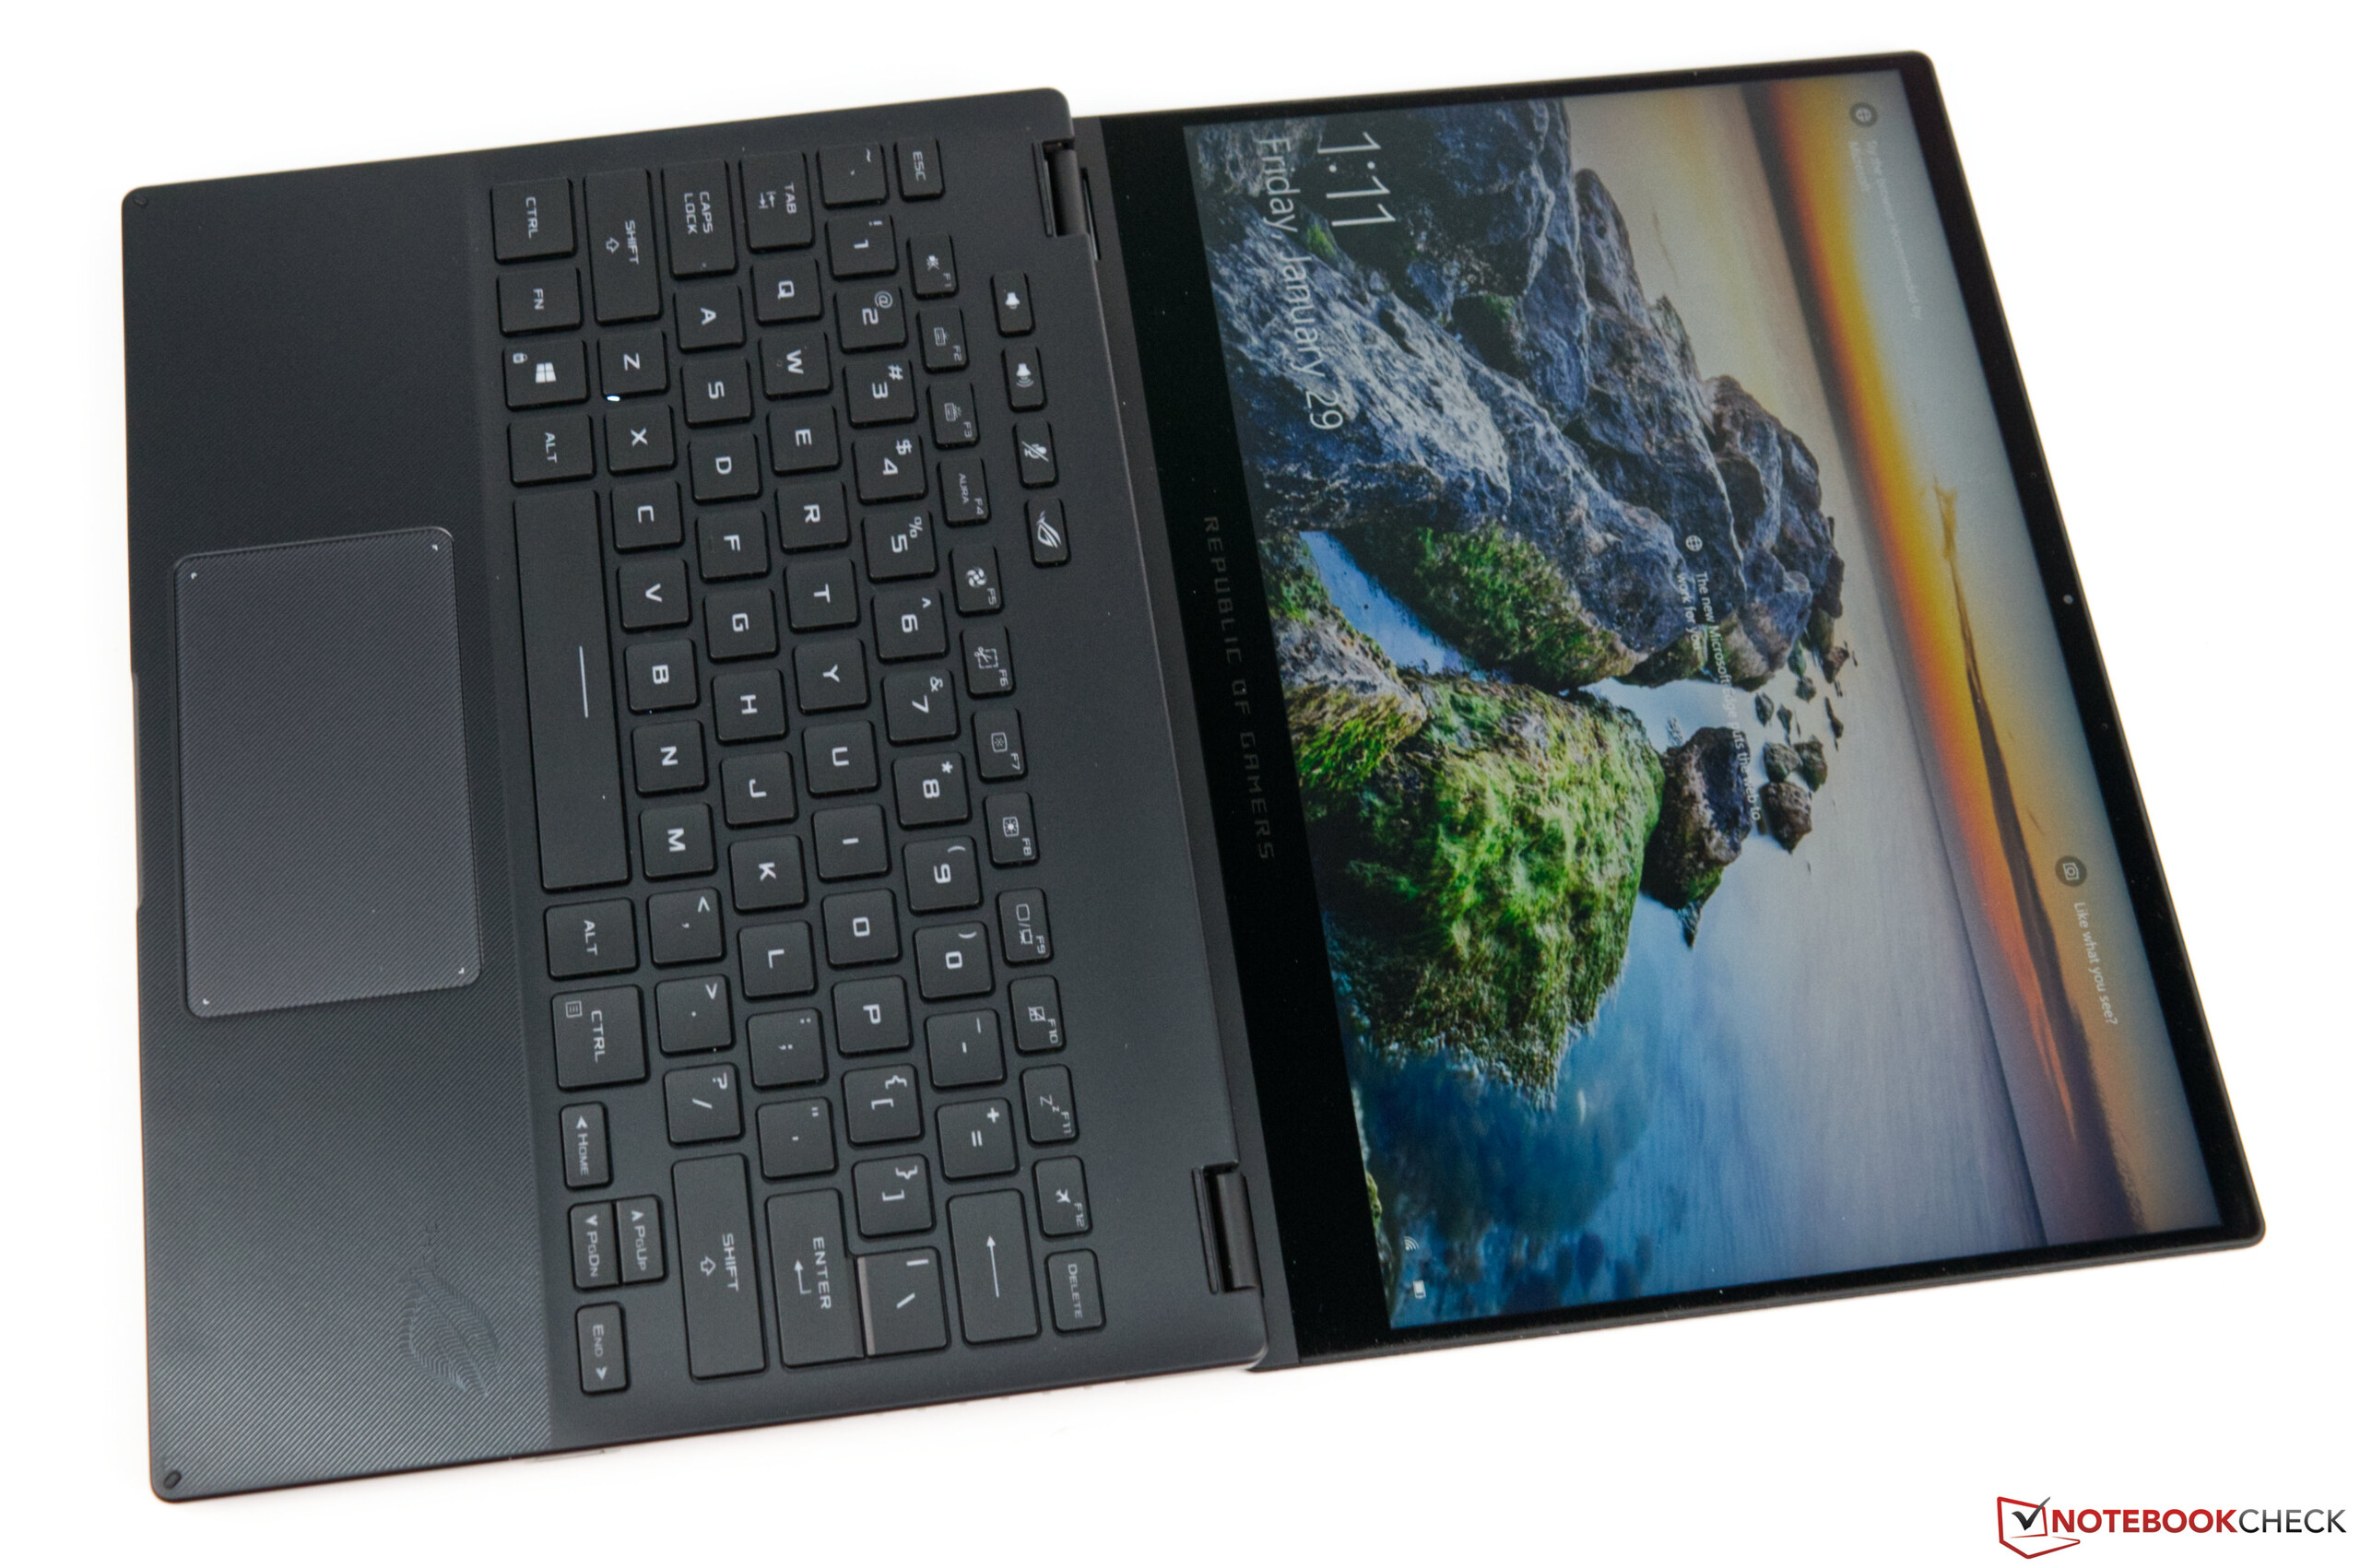
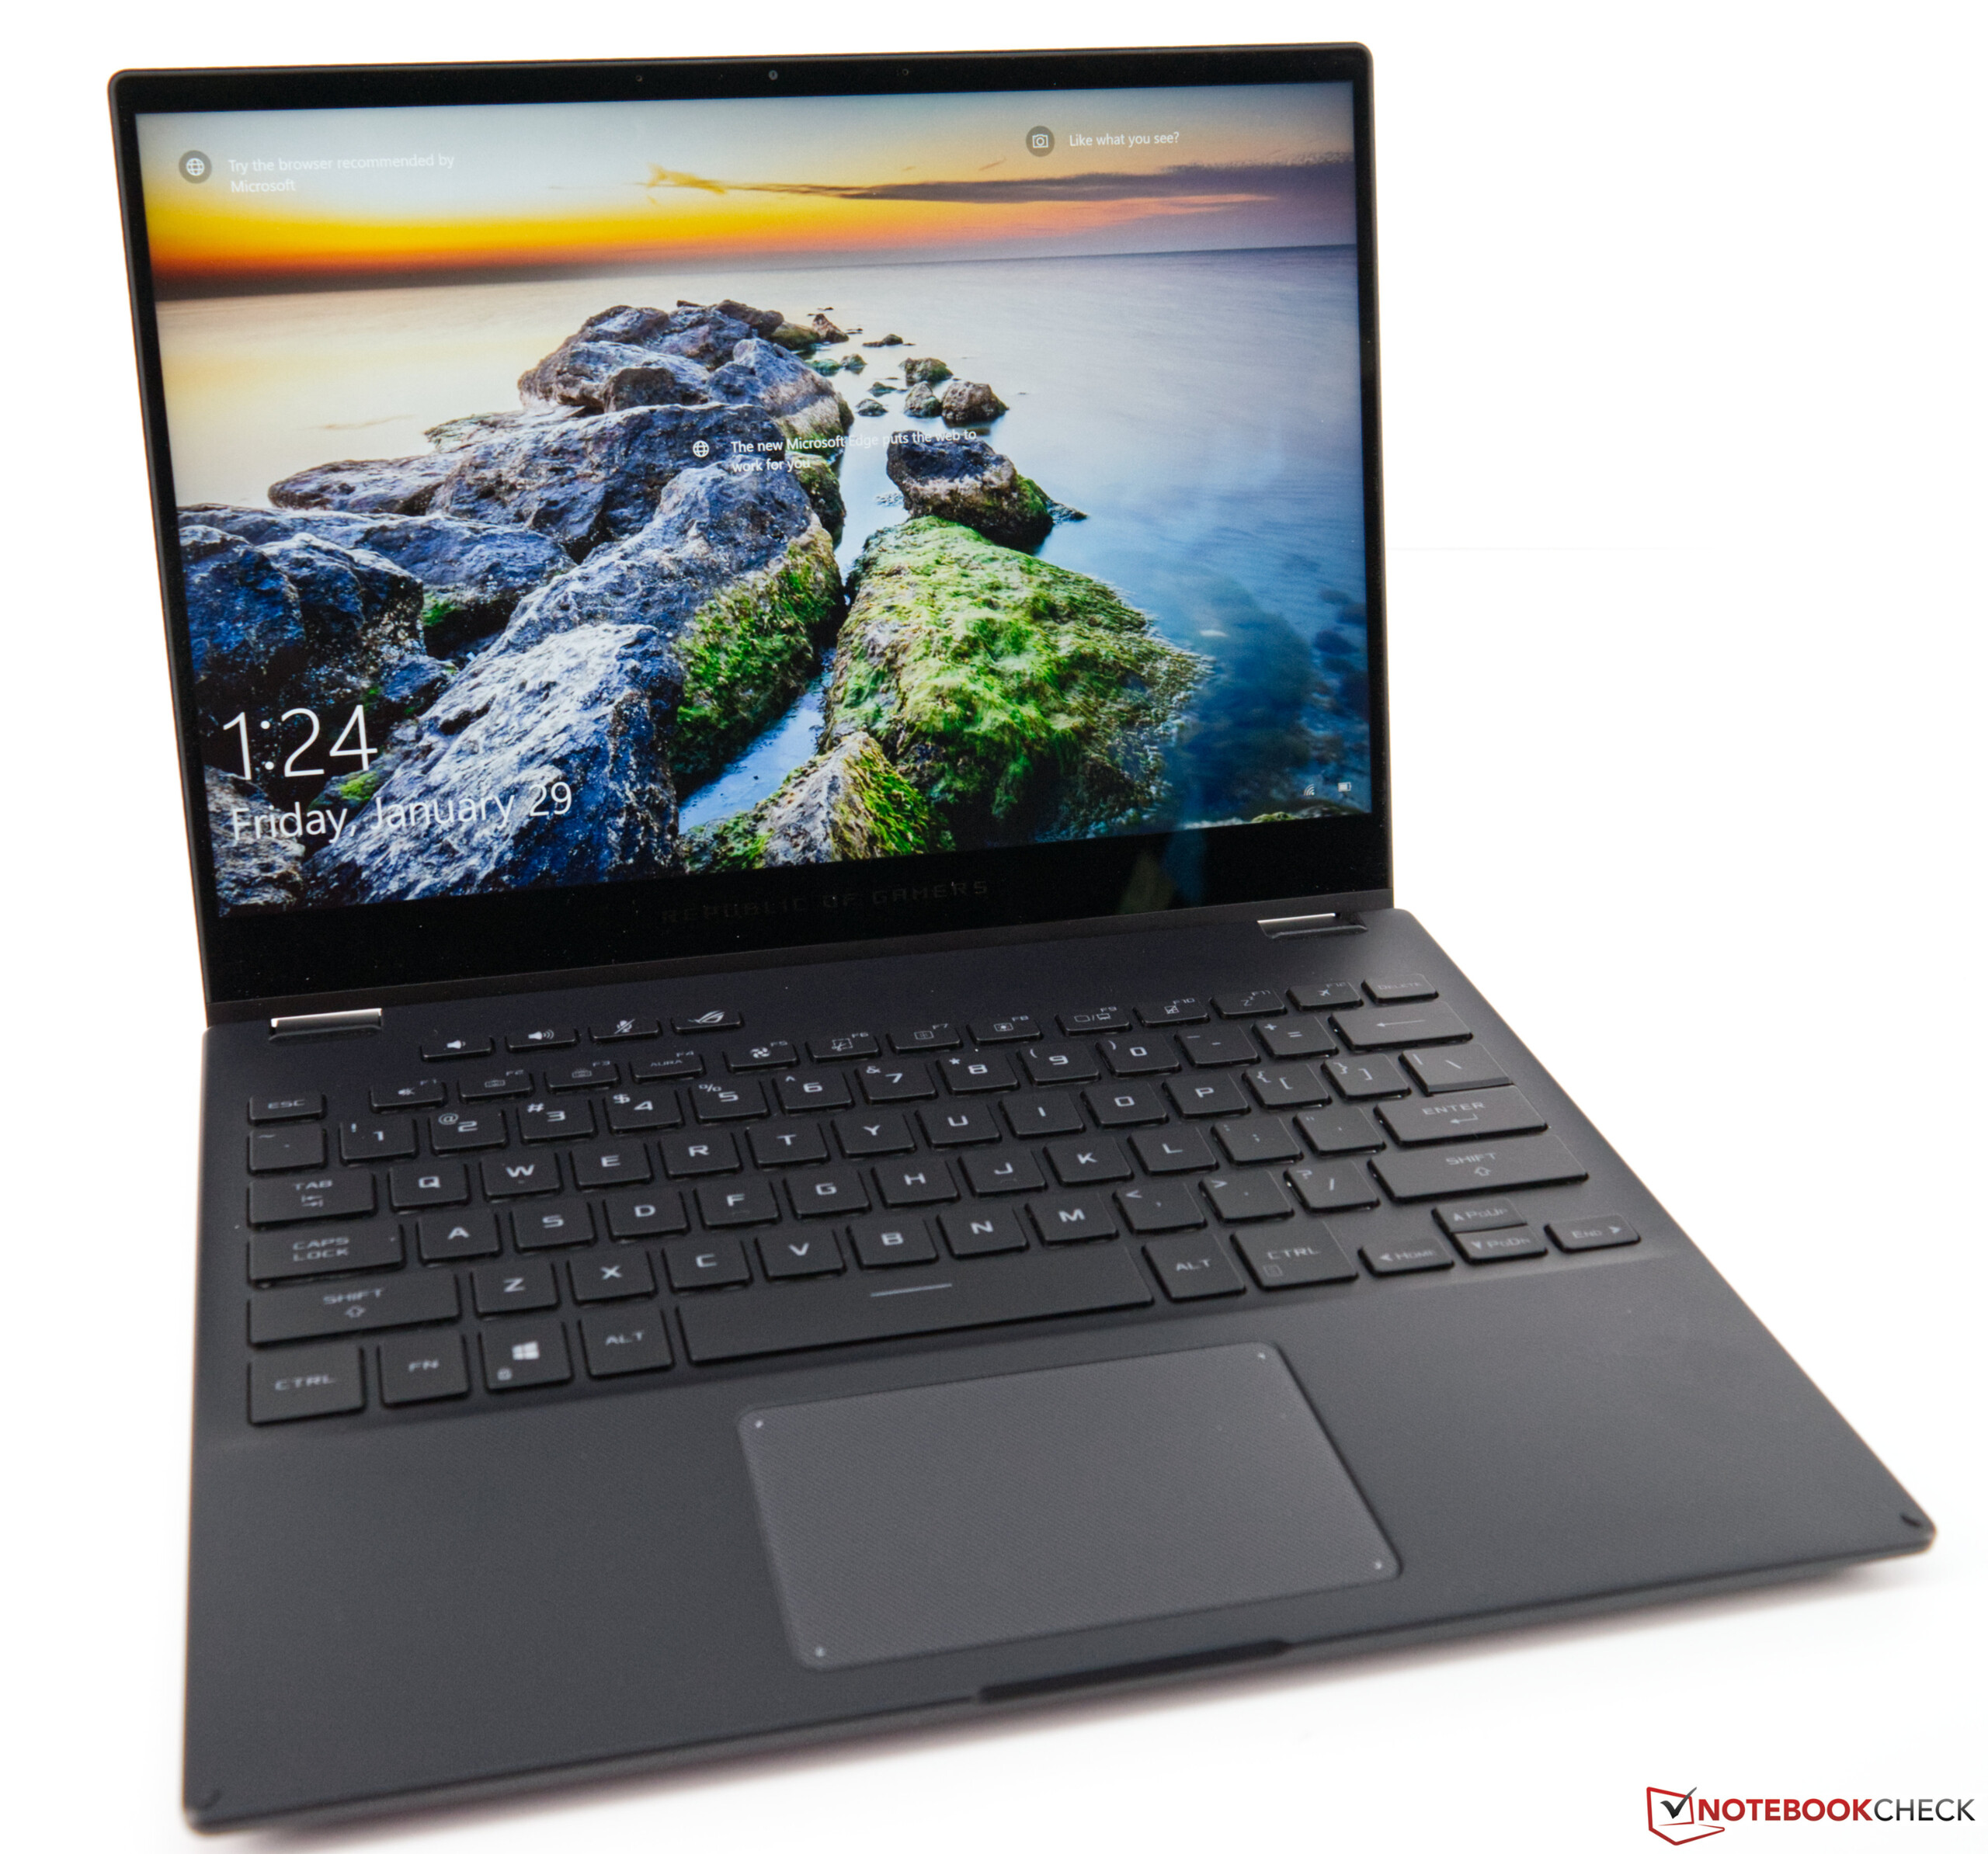
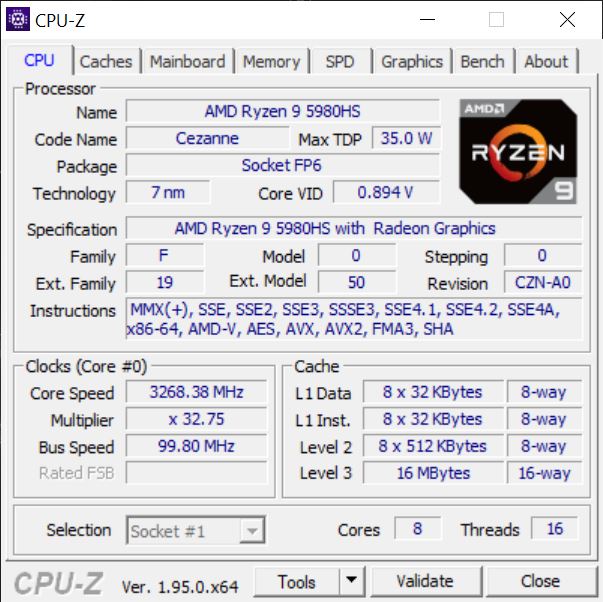
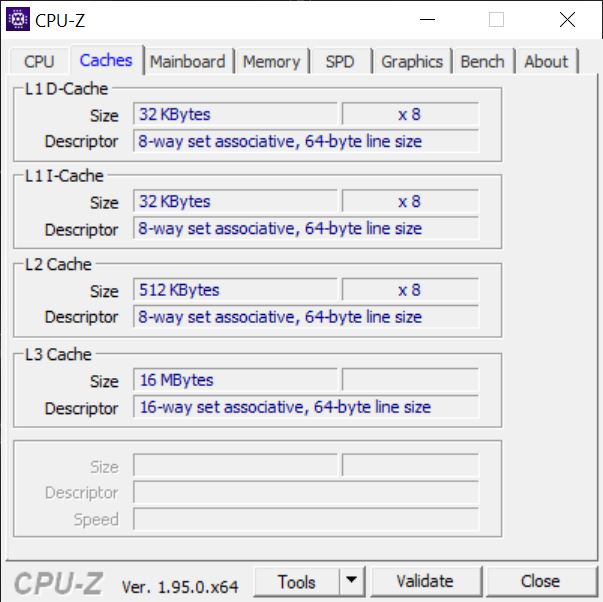
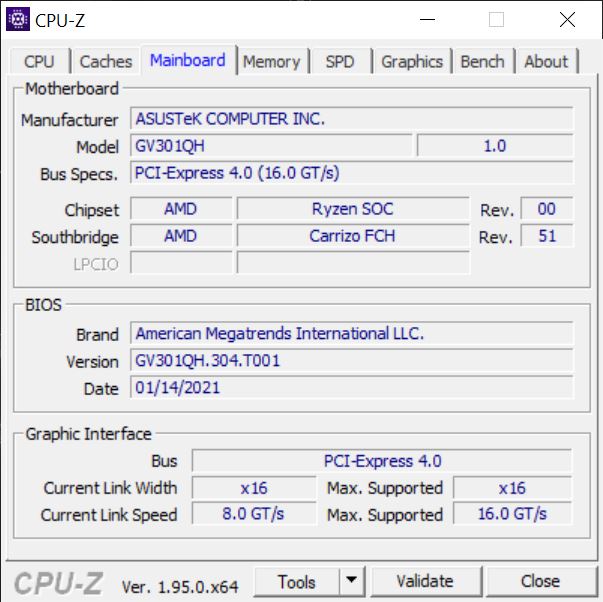
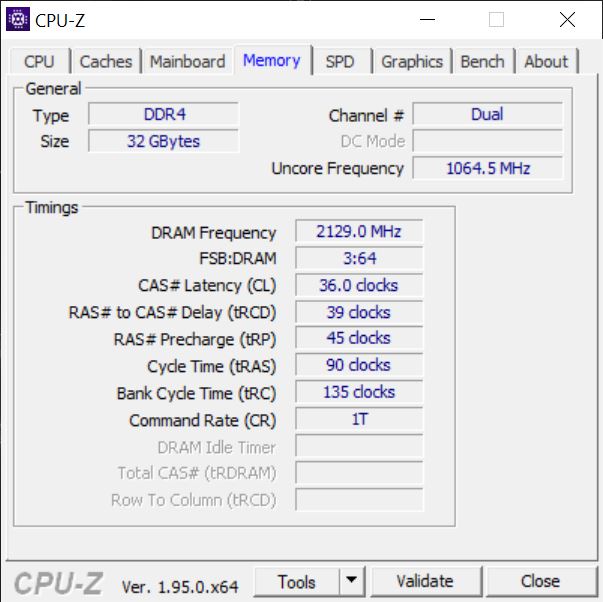
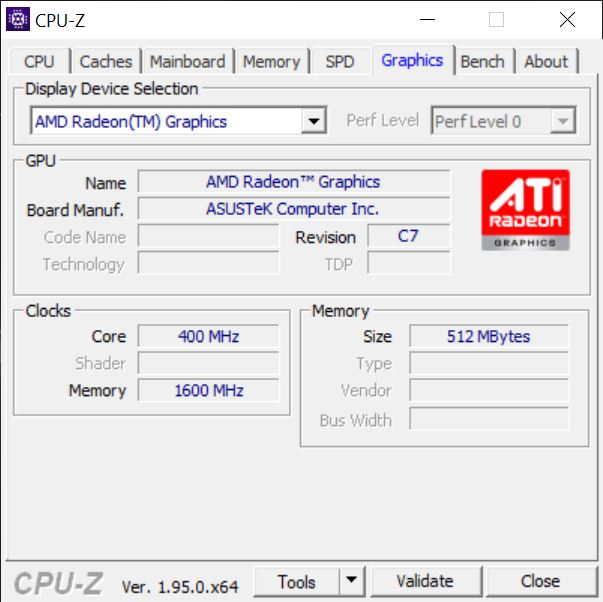
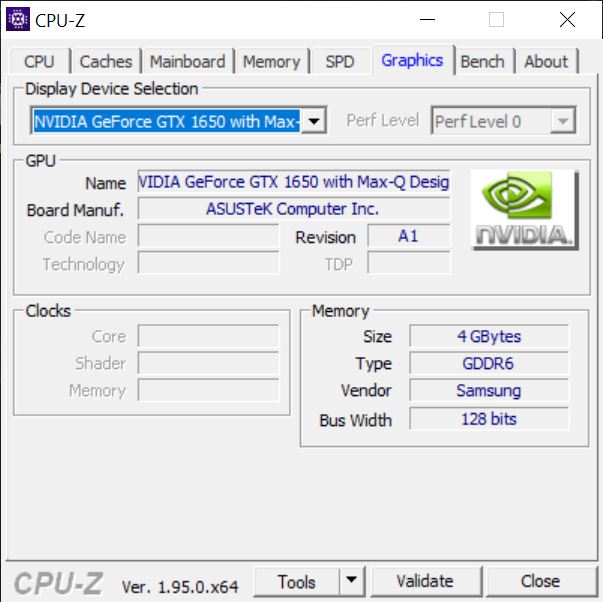
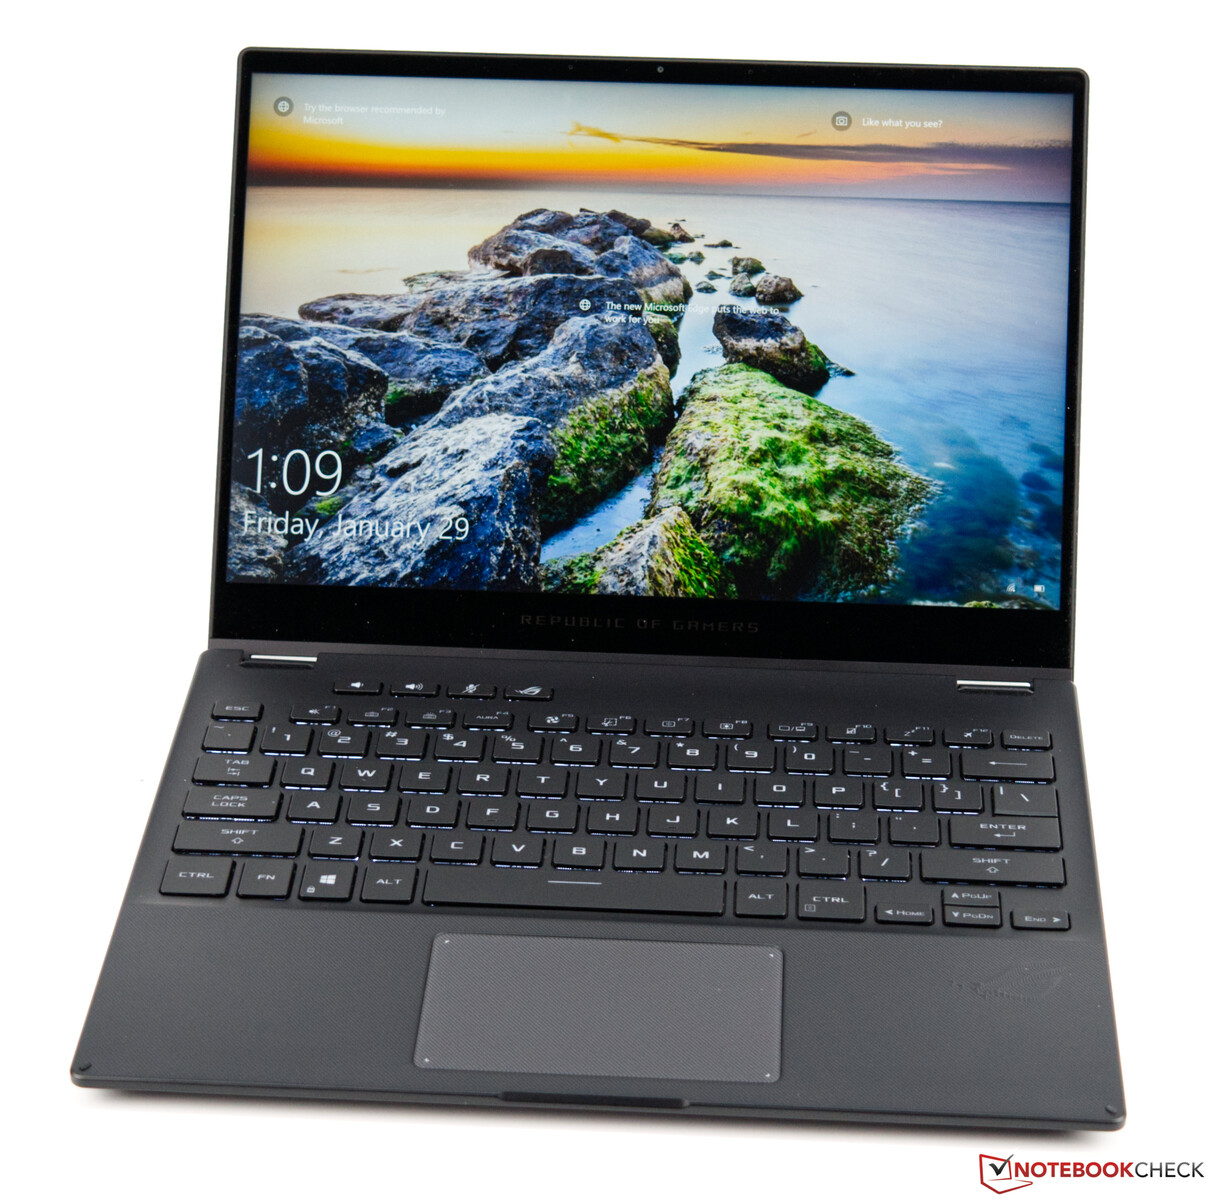
Asus ROG Flow X13 är inte en vanlig omvandlingsbar. Detta blir snabbt tydligt när man tar en närmare titt på de tekniska specifikationerna. De ser inte bara bra ut på pappret utan vi kunde också bekräfta dem i vårt test. AMD Ryzen 9 5980HS är en avancerad SoC med 8 kärnor och 16 trådar, vilket också gör denna 2-i-1 intressant som arbetsenhet. Med 32 GB RAM och en SSD-enhet på 1 TB klarar sig också gamers bra. En dedikerad Nvidia GeForce GTX 1650 Max-Q GPU passar också bra in i helheten och garanterar gedigen 3D-prestanda. Med eGPU-dockan, som innehåller ett GeForce RTX 3080, förvandlas den omvandlingsbara datorn till en fullfjädrad desktop-ersättning i fråga om prestanda.
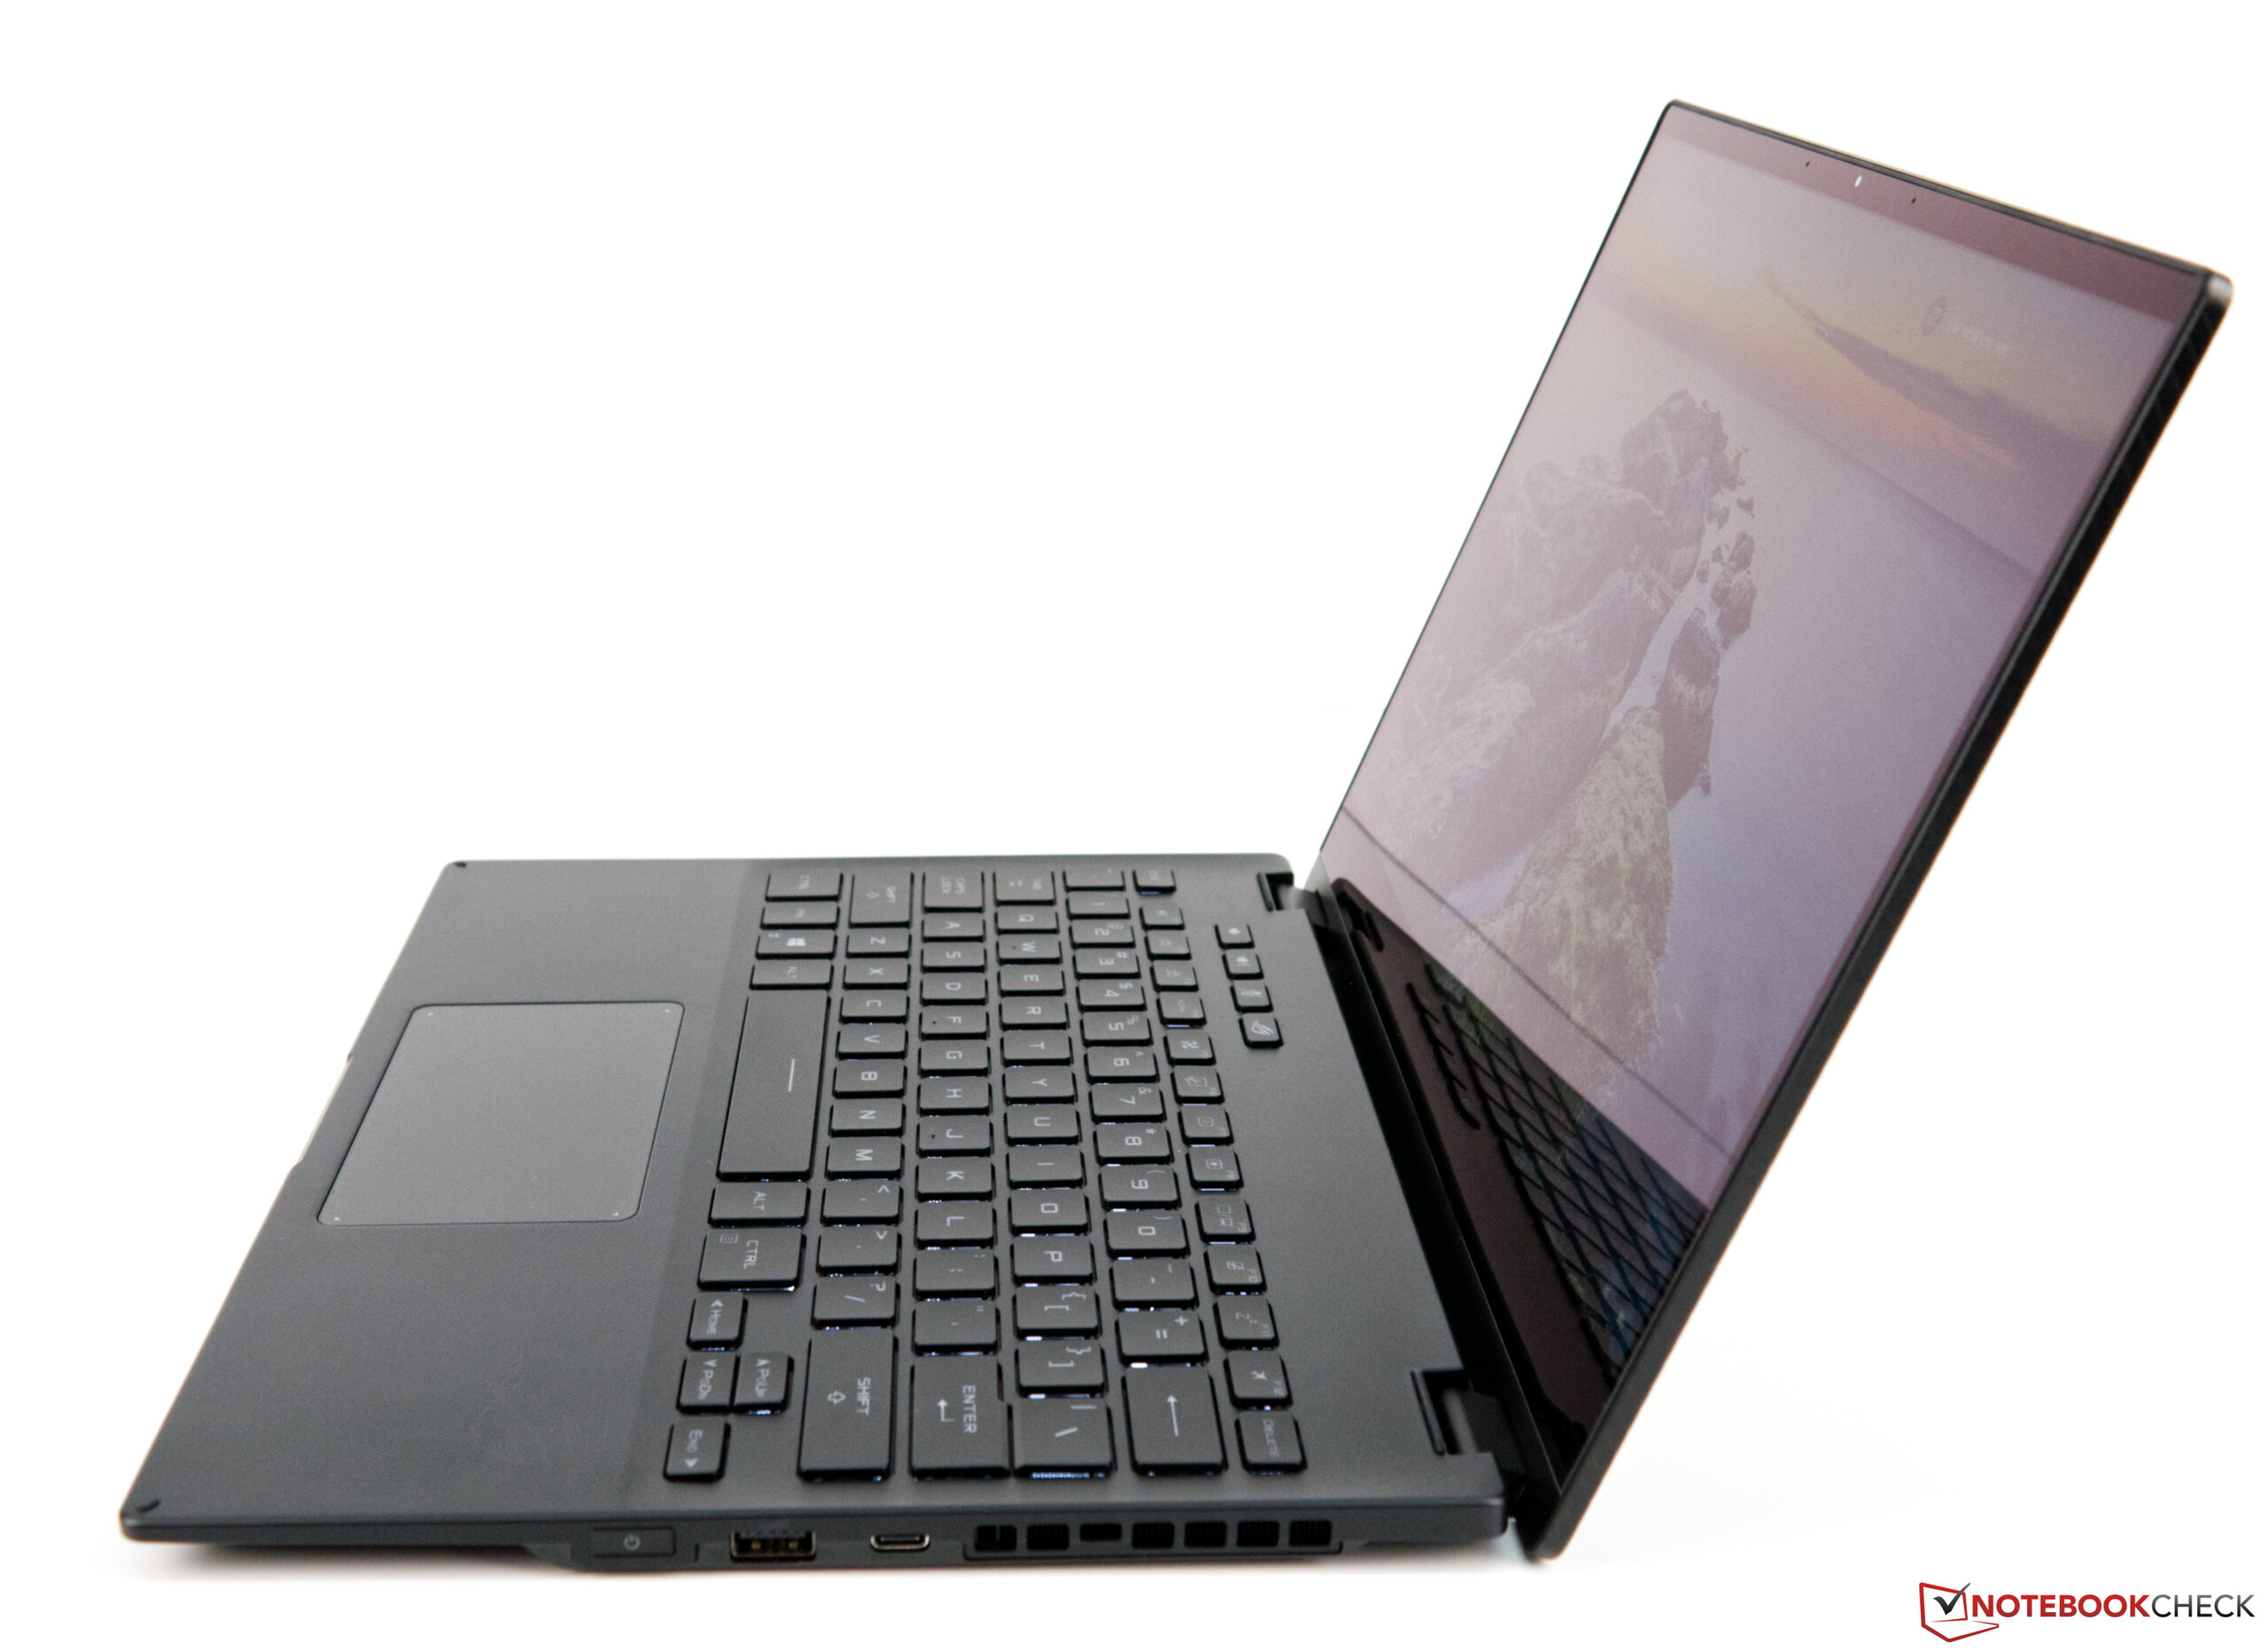
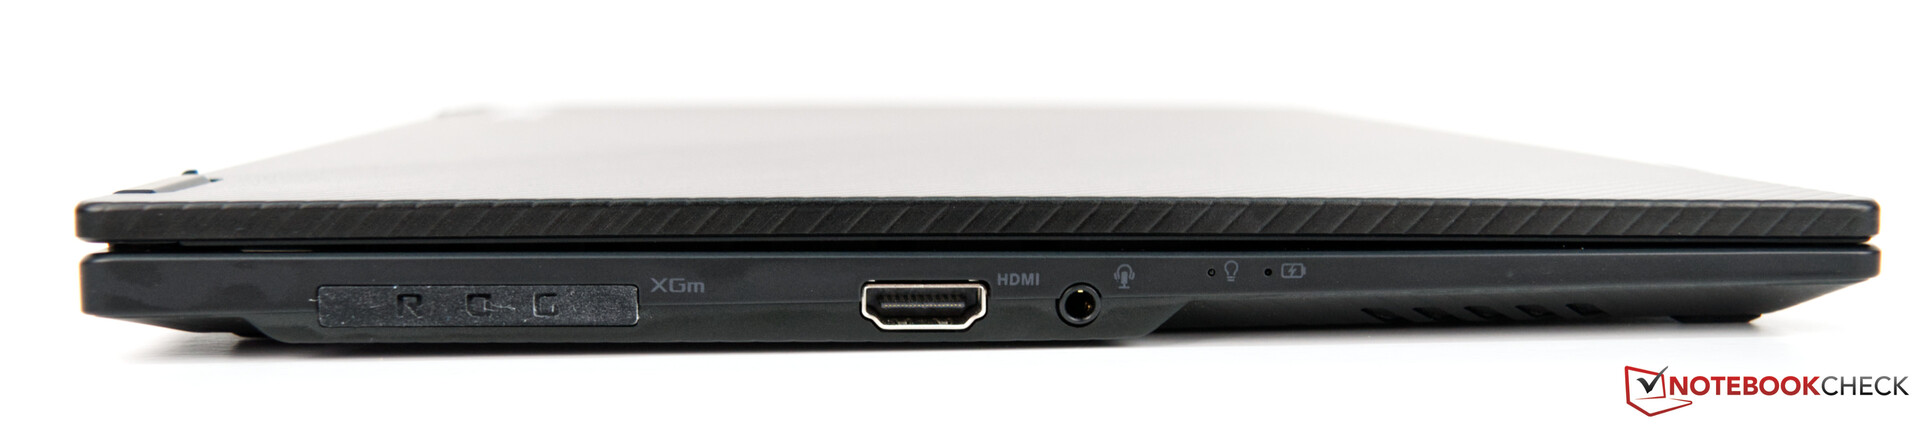
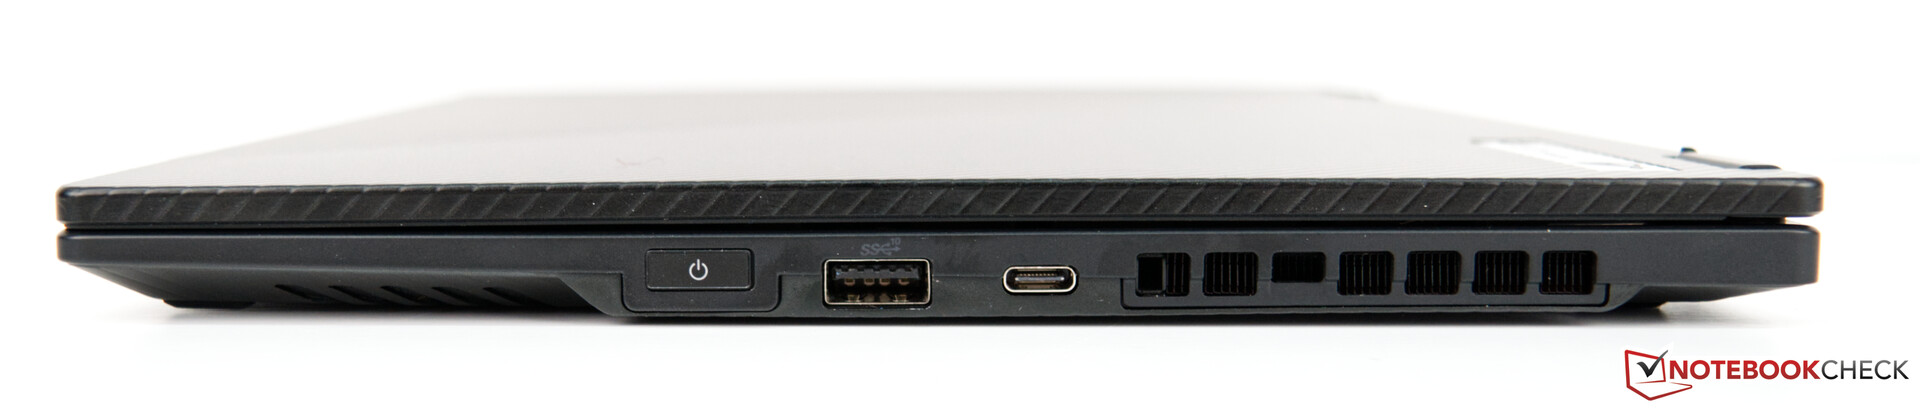
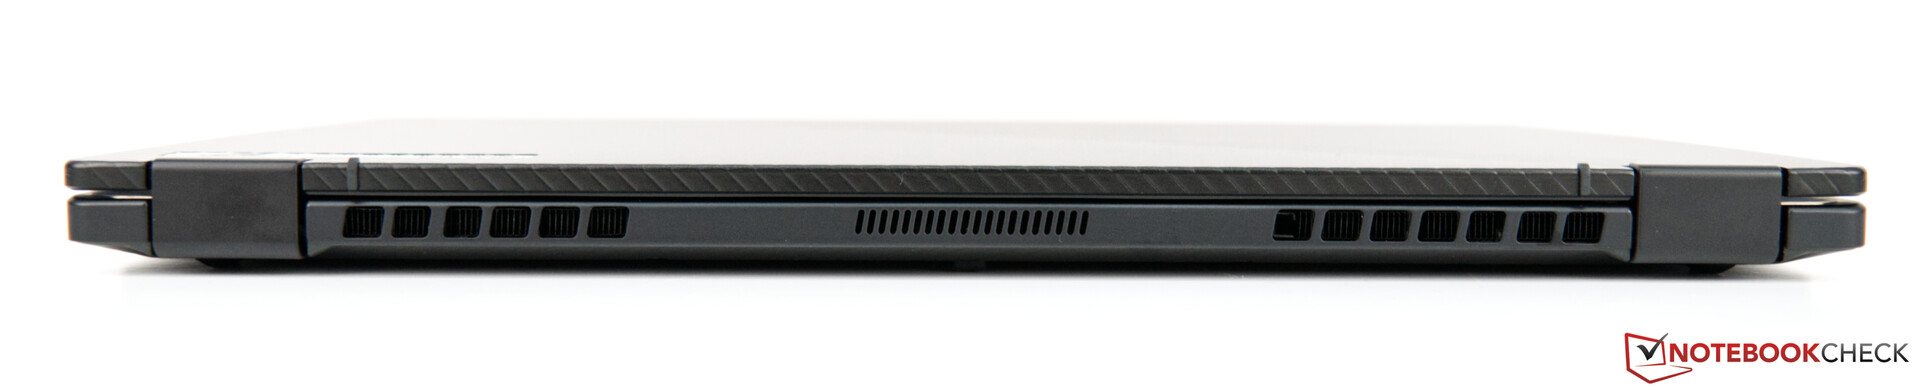
Det finns heller inget att klaga på när det kommer till konstruktionskvaliteten. Men de tillgängliga portarna kan nog vara för få, för de tre USB-portarna går snabbt åt. Dessutom är en Typ C-port oftast redan i bruk på grund av nätadaptern.
Asus ROG Flow X13 är en blixtsnabb AMD-baserad omvandlingsbar med riktigt avancerad grafik som tillval.
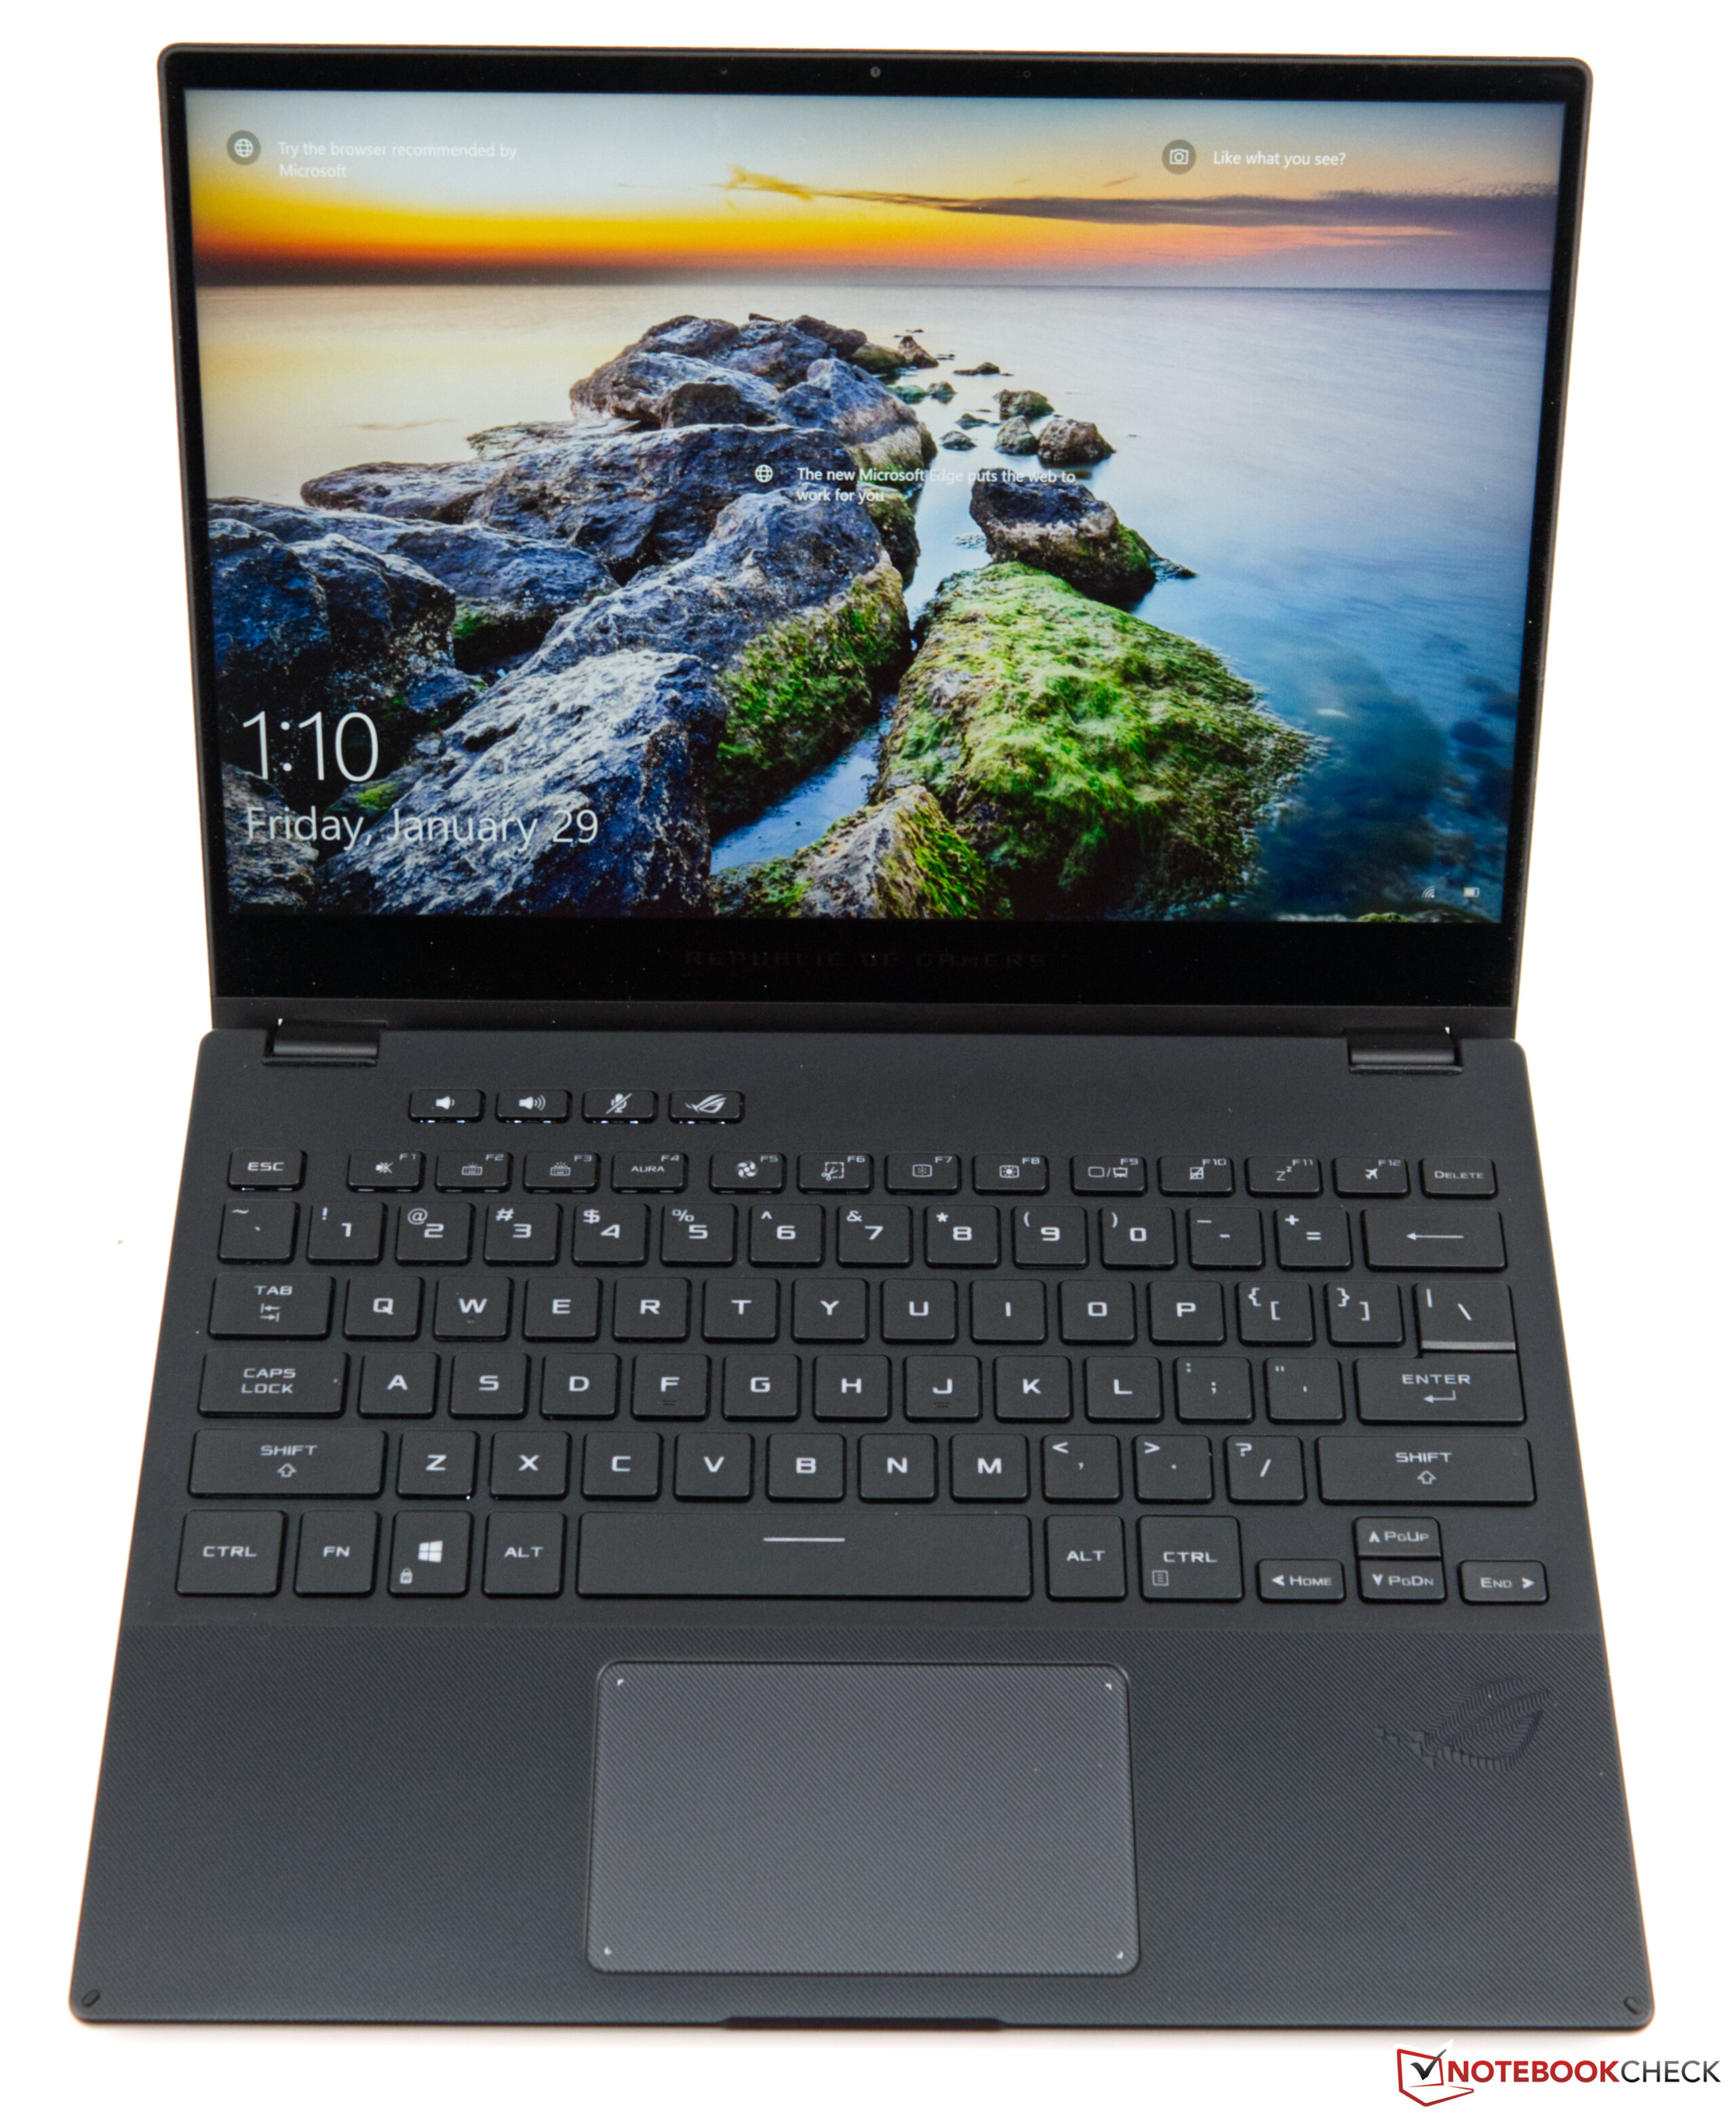
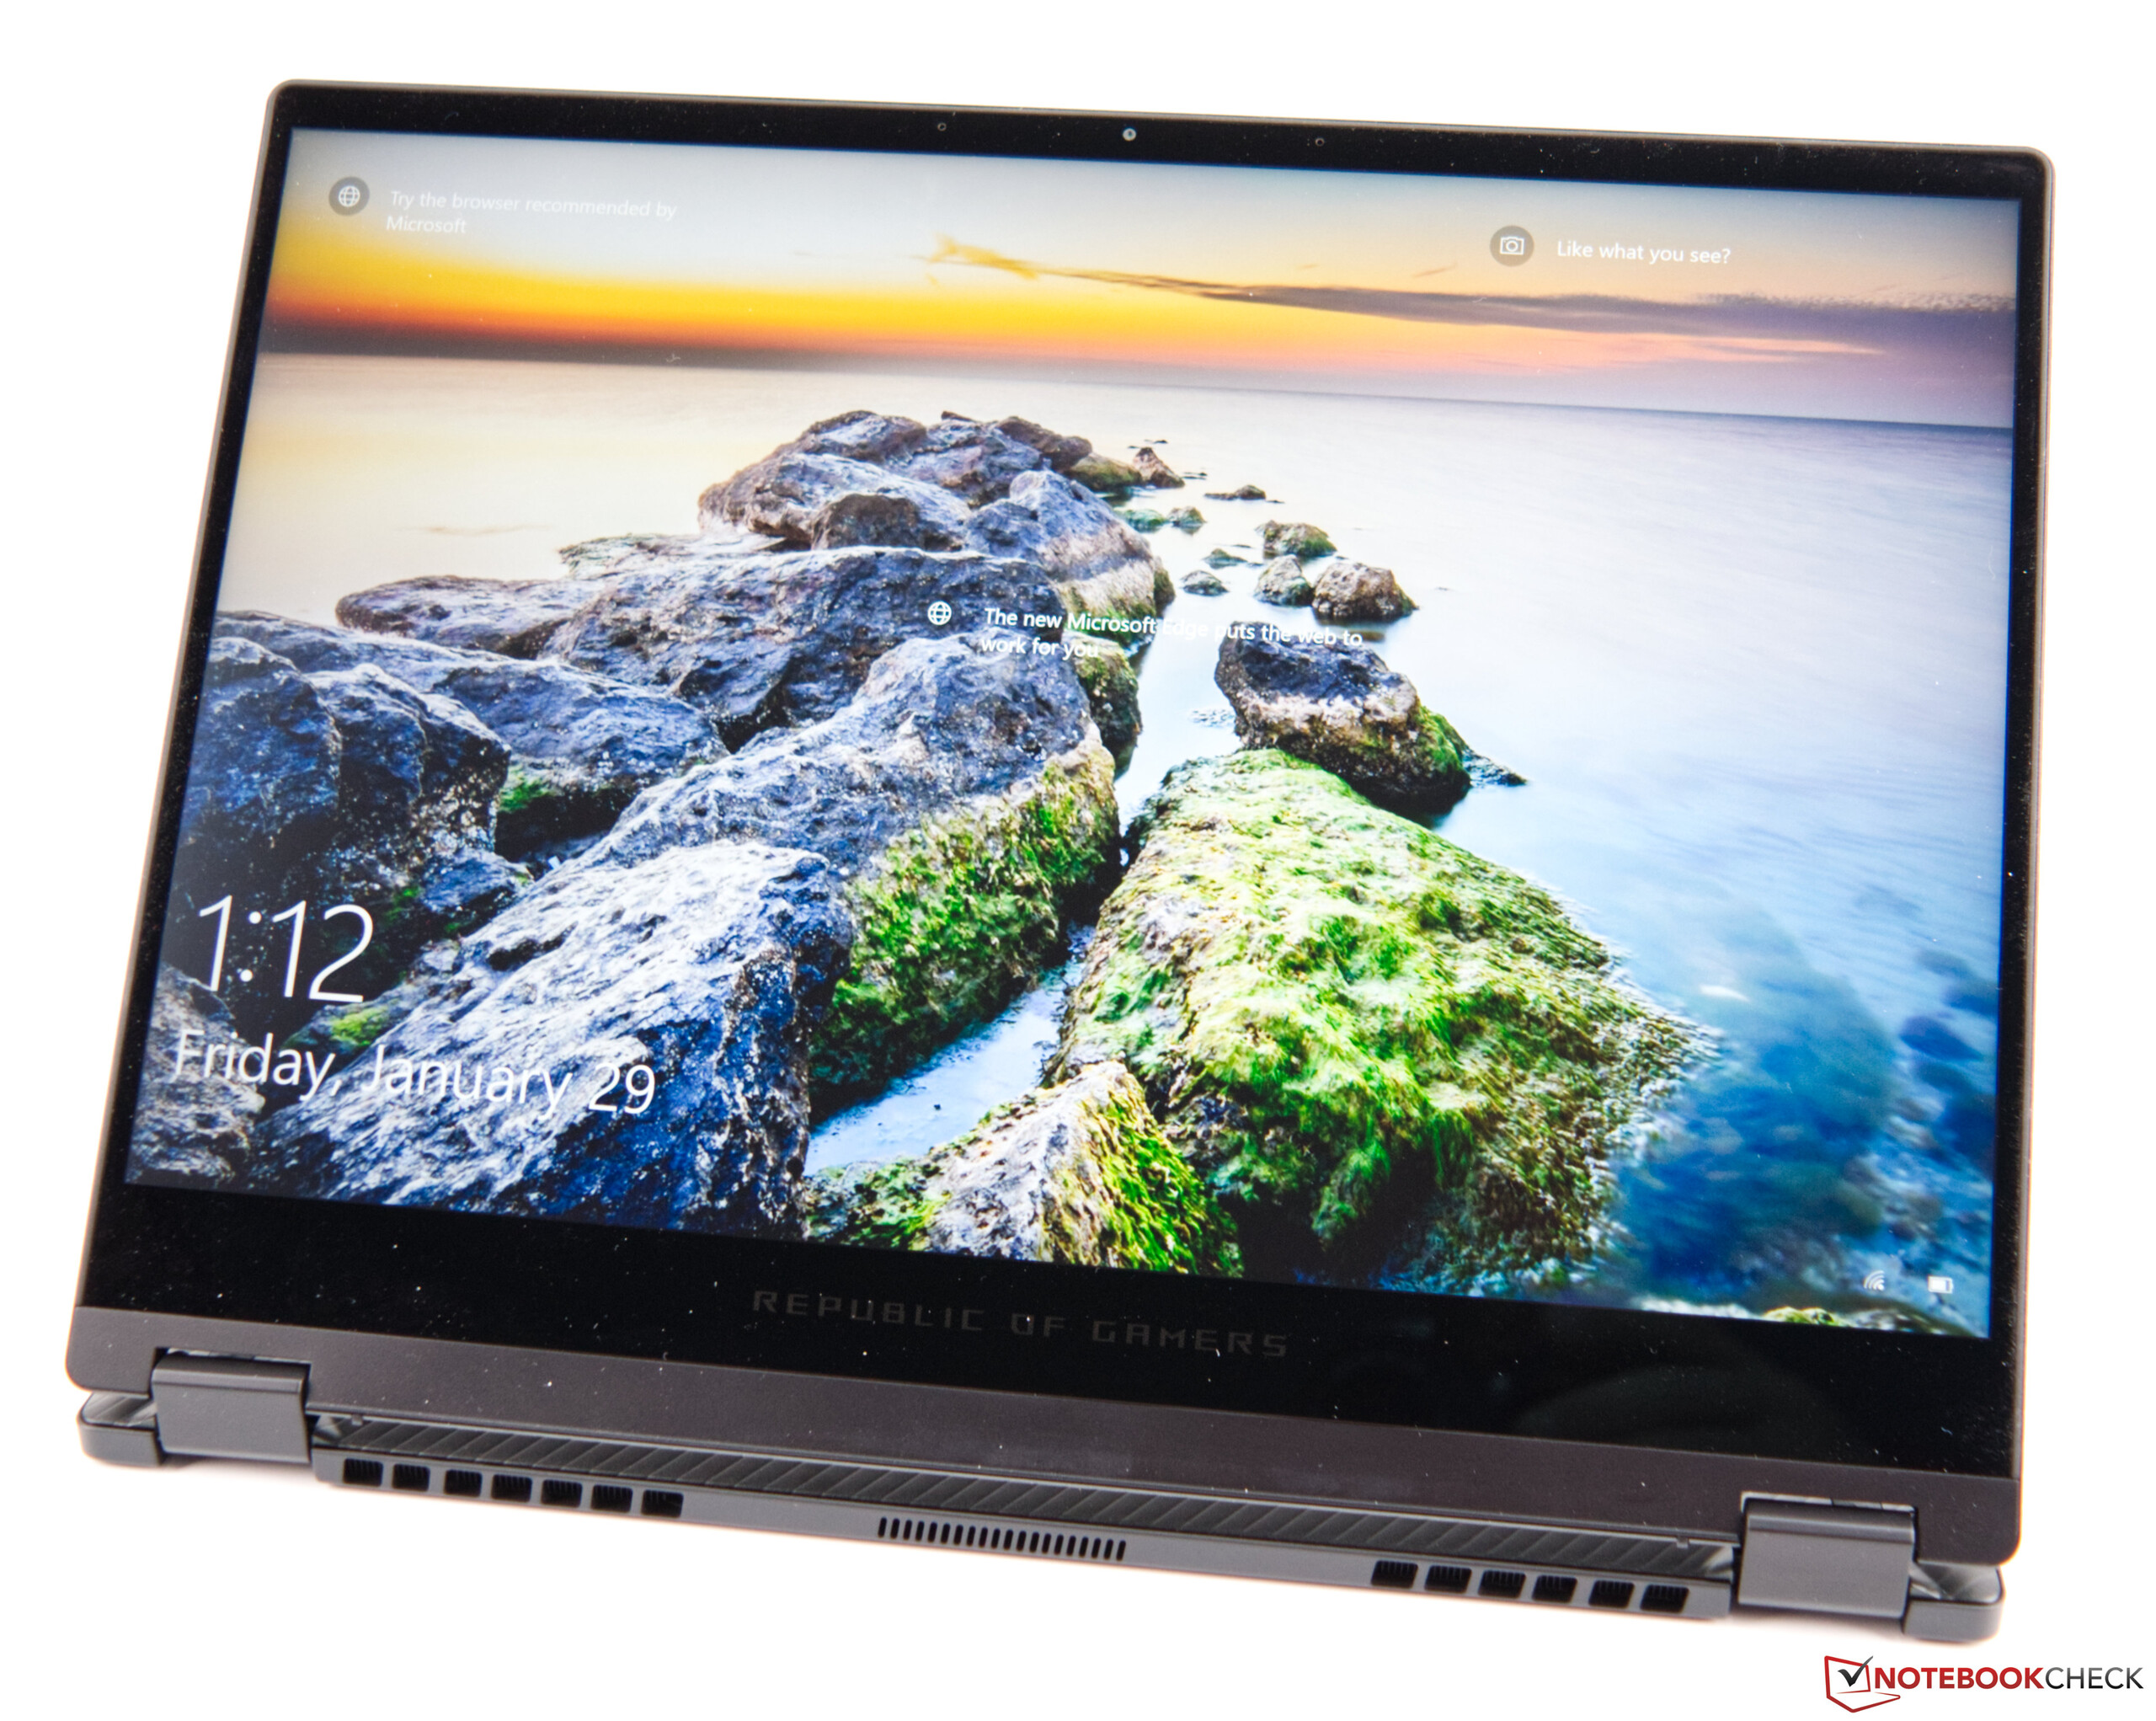
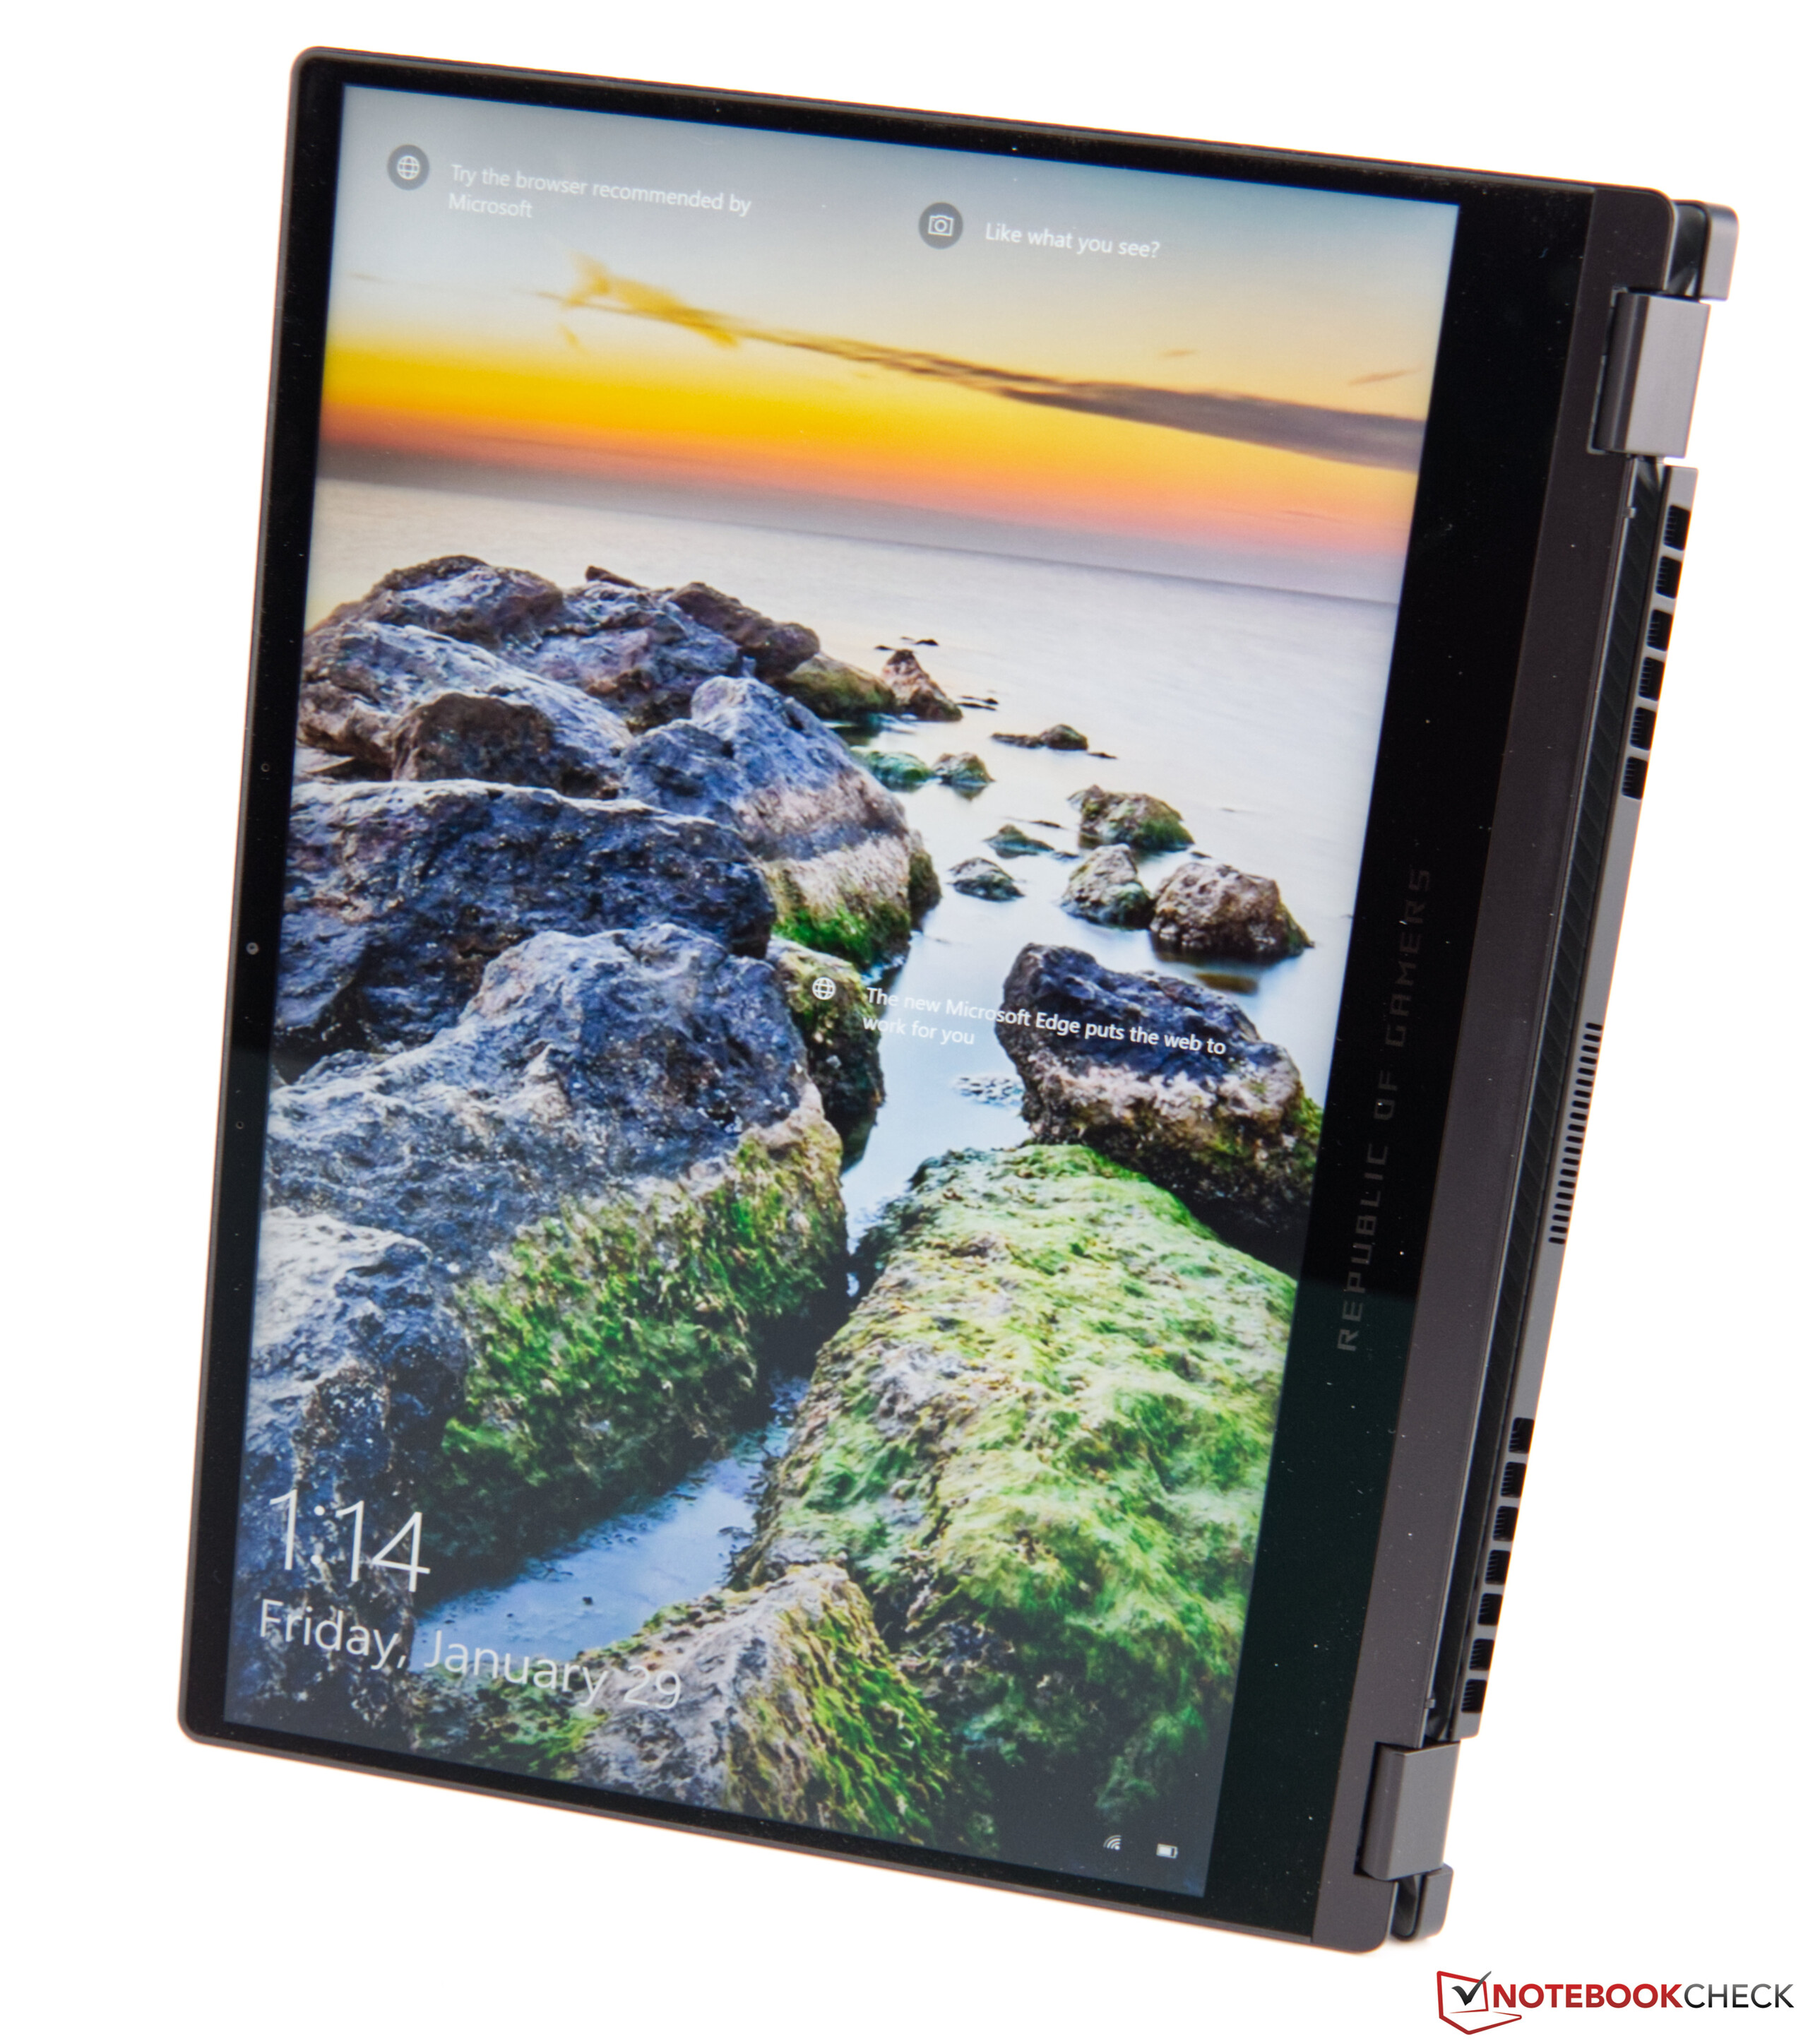
Vi gillade också den utmärkta 16:10-skärmen som hade bra färgomfång och väldigt låga färgavvikelser. Som ett resultat kan kreatörer välja den här enheten utan att tveka.
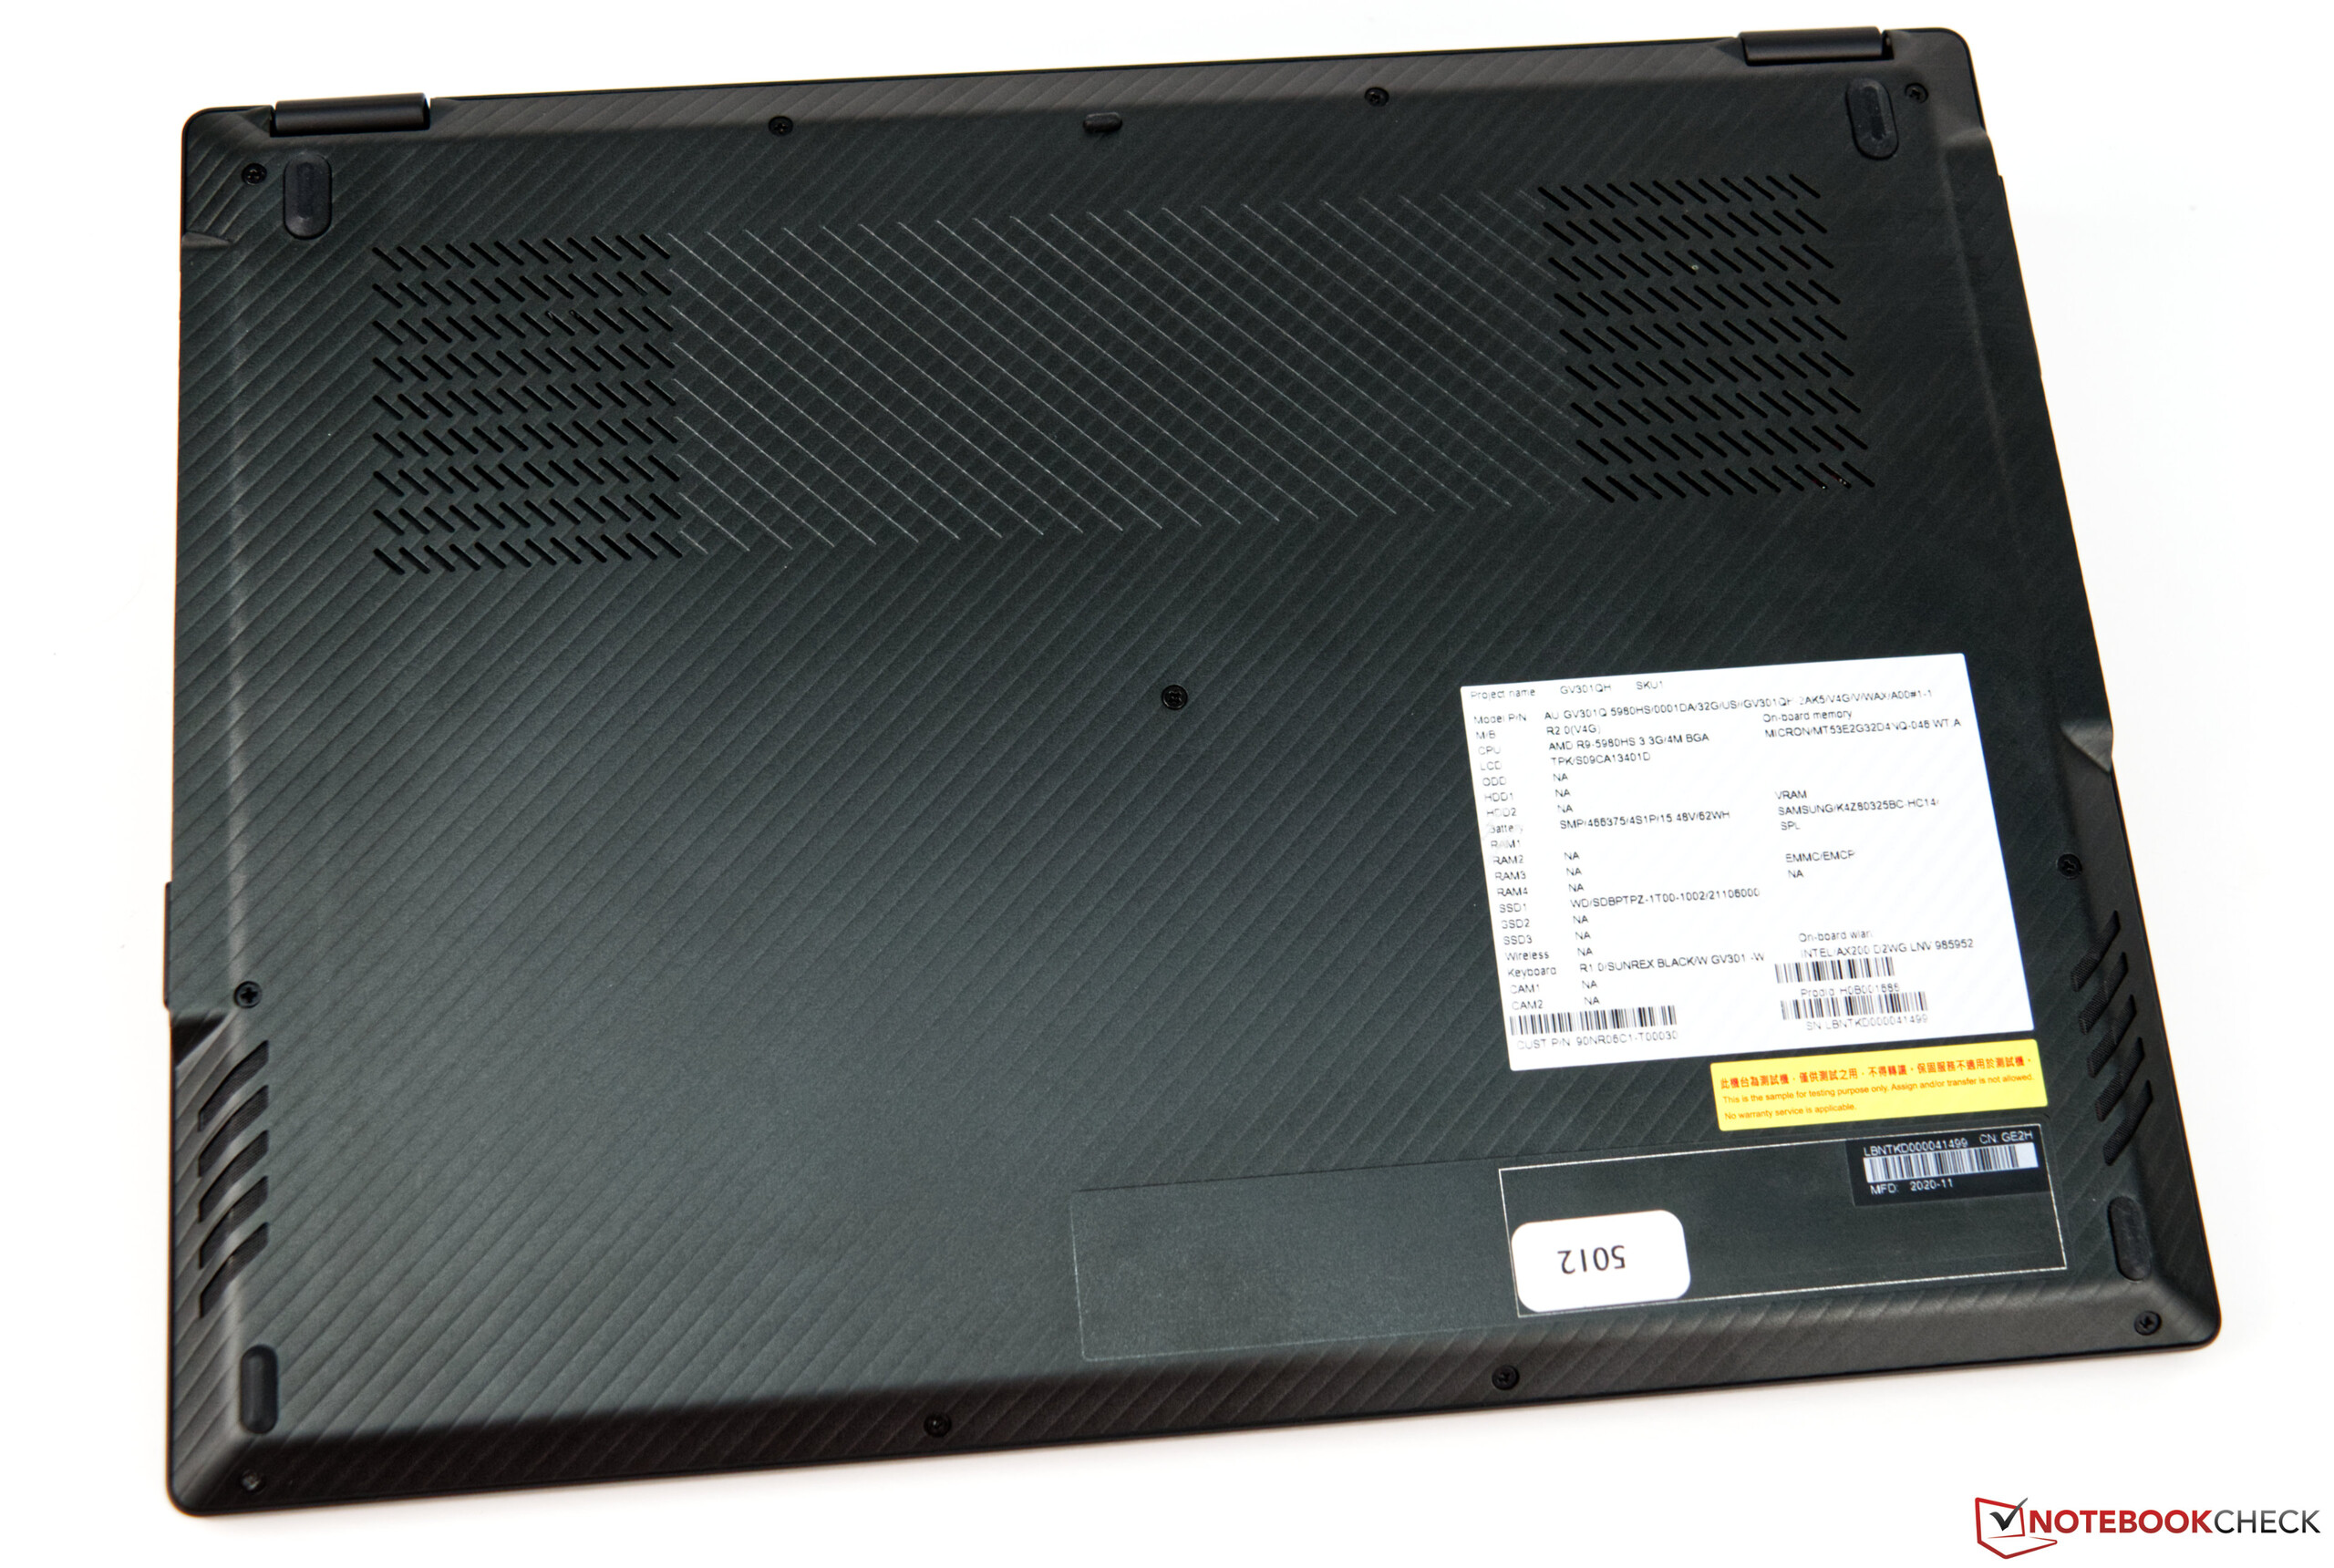
Den får minuspoäng för ganska svag batteritid i vårt WLAN-test. Konkurrenterna är bättre på den punkten, även om datorkraften är lägre i de fallen. Man får således själv välja vilket som känns viktigast. Ett annat problem med insidan av Asus ROG Flow X13: datorns RAM är fastlött och går inte att utöka, vilket kunde lösts bättre. Dessutom är M.2 SSD-enheten bara 30 mm lång, vilket begränsar ersättningsmöjligheterna.
Asus ROG Flow X13 GV301QH
- 02/08/2021 v7 (old)
Sebastian Bade
Price comparison
