Test: Acer Swift 5 SF514 (i5-8250U, UHD 620) Laptop (Sammanfattning)
| SD Card Reader | |
| maximum SDCardreader Maximum Transfer Rate | |
| Genomsnitt av klass Subnotebook (24.9 - 195, n=8, senaste 2 åren) | |
| average SDCardreader Average Transfer Rate | |
| Genomsnitt av klass Subnotebook (23.7 - 188, n=9, senaste 2 åren) | |
| Networking | |
| iperf3 transmit AX12 | |
| Lenovo ThinkPad X1 Carbon 2017-20HR0021GE | |
| Asus Zenbook 3 Deluxe UX490UA | |
| Toshiba Tecra X40-D | |
| Acer Swift 5 SF514-52T-59HY | |
| Acer Swift 3 (i5-7200U, HD 620) | |
| iperf3 receive AX12 | |
| Toshiba Tecra X40-D | |
| Acer Swift 3 (i5-7200U, HD 620) | |
| Asus Zenbook 3 Deluxe UX490UA | |
| Lenovo ThinkPad X1 Carbon 2017-20HR0021GE | |
| Acer Swift 5 SF514-52T-59HY | |
| |||||||||||||||||||||||||
Distribution av ljusstyrkan: 86 %
Mitt på batteriet: 254 cd/m²
Kontrast: 1016:1 (Svärta: 0.25 cd/m²)
ΔE ColorChecker Calman: 3.85 | ∀{0.5-29.43 Ø4.73}
calibrated: 3.66
ΔE Greyscale Calman: 4.1 | ∀{0.09-98 Ø4.97}
97% sRGB (Argyll 1.6.3 3D)
63% AdobeRGB 1998 (Argyll 1.6.3 3D)
71% AdobeRGB 1998 (Argyll 3D)
97.1% sRGB (Argyll 3D)
69.7% Display P3 (Argyll 3D)
Gamma: 2.43
CCT: 7369 K
| Acer Swift 5 SF514-52T-59HY AU Optronics AUO203D, , 1920x1080, 14" | Acer Swift 5 SF514-51-59AV AU Optronics B140HAN3.2, , 1920x1080, 14" | Acer Swift 3 (i5-7200U, HD 620) Chi Mei CMN14C9, , 1920x1080, 14" | Toshiba Tecra X40-D Toshiba TOS508F, , 1920x1080, 14" | Asus Zenbook 3 Deluxe UX490UA AU Optronics AUO383D / B140HAN03.8, , 1920x1080, 14" | Lenovo ThinkPad X1 Carbon 2017-20HR0021GE B140HAN03_1, , 1920x1080, 14" | |
|---|---|---|---|---|---|---|
| Display | -8% | -39% | -40% | -14% | -11% | |
| Display P3 Coverage (%) | 69.7 | 62.8 -10% | 40.96 -41% | 40.55 -42% | 58.7 -16% | 61.6 -12% |
| sRGB Coverage (%) | 97.1 | 91.3 -6% | 61.4 -37% | 61 -37% | 86.9 -11% | 87.6 -10% |
| AdobeRGB 1998 Coverage (%) | 71 | 64.3 -9% | 42.34 -40% | 41.89 -41% | 59.9 -16% | 62.6 -12% |
| Response Times | -30% | -19% | -10% | 7% | -31% | |
| Response Time Grey 50% / Grey 80% * (ms) | 37 ? | 51 ? -38% | 43 ? -16% | 38 ? -3% | 24 ? 35% | 48 ? -30% |
| Response Time Black / White * (ms) | 23 ? | 28 ? -22% | 28 ? -22% | 26.8 ? -17% | 28 ? -22% | 30.4 ? -32% |
| PWM Frequency (Hz) | 200 ? | 20410 ? | ||||
| Screen | -10% | -20% | -33% | 6% | 11% | |
| Brightness middle (cd/m²) | 254 | 393 55% | 281 11% | 283.9 12% | 337 33% | 278 9% |
| Brightness (cd/m²) | 231 | 338 46% | 259 12% | 261 13% | 295 28% | 271 17% |
| Brightness Distribution (%) | 86 | 79 -8% | 81 -6% | 85 -1% | 81 -6% | 91 6% |
| Black Level * (cd/m²) | 0.25 | 0.29 -16% | 0.45 -80% | 0.25 -0% | 0.21 16% | 0.16 36% |
| Contrast (:1) | 1016 | 1355 33% | 624 -39% | 1136 12% | 1605 58% | 1738 71% |
| Colorchecker dE 2000 * | 3.85 | 6.17 -60% | 4.19 -9% | 6.4 -66% | 4.89 -27% | 4.5 -17% |
| Colorchecker dE 2000 max. * | 7.05 | 11.21 -59% | 10.64 -51% | 18.7 -165% | 8.43 -20% | 8.4 -19% |
| Colorchecker dE 2000 calibrated * | 3.66 | |||||
| Greyscale dE 2000 * | 4.1 | 6.8 -66% | 2.55 38% | 6.3 -54% | 4.28 -4% | 3.2 22% |
| Gamma | 2.43 91% | 2.27 97% | 2.24 98% | 2.39 92% | 2.25 98% | 2.02 109% |
| CCT | 7369 88% | 6873 95% | 6555 99% | 6511 100% | 7352 88% | 7042 92% |
| Color Space (Percent of AdobeRGB 1998) (%) | 63 | 51 -19% | 39 -38% | 38 -40% | 56 -11% | 57 -10% |
| Color Space (Percent of sRGB) (%) | 97 | 91 -6% | 61 -37% | 60 -38% | 87 -10% | 87.5 -10% |
| Totalt genomsnitt (program/inställningar) | -16% /
-12% | -26% /
-24% | -28% /
-31% | -0% /
2% | -10% /
1% |
* ... mindre är bättre
Visa svarstider
| ↔ Svarstid svart till vitt | ||
|---|---|---|
| 23 ms ... stiga ↗ och falla ↘ kombinerat | ↗ 13 ms stiga | 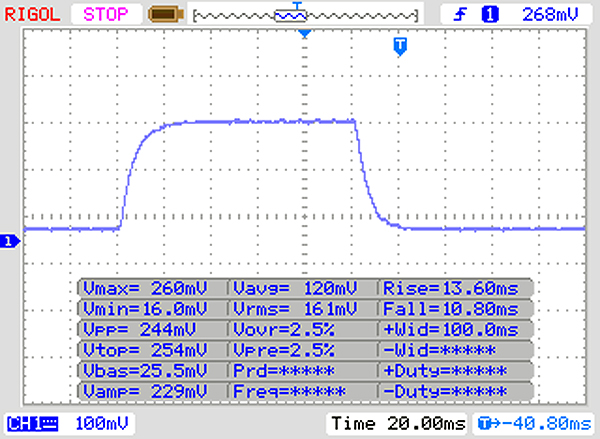 |
| ↘ 10 ms hösten | ||
| Skärmen visar bra svarsfrekvens i våra tester, men kan vara för långsam för konkurrenskraftiga spelare. I jämförelse sträcker sig alla testade enheter från 0.1 (minst) till 240 (maximalt) ms. » 52 % av alla enheter är bättre. Detta innebär att den uppmätta svarstiden är sämre än genomsnittet av alla testade enheter (19.9 ms). | ||
| ↔ Svarstid 50 % grått till 80 % grått | ||
| 37 ms ... stiga ↗ och falla ↘ kombinerat | ↗ 17 ms stiga | 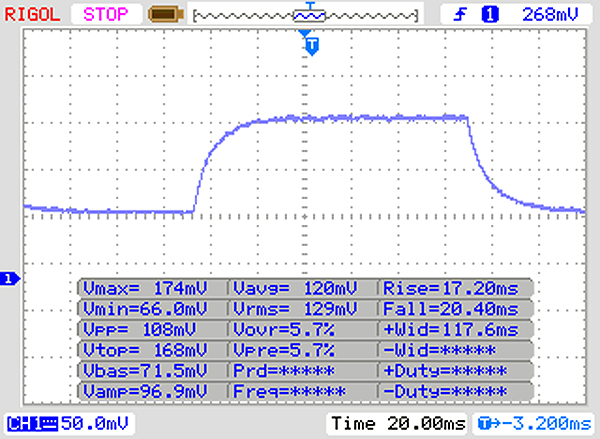 |
| ↘ 20 ms hösten | ||
| Skärmen visar långsamma svarsfrekvenser i våra tester och kommer att vara otillfredsställande för spelare. I jämförelse sträcker sig alla testade enheter från 0.165 (minst) till 636 (maximalt) ms. » 53 % av alla enheter är bättre. Detta innebär att den uppmätta svarstiden är sämre än genomsnittet av alla testade enheter (31.1 ms). | ||
Skärmflimmer / PWM (Puls-Width Modulation)
| Skärmflimmer / PWM upptäcktes inte | 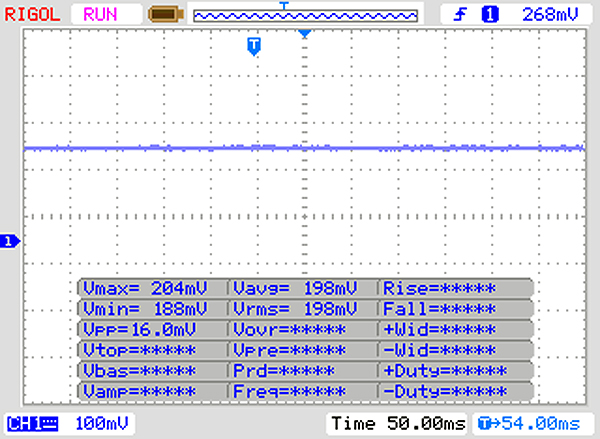 | ||
Som jämförelse: 52 % av alla testade enheter använder inte PWM för att dämpa skärmen. Om PWM upptäcktes mättes ett medelvärde av 7794 (minst: 5 - maximum: 343500) Hz. | |||
| PCMark 8 | |
| Home Score Accelerated v2 | |
| Lenovo ThinkPad X1 Carbon 2017-20HR0021GE | |
| Toshiba Tecra X40-D | |
| Acer Swift 3 (i5-7200U, HD 620) | |
| Asus Zenbook 3 Deluxe UX490UA | |
| Genomsnitt Intel Core i5-8250U, Intel UHD Graphics 620 (2986 - 4458, n=69) | |
| Acer Swift 5 SF514-51-59AV | |
| Acer Swift 5 SF514-52T-59HY | |
| Genomsnitt av klass Subnotebook (1739 - 1828, n=2, senaste 2 åren) | |
| Work Score Accelerated v2 | |
| Toshiba Tecra X40-D | |
| Acer Swift 5 SF514-52T-59HY | |
| Asus Zenbook 3 Deluxe UX490UA | |
| Genomsnitt Intel Core i5-8250U, Intel UHD Graphics 620 (2699 - 5106, n=58) | |
| Lenovo ThinkPad X1 Carbon 2017-20HR0021GE | |
| Genomsnitt av klass Subnotebook (1609 - 1656, n=2, senaste 2 åren) | |
| PCMark 8 Home Score Accelerated v2 | 3264 poäng | |
| PCMark 8 Work Score Accelerated v2 | 4700 poäng | |
| PCMark 10 Score | 2619 poäng | |
Hjälp | ||
| Acer Swift 5 SF514-52T-59HY Intel SSD 600p SSDPEKKW256G7 | Acer Swift 5 SF514-51-59AV SK Hynix HFS256G39TND-N210A | Acer Swift 3 (i5-7200U, HD 620) Intel SSD 600p SSDPEKKW256G7 | Asus Zenbook 3 Deluxe UX490UA Micron 1100 MTFDDAV256TBN | Lenovo ThinkPad X1 Carbon 2017-20HR0021GE Toshiba THNSF5256GPUK | Genomsnitt Intel SSD 600p SSDPEKKW256G7 | |
|---|---|---|---|---|---|---|
| CrystalDiskMark 3.0 | -25% | 12% | -23% | 23% | 15% | |
| Read Seq (MB/s) | 1113 | 517 -54% | 1137 2% | 435.3 -61% | 1277 15% | 1122 ? 1% |
| Write Seq (MB/s) | 597 | 258.1 -57% | 606 2% | 413.3 -31% | 648 9% | 524 ? -12% |
| Read 512 (MB/s) | 642 | 355 -45% | 800 25% | 325.9 -49% | 972 51% | 767 ? 19% |
| Write 512 (MB/s) | 472.8 | 258.5 -45% | 564 19% | 357 -24% | 311 -34% | 541 ? 14% |
| Read 4k (MB/s) | 29.58 | 29.65 0% | 31.6 7% | 26.28 -11% | 34.63 17% | 29.9 ? 1% |
| Write 4k (MB/s) | 89.2 | 77.3 -13% | 108.3 21% | 85.6 -4% | 128.5 44% | 114.5 ? 28% |
| Read 4k QD32 (MB/s) | 289.5 | 277.1 -4% | 290.1 0% | 246.7 -15% | 477.3 65% | 279 ? -4% |
| Write 4k QD32 (MB/s) | 203.3 | 242.5 19% | 251 23% | 224.4 10% | 241.2 19% | 356 ? 75% |

| 3DMark 11 - 1280x720 Performance GPU | |
| Genomsnitt av klass Subnotebook (995 - 18489, n=55, senaste 2 åren) | |
| Genomsnitt Intel UHD Graphics 620 (1144 - 3432, n=244) | |
| Asus Zenbook 3 Deluxe UX490UA | |
| Toshiba Tecra X40-D | |
| Lenovo ThinkPad X1 Carbon 2017-20HR0021GE | |
| Acer Swift 5 SF514-51-59AV | |
| Acer Swift 3 (i5-7200U, HD 620) | |
| Acer Swift 5 SF514-52T-59HY | |
| 3DMark | |
| 1280x720 Cloud Gate Standard Graphics | |
| Genomsnitt av klass Subnotebook (5577 - 61591, n=28, senaste 2 åren) | |
| Genomsnitt Intel UHD Graphics 620 (6205 - 16400, n=225) | |
| Toshiba Tecra X40-D | |
| Asus Zenbook 3 Deluxe UX490UA | |
| Acer Swift 5 SF514-51-59AV | |
| Acer Swift 5 SF514-52T-59HY | |
| Lenovo ThinkPad X1 Carbon 2017-20HR0021GE | |
| 1920x1080 Fire Strike Graphics | |
| Genomsnitt av klass Subnotebook (832 - 16347, n=56, senaste 2 åren) | |
| Genomsnitt Intel UHD Graphics 620 (557 - 2608, n=213) | |
| Toshiba Tecra X40-D | |
| Lenovo ThinkPad X1 Carbon 2017-20HR0021GE | |
| Asus Zenbook 3 Deluxe UX490UA | |
| Acer Swift 5 SF514-52T-59HY | |
| 3DMark 11 Performance | 1580 poäng | |
| 3DMark Cloud Gate Standard Score | 6668 poäng | |
| 3DMark Fire Strike Score | 903 poäng | |
Hjälp | ||
| The Witcher 3 | |
| 1024x768 Low Graphics & Postprocessing | |
| Genomsnitt av klass Subnotebook (38.8 - 176, n=13, senaste 2 åren) | |
| Genomsnitt Intel UHD Graphics 620 (8.8 - 50.9, n=64) | |
| Asus Zenbook 3 Deluxe UX490UA | |
| Acer Swift 5 SF514-51-59AV | |
| Lenovo ThinkPad X1 Carbon 2017-20HR0021GE | |
| Acer Swift 5 SF514-52T-59HY | |
| 1366x768 Medium Graphics & Postprocessing | |
| Genomsnitt av klass Subnotebook (71 - 115, n=8, senaste 2 åren) | |
| Genomsnitt Intel UHD Graphics 620 (8 - 27.9, n=29) | |
| Acer Swift 5 SF514-51-59AV | |
| Acer Swift 5 SF514-52T-59HY | |
| Rocket League | |
| 1280x720 Performance | |
| Genomsnitt Intel UHD Graphics 620 (20.1 - 95, n=26) | |
| Acer Swift 5 SF514-52T-59HY | |
| 1920x1080 Performance | |
| Genomsnitt Intel UHD Graphics 620 (17.1 - 78.4, n=13) | |
| Acer Swift 5 SF514-52T-59HY | |
| 1920x1080 Quality AA:Medium FX | |
| Genomsnitt Intel UHD Graphics 620 (13.1 - 43, n=24) | |
| Acer Swift 5 SF514-52T-59HY | |
| 1920x1080 High Quality AA:High FX | |
| Genomsnitt Intel UHD Graphics 620 (13.2 - 24.7, n=21) | |
| Acer Swift 5 SF514-52T-59HY | |
| Rise of the Tomb Raider | |
| 1024x768 Lowest Preset | |
| Genomsnitt Intel UHD Graphics 620 (10.4 - 110.7, n=82) | |
| Asus Zenbook 3 Deluxe UX490UA | |
| Acer Swift 5 SF514-51-59AV | |
| Acer Swift 5 SF514-52T-59HY | |
| Lenovo ThinkPad X1 Carbon 2017-20HR0021GE | |
| 1366x768 Medium Preset AF:2x | |
| Genomsnitt Intel UHD Graphics 620 (6.5 - 49.3, n=62) | |
| Acer Swift 5 SF514-51-59AV | |
| Acer Swift 5 SF514-52T-59HY | |
| Lenovo ThinkPad X1 Carbon 2017-20HR0021GE | |
| låg | med. | hög | ultra | |
|---|---|---|---|---|
| The Witcher 3 (2015) | 9.59 | 8 | ||
| Rise of the Tomb Raider (2016) | 17.18 | 9.32 | ||
| Rocket League (2017) | 57.6 | 23.74 | 14.52 |
Ljudnivå
| Låg belastning |
| 30.3 / 30.3 / 31.2 dB(A) |
| Hög belastning |
| 33.1 / 34.4 dB(A) |
 | ||
30 dB tyst 40 dB(A) hörbar 50 dB(A) högt ljud |
||
min: | ||
| Acer Swift 5 SF514-52T-59HY UHD Graphics 620, i5-8250U, Intel SSD 600p SSDPEKKW256G7 | Acer Swift 5 SF514-51-59AV HD Graphics 620, i5-7200U, SK Hynix HFS256G39TND-N210A | Acer Swift 3 (i5-7200U, HD 620) HD Graphics 620, i5-7200U, Intel SSD 600p SSDPEKKW256G7 | Toshiba Tecra X40-D HD Graphics 620, i7-7600U, Samsung PM961 MZVLW256HEHP | Asus Zenbook 3 Deluxe UX490UA HD Graphics 620, i5-7200U, Micron 1100 MTFDDAV256TBN | Lenovo ThinkPad X1 Carbon 2017-20HR0021GE HD Graphics 620, i5-7200U, Toshiba THNSF5256GPUK | |
|---|---|---|---|---|---|---|
| Noise | 1% | 1% | 3% | -1% | -1% | |
| av / miljö * (dB) | 30.3 | 30.5 -1% | 30.6 -1% | 28 8% | 30.2 -0% | 29.6 2% |
| Idle Minimum * (dB) | 30.3 | 30.5 -1% | 30.6 -1% | 28 8% | 30.2 -0% | 29.6 2% |
| Idle Average * (dB) | 30.3 | 30.5 -1% | 30.6 -1% | 28 8% | 30.2 -0% | 29.6 2% |
| Idle Maximum * (dB) | 31.2 | 30.5 2% | 31.1 -0% | 28.2 10% | 31.2 -0% | 32.2 -3% |
| Load Average * (dB) | 33.1 | 32.25 3% | 34 -3% | 33.2 -0% | 35.7 -8% | 34.2 -3% |
| Load Maximum * (dB) | 34.4 | 32.6 5% | 31.45 9% | 39.9 -16% | 34.2 1% | 36.1 -5% |
* ... mindre är bättre
(±) Den maximala temperaturen på ovansidan är 42.9 °C / 109 F, jämfört med genomsnittet av 35.9 °C / 97 F , allt från 21.4 till 59 °C för klassen Subnotebook.
(±) Botten värms upp till maximalt 44.9 °C / 113 F, jämfört med genomsnittet av 39.2 °C / 103 F
(+) Vid tomgångsbruk är medeltemperaturen för ovansidan 27 °C / 81 F, jämfört med enhetsgenomsnittet på 30.8 °C / ### class_avg_f### F.
(+) Handledsstöden och pekplattan är kallare än hudtemperaturen med maximalt 28.7 °C / 83.7 F och är därför svala att ta på.
(±) Medeltemperaturen för handledsstödsområdet på liknande enheter var 28.2 °C / 82.8 F (-0.5 °C / -0.9 F).
| Acer Swift 5 SF514-52T-59HY UHD Graphics 620, i5-8250U, Intel SSD 600p SSDPEKKW256G7 | Acer Swift 5 SF514-51-59AV HD Graphics 620, i5-7200U, SK Hynix HFS256G39TND-N210A | Acer Swift 3 (i5-7200U, HD 620) HD Graphics 620, i5-7200U, Intel SSD 600p SSDPEKKW256G7 | Toshiba Tecra X40-D HD Graphics 620, i7-7600U, Samsung PM961 MZVLW256HEHP | Asus Zenbook 3 Deluxe UX490UA HD Graphics 620, i5-7200U, Micron 1100 MTFDDAV256TBN | Lenovo ThinkPad X1 Carbon 2017-20HR0021GE HD Graphics 620, i5-7200U, Toshiba THNSF5256GPUK | |
|---|---|---|---|---|---|---|
| Heat | 9% | 12% | 1% | 15% | -4% | |
| Maximum Upper Side * (°C) | 42.9 | 39.4 8% | 39.6 8% | 43 -0% | 33.3 22% | 48.5 -13% |
| Maximum Bottom * (°C) | 44.9 | 40 11% | 40.4 10% | 42 6% | 33.2 26% | 46.1 -3% |
| Idle Upper Side * (°C) | 28.4 | 25.8 9% | 23.7 17% | 29.2 -3% | 27 5% | 28.5 -0% |
| Idle Bottom * (°C) | 28.5 | 26.5 7% | 24.7 13% | 27.8 2% | 27.2 5% | 27.8 2% |
* ... mindre är bättre
Acer Swift 5 SF514-52T-59HY ljudanalys
(-) | inte särskilt höga högtalare (67.7 dB)
Bas 100 - 315 Hz
(±) | reducerad bas - i genomsnitt 7.7% lägre än medianen
(+) | basen är linjär (6.4% delta till föregående frekvens)
Mellan 400 - 2000 Hz
(±) | högre mellan - i genomsnitt 5.5% högre än median
(+) | mids är linjära (6.8% delta till föregående frekvens)
Högsta 2 - 16 kHz
(+) | balanserade toppar - endast 2.7% från medianen
(+) | toppar är linjära (6.5% delta till föregående frekvens)
Totalt 100 - 16 000 Hz
(±) | linjäriteten för det totala ljudet är genomsnittlig (18.9% skillnad mot median)
Jämfört med samma klass
» 57% av alla testade enheter i den här klassen var bättre, 6% liknande, 36% sämre
» Den bästa hade ett delta på 5%, genomsnittet var 18%, sämst var 53%
Jämfört med alla testade enheter
» 44% av alla testade enheter var bättre, 8% liknande, 48% sämre
» Den bästa hade ett delta på 4%, genomsnittet var 24%, sämst var 134%
Apple MacBook 12 (Early 2016) 1.1 GHz ljudanalys
(+) | högtalare kan spela relativt högt (83.6 dB)
Bas 100 - 315 Hz
(±) | reducerad bas - i genomsnitt 11.3% lägre än medianen
(±) | linjäriteten för basen är genomsnittlig (14.2% delta till föregående frekvens)
Mellan 400 - 2000 Hz
(+) | balanserad mellan - endast 2.4% från medianen
(+) | mids är linjära (5.5% delta till föregående frekvens)
Högsta 2 - 16 kHz
(+) | balanserade toppar - endast 2% från medianen
(+) | toppar är linjära (4.5% delta till föregående frekvens)
Totalt 100 - 16 000 Hz
(+) | det totala ljudet är linjärt (10.2% skillnad mot median)
Jämfört med samma klass
» 7% av alla testade enheter i den här klassen var bättre, 2% liknande, 91% sämre
» Den bästa hade ett delta på 5%, genomsnittet var 18%, sämst var 53%
Jämfört med alla testade enheter
» 5% av alla testade enheter var bättre, 1% liknande, 94% sämre
» Den bästa hade ett delta på 4%, genomsnittet var 24%, sämst var 134%
| Av/Standby | |
| Låg belastning | |
| Hög belastning |
|
Förklaring:
min: | |
| Acer Swift 5 SF514-52T-59HY i5-8250U, UHD Graphics 620, Intel SSD 600p SSDPEKKW256G7, IPS, 1920x1080, 14" | Acer Swift 5 SF514-51-59AV i5-7200U, HD Graphics 620, SK Hynix HFS256G39TND-N210A, IPS, 1920x1080, 14" | Acer Swift 3 (i5-7200U, HD 620) i5-7200U, HD Graphics 620, Intel SSD 600p SSDPEKKW256G7, IPS, 1920x1080, 14" | Toshiba Tecra X40-D i7-7600U, HD Graphics 620, Samsung PM961 MZVLW256HEHP, IPS, 1920x1080, 14" | Asus Zenbook 3 Deluxe UX490UA i5-7200U, HD Graphics 620, Micron 1100 MTFDDAV256TBN, IPS, 1920x1080, 14" | Lenovo ThinkPad X1 Carbon 2017-20HR0021GE i5-7200U, HD Graphics 620, Toshiba THNSF5256GPUK, IPS, 1920x1080, 14" | Genomsnitt Intel UHD Graphics 620 | Genomsnitt av klass Subnotebook | |
|---|---|---|---|---|---|---|---|---|
| Power Consumption | -48% | -35% | -38% | -24% | -53% | -59% | -76% | |
| Idle Minimum * (Watt) | 2.8 | 3.6 -29% | 3.7 -32% | 5.2 -86% | 3.3 -18% | 3.8 -36% | 3.81 ? -36% | 3.82 ? -36% |
| Idle Average * (Watt) | 4.8 | 7 -46% | 6.1 -27% | 6.9 -44% | 6.1 -27% | 7.1 -48% | 6.94 ? -45% | 6.61 ? -38% |
| Idle Maximum * (Watt) | 6.3 | 9.3 -48% | 8.8 -40% | 7 -11% | 10.1 -60% | 8.3 -32% | 8.75 ? -39% | 7.99 ? -27% |
| Load Average * (Watt) | 21 | 37 -76% | 30.6 -46% | 24.6 -17% | 24.6 -17% | 34.2 -63% | 35 ? -67% | 41.9 ? -100% |
| Load Maximum * (Watt) | 23 | 32.6 -42% | 29.6 -29% | 30.1 -31% | 22 4% | 43.3 -88% | 47.5 ? -107% | 64.1 ? -179% |
* ... mindre är bättre
| Acer Swift 5 SF514-52T-59HY i5-8250U, UHD Graphics 620, 36 Wh | Acer Swift 5 SF514-51-59AV i5-7200U, HD Graphics 620, 53.9 Wh | Acer Swift 3 (i5-7200U, HD 620) i5-7200U, HD Graphics 620, 48 Wh | Toshiba Tecra X40-D i7-7600U, HD Graphics 620, 48 Wh | Asus Zenbook 3 Deluxe UX490UA i5-7200U, HD Graphics 620, 46 Wh | Lenovo ThinkPad X1 Carbon 2017-20HR0021GE i5-7200U, HD Graphics 620, 57 Wh | Genomsnitt av klass Subnotebook | |
|---|---|---|---|---|---|---|---|
| Batteridrifttid | 18% | 110% | -3% | 31% | 16% | 82% | |
| Reader / Idle (h) | 16 | 16.9 6% | 14.6 -9% | 17.2 8% | 13.7 -14% | 28.6 ? 79% | |
| H.264 (h) | 7.8 | 9.3 19% | 9.6 23% | 15.6 ? 100% | |||
| WiFi v1.3 (h) | 5.2 | 9.2 77% | 10.9 110% | 6 15% | 9.4 81% | 9.1 75% | 14 ? 169% |
| Load (h) | 2.5 | 1.7 -32% | 2.1 -16% | 2.6 4% | 2 -20% | 1.946 ? -22% | |
| WiFi (h) | 10.9 |
För
Emot
Läs den fullständiga versionen av den här recensionen på engelska här.
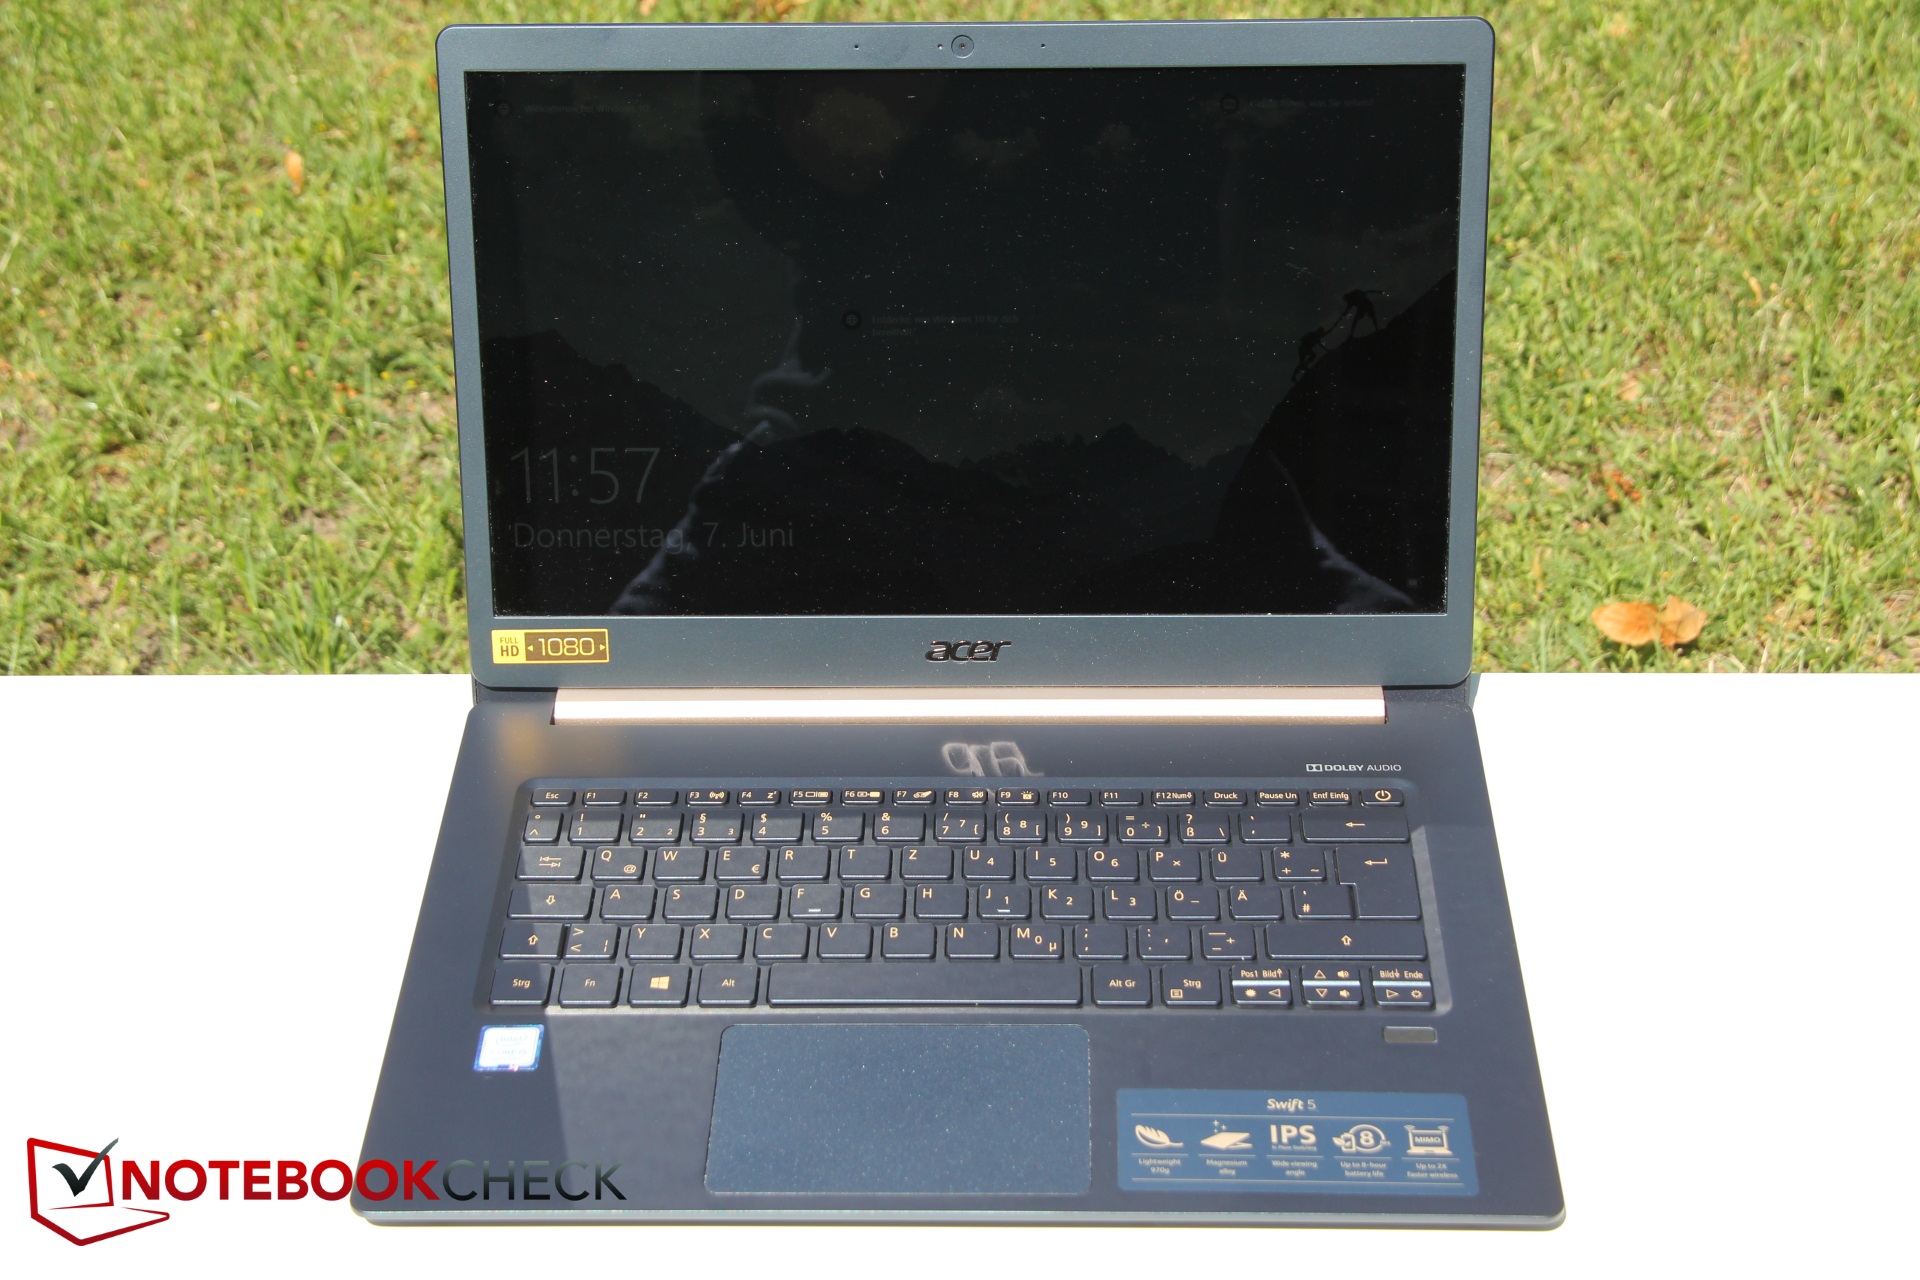
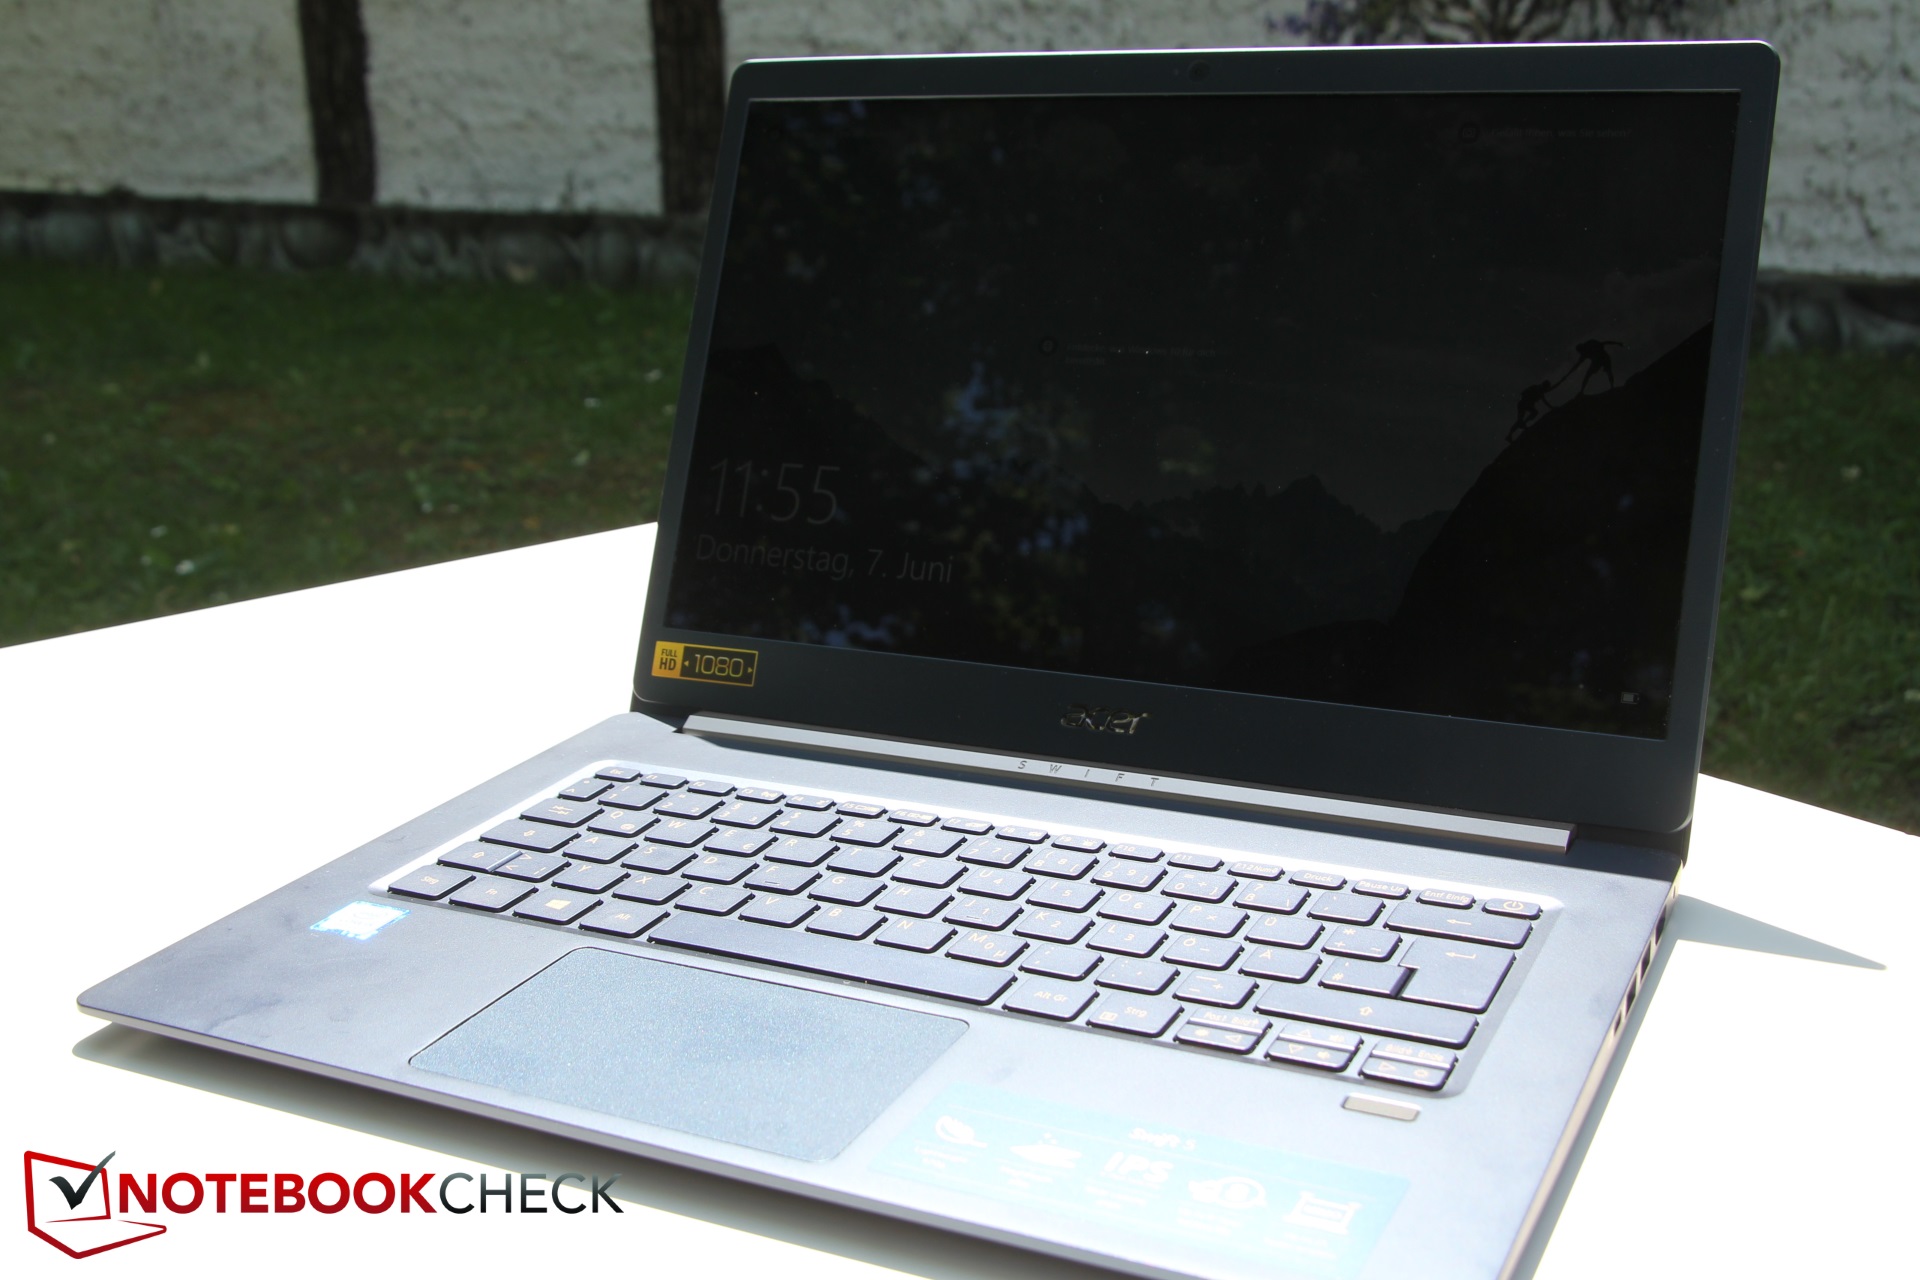
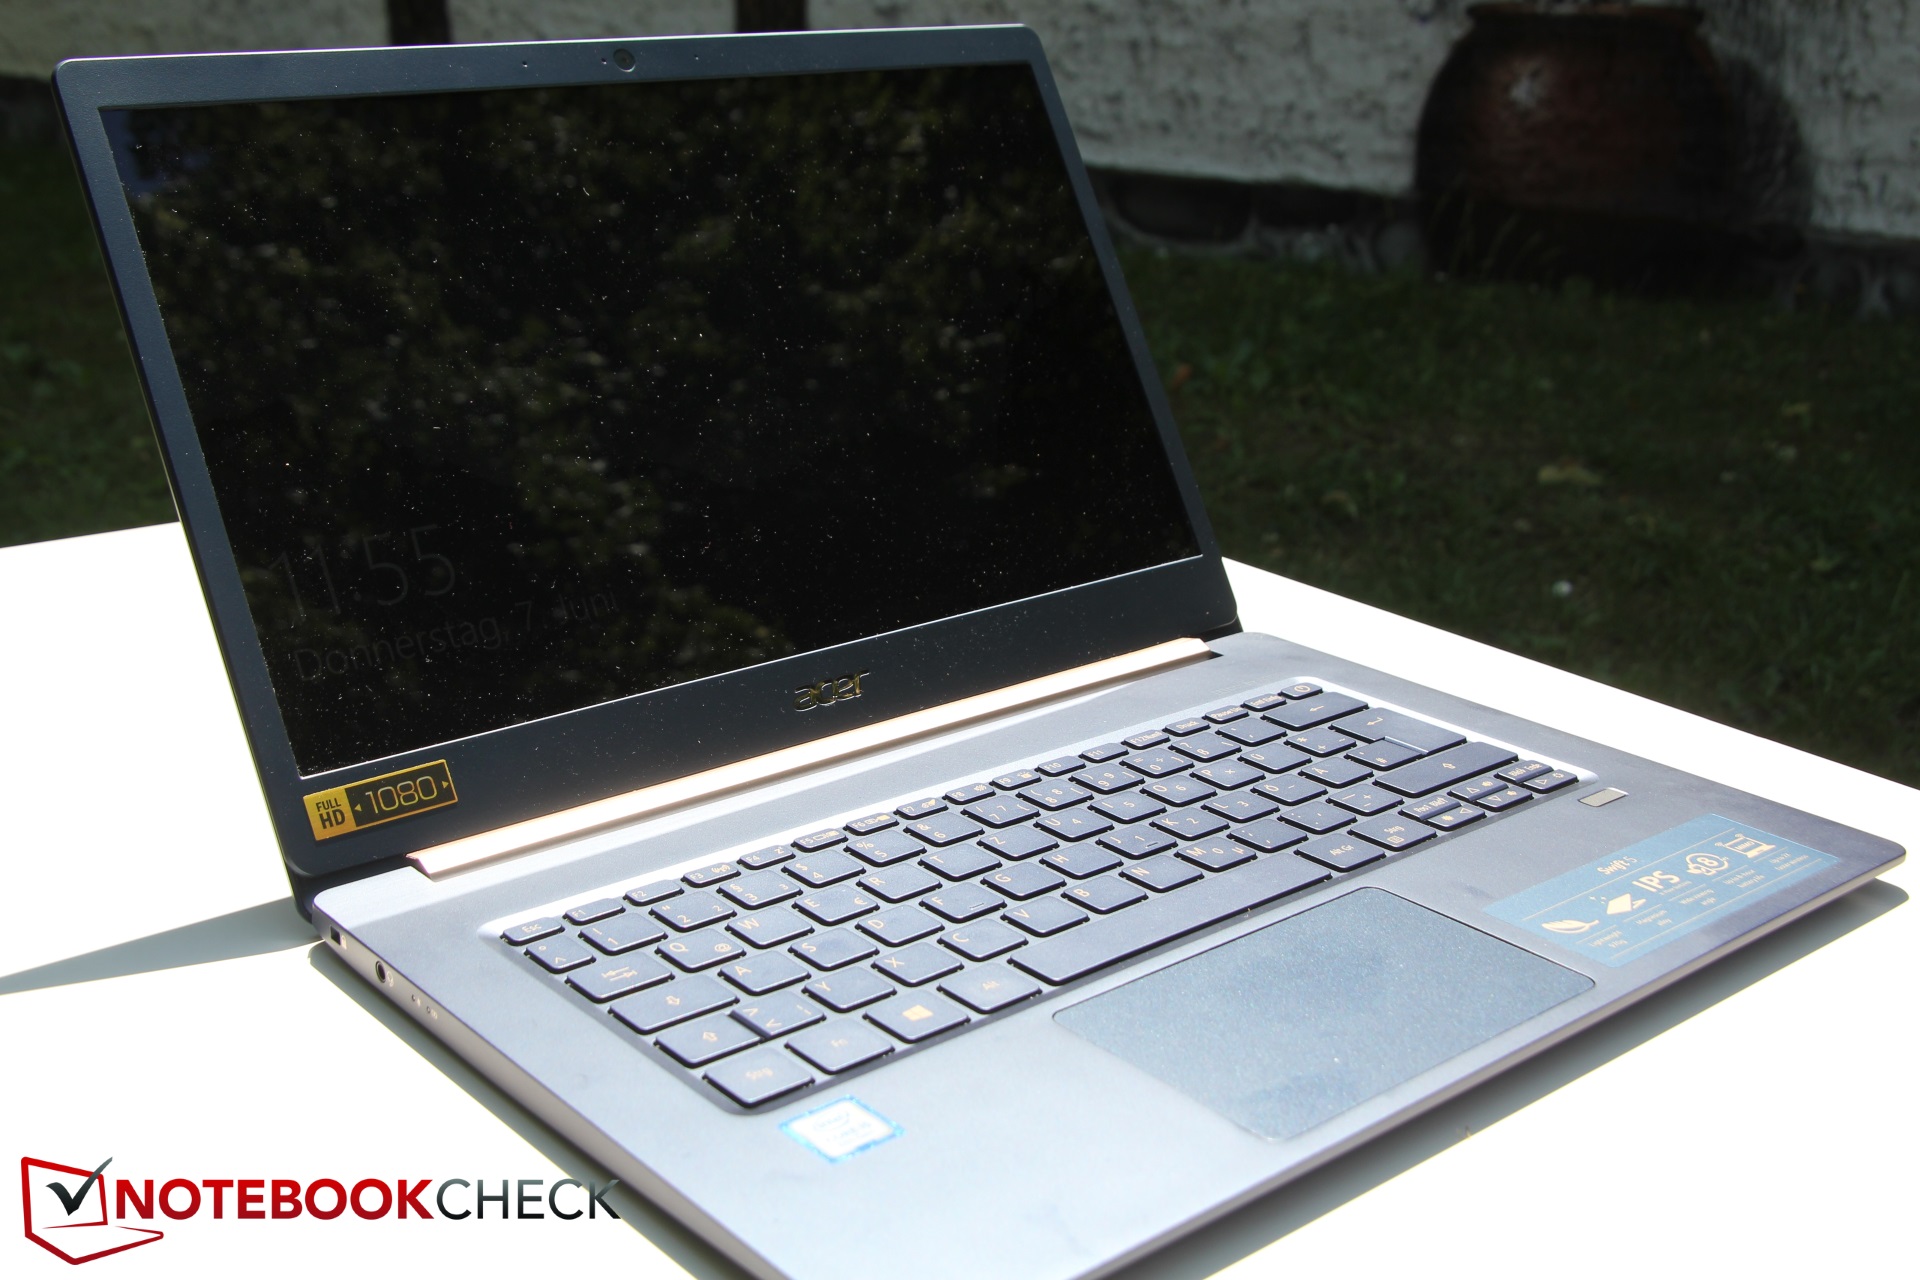
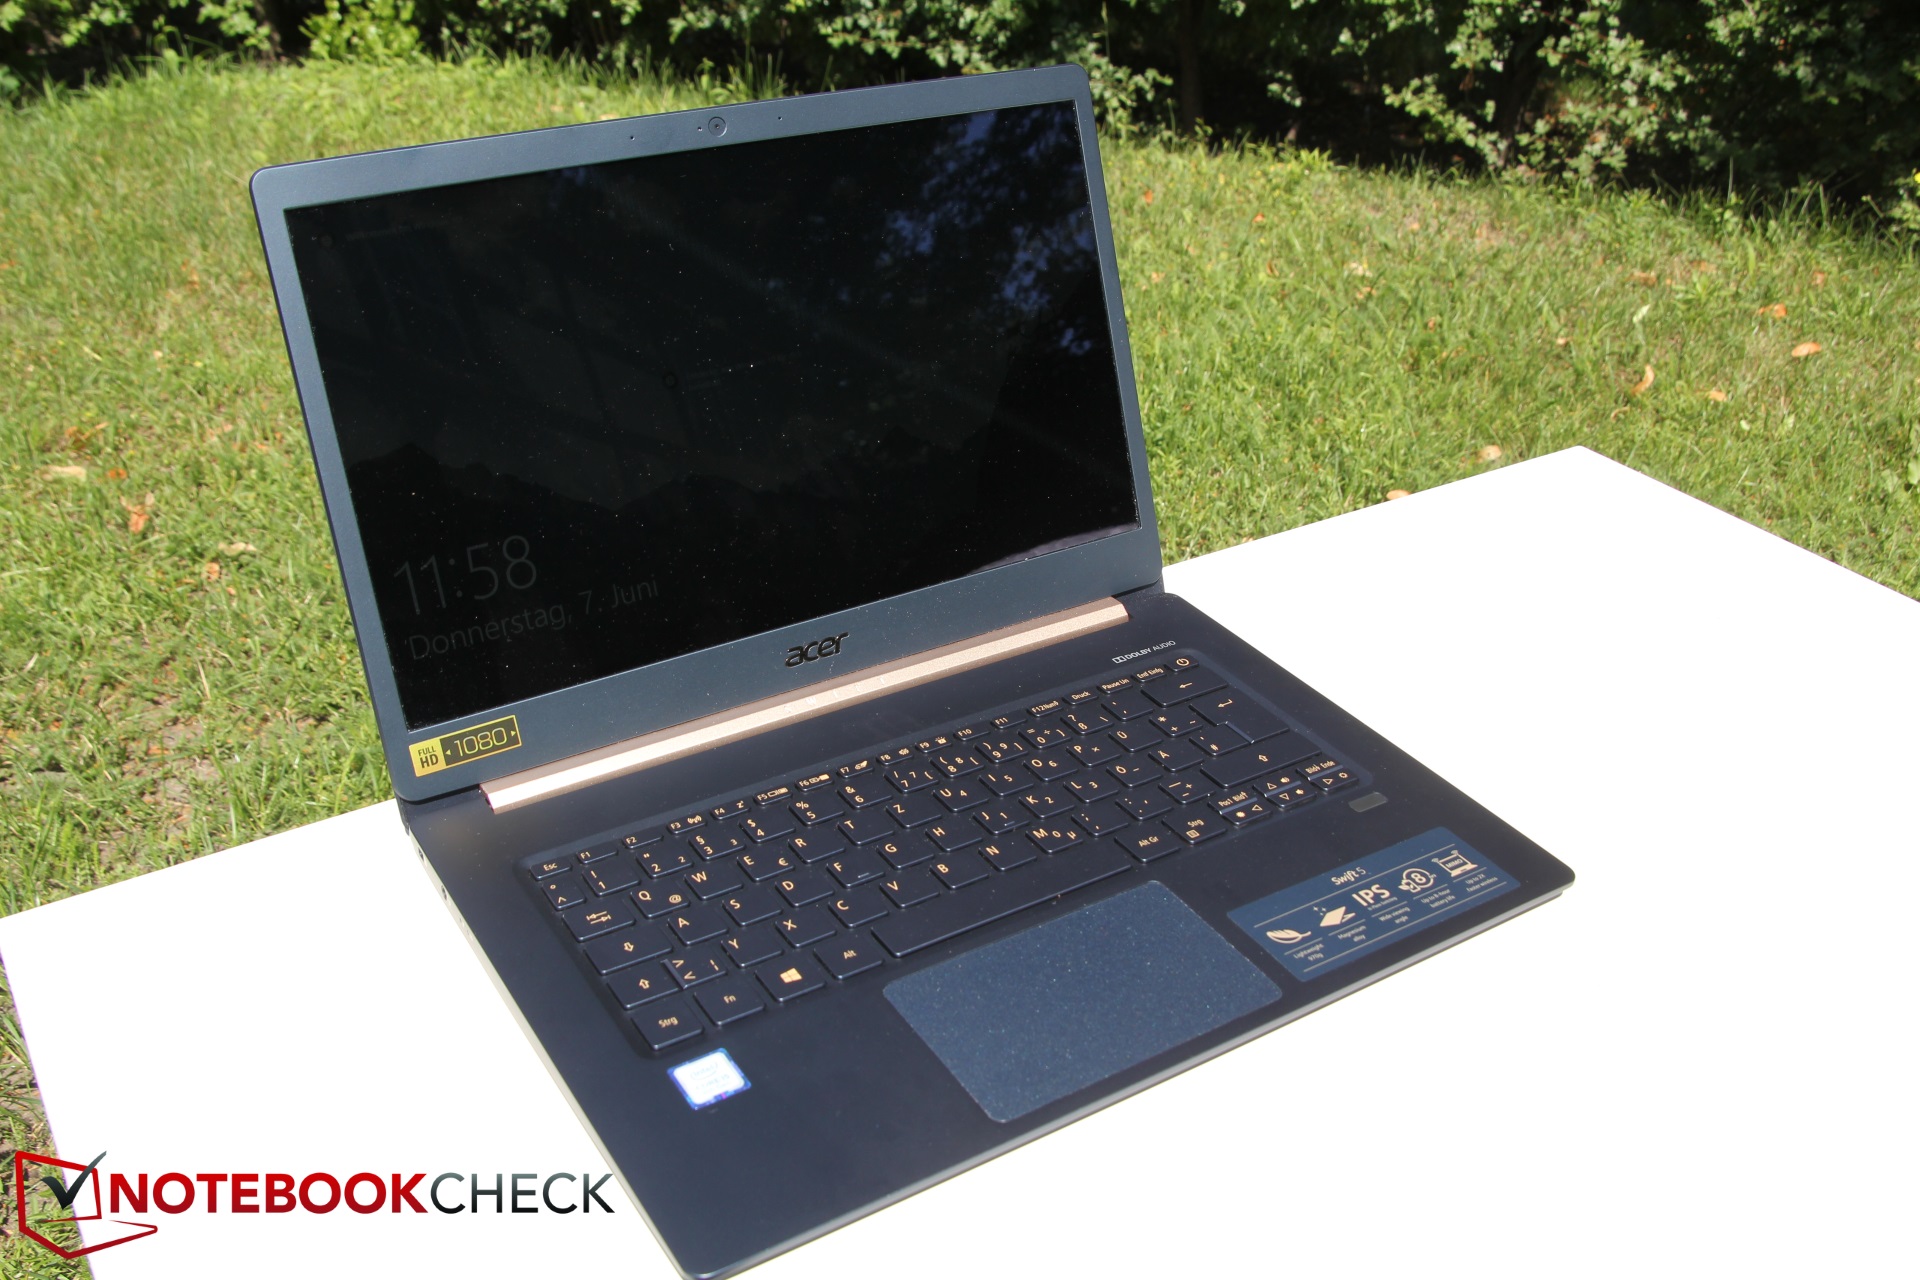
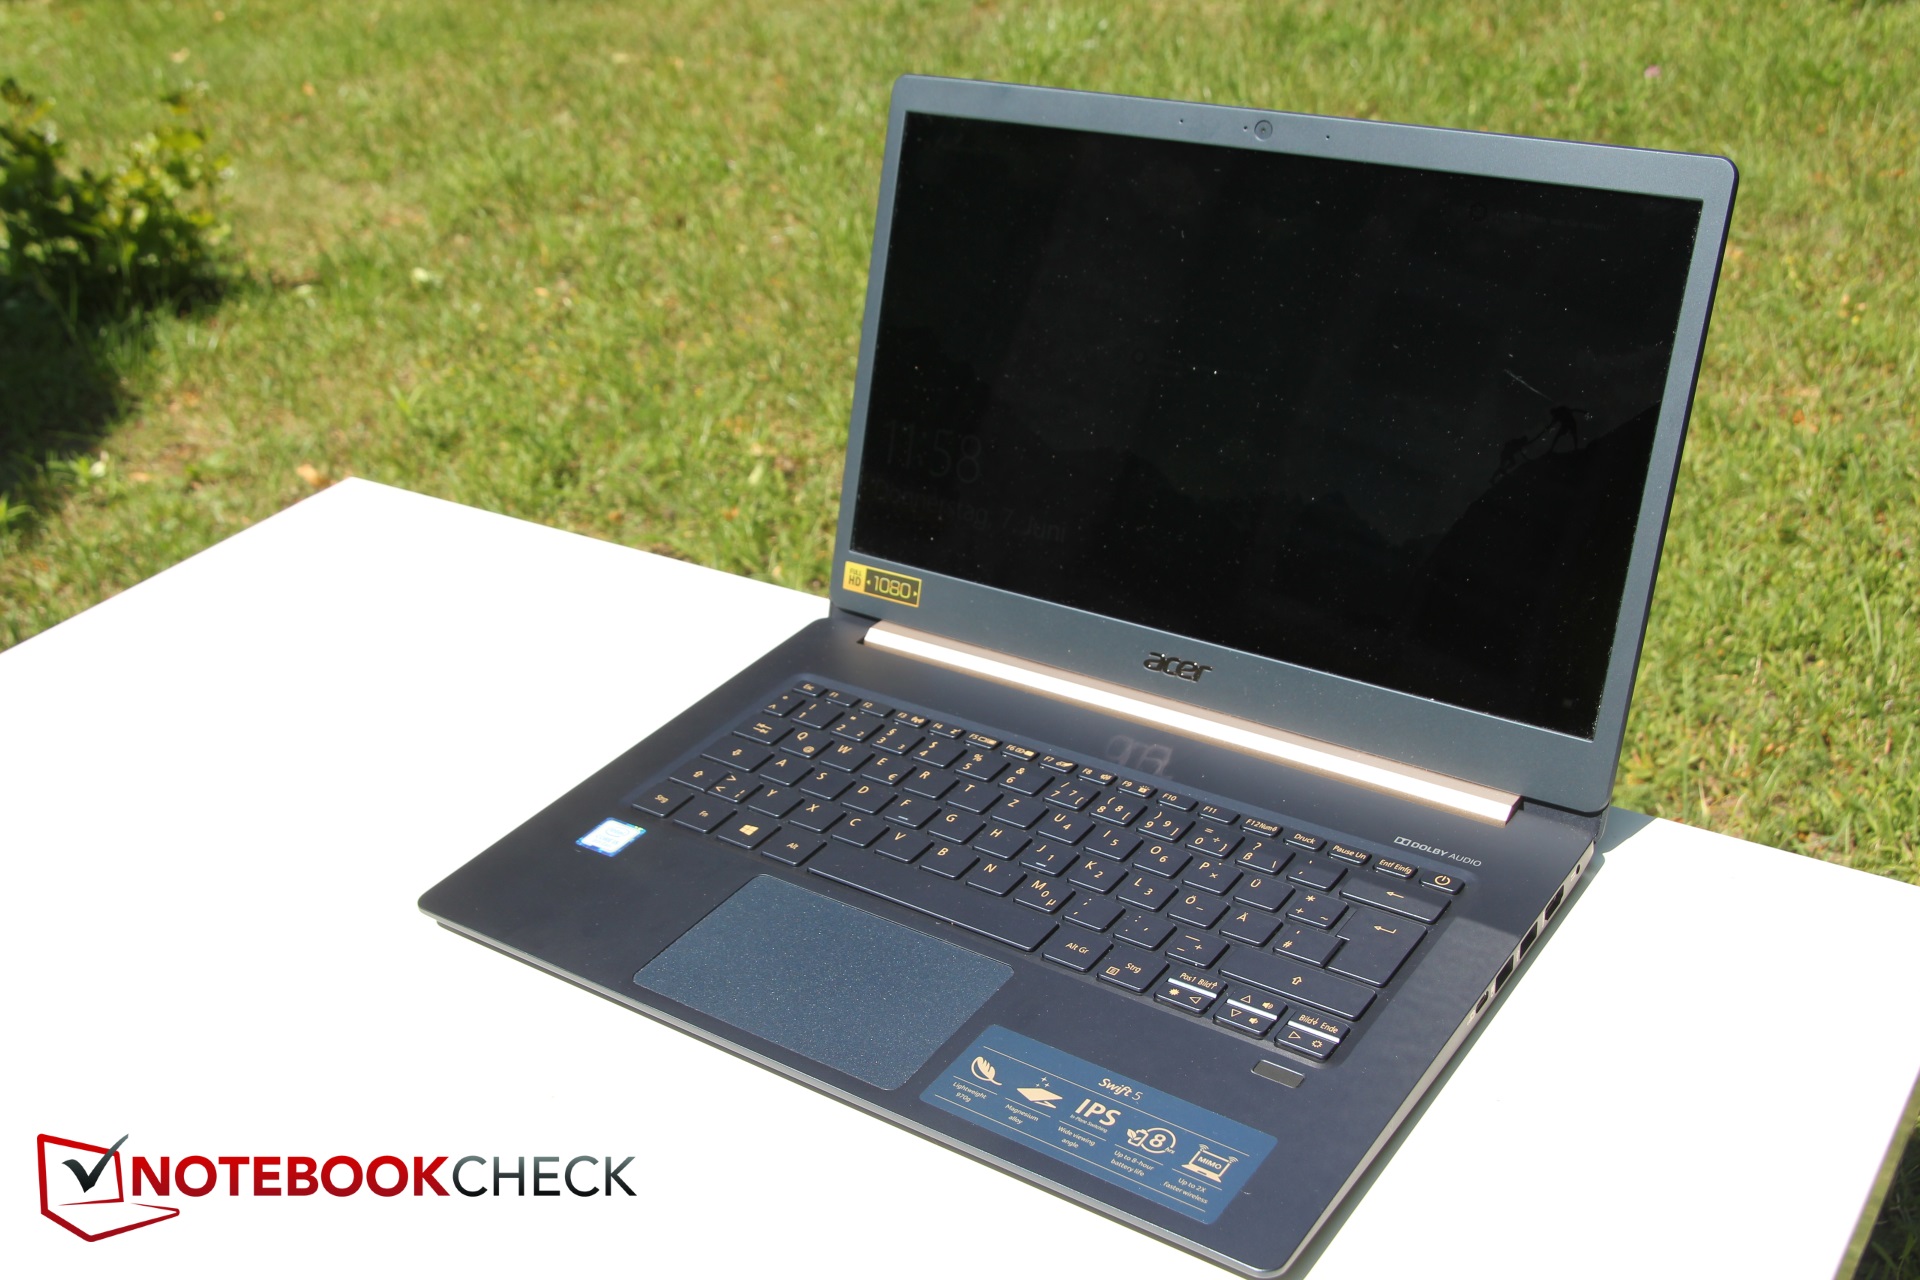
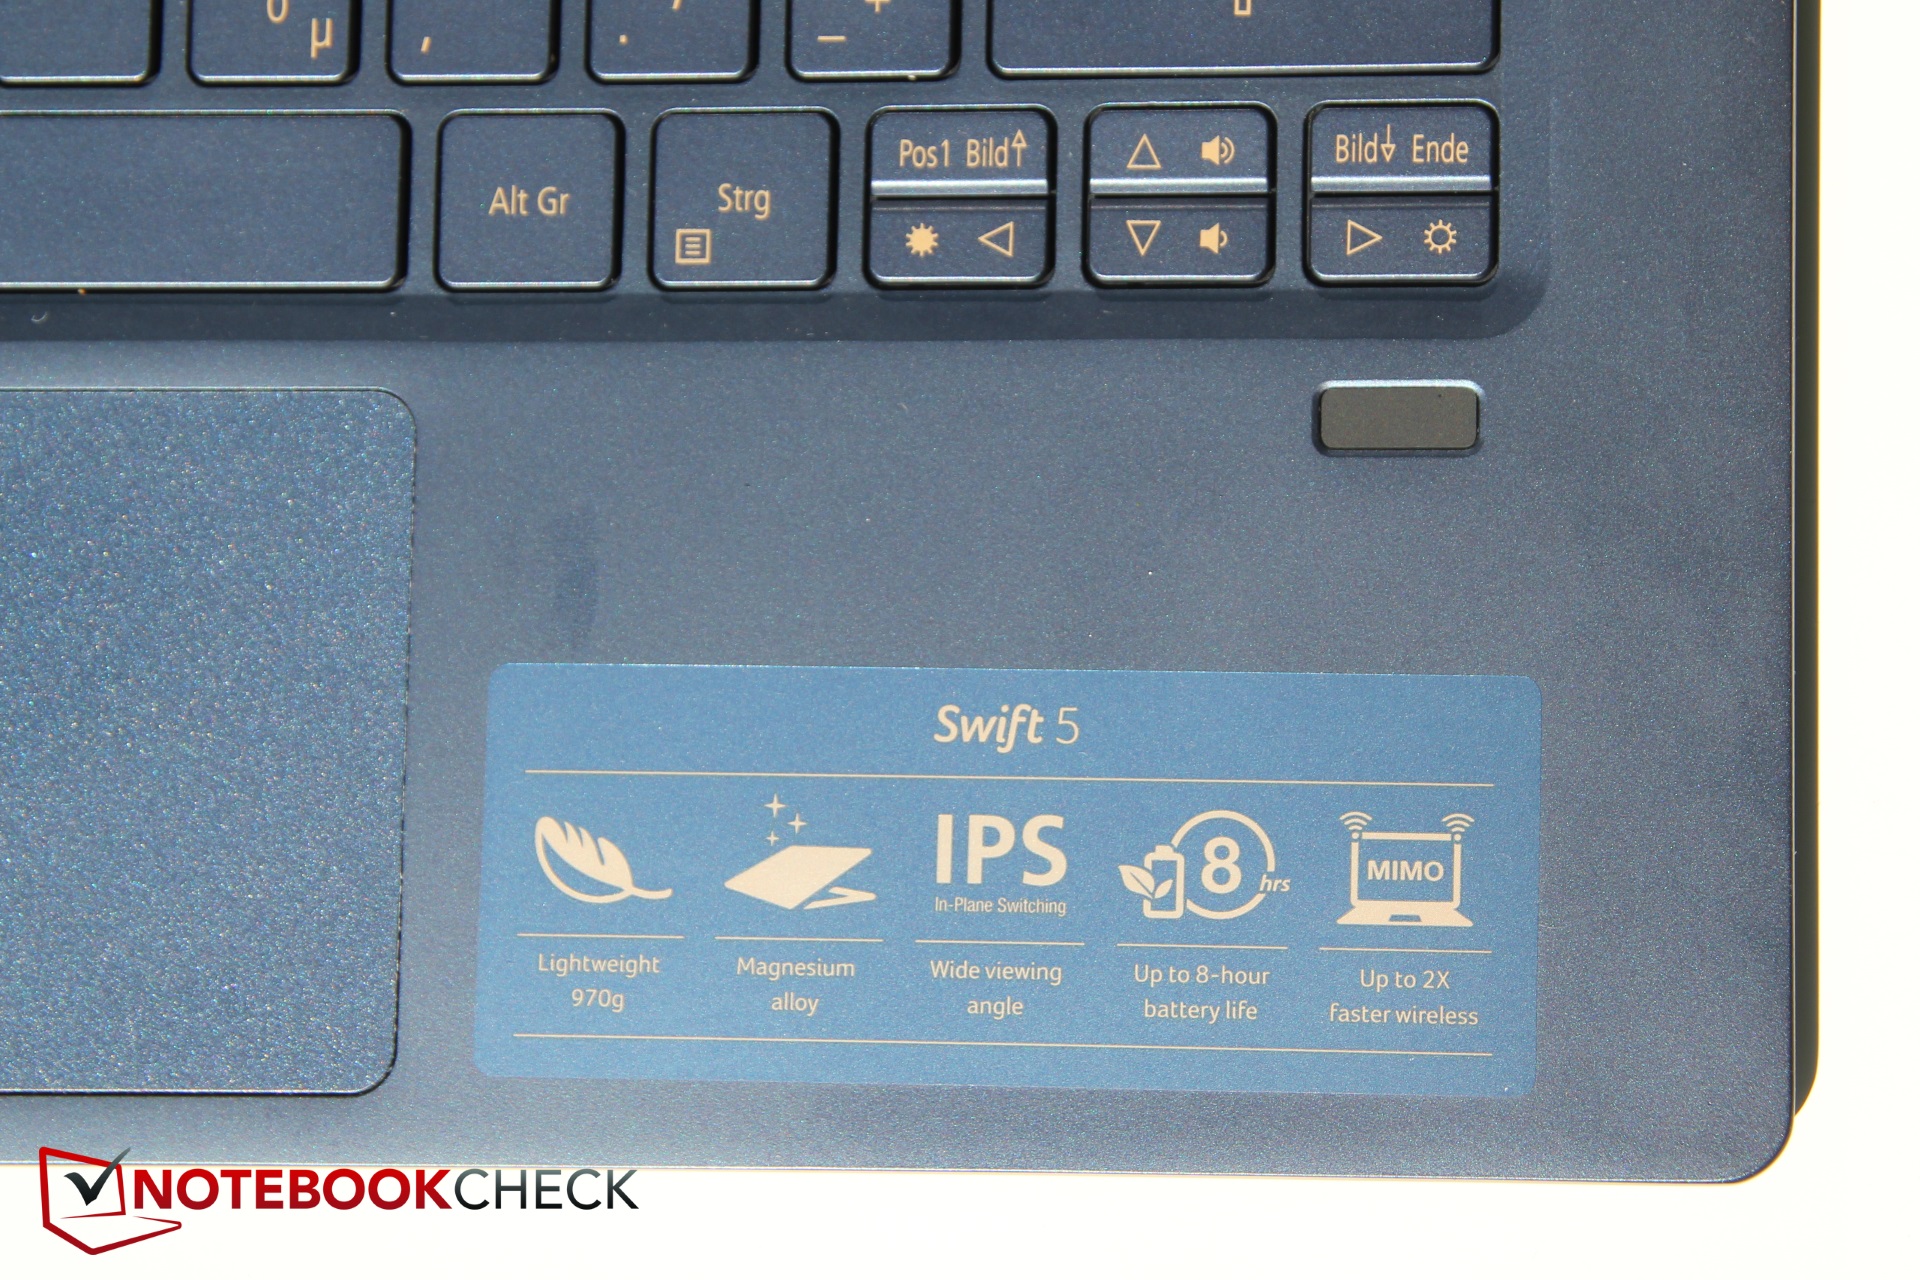
Att utvärdera och ranka Acer Swift 5 har varit en riktig utmaning, minst sagt. Dess låga vikt på under 1 kg är definitivt ett stort plus. Men på grund av den mörka och kraftigt reflekterande skärmen minskar mobiliteten avsevärt.
Positiva aspekter inkluderar en mer än skaplig skärm (bortsett för tidigare nämnda ljusstyrka), en tryckkänslig skärm, snabb SSD och låg energiförbrukning.
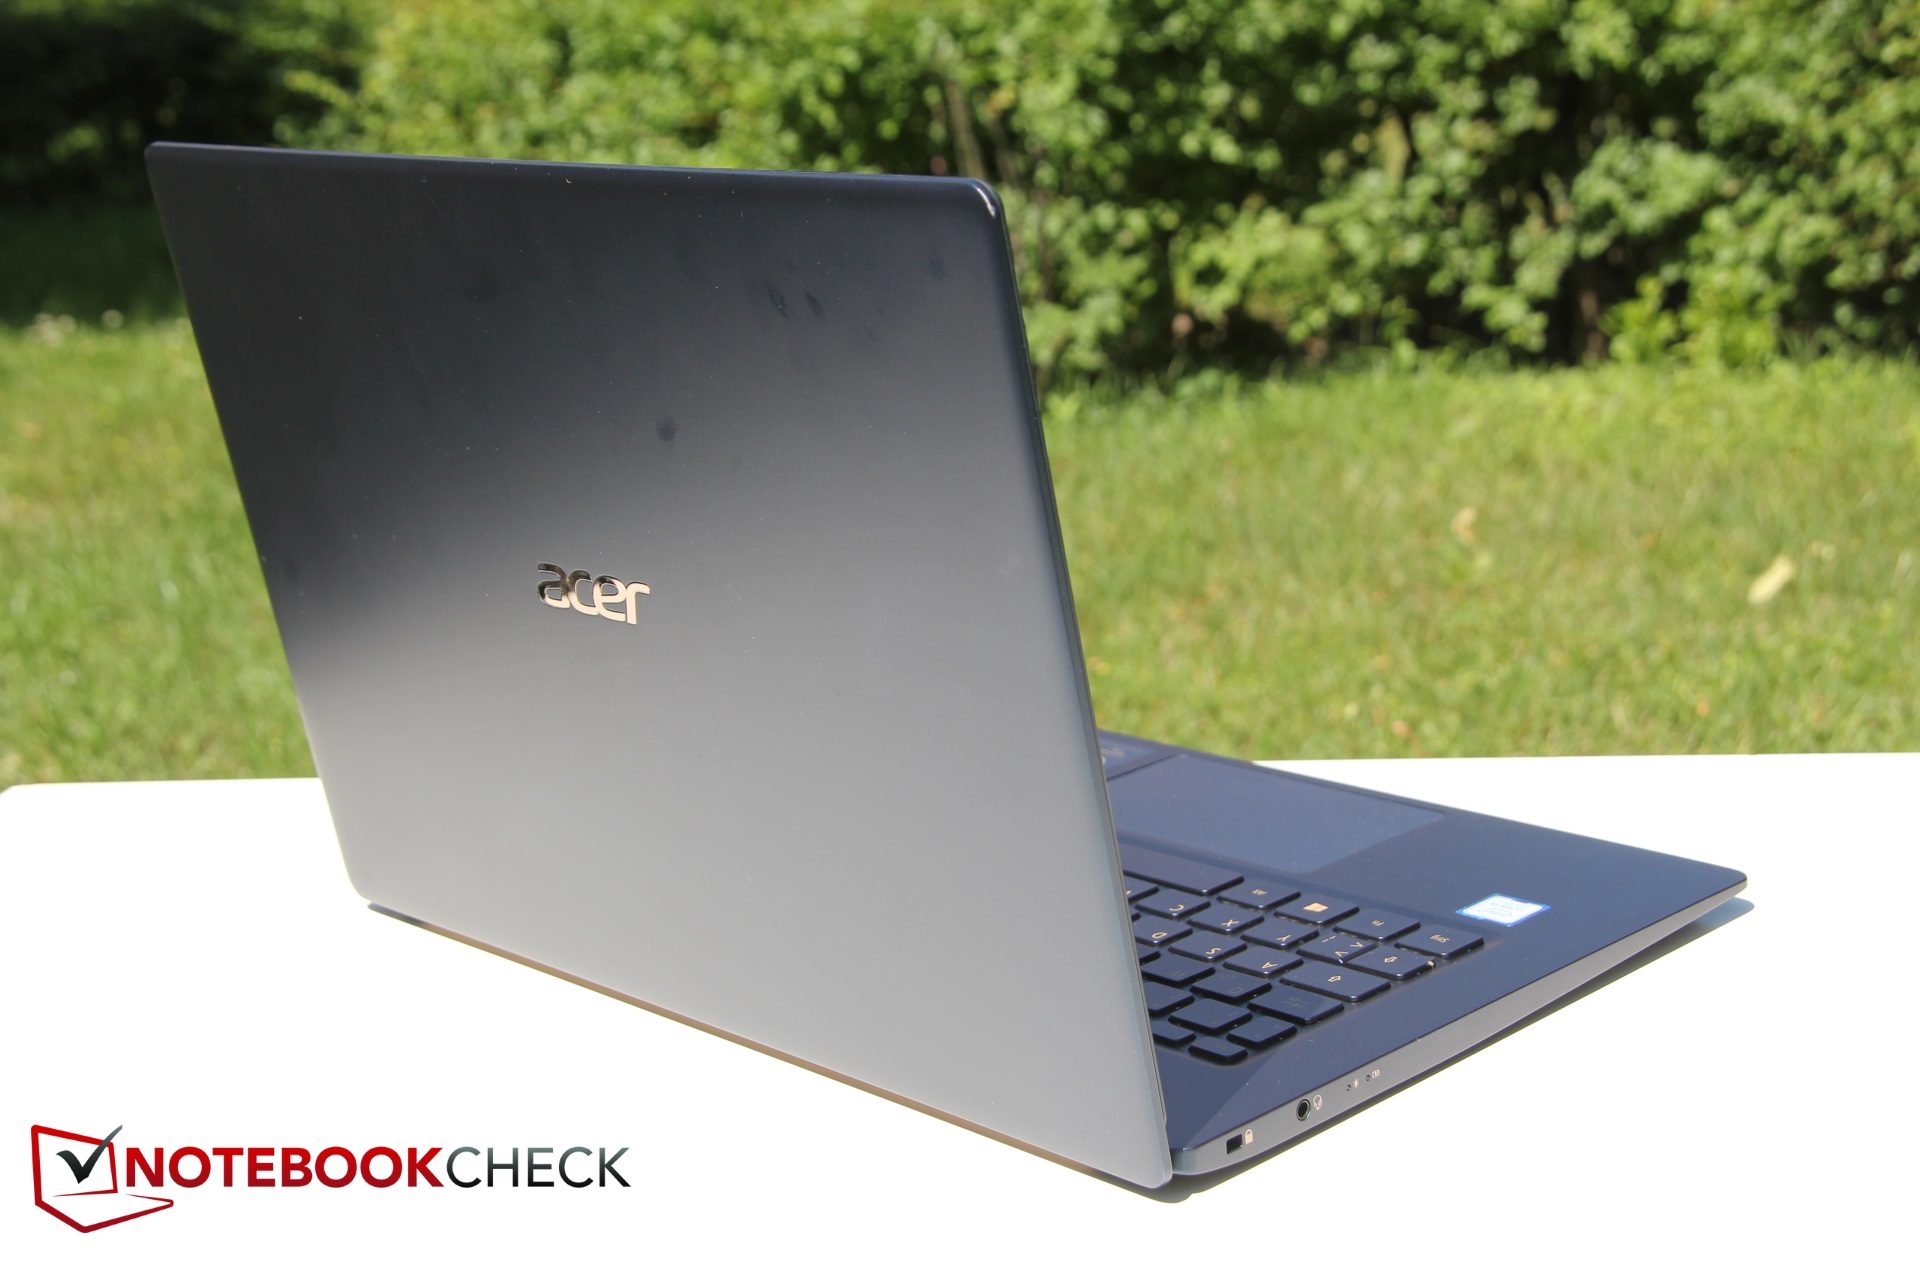
Den andra sidan av myntet visade sig dock vara ganska förödande. Framförallt var det den massiva strypning som enheten uppvisade och som reducerade prestandan markant (men även förklarade den låga energiförbrukningen). Swift 5 klarade av korta stötar helt okej men gav i princip upp helt och hållet när det kom till ihållande belastning - en kompromiss som gjorts nödvändig av den högst portabla och lätta designen. Till och med Swift 5:s egna föregångare visade sig vara snabbare. Batterikapaciteten föll också offer för den låga vikten och på grund av det offrades även batteritiden. Sist men inte minst var konstruktionskvaliteten långt ifrån perfekt.
Acer Swift 5 är en stor kompromiss i den låga viktens namn. Den riktar sig mot en väldigt specifik grupp användare som föredrar en särskilt lätt subnotebook istället för en högpresterande laptop.
Trots sin väldigt specifika målgrupp så anser vi att dom extrema strypningsproblemen behöver åtgärdas. Vår önskelista för en möjlig efterföljare inkluderar också en mer ljusstark skärm av samma kvalitet.
Acer Swift 5 SF514-52T-59HY
- 06/18/2018 v6 (old)
Christian Hintze
Price comparison
