 Deutsch
 English
 Español
 Français
 Italiano
 Nederlands
 Polski
 Português
 Русский
 Türkçe
 Svenska
 Chinese
 Magyar
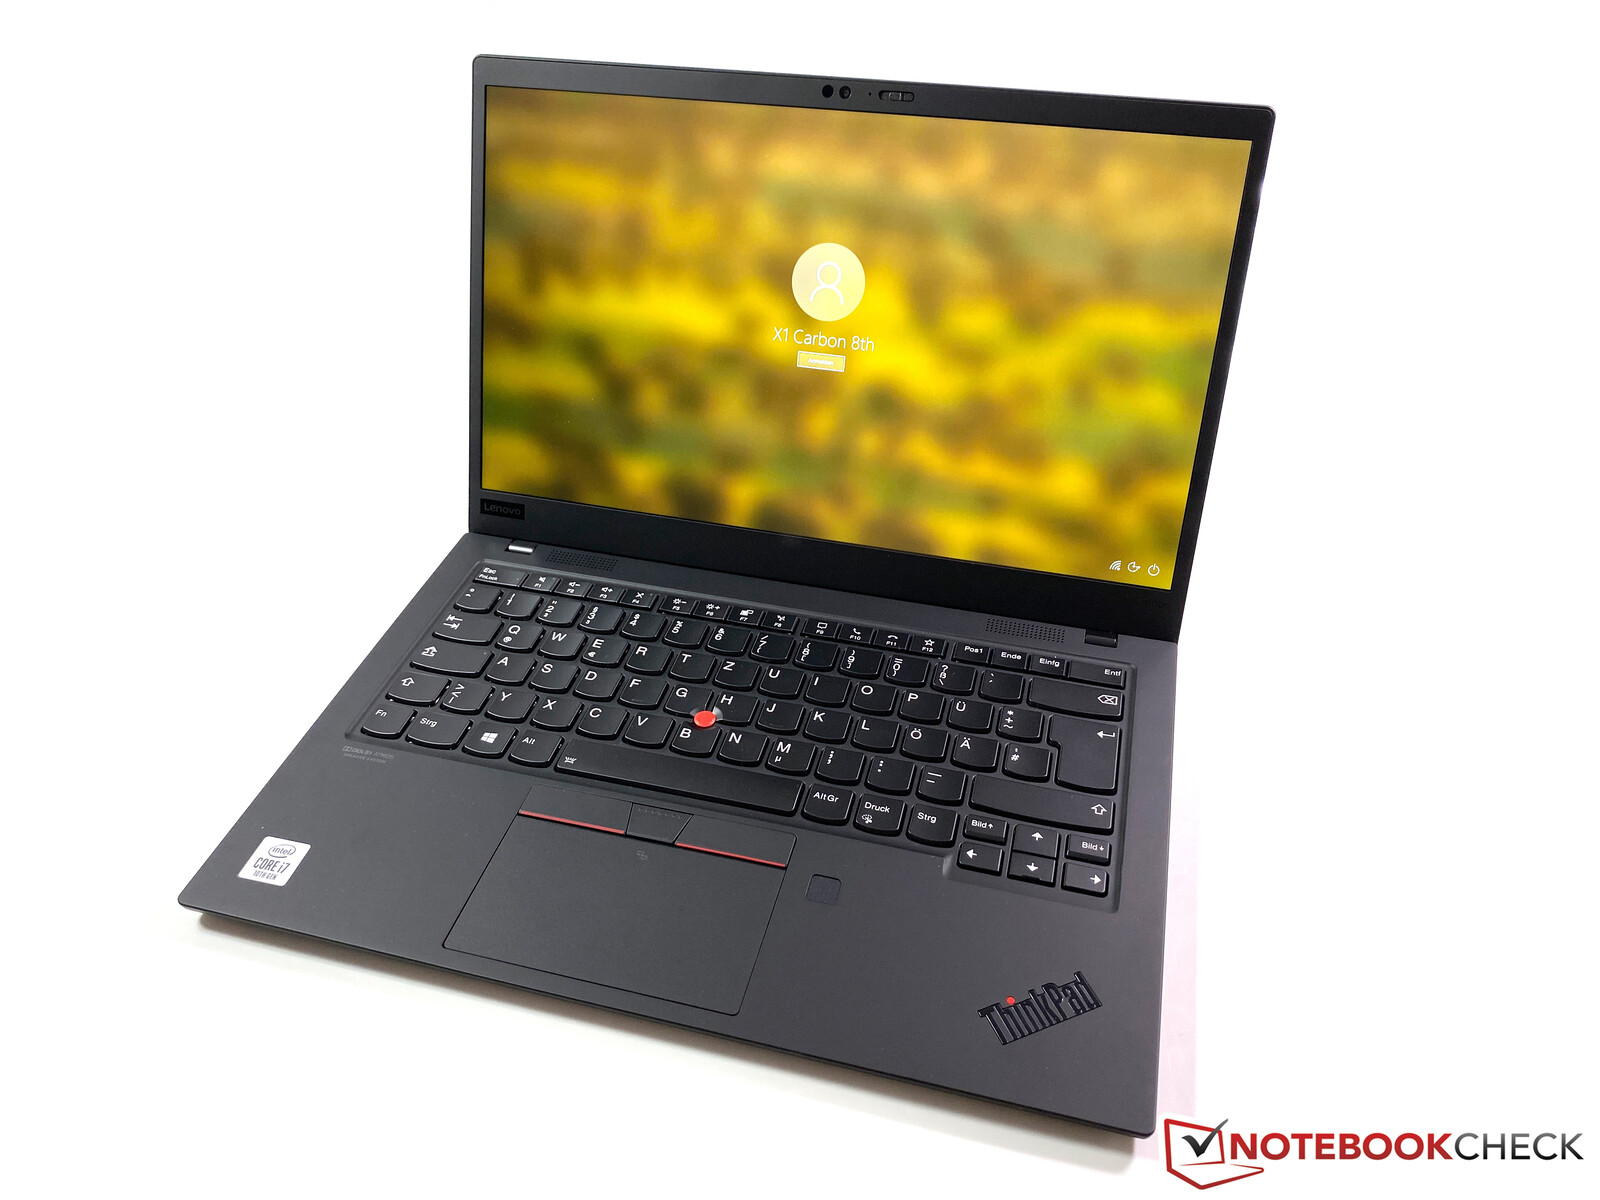
Test: ThinkPad X1 Carbon 2020 - Bekant kontorslaptop med en ny nätadapter (Sammanfattning)
Rating | Date | Model | Weight | Height | Size | Resolution | Best Price |
|---|---|---|---|---|---|---|---|
| 90.2 % | 07/2020 | Lenovo ThinkPad X1 Carbon 2020-20UAS04T00 i7-10510U, UHD Graphics 620 | 1.1 kg | 14.9 mm | 14.00" | 1920x1080 | |
| 90.5 % | 02/2019 | HP Elitebook x360 1040 G5 i7-8650U, UHD Graphics 620 | 1.4 kg | 16.9 mm | 14.00" | 1920x1080 | |
| 92.1 % | 06/2020 | Apple MacBook Pro 13 2020 2GHz i5 10th-Gen i5-1038NG7, Iris Plus Graphics G7 (Ice Lake 64 EU) | 1.4 kg | 15.6 mm | 13.30" | 2560x1600 | |
| 87.2 % | 10/2019 | Dell Latitude 7400-8N6DH i7-8665U, UHD Graphics 620 | 1.5 kg | 18.9 mm | 14.00" | 1920x1080 | |
| 88.5 % | Lenovo ThinkPad X1 Carbon G7 20R1-000YUS i7-10510U, UHD Graphics 620 | 1.2 kg | 15.4 mm | 14.00" | 3840x2160 |
| Networking | |
| iperf3 transmit AX12 | |
| Lenovo ThinkPad X1 Carbon G7 20R1-000YUS | |
| Average Intel Wi-Fi 6 AX201 (49.8 - 1775, n=324) | |
| Lenovo ThinkPad X1 Carbon 2020-20UAS04T00 | |
| Apple MacBook Pro 13 2020 2GHz i5 10th-Gen | |
| Dell Latitude 7400-8N6DH | |
| HP Elitebook x360 1040 G5 | |
| iperf3 receive AX12 | |
| Lenovo ThinkPad X1 Carbon 2020-20UAS04T00 | |
| Average Intel Wi-Fi 6 AX201 (136 - 1743, n=324) | |
| Lenovo ThinkPad X1 Carbon G7 20R1-000YUS | |
| Apple MacBook Pro 13 2020 2GHz i5 10th-Gen | |
| HP Elitebook x360 1040 G5 | |
| Dell Latitude 7400-8N6DH | |


| |||||||||||||||||||||||||
Distribution av ljusstyrkan: 90 %
Mitt på batteriet: 421 cd/m²
Kontrast: 1563:1 (Svärta: 0.27 cd/m²)
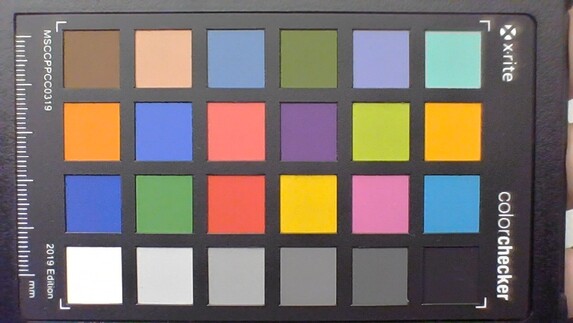
ΔE Color 4.7 | 0.5-29.43 Ø5, calibrated: 2
ΔE Greyscale 6.4 | 0.57-98 Ø5.3
91.5% sRGB (Argyll 1.6.3 3D)
59.5% AdobeRGB 1998 (Argyll 1.6.3 3D)
67.1% AdobeRGB 1998 (Argyll 2.2.0 3D)
91.6% sRGB (Argyll 2.2.0 3D)
68.9% Display P3 (Argyll 2.2.0 3D)
Gamma: 2.12
| Lenovo ThinkPad X1 Carbon 2020-20UAS04T00 BOE NE140FHM-N61, IPS, 1920x1080, 14.00 | HP Elitebook x360 1040 G5 AU Optronics AUO533D, IPS, 1920x1080, 14.00 | Apple MacBook Pro 13 2020 2GHz i5 10th-Gen APPA03D, IPS, 2560x1600, 13.30 | Dell Latitude 7400-8N6DH AU Optronics B140HAN, IPS, 1920x1080, 14.00 | Lenovo ThinkPad X1 Carbon G7 20R1-000YUS BOE NV140QUM-N53, IPS, 3840x2160, 14.00 | |
|---|---|---|---|---|---|
| Display | -2% | 27% | 0% | 18% | |
| Display P3 Coverage | 68.9 | 64.3 -7% | 98.8 43% | 66.1 -4% | 83 20% |
| sRGB Coverage | 91.6 | 94.1 3% | 99.9 9% | 95.3 4% | 99.7 9% |
| AdobeRGB 1998 Coverage | 67.1 | 65.5 -2% | 86.4 29% | 67.5 1% | 83.1 24% |
| Response Times | -30% | 1549% | -10% | -25% | |
| Response Time Grey 50% / Grey 80% * | 64.8 ? | 70.8 ? -9% | 46 ? 29% | 62 ? 4% | 49.2 ? 24% |
| Response Time Black / White * | 30.4 ? | 34.4 ? -13% | 32.4 ? -7% | 37.6 ? -24% | 32.2 ? -6% |
| PWM Frequency | 2404 ? | 735 ? -69% | 113600 ? 4625% | 201.6 ? -92% | |
| Screen | 12% | 29% | 5% | -13% | |
| Brightness middle | 422 | 416.3 -1% | 512 21% | 289 -32% | 532 26% |
| Brightness | 395 | 400 1% | 491 24% | 286 -28% | 513 30% |
| Brightness Distribution | 90 | 89 -1% | 91 1% | 91 1% | 90 0% |
| Black Level * | 0.27 | 0.29 -7% | 0.32 -19% | 0.16 41% | 0.41 -52% |
| Contrast | 1563 | 1436 -8% | 1600 2% | 1806 16% | 1298 -17% |
| Colorchecker dE 2000 * | 4.7 | 2.69 43% | 1.7 64% | 4.7 -0% | 6.88 -46% |
| Colorchecker dE 2000 max. * | 10 | 4.95 50% | 3.4 66% | 8.7 13% | 12.65 -27% |
| Colorchecker dE 2000 calibrated * | 2 | 2.13 -7% | 1 50% | 1.3 35% | 2.52 -26% |
| Greyscale dE 2000 * | 6.4 | 2.9 55% | 1.9 70% | 6.4 -0% | 10.5 -64% |
| Gamma | 2.12 104% | 2.4 92% | 2.19 100% | 2.54 87% | 1.98 111% |
| CCT | 7106 91% | 6623 98% | 6817 95% | 5977 109% | 7394 88% |
| Color Space (Percent of AdobeRGB 1998) | 59.5 | 60.1 1% | 77.4 30% | 61.2 3% | 74.1 25% |
| Color Space (Percent of sRGB) | 91.5 | 94.5 3% | 99.9 9% | 95.1 4% | 99.7 9% |
| Total Average (Program / Settings) | -7% /
2% | 535% /
297% | -2% /
2% | -7% /
-10% |
* ... smaller is better
Display Response Times
| ↔ Response Time Black to White | ||
|---|---|---|
| 30.4 ms ... rise ↗ and fall ↘ combined | ↗ 10.8 ms rise | 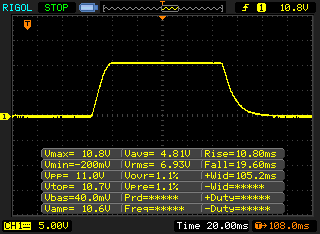 |
| ↘ 19.6 ms fall | ||
| The screen shows slow response rates in our tests and will be unsatisfactory for gamers. In comparison, all tested devices range from 0.1 (minimum) to 240 (maximum) ms. » 80 % of all devices are better. This means that the measured response time is worse than the average of all tested devices (21.4 ms). | ||
| ↔ Response Time 50% Grey to 80% Grey | ||
| 64.8 ms ... rise ↗ and fall ↘ combined | ↗ 30.8 ms rise | 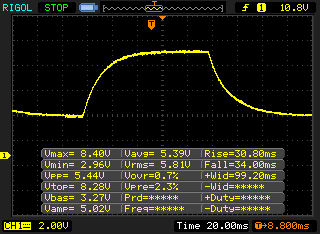 |
| ↘ 34 ms fall | ||
| The screen shows slow response rates in our tests and will be unsatisfactory for gamers. In comparison, all tested devices range from 0.2 (minimum) to 636 (maximum) ms. » 97 % of all devices are better. This means that the measured response time is worse than the average of all tested devices (33.7 ms). | ||
Screen Flickering / PWM (Pulse-Width Modulation)
| Screen flickering / PWM detected | 2404 Hz | ≤ 50 % brightness setting | 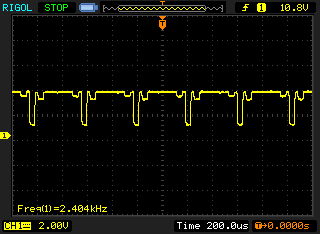 |
The display backlight flickers at 2404 Hz (worst case, e.g., utilizing PWM) Flickering detected at a brightness setting of 50 % and below. There should be no flickering or PWM above this brightness setting. The frequency of 2404 Hz is quite high, so most users sensitive to PWM should not notice any flickering. In comparison: 53 % of all tested devices do not use PWM to dim the display. If PWM was detected, an average of 17844 (minimum: 5 - maximum: 3846000) Hz was measured. | |||
Cinebench R15: CPU Single 64Bit | CPU Multi 64Bit
Blender: v2.79 BMW27 CPU
7-Zip 18.03: 7z b 4 -mmt1 | 7z b 4
Geekbench 5.5: Single-Core | Multi-Core
HWBOT x265 Benchmark v2.2: 4k Preset
LibreOffice : 20 Documents To PDF
R Benchmark 2.5: Overall mean
| Cinebench R20 / CPU (Single Core) | |
| Average of class Subnotebook (216 - 738, n=64, last 2 years) | |
| Lenovo ThinkPad X1 Carbon G7 20R1-000YUS | |
| Dell Latitude 7400-8N6DH | |
| Lenovo ThinkPad X1 Carbon 2020-20UAS04T00 | |
| Apple MacBook Pro 13 2020 2GHz i5 10th-Gen | |
| Average Intel Core i7-10510U (362 - 497, n=37) | |
| Cinebench R20 / CPU (Multi Core) | |
| Average of class Subnotebook (810 - 6314, n=64, last 2 years) | |
| Apple MacBook Pro 13 2020 2GHz i5 10th-Gen | |
| Lenovo ThinkPad X1 Carbon G7 20R1-000YUS | |
| Dell Latitude 7400-8N6DH | |
| Lenovo ThinkPad X1 Carbon 2020-20UAS04T00 | |
| Average Intel Core i7-10510U (1015 - 1897, n=38) | |
| Cinebench R15 / CPU Single 64Bit | |
| Average of class Subnotebook (91.8 - 280, n=62, last 2 years) | |
| Lenovo ThinkPad X1 Carbon 2020-20UAS04T00 | |
| Lenovo ThinkPad X1 Carbon G7 20R1-000YUS | |
| Dell Latitude 7400-8N6DH | |
| Average Intel Core i7-10510U (113 - 202, n=42) | |
| HP Elitebook x360 1040 G5 | |
| Apple MacBook Pro 13 2020 2GHz i5 10th-Gen | |
| Cinebench R15 / CPU Multi 64Bit | |
| Average of class Subnotebook (514 - 2581, n=70, last 2 years) | |
| Lenovo ThinkPad X1 Carbon G7 20R1-000YUS | |
| Apple MacBook Pro 13 2020 2GHz i5 10th-Gen | |
| Lenovo ThinkPad X1 Carbon 2020-20UAS04T00 | |
| Dell Latitude 7400-8N6DH | |
| Average Intel Core i7-10510U (482 - 856, n=45) | |
| HP Elitebook x360 1040 G5 | |
| Blender / v2.79 BMW27 CPU | |
| Average Intel Core i7-10510U (628 - 1051, n=31) | |
| Dell Latitude 7400-8N6DH | |
| Lenovo ThinkPad X1 Carbon 2020-20UAS04T00 | |
| Average of class Subnotebook (201 - 1600, n=66, last 2 years) | |
| Apple MacBook Pro 13 2020 2GHz i5 10th-Gen | |
| 7-Zip 18.03 / 7z b 4 -mmt1 | |
| Average of class Subnotebook (2197 - 6403, n=58, last 2 years) | |
| Dell Latitude 7400-8N6DH | |
| Average Intel Core i7-10510U (3747 - 4981, n=31) | |
| Lenovo ThinkPad X1 Carbon 2020-20UAS04T00 | |
| Apple MacBook Pro 13 2020 2GHz i5 10th-Gen | |
| 7-Zip 18.03 / 7z b 4 | |
| Average of class Subnotebook (16223 - 67444, n=57, last 2 years) | |
| Apple MacBook Pro 13 2020 2GHz i5 10th-Gen | |
| Lenovo ThinkPad X1 Carbon 2020-20UAS04T00 | |
| Dell Latitude 7400-8N6DH | |
| Average Intel Core i7-10510U (12196 - 21298, n=31) | |
| Geekbench 5.5 / Single-Core | |
| Average of class Subnotebook (672 - 2350, n=65, last 2 years) | |
| Apple MacBook Pro 13 2020 2GHz i5 10th-Gen | |
| Lenovo ThinkPad X1 Carbon 2020-20UAS04T00 | |
| Average Intel Core i7-10510U (977 - 1287, n=31) | |
| Geekbench 5.5 / Multi-Core | |
| Average of class Subnotebook (4274 - 12580, n=65, last 2 years) | |
| Apple MacBook Pro 13 2020 2GHz i5 10th-Gen | |
| Lenovo ThinkPad X1 Carbon 2020-20UAS04T00 | |
| Average Intel Core i7-10510U (2474 - 4484, n=31) | |
| HWBOT x265 Benchmark v2.2 / 4k Preset | |
| Average of class Subnotebook (1.5 - 19.4, n=56, last 2 years) | |
| Apple MacBook Pro 13 2020 2GHz i5 10th-Gen | |
| Lenovo ThinkPad X1 Carbon 2020-20UAS04T00 | |
| Average Intel Core i7-10510U (3.41 - 6.04, n=31) | |
| Dell Latitude 7400-8N6DH | |
| LibreOffice / 20 Documents To PDF | |
| Apple MacBook Pro 13 2020 2GHz i5 10th-Gen | |
| Average Intel Core i7-10510U (50.7 - 77.8, n=27) | |
| Average of class Subnotebook (40.1 - 120.5, n=57, last 2 years) | |
| Lenovo ThinkPad X1 Carbon 2020-20UAS04T00 | |
| R Benchmark 2.5 / Overall mean | |
| Apple MacBook Pro 13 2020 2GHz i5 10th-Gen | |
| Average Intel Core i7-10510U (0.637 - 0.81, n=28) | |
| Lenovo ThinkPad X1 Carbon 2020-20UAS04T00 | |
| Average of class Subnotebook (0.4397 - 1.236, n=57, last 2 years) | |
* ... smaller is better
| PCMark 8 | |
| Home Score Accelerated v2 | |
| Average of class Subnotebook (4730 - 5285, n=3, last 2 years) | |
| Lenovo ThinkPad X1 Carbon 2020-20UAS04T00 | |
| Apple MacBook Pro 13 2020 2GHz i5 10th-Gen | |
| Average Intel Core i7-10510U, Intel UHD Graphics 620 (3157 - 4251, n=13) | |
| Dell Latitude 7400-8N6DH | |
| HP Elitebook x360 1040 G5 | |
| Lenovo ThinkPad X1 Carbon G7 20R1-000YUS | |
| Work Score Accelerated v2 | |
| Lenovo ThinkPad X1 Carbon 2020-20UAS04T00 | |
| Dell Latitude 7400-8N6DH | |
| Average Intel Core i7-10510U, Intel UHD Graphics 620 (3734 - 5366, n=13) | |
| HP Elitebook x360 1040 G5 | |
| Lenovo ThinkPad X1 Carbon G7 20R1-000YUS | |
| Average of class Subnotebook (2972 - 5271, n=3, last 2 years) | |
| Apple MacBook Pro 13 2020 2GHz i5 10th-Gen | |
| PCMark 8 Home Score Accelerated v2 | 4251 poäng | |
| PCMark 8 Creative Score Accelerated v2 | 5447 poäng | |
| PCMark 8 Work Score Accelerated v2 | 5296 poäng | |
| PCMark 10 Score | 4527 poäng | |
Hjälp | ||
| DPC Latencies / LatencyMon - interrupt to process latency (max), Web, Youtube, Prime95 | |
| Lenovo ThinkPad X1 Carbon 2020-20UAS04T00 | |
* ... smaller is better
| Lenovo ThinkPad X1 Carbon 2020-20UAS04T00 Samsung SSD PM981a MZVLB512HBJQ | HP Elitebook x360 1040 G5 Samsung SSD PM981 MZVLB512HAJQ | Apple MacBook Pro 13 2020 2GHz i5 10th-Gen Apple SSD SM0512F | Dell Latitude 7400-8N6DH Samsung SSD PM981 MZVLB512HAJQ | Lenovo ThinkPad X1 Carbon G7 20R1-000YUS WDC PC SN730 SDBPNTY-512G | Average Samsung SSD PM981a MZVLB512HBJQ | |
|---|---|---|---|---|---|---|
| CrystalDiskMark 5.2 / 6 | -8% | -39% | -12% | -1% | 2% | |
| Write 4K | 185 | 122.7 -34% | 28.16 -85% | 118.6 -36% | 151.5 -18% | 140.8 ? -24% |
| Read 4K | 50.6 | 46.57 -8% | 17.5 -65% | 44.68 -12% | 45.83 -9% | 48.6 ? -4% |
| Write Seq | 1543 | 1725 12% | 1195 -23% | 1866 21% | 2060 34% | 2106 ? 36% |
| Read Seq | 1509 | 2392 59% | 1470 -3% | 2173 44% | 1973 31% | 2099 ? 39% |
| Write 4K Q32T1 | 488.8 | 470.6 -4% | 205 -58% | 330.9 -32% | 489.8 0% | 451 ? -8% |
| Read 4K Q32T1 | 579 | 313.2 -46% | 692 20% | 343.1 -41% | 386.2 -33% | 482 ? -17% |
| Write Seq Q32T1 | 2986 | 1869 -37% | 1475 -51% | 1927 -35% | 2703 -9% | 2903 ? -3% |
| Read Seq Q32T1 | 3555 | 3380 -5% | 1920 -46% | 3528 -1% | 3376 -5% | 3511 ? -1% |
| AS SSD | -24% | -127% | -31% | -49% | -21% | |
| Seq Read | 2659 | 1816 -32% | 1300 -51% | 2381 -10% | 1786 -33% | 2412 ? -9% |
| Seq Write | 2551 | 1270 -50% | 1518 -40% | 1290 -49% | 1259 -51% | 1983 ? -22% |
| 4K Read | 56.4 | 46.25 -18% | 14.09 -75% | 52 -8% | 45.86 -19% | 53.1 ? -6% |
| 4K Write | 158 | 104.1 -34% | 24.25 -85% | 134.8 -15% | 147.9 -6% | 131.1 ? -17% |
| 4K-64 Read | 1317 | 1342 2% | 725 -45% | 530 -60% | 885 -33% | 1201 ? -9% |
| 4K-64 Write | 1786 | 1209 -32% | 169.6 -91% | 1177 -34% | 950 -47% | 1726 ? -3% |
| Access Time Read * | 0.047 | 0.043 9% | 0.172 -266% | 0.05 -6% | 0.058 -23% | 0.05525 ? -18% |
| Access Time Write * | 0.024 | 0.035 -46% | 0.155 -546% | 0.032 -33% | 0.074 -208% | 0.05394 ? -125% |
| Score Read | 1640 | 1569 -4% | 869 -47% | 820 -50% | 1110 -32% | 1495 ? -9% |
| Score Write | 2199 | 1440 -35% | 346 -84% | 1441 -34% | 1224 -44% | 2055 ? -7% |
| Score Total | 4682 | 3790 -19% | 1667 -64% | 2652 -43% | 2885 -38% | 4303 ? -8% |
| Copy ISO MB/s | 2034 | 1719 | 1384 | 1894 ? | ||
| Copy Program MB/s | 450.3 | 499.6 | 525 | 539 ? | ||
| Copy Game MB/s | 1024 | 1091 | 1008 | 1193 ? | ||
| Total Average (Program / Settings) | -16% /
-17% | -83% /
-90% | -22% /
-23% | -25% /
-29% | -10% /
-11% |
* ... smaller is better

DiskSpd Read Loop, Queue Depth 8
| 3DMark 11 - 1280x720 Performance GPU | |
| Average of class Subnotebook (2979 - 16904, n=55, last 2 years) | |
| Apple MacBook Pro 13 2020 2GHz i5 10th-Gen | |
| Lenovo ThinkPad X1 Carbon 2020-20UAS04T00 | |
| Lenovo ThinkPad X1 Carbon G7 20R1-000YUS | |
| HP Elitebook x360 1040 G5 | |
| Dell Latitude 7400-8N6DH | |
| Average Intel UHD Graphics 620 (1144 - 3432, n=244) | |
| 3DMark | |
| 1280x720 Cloud Gate Standard Graphics | |
| Average of class Subnotebook (13768 - 65911, n=39, last 2 years) | |
| Apple MacBook Pro 13 2020 2GHz i5 10th-Gen | |
| HP Elitebook x360 1040 G5 | |
| Lenovo ThinkPad X1 Carbon 2020-20UAS04T00 | |
| Lenovo ThinkPad X1 Carbon G7 20R1-000YUS | |
| Dell Latitude 7400-8N6DH | |
| Average Intel UHD Graphics 620 (6205 - 16400, n=225) | |
| 1920x1080 Fire Strike Graphics | |
| Average of class Subnotebook (2837 - 12349, n=59, last 2 years) | |
| Apple MacBook Pro 13 2020 2GHz i5 10th-Gen | |
| Lenovo ThinkPad X1 Carbon 2020-20UAS04T00 | |
| Lenovo ThinkPad X1 Carbon G7 20R1-000YUS | |
| Dell Latitude 7400-8N6DH | |
| Average Intel UHD Graphics 620 (557 - 2608, n=213) | |
| 2560x1440 Time Spy Graphics | |
| Average of class Subnotebook (811 - 4773, n=58, last 2 years) | |
| Apple MacBook Pro 13 2020 2GHz i5 10th-Gen | |
| Lenovo ThinkPad X1 Carbon 2020-20UAS04T00 | |
| Lenovo ThinkPad X1 Carbon G7 20R1-000YUS | |
| Dell Latitude 7400-8N6DH | |
| Average Intel UHD Graphics 620 (299 - 797, n=88) | |
| 3DMark 11 Performance | 2240 poäng | |
| 3DMark Ice Storm Standard Score | 71820 poäng | |
| 3DMark Cloud Gate Standard Score | 9816 poäng | |
| 3DMark Fire Strike Score | 1239 poäng | |
| 3DMark Time Spy Score | 497 poäng | |
Hjälp | ||
| låg | med. | hög | ultra | 4K | |
| The Witcher 3 (2015) | 18.2 | 12.1 | |||
| Dota 2 Reborn (2015) | 85.8 | 49.6 | 23 | 20.2 | 7.3 |
| X-Plane 11.11 (2018) | 13.9 | 10.3 | 10.9 | 6.59 | |
| Far Cry 5 (2018) | 16 | ||||
| F1 2019 (2019) | 30 | 12 |
Ljudnivå
| Låg belastning |
| 29.5 / 29.5 / 29.5 dB(A) |
| Hög belastning |
| 31.6 / 33.9 dB(A) |
 | ||
30 dB tyst 40 dB(A) hörbar 50 dB(A) högt ljud |
||
min: | ||
| Lenovo ThinkPad X1 Carbon 2020-20UAS04T00 UHD Graphics 620, i7-10510U, Samsung SSD PM981a MZVLB512HBJQ | HP Elitebook x360 1040 G5 UHD Graphics 620, i7-8650U, Samsung SSD PM981 MZVLB512HAJQ | Apple MacBook Pro 13 2020 2GHz i5 10th-Gen Iris Plus Graphics G7 (Ice Lake 64 EU), i5-1038NG7, Apple SSD SM0512F | Dell Latitude 7400-8N6DH UHD Graphics 620, i7-8665U, Samsung SSD PM981 MZVLB512HAJQ | Lenovo ThinkPad X1 Carbon G7 20R1-000YUS UHD Graphics 620, i7-10510U, WDC PC SN730 SDBPNTY-512G | Lenovo ThinkPad X1 Carbon 2019-20QE000VGE UHD Graphics 620, i7-8665U, WDC PC SN720 SDAQNTW-512G | |
|---|---|---|---|---|---|---|
| Noise | 1% | -6% | 0% | -2% | 3% | |
| off / environment * | 29.5 | 28.3 4% | 29.6 -0% | 28.6 3% | 28.2 4% | 28.4 4% |
| Idle Minimum * | 29.5 | 28.3 4% | 29.6 -0% | 28.6 3% | 28.2 4% | 28.4 4% |
| Idle Average * | 29.5 | 28.3 4% | 29.6 -0% | 28.6 3% | 28.2 4% | 28.4 4% |
| Idle Maximum * | 29.5 | 28.3 4% | 29.6 -0% | 29.1 1% | 29.4 -0% | 28.6 3% |
| Load Average * | 31.6 | 32.6 -3% | 34.4 -9% | 31.5 -0% | 31.5 -0% | 31.5 -0% |
| Load Maximum * | 33.9 | 36.6 -8% | 42.1 -24% | 36.9 -9% | 41.2 -22% | 33.1 2% |
| Witcher 3 ultra * | 36.1 |
* ... smaller is better
(-) The maximum temperature on the upper side is 45.2 °C / 113 F, compared to the average of 35.9 °C / 97 F, ranging from 21.4 to 59 °C for the class Subnotebook.
(-) The bottom heats up to a maximum of 45.7 °C / 114 F, compared to the average of 39.4 °C / 103 F
(+) In idle usage, the average temperature for the upper side is 24.1 °C / 75 F, compared to the device average of 30.7 °C / 87 F.
(+) The palmrests and touchpad are cooler than skin temperature with a maximum of 28.8 °C / 83.8 F and are therefore cool to the touch.
(±) The average temperature of the palmrest area of similar devices was 28.3 °C / 82.9 F (-0.5 °C / -0.9 F).
| Av/Standby | |
| Låg belastning | |
| Hög belastning |
|
| Lenovo ThinkPad X1 Carbon 2020-20UAS04T00 i7-10510U, UHD Graphics 620, Samsung SSD PM981a MZVLB512HBJQ, IPS, 1920x1080, 14.00 | HP Elitebook x360 1040 G5 i7-8650U, UHD Graphics 620, Samsung SSD PM981 MZVLB512HAJQ, IPS, 1920x1080, 14.00 | Apple MacBook Pro 13 2020 2GHz i5 10th-Gen i5-1038NG7, Iris Plus Graphics G7 (Ice Lake 64 EU), Apple SSD SM0512F, IPS, 2560x1600, 13.30 | Dell Latitude 7400-8N6DH i7-8665U, UHD Graphics 620, Samsung SSD PM981 MZVLB512HAJQ, IPS, 1920x1080, 14.00 | Lenovo ThinkPad X1 Carbon G7 20R1-000YUS i7-10510U, UHD Graphics 620, WDC PC SN730 SDBPNTY-512G, IPS, 3840x2160, 14.00 | Average Intel UHD Graphics 620 | Average of class Subnotebook | |
|---|---|---|---|---|---|---|---|
| Power Consumption | 1% | -22% | -6% | -31% | 0% | -26% | |
| Idle Minimum * | 2.96 | 2.7 9% | 3.8 -28% | 3.9 -32% | 3.5 -18% | 3.81 ? -29% | 4.86 ? -64% |
| Idle Average * | 5.9 | 6.5 -10% | 8.6 -46% | 6.1 -3% | 10.8 -83% | 6.94 ? -18% | 8.31 ? -41% |
| Idle Maximum * | 9.1 | 11.5 -26% | 10.3 -13% | 8.2 10% | 12.5 -37% | 8.75 ? 4% | 10.4 ? -14% |
| Load Average * | 42.1 | 38.7 8% | 52.1 -24% | 41 3% | 47.2 -12% | 35 ? 17% | 46.3 ? -10% |
| Load Maximum * | 65.1 | 50.5 22% | 65.2 -0% | 69.7 -7% | 68.8 -6% | 47.5 ? 27% | 66.7 ? -2% |
| Witcher 3 ultra * | 48.2 |
* ... smaller is better
| Lenovo ThinkPad X1 Carbon 2020-20UAS04T00 i7-10510U, UHD Graphics 620, 51 Wh | HP Elitebook x360 1040 G5 i7-8650U, UHD Graphics 620, 56 Wh | Apple MacBook Pro 13 2020 2GHz i5 10th-Gen i5-1038NG7, Iris Plus Graphics G7 (Ice Lake 64 EU), 58 Wh | Dell Latitude 7400-8N6DH i7-8665U, UHD Graphics 620, 60 Wh | Lenovo ThinkPad X1 Carbon G7 20R1-000YUS i7-10510U, UHD Graphics 620, 51 Wh | Lenovo ThinkPad X1 Carbon 2019-20QES01L00 i7-8565U, UHD Graphics 620, 51 Wh | Average of class Subnotebook | |
|---|---|---|---|---|---|---|---|
| Battery Runtime | 50% | 5% | 25% | -1% | -13% | 9% | |
| H.264 | 770 | 687 -11% | 862 12% | 688 -11% | 794 ? 3% | ||
| WiFi v1.3 | 604 | 623 3% | 728 21% | 696 15% | 598 -1% | 562 -7% | 629 ? 4% |
| Load | 95 | 187 97% | 141 48% | 76 -20% | 115.4 ? 21% | ||
| Reader / Idle | 1673 | 1252 ? |
För
Emot
Omdöme - Minde uppdatering utan några egentliga fördelar
Läs den fullständiga versionen av den här recensionen på engelska här.
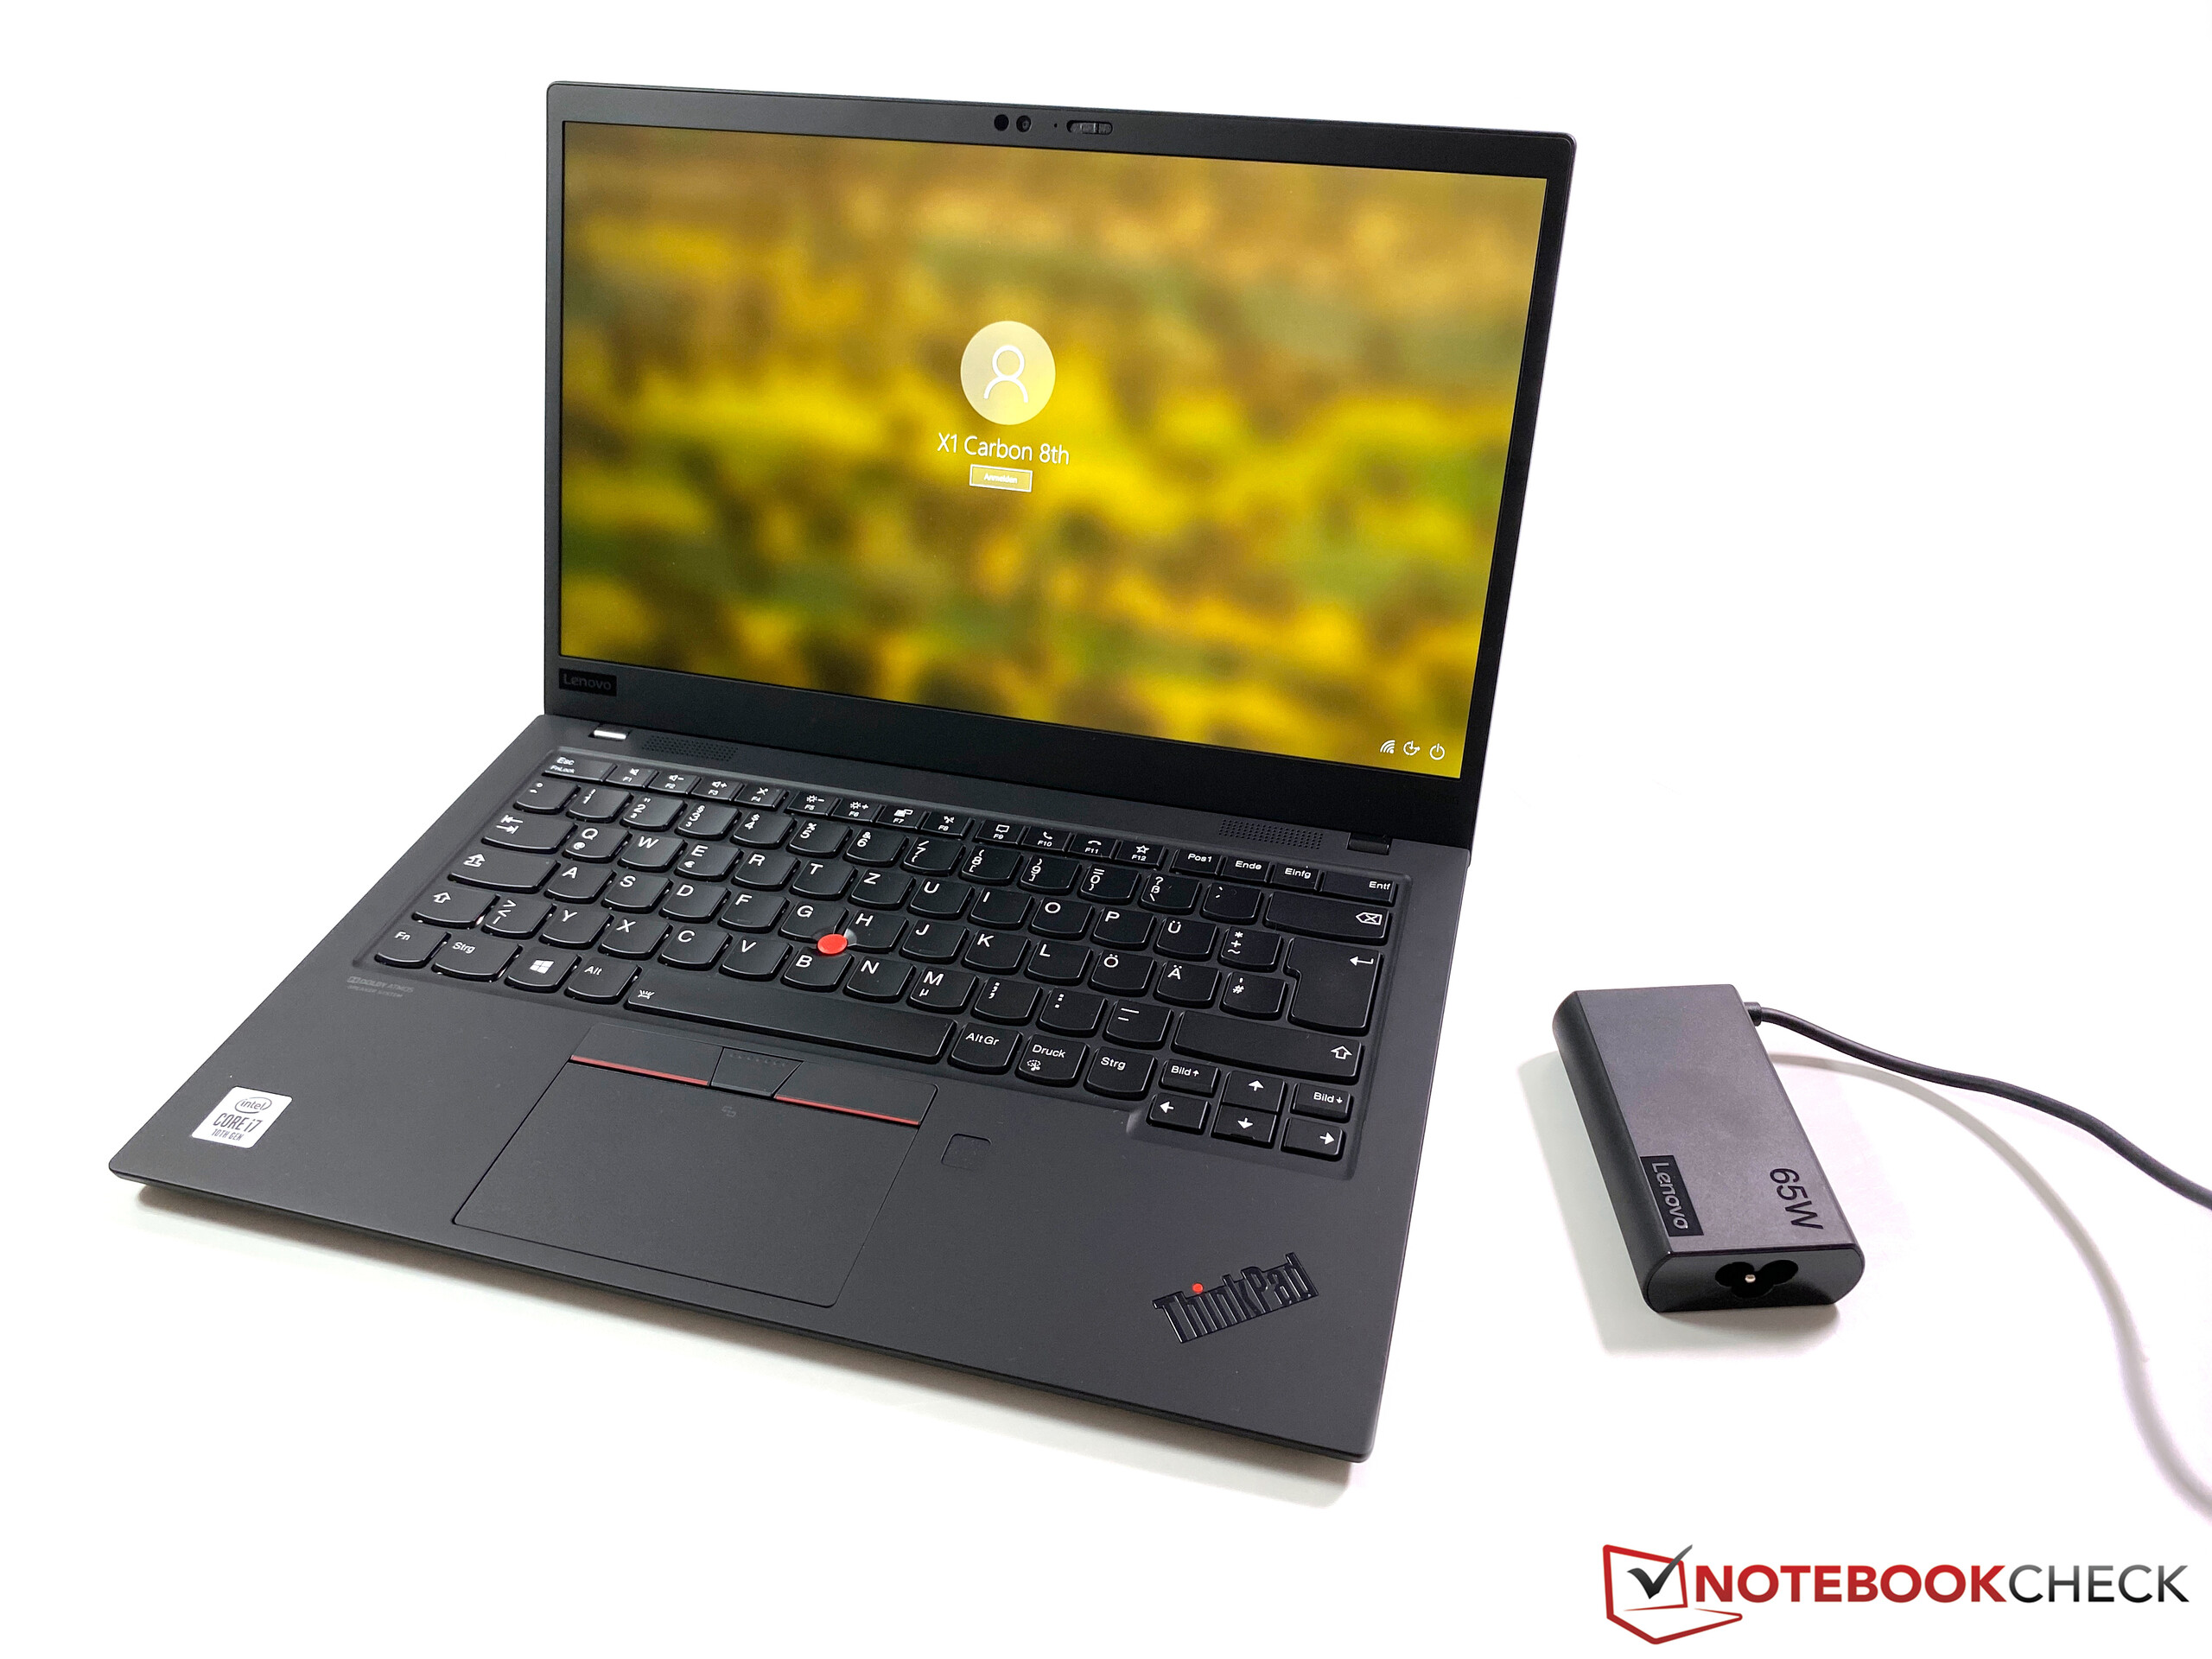
Förra året fick ThinkPad X1 Carbon en stor uppdatering, så det här året får vi istället bara en mindre sådan. En del regioner har redan fått Comet Lake-processorn i den 7:e generationen från 2019; 8:e generationen av X1 Carbon kommer med den nya processorn oavsett region. Men skillnaderna i fråga om processor- och grafikprestanda är i princip obefintliga och rättfärdigar inte en uppgradering. Den enda egentliga fördelen är den nya WiFi 6-modulen.
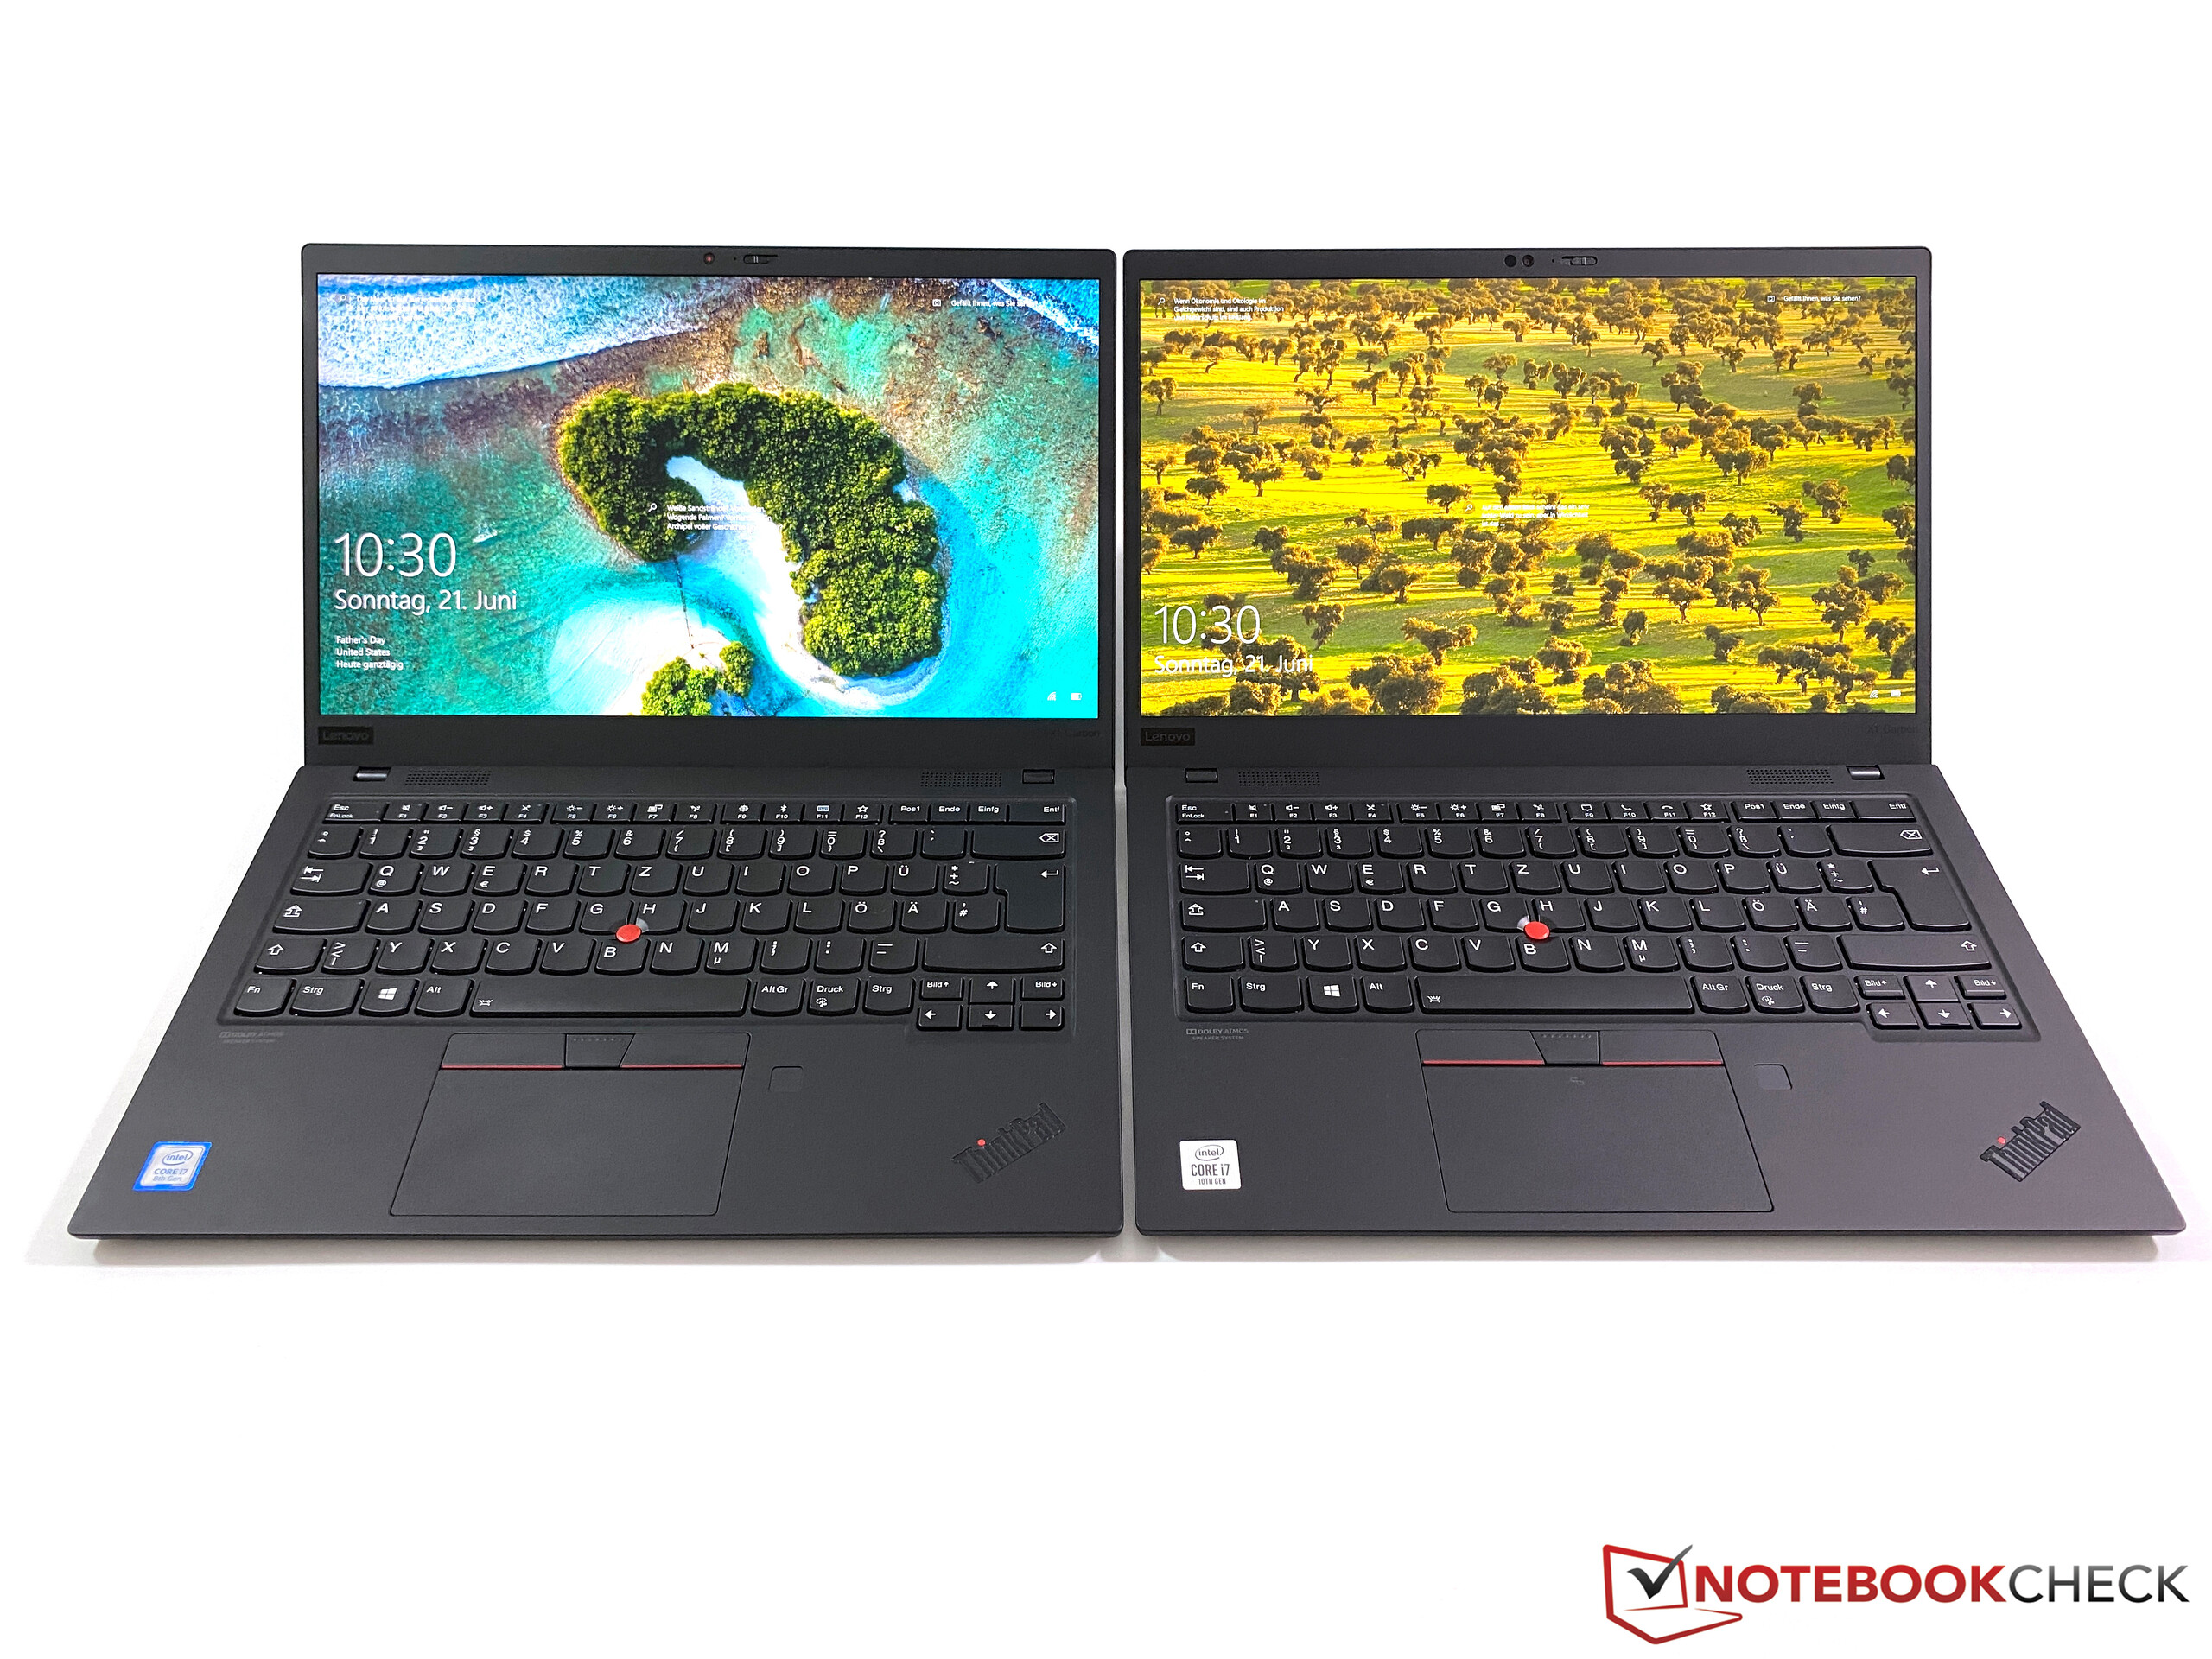
Trots att inga större uppgraderingar har skett är ThinkPad X1 Carbon fortfarande en riktigt bra kontorslaptop med ett extremt lätt och robust chassi. Men den har fortfarande samma problem med ett skärmlotteri för LowPower 1080p-skärmarna. Tangentbordet är också en aning sämre sen förra årets chassiuppdatering. Detta är förvisso ganska onödigt gnäll, men ThinkPad-seriens flaggskepp har inte längre det bästa tangentbordet: tjockare maskiner (som T-serien) har en fördel på den punkten.
Lenovo använder inte AMD-processorer till X1-serien, så bytet till den 8:e generationen är bara en mindre uppdatering. Det är fortfarande en riktigt bra kontorslaptop, men Lenovos nya ThinkPad T14s (inklusive processorer från AMD) kan vara dess största konkurrent.
Så är det värt att uppgradera? Den enda egentliga fördelen jämfört med modellen från 2019 är WiFi 6-modulen och en aningen mindre nätadapter, men det rättfärdigar knappast en uppgradering. Vi längtar också efter att få tag på nya ThinkPad T14s. Den får ett nytt chassi och bör hamna ännu närmare X1 Carbon, men till den kommer Lenovo också sälja modeller med AMD-processorer utöver Intel-varianterna. Om vi tittar på de första resultaten från den billiga ThinkPad E15 med en AMD 4000 CPU, borde AMD T14s ha mycket mer prestanda än X1 Carbon.
Lenovo ThinkPad X1 Carbon 2020-20UAS04T00
-
07/01/2020 v7
Andreas Osthoff
Pricecompare
