 Deutsch
 English
 Español
 Français
 Italiano
 Nederlands
 Polski
 Português
 Русский
 Türkçe
 Svenska
 Chinese
 Magyar
Test: Asus ROG Strix GL703VM Scar Edition (7700HQ, GTX 1060, FHD 120 Hz) Laptop (Sammanfattning)
| SD Card Reader | |
| average JPG Copy Test (av. of 3 runs) | |
| Aorus X7 v7 (Toshiba Exceria Pro SDXC 64 GB UHS-II) | |
| Average of class Gaming (19 - 202, n=100, last 2 years) | |
| Acer Predator 17 G9-793-70PJ (Toshiba Exceria Pro SDXC 64 GB UHS-II) | |
| HP Omen 17-w100ng (Toshiba Exceria Pro SDXC 64 GB UHS-II) | |
| Asus ROG Strix GL703VD-DB74 (Toshiba Exceria Pro SDXC 64 GB UHS-II) | |
| Asus Strix GL703VM-DB74 (Toshiba Exceria Pro SDXC 64 GB UHS-II) | |
| MSI GS73VR 7RF (Toshiba Exceria Pro SDXC 64 GB UHS-II) | |
| Acer Aspire V17 Nitro BE VN7-793G-52XN (Toshiba Exceria Pro SDXC 64 GB UHS-II) | |
| maximum AS SSD Seq Read Test (1GB) | |
| Aorus X7 v7 (Toshiba Exceria Pro SDXC 64 GB UHS-II) | |
| Average of class Gaming (25.8 - 269, n=94, last 2 years) | |
| Asus Strix GL703VM-DB74 (Toshiba Exceria Pro SDXC 64 GB UHS-II) | |
| Acer Predator 17 G9-793-70PJ (Toshiba Exceria Pro SDXC 64 GB UHS-II) | |
| HP Omen 17-w100ng (Toshiba Exceria Pro SDXC 64 GB UHS-II) | |
| Asus ROG Strix GL703VD-DB74 (Toshiba Exceria Pro SDXC 64 GB UHS-II) | |
| MSI GS73VR 7RF (Toshiba Exceria Pro SDXC 64 GB UHS-II) | |
| Acer Aspire V17 Nitro BE VN7-793G-52XN (Toshiba Exceria Pro SDXC 64 GB UHS-II) | |
| |||||||||||||||||||||||||
Distribution av ljusstyrkan: 67 %
Mitt på batteriet: 319.5 cd/m²
Kontrast: 492:1 (Svärta: 0.65 cd/m²)
ΔE Color 3.17 | 0.5-29.43 Ø5
ΔE Greyscale 1.6 | 0.57-98 Ø5.3
87% sRGB (Argyll 1.6.3 3D)
56% AdobeRGB 1998 (Argyll 1.6.3 3D)
62.7% AdobeRGB 1998 (Argyll 2.2.0 3D)
87.2% sRGB (Argyll 2.2.0 3D)
61.5% Display P3 (Argyll 2.2.0 3D)
Gamma: 2.22
| Asus Strix GL703VM-DB74 AU Optronics B173HAN01.1, IPS, 17.30, 1920x1080 | Asus ROG Strix GL703VD-DB74 LG Philips LP173WF4-SPF5, IPS, 17.30, 1920x1080 | MSI GS73VR 7RF AU Optronics AUO109B, IPS, 17.30, 3840x2160 | Acer Aspire V17 Nitro BE VN7-793G-52XN AUO B173HAN01.0, a-Si TFT-LCD, WLED, 17.30, 1920x1080 | HP Omen 17-w100ng LG Philips LGD046E, IPS, 17.30, 1920x1080 | Aorus X7 v7 AU Optronics B173QTN01.4 (AUO1496), TN LED, 17.30, 2560x1440 | Acer Predator 17 G9-793-70PJ AU Optronics B173ZAN01.0 (AUO109B), IPS, 17.30, 3840x2160 | |
|---|---|---|---|---|---|---|---|
| Display | 3% | 7% | 4% | 3% | 1% | 38% | |
| Display P3 Coverage | 61.5 | 67.6 10% | 64.2 4% | 64 4% | 67.2 9% | 63 2% | 86.4 40% |
| sRGB Coverage | 87.2 | 86.1 -1% | 96.8 11% | 90.2 3% | 86.6 -1% | 87.1 0% | 99.9 15% |
| AdobeRGB 1998 Coverage | 62.7 | 62.9 0% | 66.4 6% | 65.4 4% | 63.3 1% | 63.7 2% | 99.1 58% |
| Response Times | 8% | -15% | -12% | -8% | 49% | -34% | |
| Response Time Grey 50% / Grey 80% * | 30.8 ? | 30.8 ? -0% | 38 ? -23% | 36 ? -17% | 35 ? -14% | 24 ? 22% | 50 ? -62% |
| Response Time Black / White * | 24.4 ? | 20.4 ? 16% | 26 ? -7% | 26 ? -7% | 25 ? -2% | 6 ? 75% | 25.6 ? -5% |
| PWM Frequency | 119000 ? | ||||||
| Screen | -11% | -2% | -7% | -3% | -34% | 8% | |
| Brightness middle | 319.5 | 421.2 32% | 371.1 16% | 346 8% | 342 7% | 375 17% | 343 7% |
| Brightness | 293 | 393 34% | 343 17% | 307 5% | 331 13% | 353 20% | 328 12% |
| Brightness Distribution | 67 | 85 27% | 86 28% | 84 25% | 84 25% | 85 27% | 84 25% |
| Black Level * | 0.65 | 0.44 32% | 0.42 35% | 0.26 60% | 0.32 51% | 0.58 11% | 0.29 55% |
| Contrast | 492 | 957 95% | 884 80% | 1331 171% | 1069 117% | 647 32% | 1183 140% |
| Colorchecker dE 2000 * | 3.17 | 5 -58% | 4.5 -42% | 4.32 -36% | 4.35 -37% | 6.06 -91% | 4.01 -26% |
| Colorchecker dE 2000 max. * | 5.32 | 8.8 -65% | 9.7 -82% | 8.05 -51% | 9.24 -74% | 10.54 -98% | 6.03 -13% |
| Greyscale dE 2000 * | 1.6 | 5 -213% | 3.1 -94% | 5.76 -260% | 3.73 -133% | 5.68 -255% | 4.7 -194% |
| Gamma | 2.22 99% | 2.18 101% | 2.17 101% | 2.35 94% | 2.23 99% | 2.3 96% | 2.4 92% |
| CCT | 6668 97% | 6882 94% | 7120 91% | 6447 101% | 6801 96% | 7998 81% | 6451 101% |
| Color Space (Percent of AdobeRGB 1998) | 56 | 62.94 12% | 61 9% | 59 5% | 57 2% | 57 2% | 88 57% |
| Color Space (Percent of sRGB) | 87 | 86.1 -1% | 97 11% | 90 3% | 86 -1% | 87 0% | 100 15% |
| Total Average (Program / Settings) | 0% /
-5% | -3% /
-2% | -5% /
-6% | -3% /
-2% | 5% /
-16% | 4% /
8% |
* ... smaller is better
Display Response Times
| ↔ Response Time Black to White | ||
|---|---|---|
| 24.4 ms ... rise ↗ and fall ↘ combined | ↗ 13.2 ms rise | 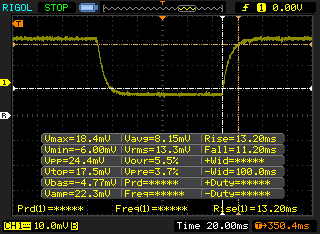 |
| ↘ 11.2 ms fall | ||
| The screen shows good response rates in our tests, but may be too slow for competitive gamers. In comparison, all tested devices range from 0.1 (minimum) to 240 (maximum) ms. » 52 % of all devices are better. This means that the measured response time is worse than the average of all tested devices (21.5 ms). | ||
| ↔ Response Time 50% Grey to 80% Grey | ||
| 30.8 ms ... rise ↗ and fall ↘ combined | ↗ 16.4 ms rise | 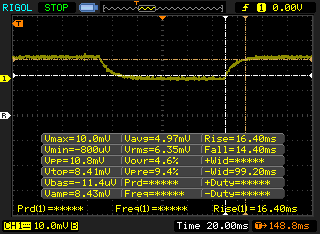 |
| ↘ 14.4 ms fall | ||
| The screen shows slow response rates in our tests and will be unsatisfactory for gamers. In comparison, all tested devices range from 0.2 (minimum) to 636 (maximum) ms. » 35 % of all devices are better. This means that the measured response time is similar to the average of all tested devices (33.7 ms). | ||
Screen Flickering / PWM (Pulse-Width Modulation)
| Screen flickering / PWM not detected | 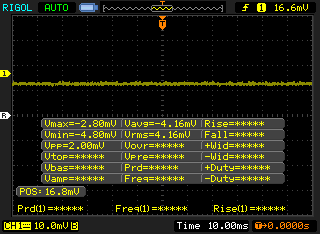 | ||
In comparison: 53 % of all tested devices do not use PWM to dim the display. If PWM was detected, an average of 17900 (minimum: 5 - maximum: 3846000) Hz was measured. | |||
| wPrime 2.10 - 1024m | |
| Average of class Gaming (116.8 - 1021, n=13, last 2 years) | |
| Asus ROG Strix GL703VD-DB74 | |
| MSI GS73VR 7RF | |
| Average Intel Core i7-7700HQ (210 - 379, n=48) | |
| Asus Strix GL703VM-DB74 | |
* ... smaller is better
| PCMark 8 Home Score Accelerated v2 | 4757 poäng | |
| PCMark 8 Creative Score Accelerated v2 | 6519 poäng | |
| PCMark 8 Work Score Accelerated v2 | 4877 poäng | |
| PCMark 10 Score | 4352 poäng | |
Hjälp | ||
| Asus Strix GL703VM-DB74 Seagate Mobile HDD 1TB ST1000LX015-1U7172 | Asus ROG Strix GL703VD-DB74 SanDisk SD8SN8U256G1002 | HP ProBook 450 G5-2UB53EA SanDisk SD8SN8U256G1006 | Asus VivoBook 17 X705UA-BX022T Seagate Mobile HDD 1TB ST1000LM035 | Asus G703 2x Samsung SM961 MZVKW512HMJP NVMe (RAID 0) | Dell Inspiron 15 7000 7577 4K SK hynix SC311 M.2 | HP Omen 15t-ce000 Samsung PM961 NVMe MZVLW128HEGR | Average Seagate Mobile HDD 1TB ST1000LX015-1U7172 | |
|---|---|---|---|---|---|---|---|---|
| CrystalDiskMark 5.2 / 6 | 5789% | 5824% | -17% | 15239% | 4482% | 8317% | -31% | |
| Write 4K | 1.27 | 53.1 4081% | 51.6 3963% | 1.747 38% | 160.7 12554% | 89 6908% | 145.1 11325% | 0.4682 ? -63% |
| Read 4K | 0.93 | 24.7 2556% | 27.1 2814% | 0.285 -69% | 54.8 5792% | 28.77 2994% | 45.95 4841% | 0.533 ? -43% |
| Write Seq | 101.3 | 445.3 340% | 471.6 366% | 76.8 -24% | 2738 2603% | 246.7 144% | 750 640% | 75.6 ? -25% |
| Read Seq | 124.6 | 478.2 284% | 499.3 301% | 85.6 -31% | 3346 2585% | 480.9 286% | 1250 903% | 116.1 ? -7% |
| Write 4K Q32T1 | 1.22 | 259.2 21146% | 283.2 23113% | 1.727 42% | 612 50064% | 162.2 13195% | 176.1 14334% | 0.643 ? -47% |
| Read 4K Q32T1 | 1.68 | 289.3 17120% | 257.9 15251% | 0.647 -61% | 709 42102% | 199.6 11781% | 524 31090% | 1.067 ? -36% |
| Write Seq Q32T1 | 92.3 | 470.7 410% | 476.6 416% | 89.3 -3% | 3082 3239% | 243.8 164% | 749 711% | 81.9 ? -11% |
| Read Seq Q32T1 | 114.1 | 540 373% | 533 367% | 78.6 -31% | 3505 2972% | 549 381% | 3183 2690% | 97 ? -15% |

| 3DMark | |
| 1280x720 Cloud Gate Standard Graphics | |
| Average of class Gaming (15902 - 193851, n=142, last 2 years) | |
| Aorus X7 v7 | |
| Asus Strix GL703VM-DB74 | |
| HP Omen 17-w100ng | |
| Average NVIDIA GeForce GTX 1060 Mobile (26770 - 86193, n=68) | |
| Acer Aspire V17 Nitro BE VN7-793G-52XN | |
| MSI GS73VR 7RF | |
| Asus ROG Strix GL703VD-DB74 | |
| 1920x1080 Fire Strike Graphics | |
| Average of class Gaming (781 - 53059, n=235, last 2 years) | |
| Aorus X7 v7 | |
| Asus Strix GL703VM-DB74 | |
| Average NVIDIA GeForce GTX 1060 Mobile (10708 - 12298, n=77) | |
| MSI GS73VR 7RF | |
| HP Omen 17-w100ng | |
| Acer Aspire V17 Nitro BE VN7-793G-52XN | |
| Asus ROG Strix GL703VD-DB74 | |
| 1920x1080 Ice Storm Extreme Graphics | |
| Average of class Gaming (46258 - 613731, n=19, last 2 years) | |
| Aorus X7 v7 | |
| Asus Strix GL703VM-DB74 | |
| HP Omen 17-w100ng | |
| Average NVIDIA GeForce GTX 1060 Mobile (33205 - 257260, n=33) | |
| Acer Aspire V17 Nitro BE VN7-793G-52XN | |
| MSI GS73VR 7RF | |
| 3DMark 06 Standard Score | 28862 poäng | |
| 3DMark 11 Performance | 11774 poäng | |
| 3DMark Ice Storm Standard Score | 131096 poäng | |
| 3DMark Cloud Gate Standard Score | 24266 poäng | |
| 3DMark Fire Strike Score | 10017 poäng | |
| 3DMark Fire Strike Extreme Score | 5228 poäng | |
| 3DMark Time Spy Score | 3751 poäng | |
Hjälp | ||
| BioShock Infinite - 1920x1080 Ultra Preset, DX11 (DDOF) (sort by value) | |
| Asus Strix GL703VM-DB74 | |
| Asus ROG Strix GL703VD-DB74 | |
| MSI GS73VR 7RF | |
| Acer Aspire V17 Nitro BE VN7-793G-52XN | |
| HP Omen 17-w100ng | |
| Aorus X7 v7 | |
| Average NVIDIA GeForce GTX 1060 Mobile (82 - 159, n=48) | |
| Doom - 1920x1080 Ultra Preset AA:SM (sort by value) | |
| Asus Strix GL703VM-DB74 | |
| MSI GS73VR 7RF | |
| Average NVIDIA GeForce GTX 1060 Mobile (66 - 103.3, n=17) | |
| Civilization VI - 1920x1080 Ultra Preset AA:4xMS (sort by value) | |
| Asus Strix GL703VM-DB74 | |
| MSI GS73VR 7RF | |
| HP Omen 17-w100ng | |
| Average NVIDIA GeForce GTX 1060 Mobile (42.8 - 71, n=5) | |
| Average of class Gaming (last 2 years) | |
| Rise of the Tomb Raider - 1920x1080 Very High Preset AA:FX AF:16x (sort by value) | |
| Asus Strix GL703VM-DB74 | |
| Asus ROG Strix GL703VD-DB74 | |
| MSI GS73VR 7RF | |
| Acer Aspire V17 Nitro BE VN7-793G-52XN | |
| Average NVIDIA GeForce GTX 1060 Mobile (51 - 68.8, n=37) | |
| låg | med. | hög | ultra | |
| The Elder Scrolls V: Skyrim (2011) | 87 | |||
| BioShock Infinite (2013) | 111 | |||
| Thief (2014) | 74 | |||
| The Witcher 3 (2015) | 39 | |||
| Batman: Arkham Knight (2015) | 56 | |||
| Rise of the Tomb Raider (2016) | 56 | |||
| Ashes of the Singularity (2016) | 48 | |||
| Doom (2016) | 98 | |||
| Civilization VI (2016) | 65 | |||
| Farming Simulator 17 (2016) | 60 |
Ljudnivå
| Låg belastning |
| 30.2 / 30.2 / 30.2 dB(A) |
| Hårddisk |
| 32.2 dB(A) |
| Hög belastning |
| 38.4 / 54.5 dB(A) |
 | ||
30 dB tyst 40 dB(A) hörbar 50 dB(A) högt ljud |
||
min: | ||
| Asus Strix GL703VM-DB74 GeForce GTX 1060 Mobile, i7-7700HQ, Seagate Mobile HDD 1TB ST1000LX015-1U7172 | Asus ROG Strix GL703VD-DB74 GeForce GTX 1050 Mobile, i7-7700HQ, SanDisk SD8SN8U256G1002 | MSI GS73VR 7RF GeForce GTX 1060 Mobile, i7-7700HQ, Samsung SM961 MZVKW512HMJP m.2 PCI-e | Acer Aspire V17 Nitro BE VN7-793G-52XN GeForce GTX 1060 Mobile, i5-7300HQ, SK Hynix HFS256G39TND-N210A | HP Omen 17-w100ng GeForce GTX 1060 Mobile, 6300HQ, SanDisk Z400s SD8SNAT-128G | Aorus X7 v7 GeForce GTX 1070 Mobile, i7-7820HK, Samsung SM961 MZVPW256HEGL | |
|---|---|---|---|---|---|---|
| Noise | 2% | 1% | 5% | -14% | -9% | |
| off / environment * | 28.4 | 27.9 2% | 28.1 1% | 30.7 -8% | 31 -9% | 30 -6% |
| Idle Minimum * | 30.2 | 30.4 -1% | 30.8 -2% | 30.7 -2% | 35 -16% | 33 -9% |
| Idle Average * | 30.2 | 30.4 -1% | 30.8 -2% | 30.7 -2% | 36 -19% | 36 -19% |
| Idle Maximum * | 30.2 | 30.4 -1% | 30.9 -2% | 31.4 -4% | 37 -23% | 41 -36% |
| Load Average * | 38.4 | 36.4 5% | 42.2 -10% | 32.1 16% | 44 -15% | 41 -7% |
| Witcher 3 ultra * | 49.7 | 46 7% | 44.4 11% | 42.8 14% | 45 9% | |
| Load Maximum * | 54.5 | 53 3% | 48.6 11% | 42.8 21% | 54 1% | 52 5% |
* ... smaller is better
(-) The maximum temperature on the upper side is 64.6 °C / 148 F, compared to the average of 40.4 °C / 105 F, ranging from 21.2 to 68.8 °C for the class Gaming.
(-) The bottom heats up to a maximum of 57.2 °C / 135 F, compared to the average of 43.2 °C / 110 F
(+) In idle usage, the average temperature for the upper side is 31.4 °C / 89 F, compared to the device average of 33.8 °C / 93 F.
(-) Playing The Witcher 3, the average temperature for the upper side is 40.6 °C / 105 F, compared to the device average of 33.8 °C / 93 F.
(+) The palmrests and touchpad are reaching skin temperature as a maximum (34 °C / 93.2 F) and are therefore not hot.
(-) The average temperature of the palmrest area of similar devices was 28.9 °C / 84 F (-5.1 °C / -9.2 F).
Asus Strix GL703VM-DB74 audio analysis
(-) | not very loud speakers (62.3 dB)
Bass 100 - 315 Hz
(±) | reduced bass - on average 9.2% lower than median
(±) | linearity of bass is average (12.1% delta to prev. frequency)
Mids 400 - 2000 Hz
(+) | balanced mids - only 4.4% away from median
(+) | mids are linear (3.3% delta to prev. frequency)
Highs 2 - 16 kHz
(+) | balanced highs - only 1.4% away from median
(+) | highs are linear (6.9% delta to prev. frequency)
Overall 100 - 16.000 Hz
(±) | linearity of overall sound is average (18.5% difference to median)
Compared to same class
» 57% of all tested devices in this class were better, 9% similar, 35% worse
» The best had a delta of 6%, average was 18%, worst was 132%
Compared to all devices tested
» 36% of all tested devices were better, 8% similar, 56% worse
» The best had a delta of 4%, average was 25%, worst was 134%
MSI GS73VR 7RF audio analysis
(+) | speakers can play relatively loud (82 dB)
Bass 100 - 315 Hz
(-) | nearly no bass - on average 18.1% lower than median
(±) | linearity of bass is average (13.2% delta to prev. frequency)
Mids 400 - 2000 Hz
(±) | higher mids - on average 5.2% higher than median
(±) | linearity of mids is average (8.3% delta to prev. frequency)
Highs 2 - 16 kHz
(±) | higher highs - on average 7.9% higher than median
(±) | linearity of highs is average (8.9% delta to prev. frequency)
Overall 100 - 16.000 Hz
(±) | linearity of overall sound is average (26.2% difference to median)
Compared to same class
» 91% of all tested devices in this class were better, 2% similar, 7% worse
» The best had a delta of 6%, average was 18%, worst was 132%
Compared to all devices tested
» 77% of all tested devices were better, 4% similar, 18% worse
» The best had a delta of 4%, average was 25%, worst was 134%
Acer Aspire V17 Nitro BE VN7-793G-52XN audio analysis
(±) | speaker loudness is average but good (72 dB)
Bass 100 - 315 Hz
(±) | reduced bass - on average 5.7% lower than median
(+) | bass is linear (5% delta to prev. frequency)
Mids 400 - 2000 Hz
(+) | balanced mids - only 4.4% away from median
(+) | mids are linear (6% delta to prev. frequency)
Highs 2 - 16 kHz
(+) | balanced highs - only 3% away from median
(±) | linearity of highs is average (7.2% delta to prev. frequency)
Overall 100 - 16.000 Hz
(+) | overall sound is linear (12.5% difference to median)
Compared to same class
» 17% of all tested devices in this class were better, 3% similar, 80% worse
» The best had a delta of 5%, average was 18%, worst was 45%
Compared to all devices tested
» 8% of all tested devices were better, 2% similar, 90% worse
» The best had a delta of 4%, average was 25%, worst was 134%
| Av/Standby | |
| Låg belastning | |
| Hög belastning |
|
| Asus Strix GL703VM-DB74 i7-7700HQ, GeForce GTX 1060 Mobile, Seagate Mobile HDD 1TB ST1000LX015-1U7172, IPS, 1920x1080, 17.30 | Asus ROG Strix GL703VD-DB74 i7-7700HQ, GeForce GTX 1050 Mobile, SanDisk SD8SN8U256G1002, IPS, 1920x1080, 17.30 | MSI GS73VR 7RF i7-7700HQ, GeForce GTX 1060 Mobile, Samsung SM961 MZVKW512HMJP m.2 PCI-e, IPS, 3840x2160, 17.30 | Acer Aspire V17 Nitro BE VN7-793G-52XN i5-7300HQ, GeForce GTX 1060 Mobile, SK Hynix HFS256G39TND-N210A, a-Si TFT-LCD, WLED, 1920x1080, 17.30 | HP Omen 17-w100ng 6300HQ, GeForce GTX 1060 Mobile, SanDisk Z400s SD8SNAT-128G, IPS, 1920x1080, 17.30 | Aorus X7 v7 i7-7820HK, GeForce GTX 1070 Mobile, Samsung SM961 MZVPW256HEGL, TN LED, 2560x1440, 17.30 | |
|---|---|---|---|---|---|---|
| Power Consumption | 34% | -3% | 28% | -1% | -56% | |
| Idle Minimum * | 17.3 | 5.8 66% | 14.2 18% | 7.8 55% | 17 2% | 27 -56% |
| Idle Average * | 21.8 | 11.6 47% | 23.5 -8% | 13.3 39% | 22 -1% | 33 -51% |
| Idle Maximum * | 23 | 12.3 47% | 23.8 -3% | 16.6 28% | 29 -26% | 40 -74% |
| Load Average * | 79.2 | 82.4 -4% | 90.9 -15% | 73 8% | 72 9% | 107 -35% |
| Load Maximum * | 158.2 | 135.5 14% | 171.6 -8% | 140 12% | 141 11% | 259 -64% |
| Witcher 3 ultra * | 97 | 116 | 118 | 190 |
* ... smaller is better
| Asus Strix GL703VM-DB74 i7-7700HQ, GeForce GTX 1060 Mobile, 64 Wh | Asus ROG Strix GL703VD-DB74 i7-7700HQ, GeForce GTX 1050 Mobile, 64 Wh | MSI GS73VR 7RF i7-7700HQ, GeForce GTX 1060 Mobile, 65 Wh | Acer Aspire V17 Nitro BE VN7-793G-52XN i5-7300HQ, GeForce GTX 1060 Mobile, 69 Wh | HP Omen 17-w100ng 6300HQ, GeForce GTX 1060 Mobile, 95.8 Wh | Aorus X7 v7 i7-7820HK, GeForce GTX 1070 Mobile, 94 Wh | |
|---|---|---|---|---|---|---|
| Battery Runtime | 132% | 5% | 133% | 130% | 13% | |
| Reader / Idle | 241 | 804 234% | 301 25% | 618 156% | 543 125% | 221 -8% |
| WiFi v1.3 | 189 | 429 127% | 163 -14% | 374 98% | 363 92% | 180 -5% |
| Load | 53 | 72 36% | 55 4% | 130 145% | 145 174% | 81 53% |
För
Emot

Läs den fullständiga versionen av den här recensionen på engelska här.
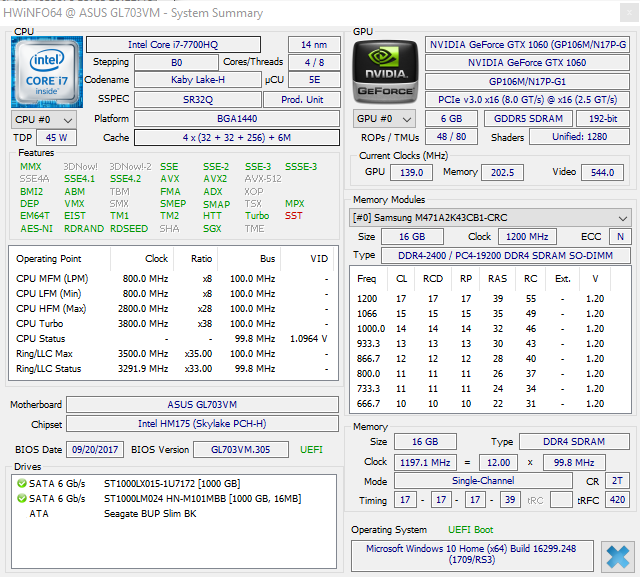
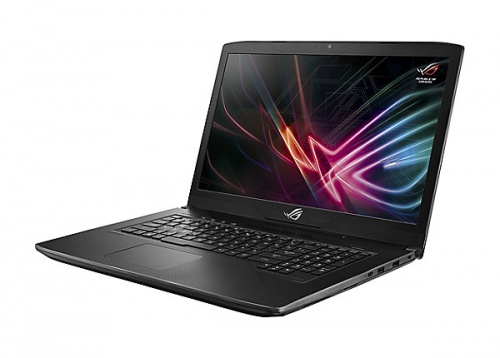
Asus ROG Strix GL703VM är en laptop bestående av kompromisser. Det finns en del utmärkta saker att fira: enhetens spelprestanda är utmärkt för sin klass, 120 Hz-skärmen är smidig, det finns ett generöst utbud av portar och chassit är ganska effektfullt och gediget (med tanke på dess tunna profil).
Men för varje höjdpunkt finns en motvikt. Även om spelprestandan är bra så stryps dess CPU och når inte sin fulla potential. 120 Hz-skärmen känns smidig, men lider av katastrofal bleeding på bakgrundsbelysningen och har dålig kontrast. Chassit är kompakt och vackert med blir kännbart varmt vid spelande.
Borde du köpa GL703VM? Det beror verkligen på vad som betyder mest för dig som gamer. Om du vill ha enastående spelprestanda och en snabb skärm tillräckligt mycket för att kompromissa med värmehantering och högre bildkvalitet så kan GL703VM vara ett alternativ att överväga. Men MSI GS73VR erbjuder en liknande vacker och tunn kropp, jämförbar spelprestanda och ett utmärkt tangentbord med den extra fördelen av en 4K-skärm som tillval samt mycket bättre värmehantering vid spelbelastning.
I slutändan är det ett fråga om värde. Med sitt utgångspris (runt 13 000 kronor) är valet självklart: GL703VM är helt enkelt alldeles för dyr med tanke på dess tillkortakommanden. Det finns laptops som utmärker sig där GL703VM har svagheter samtidigt som dom kommer nära eller matchar dess styrkor för ett mycket lägre pris. Om du kan lyckas fånga GL703VM på rea är den värd att överväga. Annars, hoppa över den här.
Asus Strix GL703VM-DB74
-
03/01/2018 v6(old)
Sam Medley
Pricecompare
