Test: Schenker Technologies Key 15 (Clevo P955HP6) Laptop (Sammanfattning)
| SD Card Reader | |
| average JPG Copy Test (av. of 3 runs) | |
| Schenker Key 15 (Toshiba Exceria Pro SDXC 64 GB UHS-II) | |
| Genomsnitt av klass Multimedia (23 - 531, n=37, senaste 2 åren) | |
| Dell XPS 15 9560 (i7-7700HQ, UHD) (Toshiba Exceria Pro SDXC 64 GB UHS-II) | |
| Gigabyte Aero 15 (Toshiba Exceria Pro SDXC 64 GB UHS-II) | |
| Asus Zenbook Pro UX550VE-DB71T (Toshiba Exceria Pro SDXC 64 GB UHS-II) | |
| Acer Aspire VN7-593G-73HP V15 Nitro BE | |
| maximum AS SSD Seq Read Test (1GB) | |
| Dell XPS 15 9560 (i7-7700HQ, UHD) (Toshiba Exceria Pro SDXC 64 GB UHS-II) | |
| Schenker Key 15 (Toshiba Exceria Pro SDXC 64 GB UHS-II) | |
| Genomsnitt av klass Multimedia (37.3 - 1455, n=36, senaste 2 åren) | |
| Asus Zenbook Pro UX550VE-DB71T (Toshiba Exceria Pro SDXC 64 GB UHS-II) | |
| Gigabyte Aero 15 (Toshiba Exceria Pro SDXC 64 GB UHS-II) | |
| Acer Aspire VN7-593G-73HP V15 Nitro BE | |
| |||||||||||||||||||||||||
Distribution av ljusstyrkan: 84 %
Mitt på batteriet: 285 cd/m²
Kontrast: 1018:1 (Svärta: 0.28 cd/m²)
ΔE ColorChecker Calman: 4.09 | ∀{0.5-29.43 Ø4.71}
ΔE Greyscale Calman: 4.39 | ∀{0.09-98 Ø4.96}
92% sRGB (Argyll 1.6.3 3D)
60% AdobeRGB 1998 (Argyll 1.6.3 3D)
67.6% AdobeRGB 1998 (Argyll 3D)
92.4% sRGB (Argyll 3D)
66.7% Display P3 (Argyll 3D)
Gamma: 2.32
CCT: 6706 K
| Schenker Key 15 AUO22EB, IPS, 3840x2160 | Gigabyte Aero 15 N156HCA-EA1 (CMN15D7), IPS, 1920x1080 | Acer Aspire VN7-593G-73HP V15 Nitro BE LG Display LP156WF6-SPP1, AH-IPS, Normally Black, Transmissive, 1920x1080 | Asus Zenbook Pro UX550VE-DB71T N156HCE-EN1 (CMN15E8), IPS, 1920x1080 | Dell XPS 15 9560 (i7-7700HQ, UHD) IGZO IPS, 3840x2160 | |
|---|---|---|---|---|---|
| Display | -1% | -6% | -3% | 30% | |
| Display P3 Coverage (%) | 66.7 | 65.2 -2% | 65.8 -1% | 64.3 -4% | 89.7 34% |
| sRGB Coverage (%) | 92.4 | 92.5 0% | 85.1 -8% | 90.4 -2% | 100 8% |
| AdobeRGB 1998 Coverage (%) | 67.6 | 66.5 -2% | 62.2 -8% | 65.3 -3% | 100 48% |
| Response Times | 2% | 1% | 1% | -25% | |
| Response Time Grey 50% / Grey 80% * (ms) | 48 ? | 42.8 ? 11% | 41 ? 15% | 43.2 ? 10% | 57.2 ? -19% |
| Response Time Black / White * (ms) | 30 ? | 32 ? -7% | 34 ? -13% | 32.8 ? -9% | 39.2 ? -31% |
| PWM Frequency (Hz) | 26000 ? | 25510 ? | 962 | ||
| Screen | -9% | -5% | -19% | 2% | |
| Brightness middle (cd/m²) | 285 | 320 12% | 322 13% | 288.2 1% | 370.1 30% |
| Brightness (cd/m²) | 293 | 316 8% | 297 1% | 266 -9% | 356 22% |
| Brightness Distribution (%) | 84 | 90 7% | 86 2% | 75 -11% | 87 4% |
| Black Level * (cd/m²) | 0.28 | 0.36 -29% | 0.31 -11% | 0.3 -7% | 0.37 -32% |
| Contrast (:1) | 1018 | 889 -13% | 1039 2% | 961 -6% | 1000 -2% |
| Colorchecker dE 2000 * | 4.09 | 4.62 -13% | 4.73 -16% | 5.5 -34% | 5.3 -30% |
| Colorchecker dE 2000 max. * | 7.94 | 9.75 -23% | 12.37 -56% | 11.3 -42% | 9.9 -25% |
| Greyscale dE 2000 * | 4.39 | 6 -37% | 2.99 32% | 7.9 -80% | 4.6 -5% |
| Gamma | 2.32 95% | 2.46 89% | 2.32 95% | 2.09 105% | 2.31 95% |
| CCT | 6706 97% | 6761 96% | 6905 94% | 6559 99% | 6284 103% |
| Color Space (Percent of AdobeRGB 1998) (%) | 60 | 60 0% | 56 -7% | 58.5 -2% | 88.3 47% |
| Color Space (Percent of sRGB) (%) | 92 | 92 0% | 85 -8% | 90 -2% | 100 9% |
| Totalt genomsnitt (program/inställningar) | -3% /
-6% | -3% /
-4% | -7% /
-13% | 2% /
4% |
* ... mindre är bättre
Visa svarstider
| ↔ Svarstid svart till vitt | ||
|---|---|---|
| 30 ms ... stiga ↗ och falla ↘ kombinerat | ↗ 16 ms stiga | 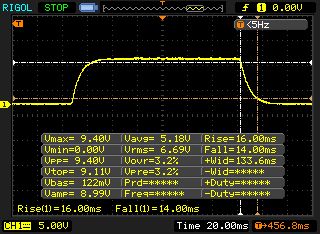 |
| ↘ 14 ms hösten | ||
| Skärmen visar långsamma svarsfrekvenser i våra tester och kommer att vara otillfredsställande för spelare. I jämförelse sträcker sig alla testade enheter från 0.1 (minst) till 240 (maximalt) ms. » 80 % av alla enheter är bättre. Detta innebär att den uppmätta svarstiden är sämre än genomsnittet av alla testade enheter (19.8 ms). | ||
| ↔ Svarstid 50 % grått till 80 % grått | ||
| 48 ms ... stiga ↗ och falla ↘ kombinerat | ↗ 23.6 ms stiga | 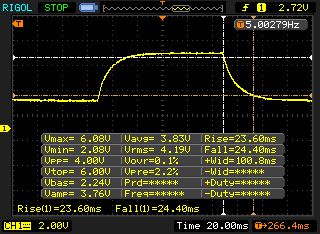 |
| ↘ 24.4 ms hösten | ||
| Skärmen visar långsamma svarsfrekvenser i våra tester och kommer att vara otillfredsställande för spelare. I jämförelse sträcker sig alla testade enheter från 0.165 (minst) till 636 (maximalt) ms. » 82 % av alla enheter är bättre. Detta innebär att den uppmätta svarstiden är sämre än genomsnittet av alla testade enheter (31 ms). | ||
Skärmflimmer / PWM (Puls-Width Modulation)
| Skärmflimmer / PWM upptäcktes inte | 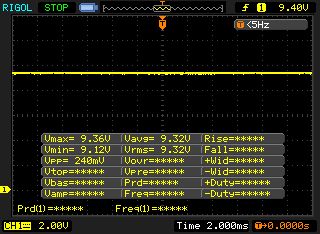 | ||
Som jämförelse: 52 % av alla testade enheter använder inte PWM för att dämpa skärmen. Om PWM upptäcktes mättes ett medelvärde av 7757 (minst: 5 - maximum: 343500) Hz. | |||
| PCMark 8 Home Score Accelerated v2 | 3499 poäng | |
| PCMark 8 Work Score Accelerated v2 | 4328 poäng | |
| PCMark 10 Score | 4493 poäng | |
Hjälp | ||
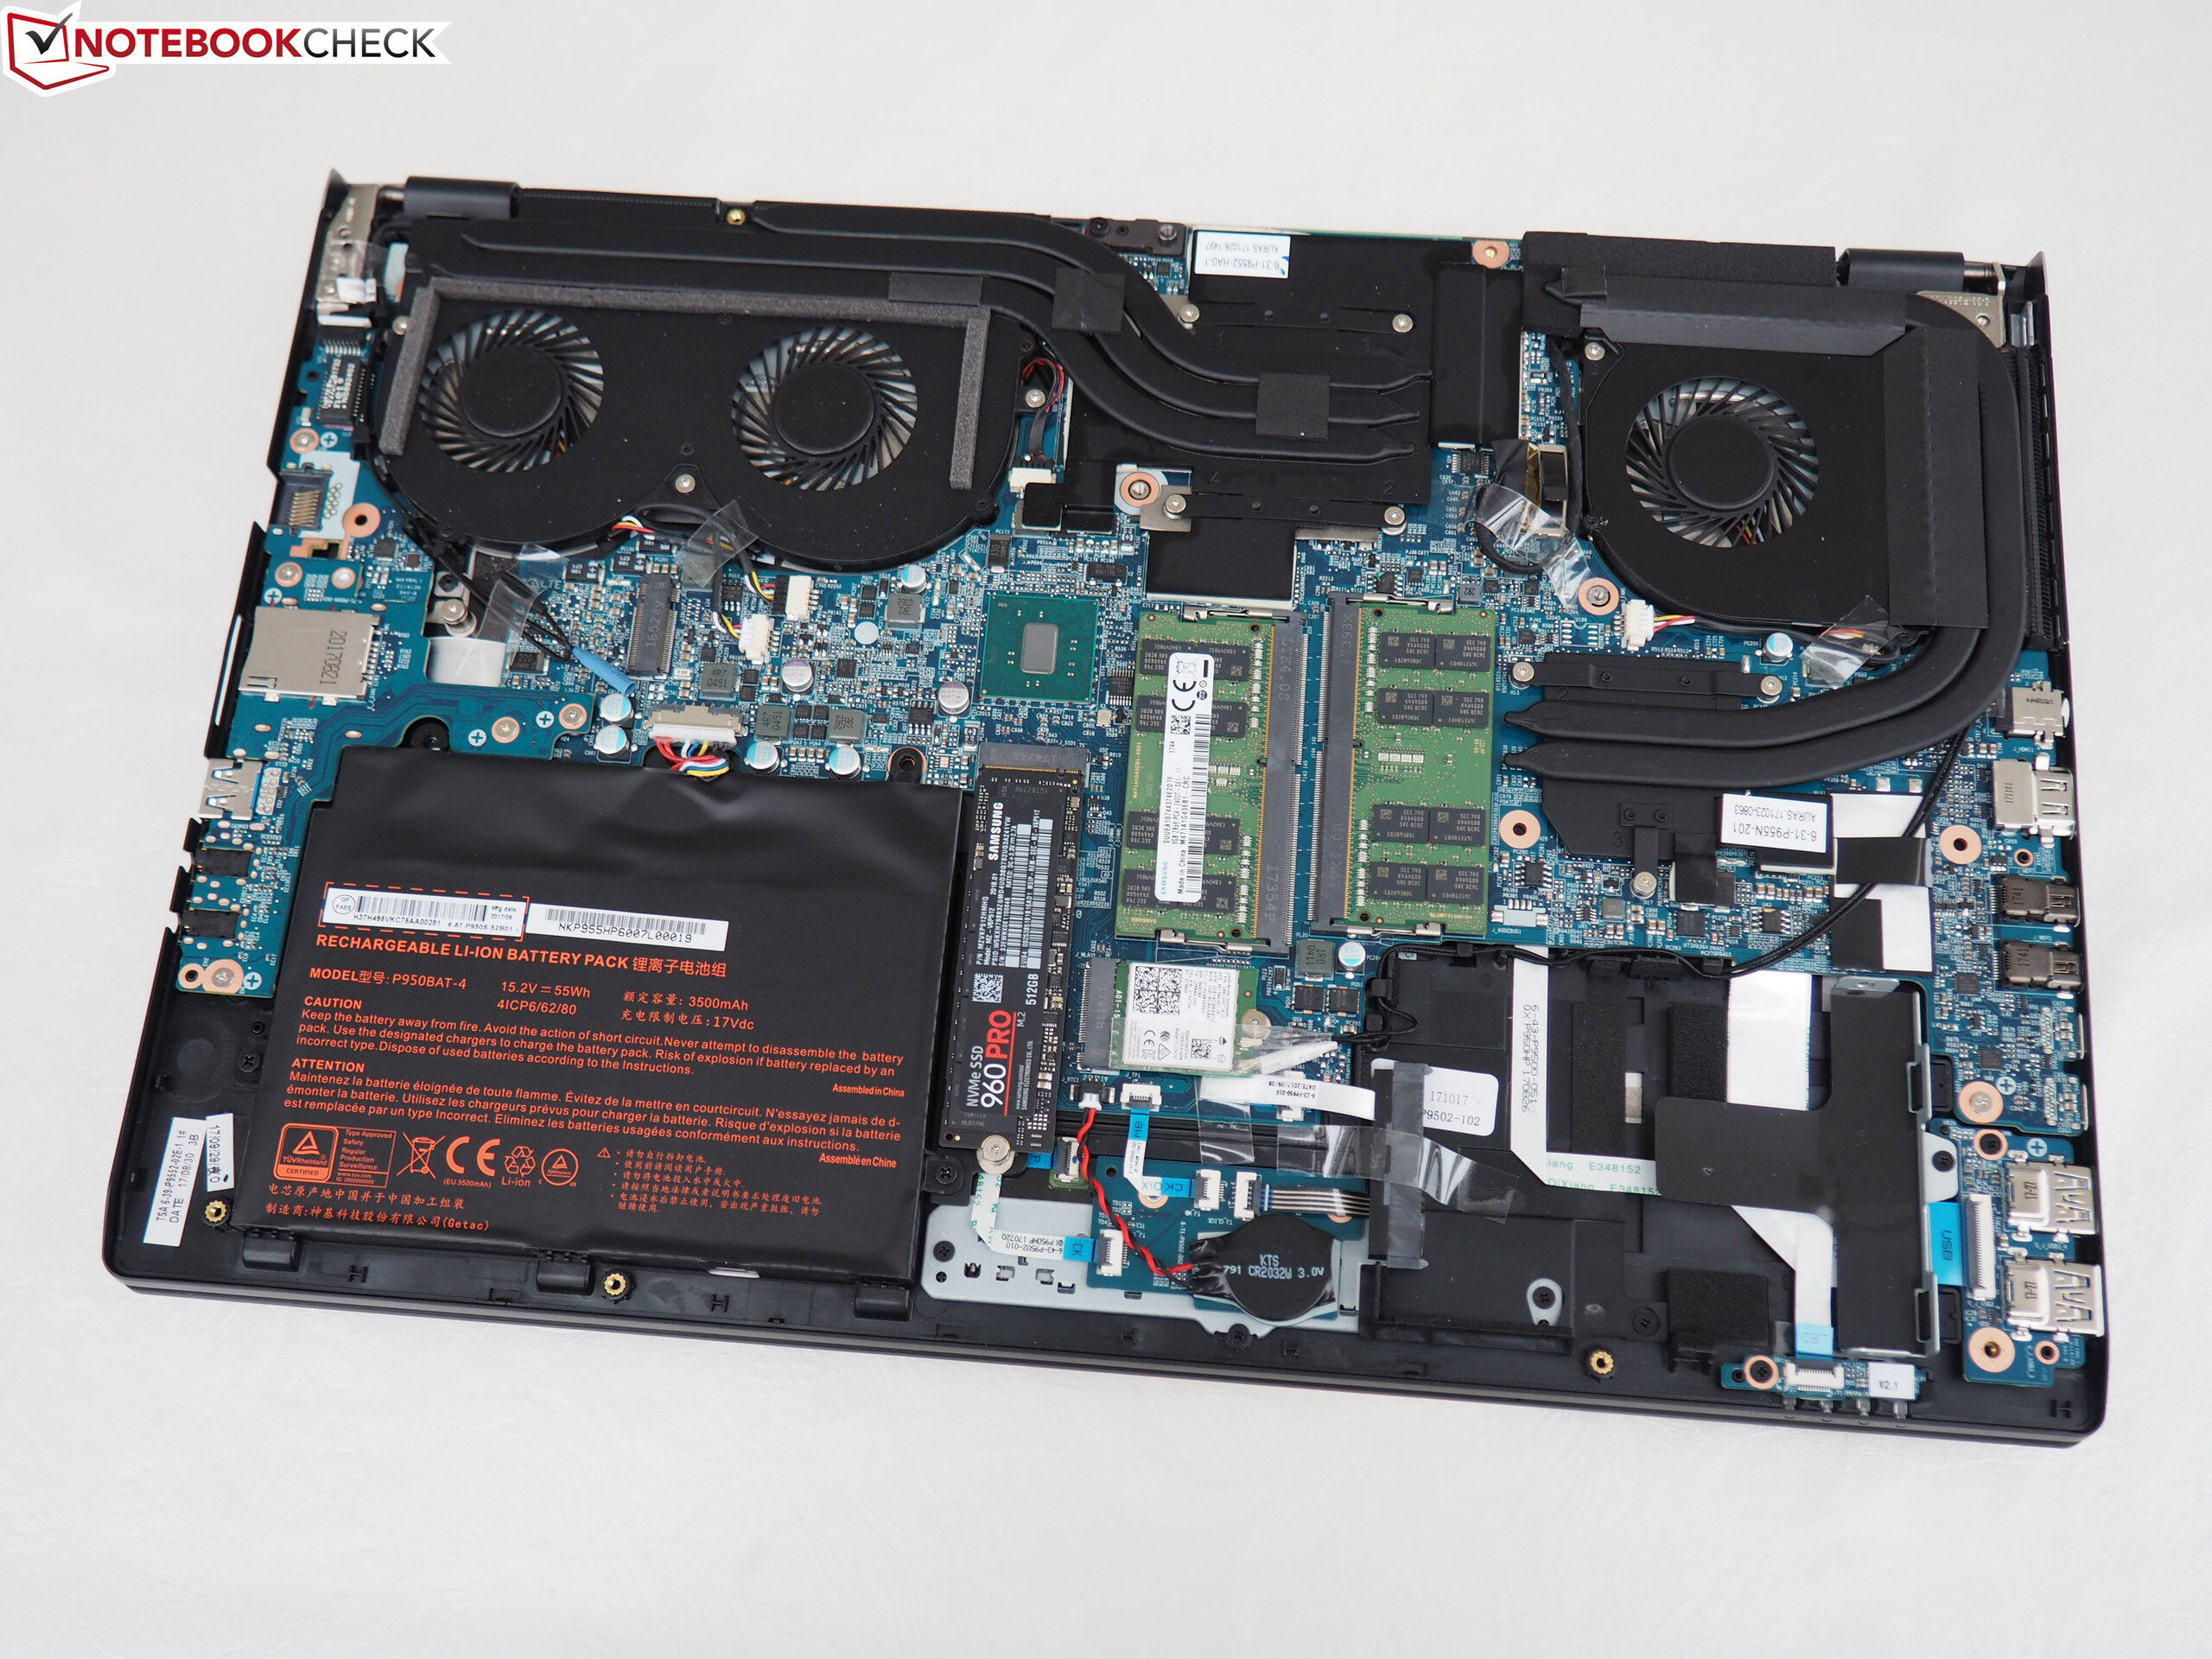
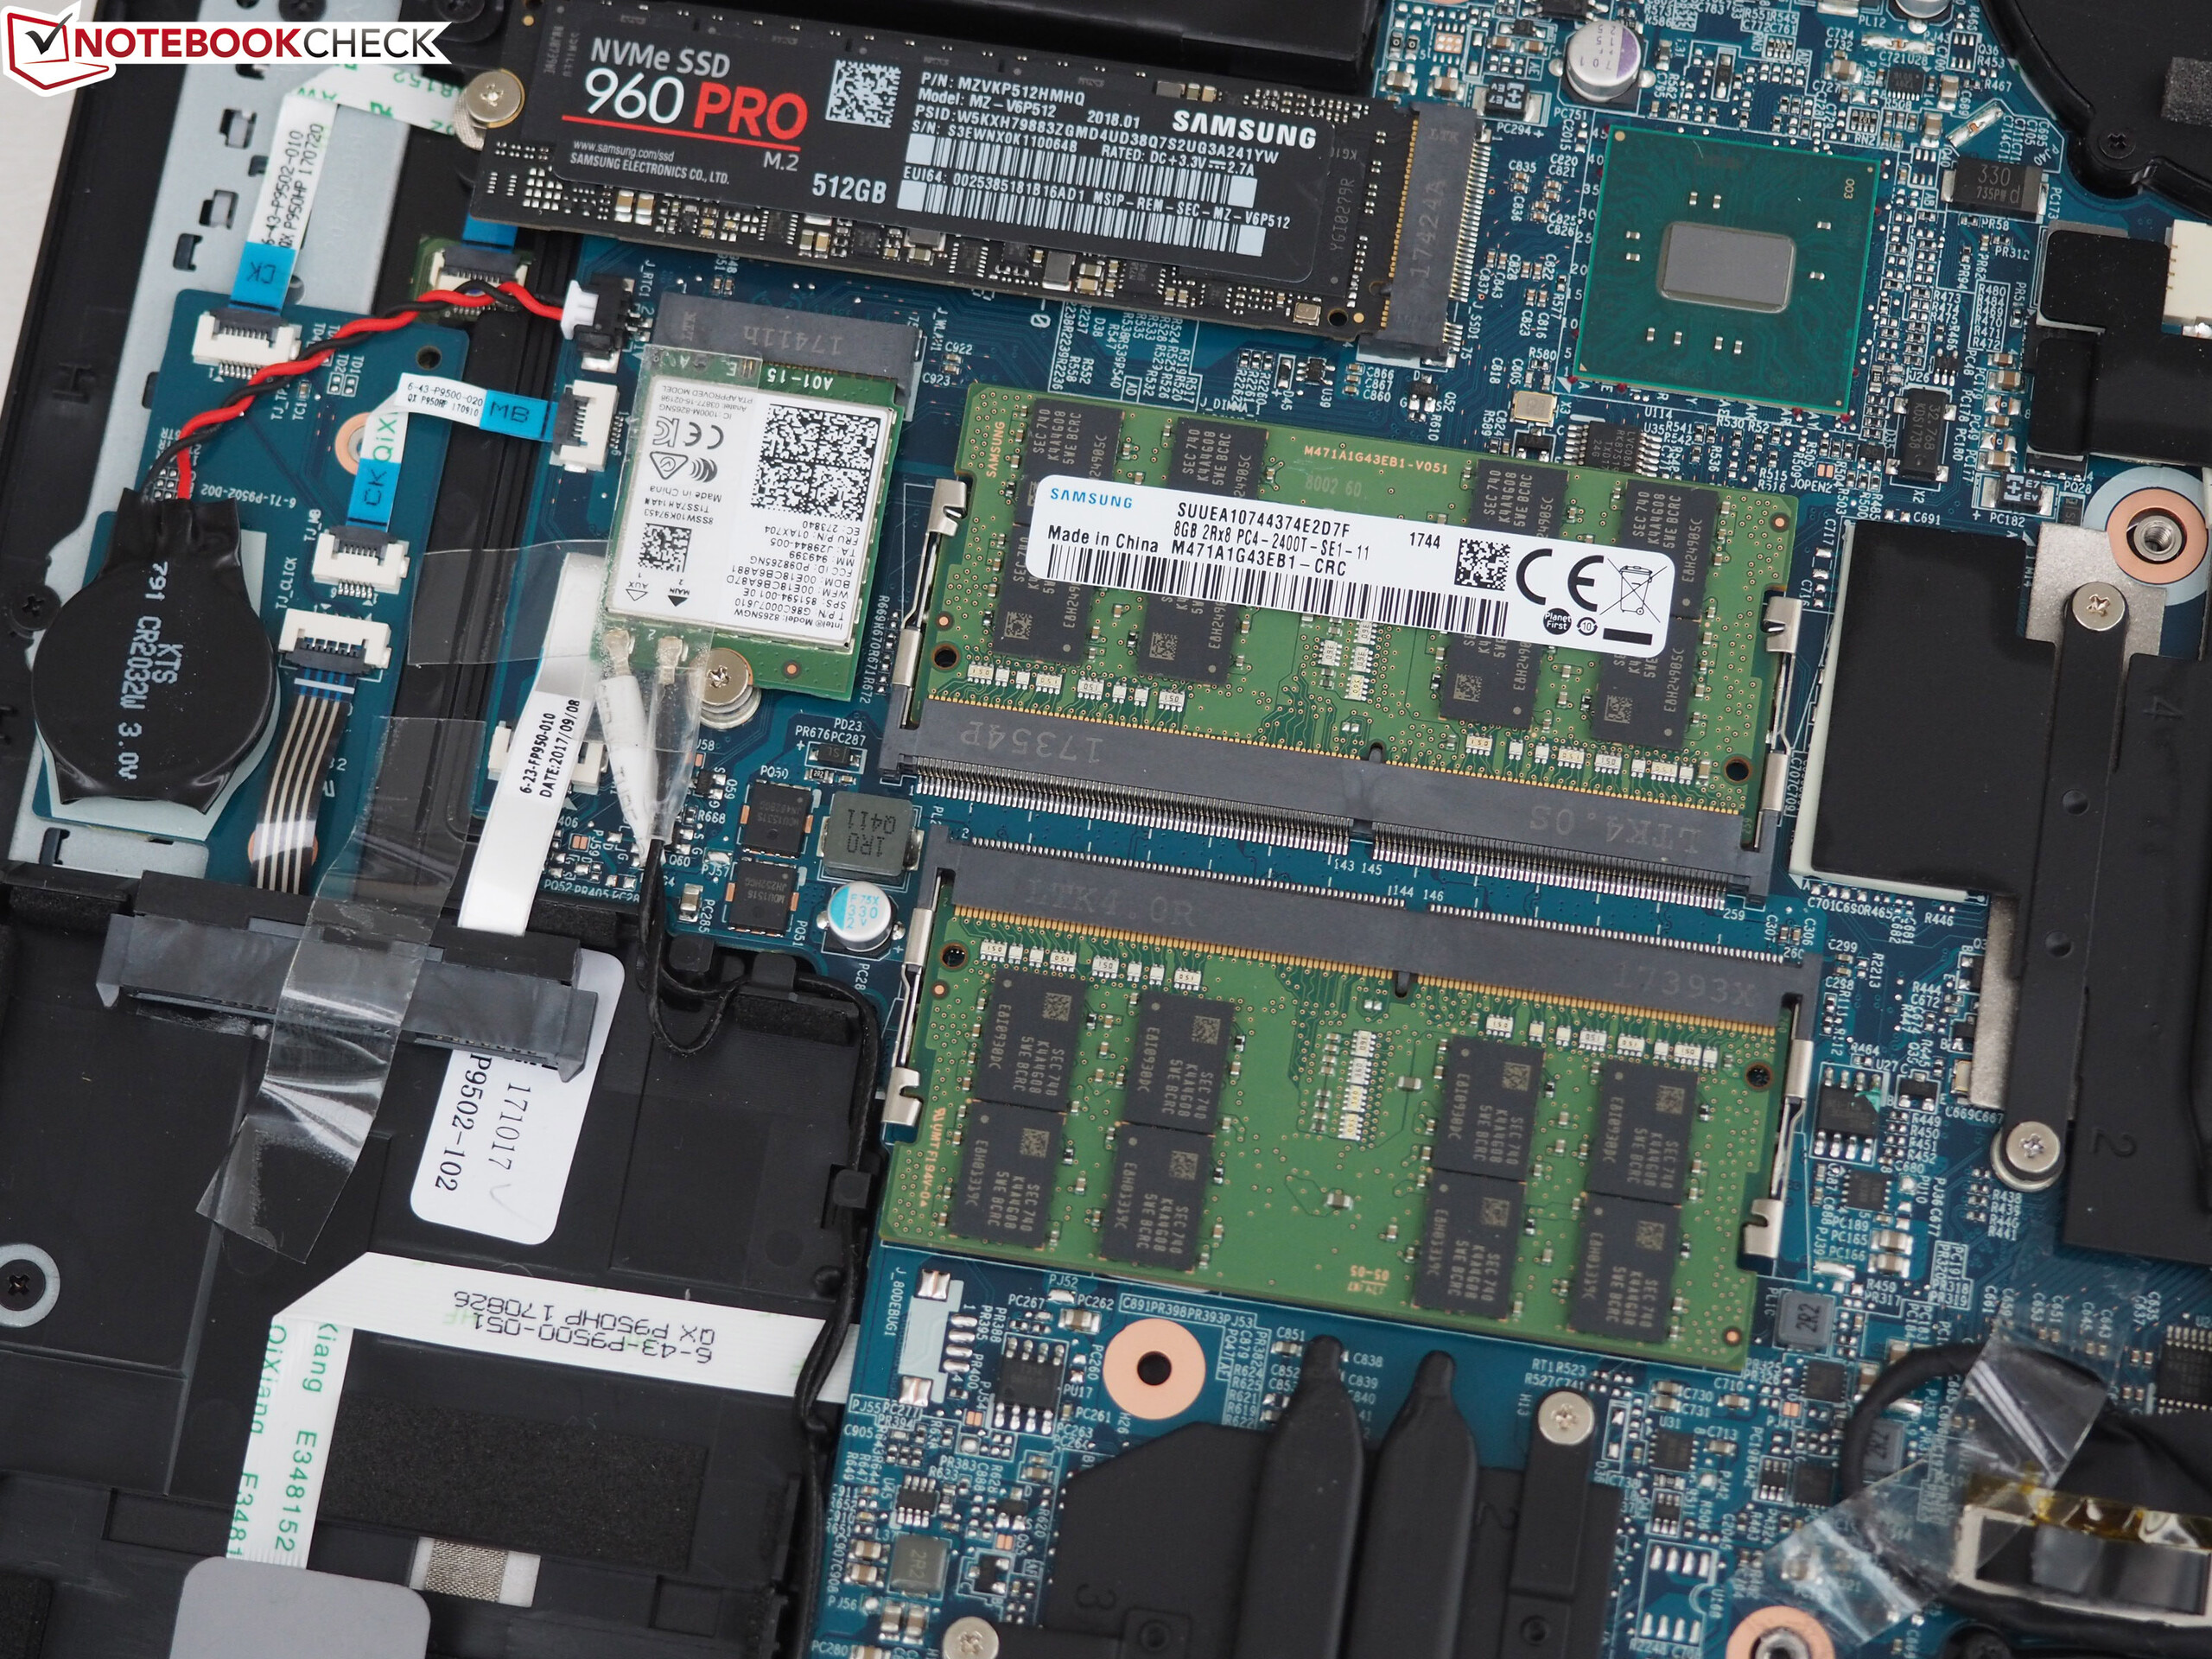
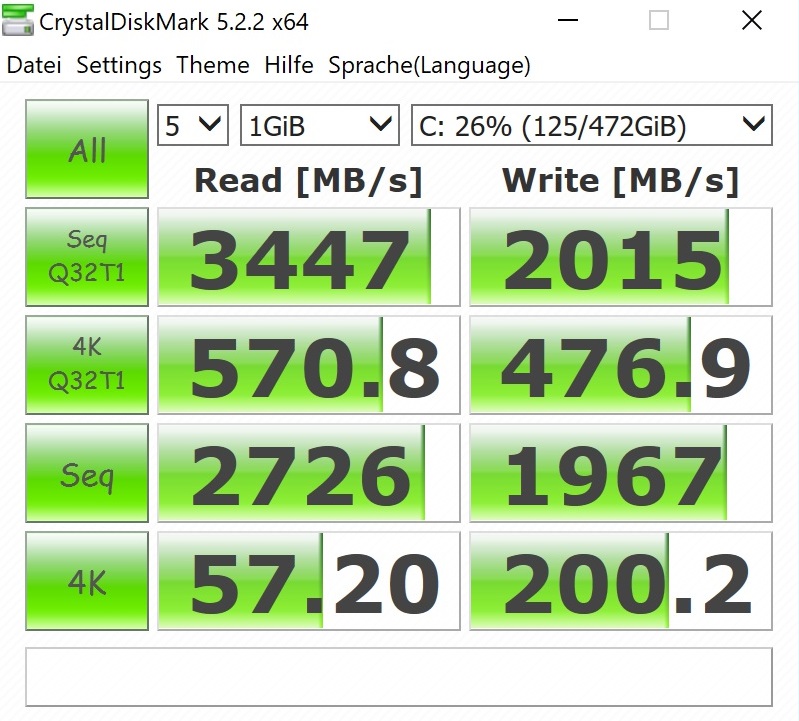
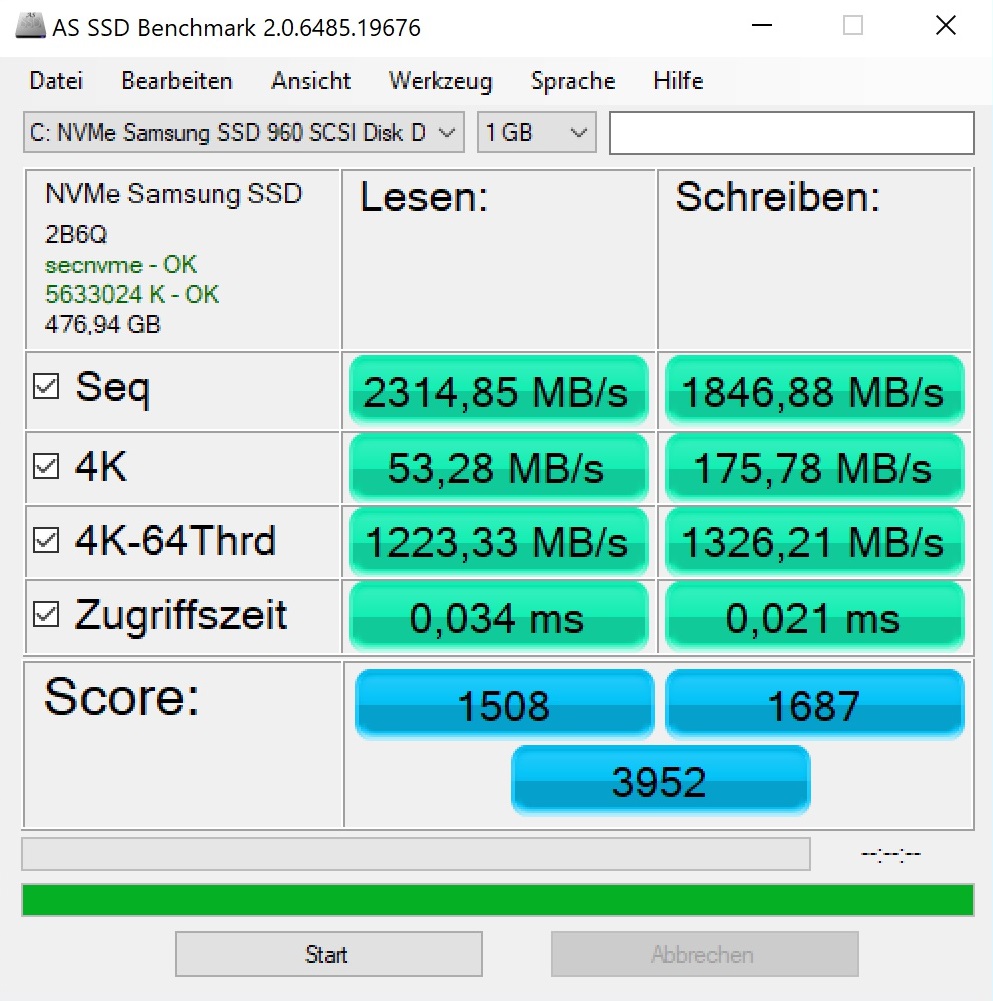
| Schenker Key 15 Samsung SSD 960 Pro 512 GB m.2 | Gigabyte Aero 15 Lite-On CX2-8B512-Q11 | Acer Aspire VN7-593G-73HP V15 Nitro BE Seagate Mobile HDD 1TB ST1000LM035 | Asus Zenbook Pro UX550VE-DB71T Samsung PM961 NVMe MZVLW512HMJP | Dell XPS 15 9560 (i7-7700HQ, UHD) Lite-On CX2-8B512-Q11 | Genomsnitt Samsung SSD 960 Pro 512 GB m.2 | |
|---|---|---|---|---|---|---|
| AS SSD | -12% | -28% | -5% | |||
| Seq Read (MB/s) | 2315 | 2208 -5% | 2026 -12% | 2551 ? 10% | ||
| Seq Write (MB/s) | 1847 | 1475 -20% | 1207 -35% | 1918 ? 4% | ||
| 4K Read (MB/s) | 53.3 | 51 -4% | 41.34 -22% | 45.1 ? -15% | ||
| 4K Write (MB/s) | 175.8 | 112.8 -36% | 112.2 -36% | 136.4 ? -22% | ||
| Score Read (Points) | 1508 | 1541 2% | 1206 -20% | 1460 ? -3% | ||
| Score Write (Points) | 1687 | 1421 -16% | 1022 -39% | 1639 ? -3% | ||
| Score Total (Points) | 3952 | 3721 -6% | 2810 -29% | 3820 ? -3% |

| 3DMark 11 Performance | 12633 poäng | |
| 3DMark Cloud Gate Standard Score | 25268 poäng | |
| 3DMark Fire Strike Score | 9744 poäng | |
| 3DMark Time Spy Score | 3748 poäng | |
Hjälp | ||
| The Witcher 3 | |
| 1920x1080 Ultra Graphics & Postprocessing (HBAO+) | |
| Genomsnitt av klass Multimedia (11 - 121, n=7, senaste 2 åren) | |
| Schenker Key 15 | |
| Genomsnitt NVIDIA GeForce GTX 1060 Mobile (24 - 42.3, n=60) | |
| Acer Aspire VN7-593G-73HP V15 Nitro BE | |
| Gigabyte Aero 15 | |
| Asus Zenbook Pro UX550VE-DB71T | |
| Dell XPS 15 9560 (i7-7700HQ, UHD) | |
| 1920x1080 High Graphics & Postprocessing (Nvidia HairWorks Off) | |
| Genomsnitt av klass Multimedia (22 - 224, n=7, senaste 2 åren) | |
| Schenker Key 15 | |
| Gigabyte Aero 15 | |
| Acer Aspire VN7-593G-73HP V15 Nitro BE | |
| Genomsnitt NVIDIA GeForce GTX 1060 Mobile (52.6 - 80.6, n=49) | |
| Dell XPS 15 9560 (i7-7700HQ, UHD) | |
| låg | med. | hög | ultra | 4K | |
|---|---|---|---|---|---|
| The Witcher 3 (2015) | 73.9 | 40.2 | 26.1 | ||
| Wolfenstein II: The New Colossus (2017) | 78 | 72.2 | 27.1 | ||
| Fortnite (2018) | 99.6 | 77.5 | 22.7 | ||
| Final Fantasy XV Benchmark (2018) | 37.2 | 16.4 | |||
| Kingdom Come: Deliverance (2018) | 60.3 | 43.9 | 13.9 |
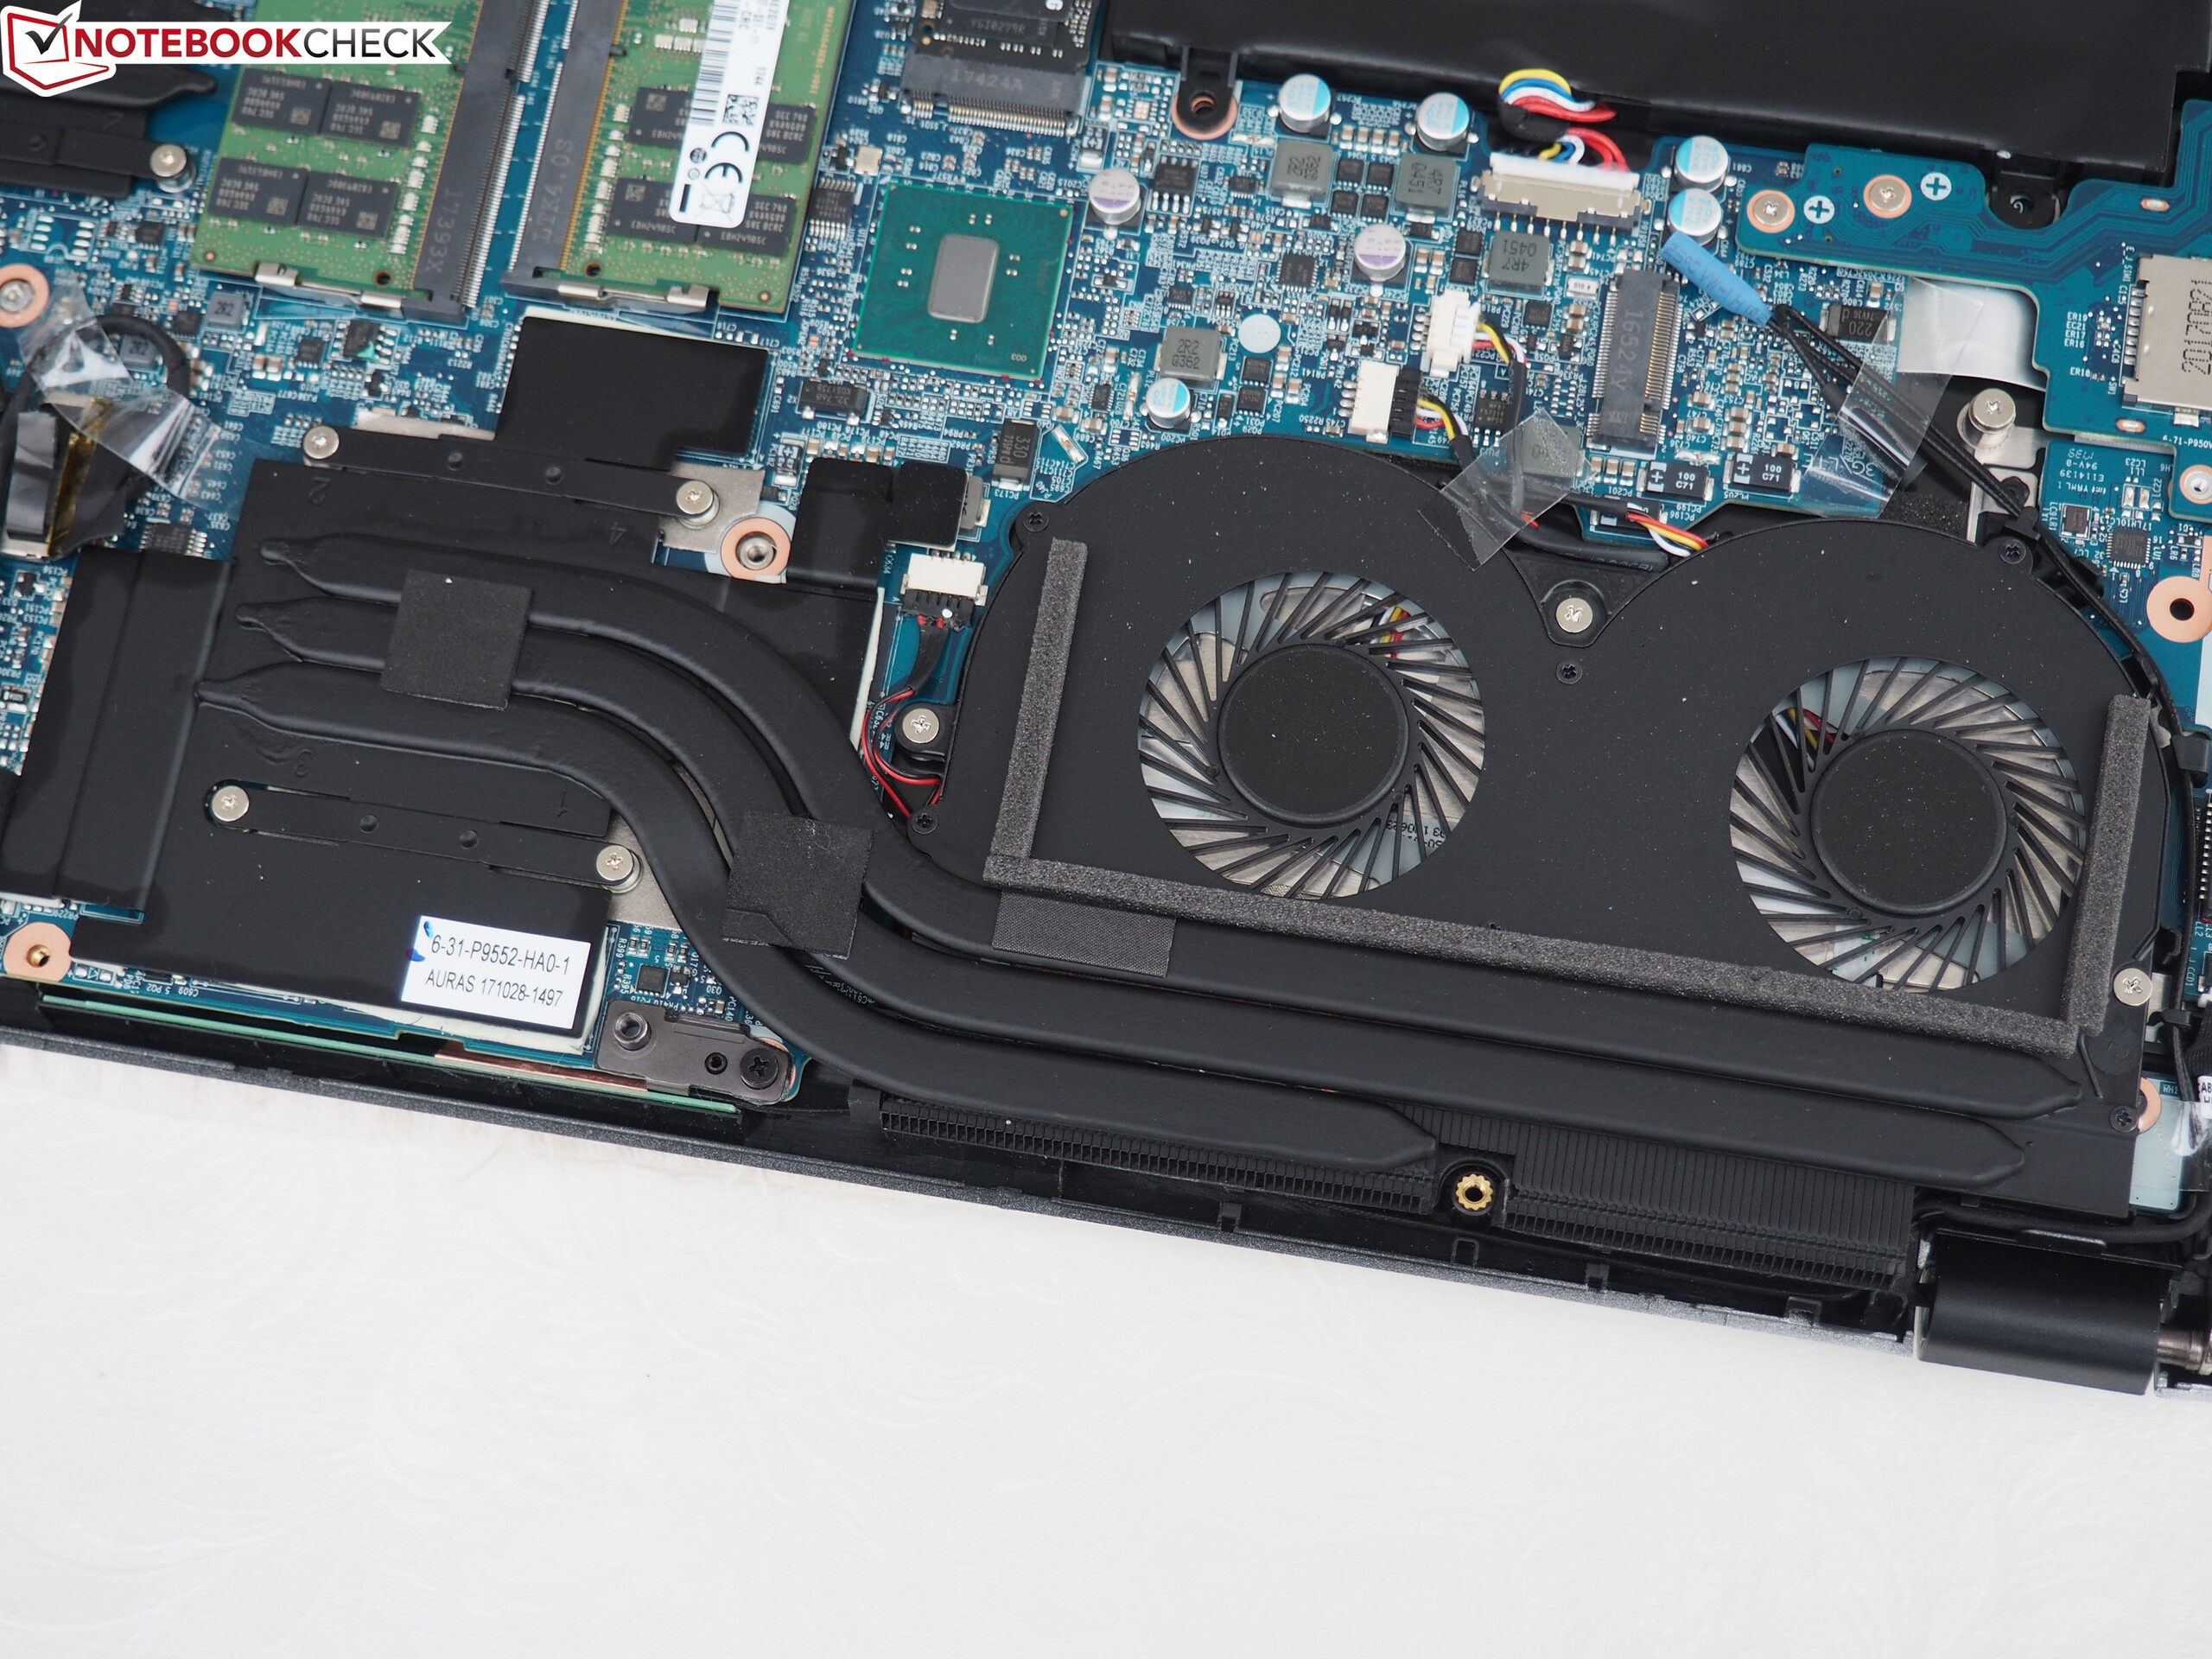
Ljudnivå
| Låg belastning |
| 31 / 32 / 39 dB(A) |
| Hög belastning |
| 47 / 54 dB(A) |
 | ||
30 dB tyst 40 dB(A) hörbar 50 dB(A) högt ljud |
||
min: | ||
| Schenker Key 15 GeForce GTX 1060 Mobile, i7-7700HQ | Gigabyte Aero 15 GeForce GTX 1060 Mobile, i7-7700HQ | Acer Aspire VN7-593G-73HP V15 Nitro BE GeForce GTX 1060 Mobile, i7-7700HQ | Asus Zenbook Pro UX550VE-DB71T GeForce GTX 1050 Ti Mobile, i7-7700HQ | Dell XPS 15 9560 (i7-7700HQ, UHD) GeForce GTX 1050 Mobile, i7-7700HQ | |
|---|---|---|---|---|---|
| Noise | 5% | 8% | 8% | 6% | |
| av / miljö * (dB) | 29 | 31 -7% | 30.4 -5% | 28.3 2% | 28.4 2% |
| Idle Minimum * (dB) | 31 | 32 -3% | 30.9 -0% | 30.4 2% | 29 6% |
| Idle Average * (dB) | 32 | 33 -3% | 30.9 3% | 31 3% | 29 9% |
| Idle Maximum * (dB) | 39 | 34 13% | 31.5 19% | 31.2 20% | 32.2 17% |
| Load Average * (dB) | 47 | 39 17% | 40.7 13% | 43.3 8% | 47.1 -0% |
| Witcher 3 ultra * (dB) | 49 | 43 12% | 45.5 7% | 46.2 6% | 52 -6% |
| Load Maximum * (dB) | 54 | 50 7% | 43.9 19% | 46.2 14% | 47.1 13% |
* ... mindre är bättre
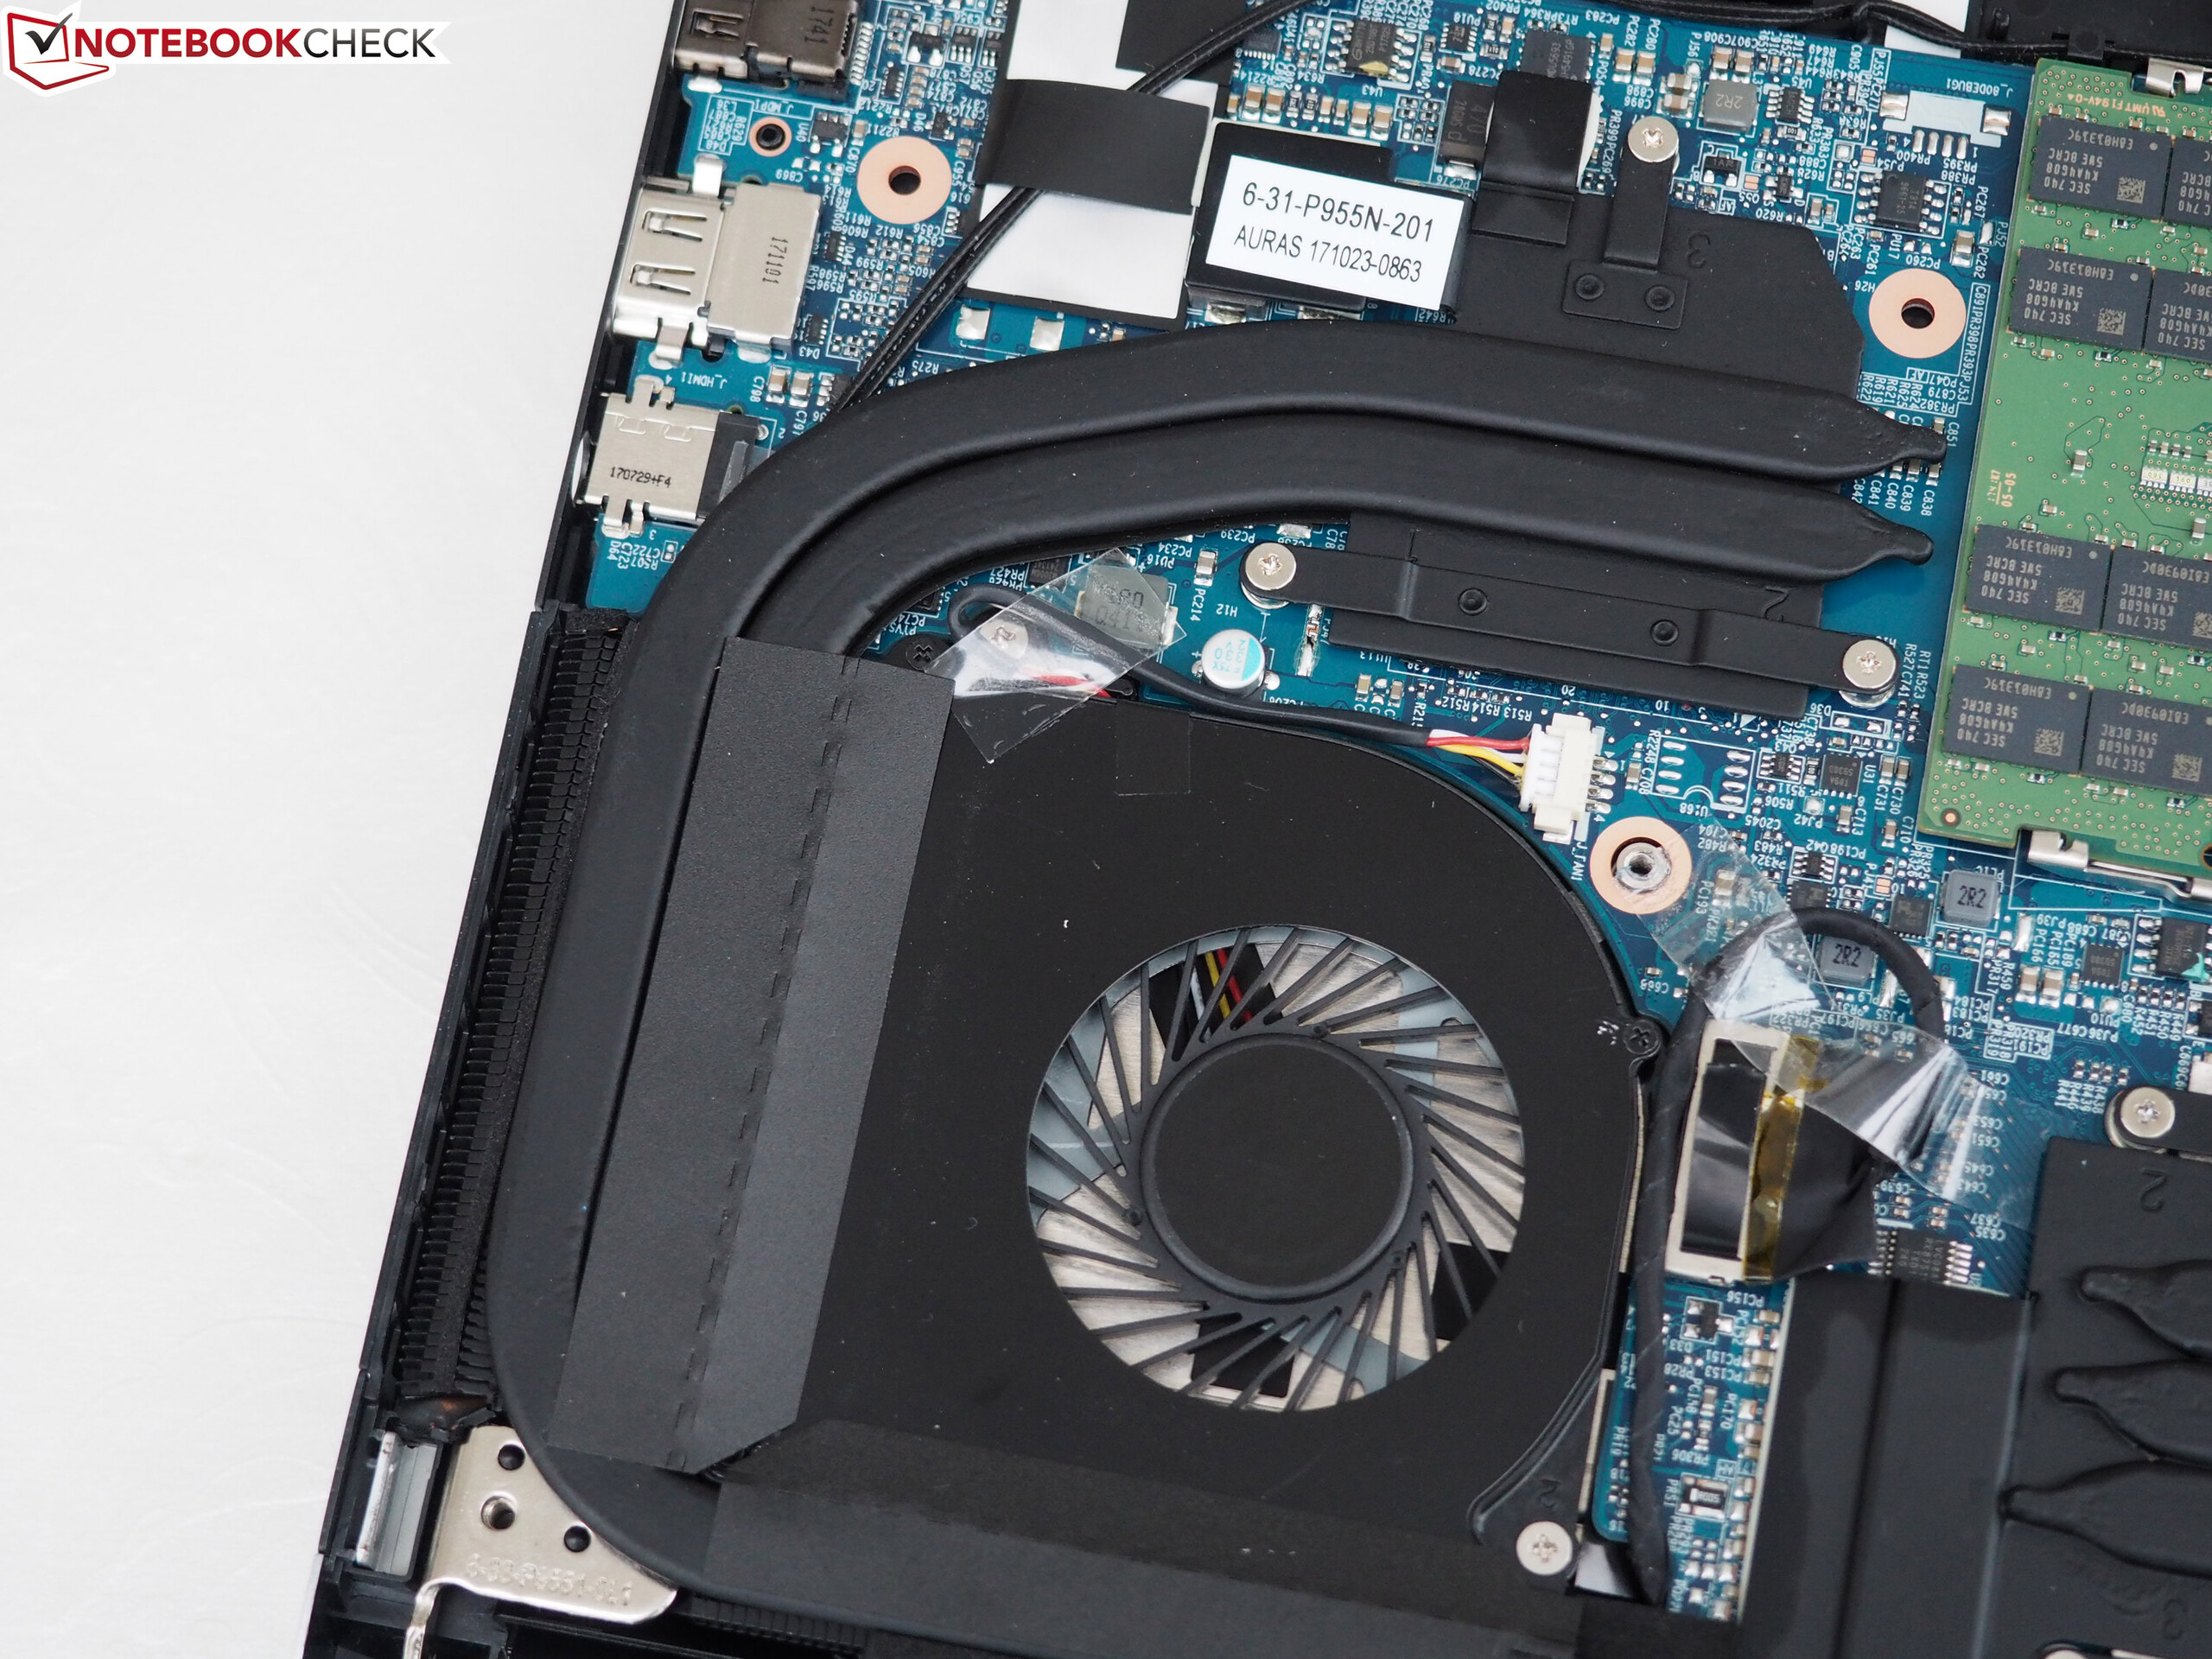
(-) Den maximala temperaturen på ovansidan är 55 °C / 131 F, jämfört med genomsnittet av 36.8 °C / 98 F , allt från 21 till 71 °C för klassen Multimedia.
(-) Botten värms upp till maximalt 56 °C / 133 F, jämfört med genomsnittet av 39.1 °C / 102 F
(+) Vid tomgångsbruk är medeltemperaturen för ovansidan 22 °C / 72 F, jämfört med enhetsgenomsnittet på 31.3 °C / ### class_avg_f### F.
(±) När du spelar The Witcher 3 är medeltemperaturen för ovansidan 36 °C / 97 F, jämfört med enhetsgenomsnittet på 31.3 °C / ## #class_avg_f### F.
(+) Handledsstöden och pekplattan når maximal hudtemperatur (35 °C / 95 F) och är därför inte varma.
(-) Medeltemperaturen för handledsstödsområdet på liknande enheter var 28.7 °C / 83.7 F (-6.3 °C / -11.3 F).
| Schenker Key 15 GeForce GTX 1060 Mobile, i7-7700HQ | Gigabyte Aero 15 GeForce GTX 1060 Mobile, i7-7700HQ | Acer Aspire VN7-593G-73HP V15 Nitro BE GeForce GTX 1060 Mobile, i7-7700HQ | Asus Zenbook Pro UX550VE-DB71T GeForce GTX 1050 Ti Mobile, i7-7700HQ | Dell XPS 15 9560 (i7-7700HQ, UHD) GeForce GTX 1050 Mobile, i7-7700HQ | |
|---|---|---|---|---|---|
| Heat | -5% | -10% | 4% | 4% | |
| Maximum Upper Side * (°C) | 55 | 56 -2% | 51.9 6% | 43.2 21% | 48.8 11% |
| Maximum Bottom * (°C) | 56 | 61 -9% | 54.6 2% | 49.8 11% | 42.6 24% |
| Idle Upper Side * (°C) | 23 | 25 -9% | 29.1 -27% | 24.8 -8% | 26 -13% |
| Idle Bottom * (°C) | 24 | 24 -0% | 29.3 -22% | 26 -8% | 25.4 -6% |
* ... mindre är bättre
Schenker Key 15 ljudanalys
(-) | inte särskilt höga högtalare (71 dB)
Bas 100 - 315 Hz
(-) | nästan ingen bas - i genomsnitt 19.2% lägre än medianen
(±) | linjäriteten för basen är genomsnittlig (7.3% delta till föregående frekvens)
Mellan 400 - 2000 Hz
(±) | högre mellan - i genomsnitt 7.9% högre än median
(±) | linjäriteten för mids är genomsnittlig (10.8% delta till föregående frekvens)
Högsta 2 - 16 kHz
(+) | balanserade toppar - endast 2.7% från medianen
(+) | toppar är linjära (6.2% delta till föregående frekvens)
Totalt 100 - 16 000 Hz
(±) | linjäriteten för det totala ljudet är genomsnittlig (29.9% skillnad mot median)
Jämfört med samma klass
» 95% av alla testade enheter i den här klassen var bättre, 2% liknande, 3% sämre
» Den bästa hade ett delta på 5%, genomsnittet var 17%, sämst var 45%
Jämfört med alla testade enheter
» 88% av alla testade enheter var bättre, 3% liknande, 9% sämre
» Den bästa hade ett delta på 4%, genomsnittet var 23%, sämst var 134%
Gigabyte Aero 15 ljudanalys
(±) | högtalarljudstyrkan är genomsnittlig men bra (79 dB)
Bas 100 - 315 Hz
(-) | nästan ingen bas - i genomsnitt 23.3% lägre än medianen
(±) | linjäriteten för basen är genomsnittlig (10.7% delta till föregående frekvens)
Mellan 400 - 2000 Hz
(+) | balanserad mellan - endast 1.8% från medianen
(+) | mids är linjära (4.1% delta till föregående frekvens)
Högsta 2 - 16 kHz
(+) | balanserade toppar - endast 2.6% från medianen
(+) | toppar är linjära (5.1% delta till föregående frekvens)
Totalt 100 - 16 000 Hz
(±) | linjäriteten för det totala ljudet är genomsnittlig (18.3% skillnad mot median)
Jämfört med samma klass
» 56% av alla testade enheter i den här klassen var bättre, 7% liknande, 38% sämre
» Den bästa hade ett delta på 5%, genomsnittet var 17%, sämst var 45%
Jämfört med alla testade enheter
» 40% av alla testade enheter var bättre, 8% liknande, 52% sämre
» Den bästa hade ett delta på 4%, genomsnittet var 23%, sämst var 134%
| Av/Standby | |
| Låg belastning | |
| Hög belastning |
|
Förklaring:
min: | |
| Schenker Key 15 GeForce GTX 1060 Mobile, i7-7700HQ | Gigabyte Aero 15 GeForce GTX 1060 Mobile, i7-7700HQ | Acer Aspire VN7-593G-73HP V15 Nitro BE GeForce GTX 1060 Mobile, i7-7700HQ | Asus Zenbook Pro UX550VE-DB71T GeForce GTX 1050 Ti Mobile, i7-7700HQ | Dell XPS 15 9560 (i7-7700HQ, UHD) GeForce GTX 1050 Mobile, i7-7700HQ | |
|---|---|---|---|---|---|
| Power Consumption | -23% | -2% | 22% | -21% | |
| Idle Minimum * (Watt) | 7 | 12 -71% | 7.2 -3% | 6.3 10% | 11.9 -70% |
| Idle Average * (Watt) | 10 | 15 -50% | 10.5 -5% | 7.9 21% | 17.1 -71% |
| Idle Maximum * (Watt) | 18 | 20 -11% | 16 11% | 8.1 55% | 17.3 4% |
| Load Average * (Watt) | 82 | 82 -0% | 82 -0% | 84.9 -4% | 94.7 -15% |
| Witcher 3 ultra * (Watt) | 111 | 111 -0% | 124 -12% | 96.3 13% | 104.8 6% |
| Load Maximum * (Watt) | 154 | 161 -5% | 155 -1% | 102.4 34% | 122 21% |
* ... mindre är bättre
| Schenker Key 15 GeForce GTX 1060 Mobile, i7-7700HQ, 55 Wh | Gigabyte Aero 15 GeForce GTX 1060 Mobile, i7-7700HQ, 94.24 Wh | Acer Aspire VN7-593G-73HP V15 Nitro BE GeForce GTX 1060 Mobile, i7-7700HQ, 69 Wh | Asus Zenbook Pro UX550VE-DB71T GeForce GTX 1050 Ti Mobile, i7-7700HQ, 73 Wh | Dell XPS 15 9560 (i7-7700HQ, UHD) GeForce GTX 1050 Mobile, i7-7700HQ, 97 Wh | Genomsnitt av klass Multimedia | |
|---|---|---|---|---|---|---|
| Batteridrifttid | 67% | 47% | 76% | 62% | 205% | |
| Reader / Idle (h) | 8 | 10.6 33% | 8.4 5% | 17.1 114% | 13.9 74% | 24.9 ? 211% |
| H.264 (h) | 3.6 | 7.7 114% | 17.1 ? 375% | |||
| WiFi v1.3 (h) | 4 | 7 75% | 6 50% | 8.9 123% | 7.2 80% | 12.2 ? 205% |
| Load (h) | 1.3 | 1.9 46% | 2.4 85% | 1.2 -8% | 1.7 31% | 1.664 ? 28% |
För
Emot
Läs den fullständiga versionen av den här recensionen på engelska här.
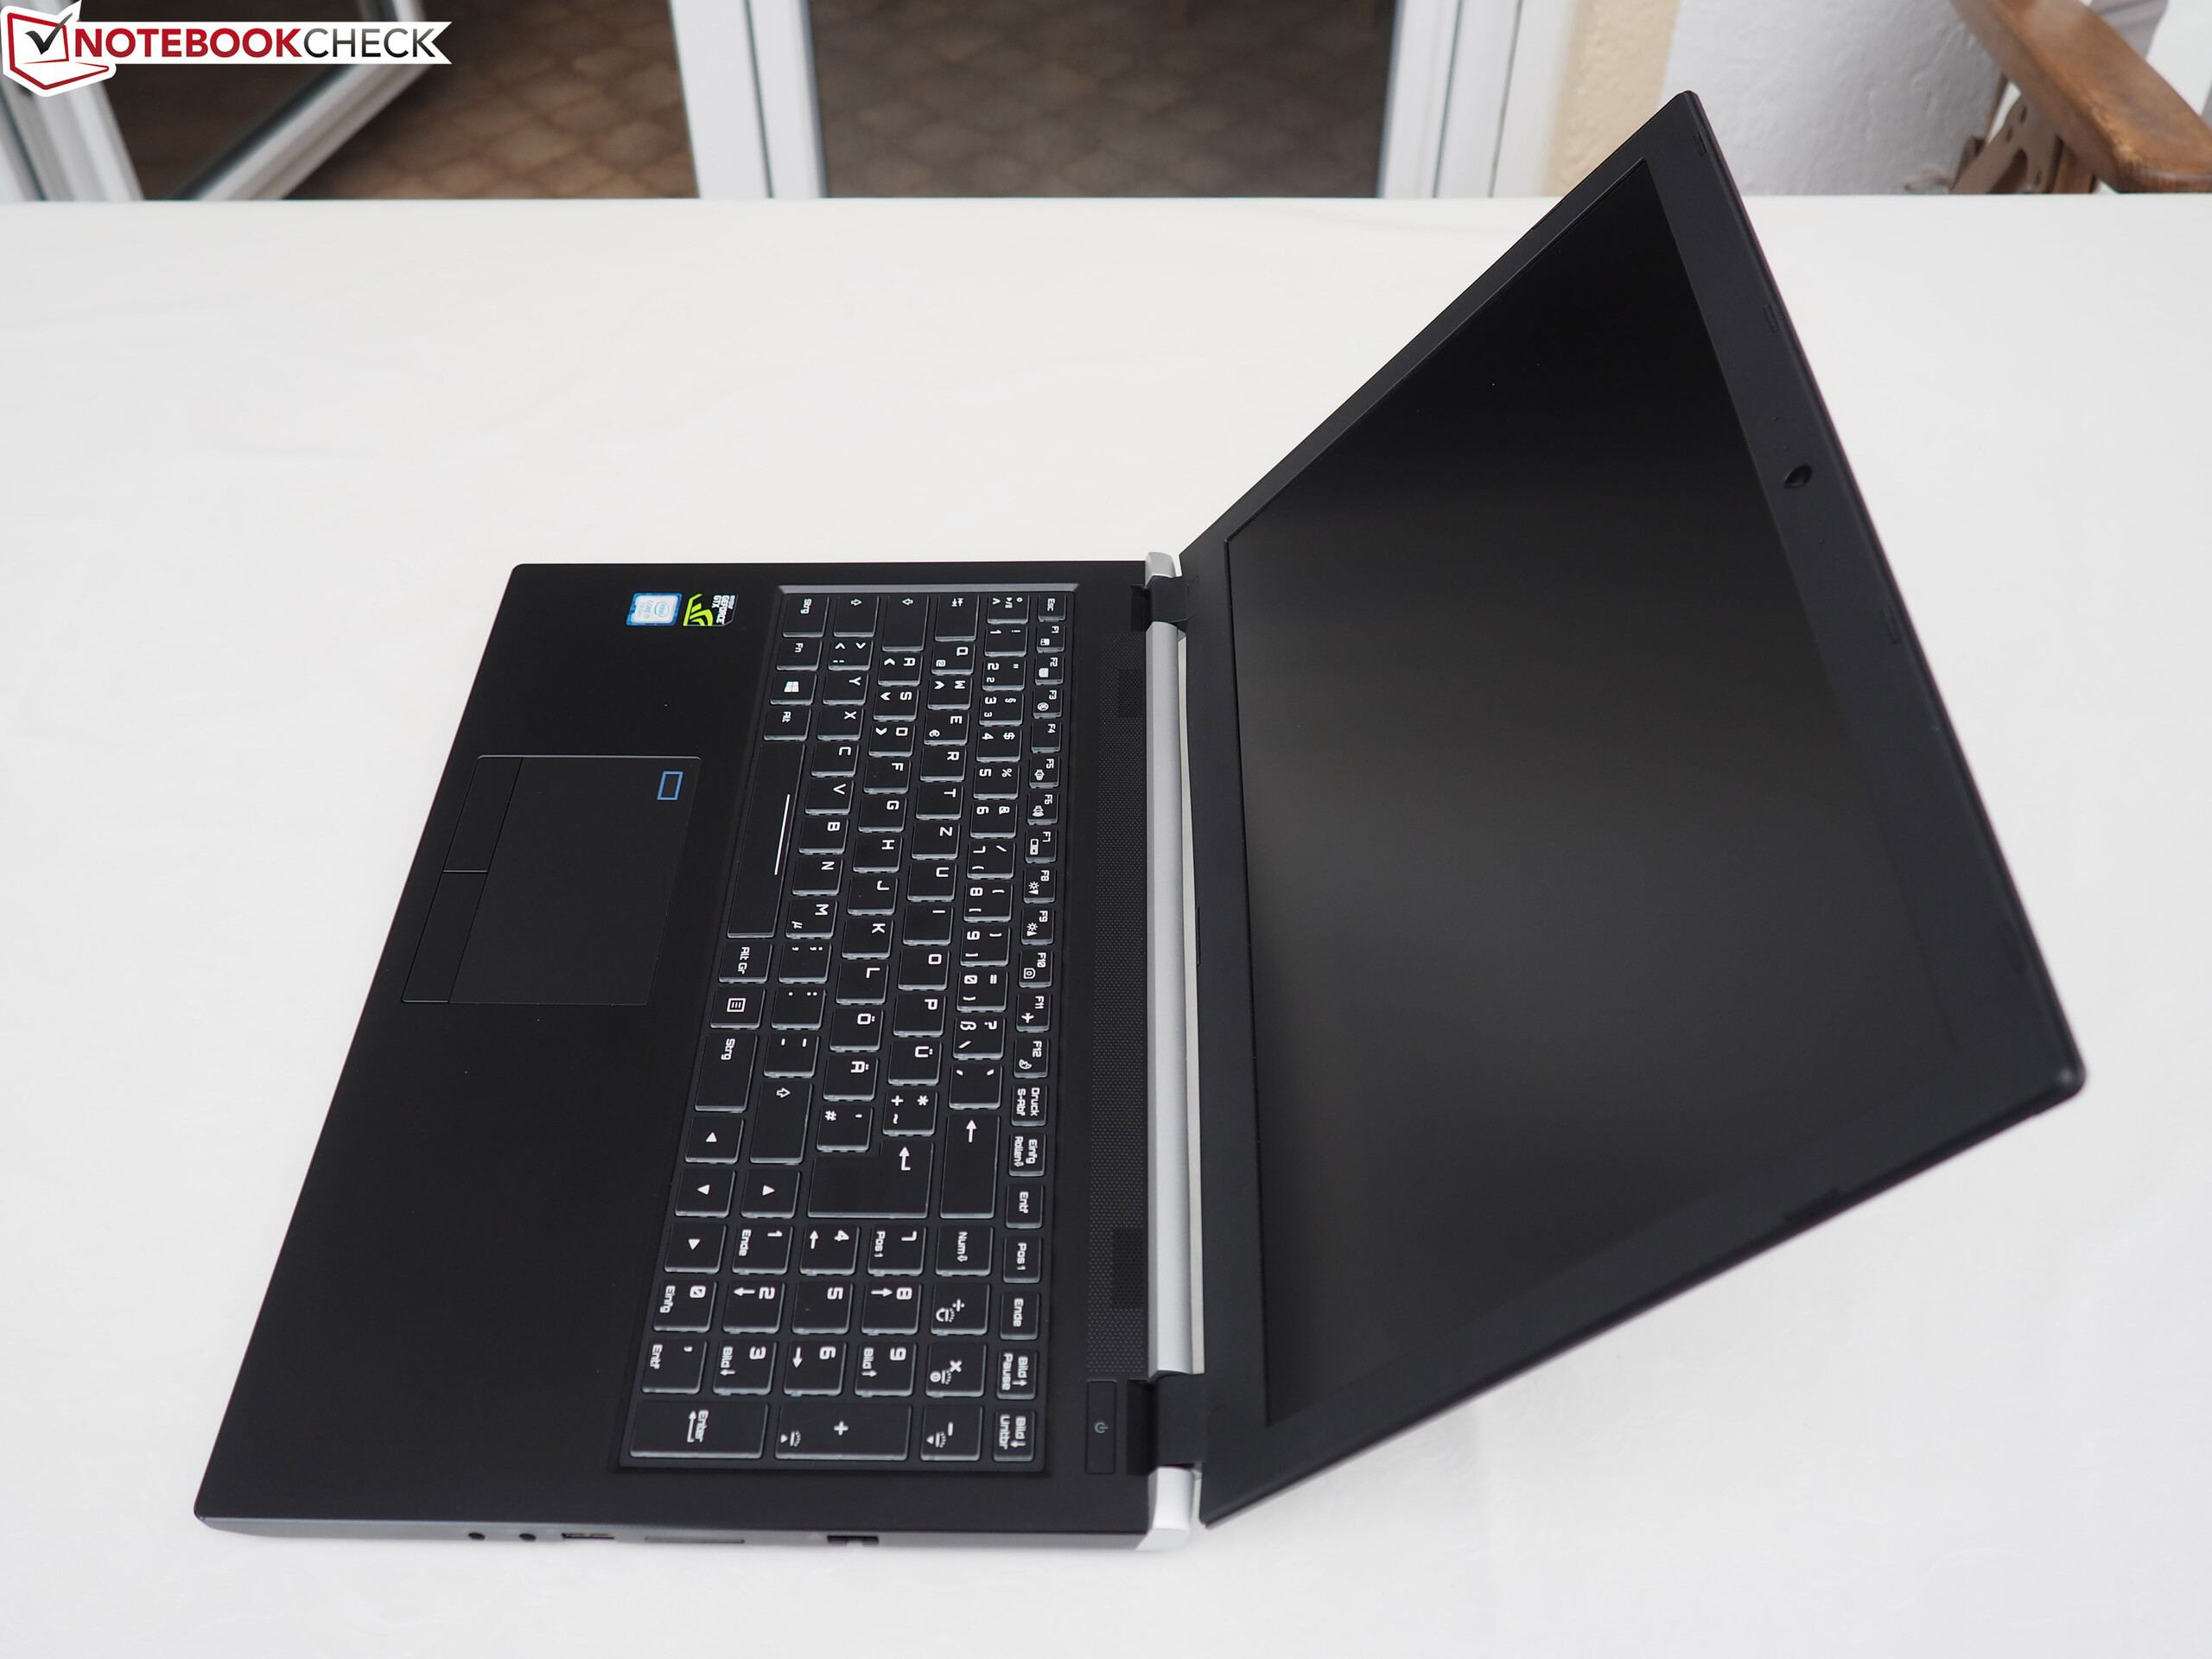
Multimedia-laptops finns det massor av. Men om den ska vara i ett tjusigt och tunt metallhölje med hyfsad prestanda så faller oräkneliga produkter bort. Key 15 från Schenker Technologies, däremot, uppfyller alla kriterier och går mot att bli en framgångsrik allt-i-allo.
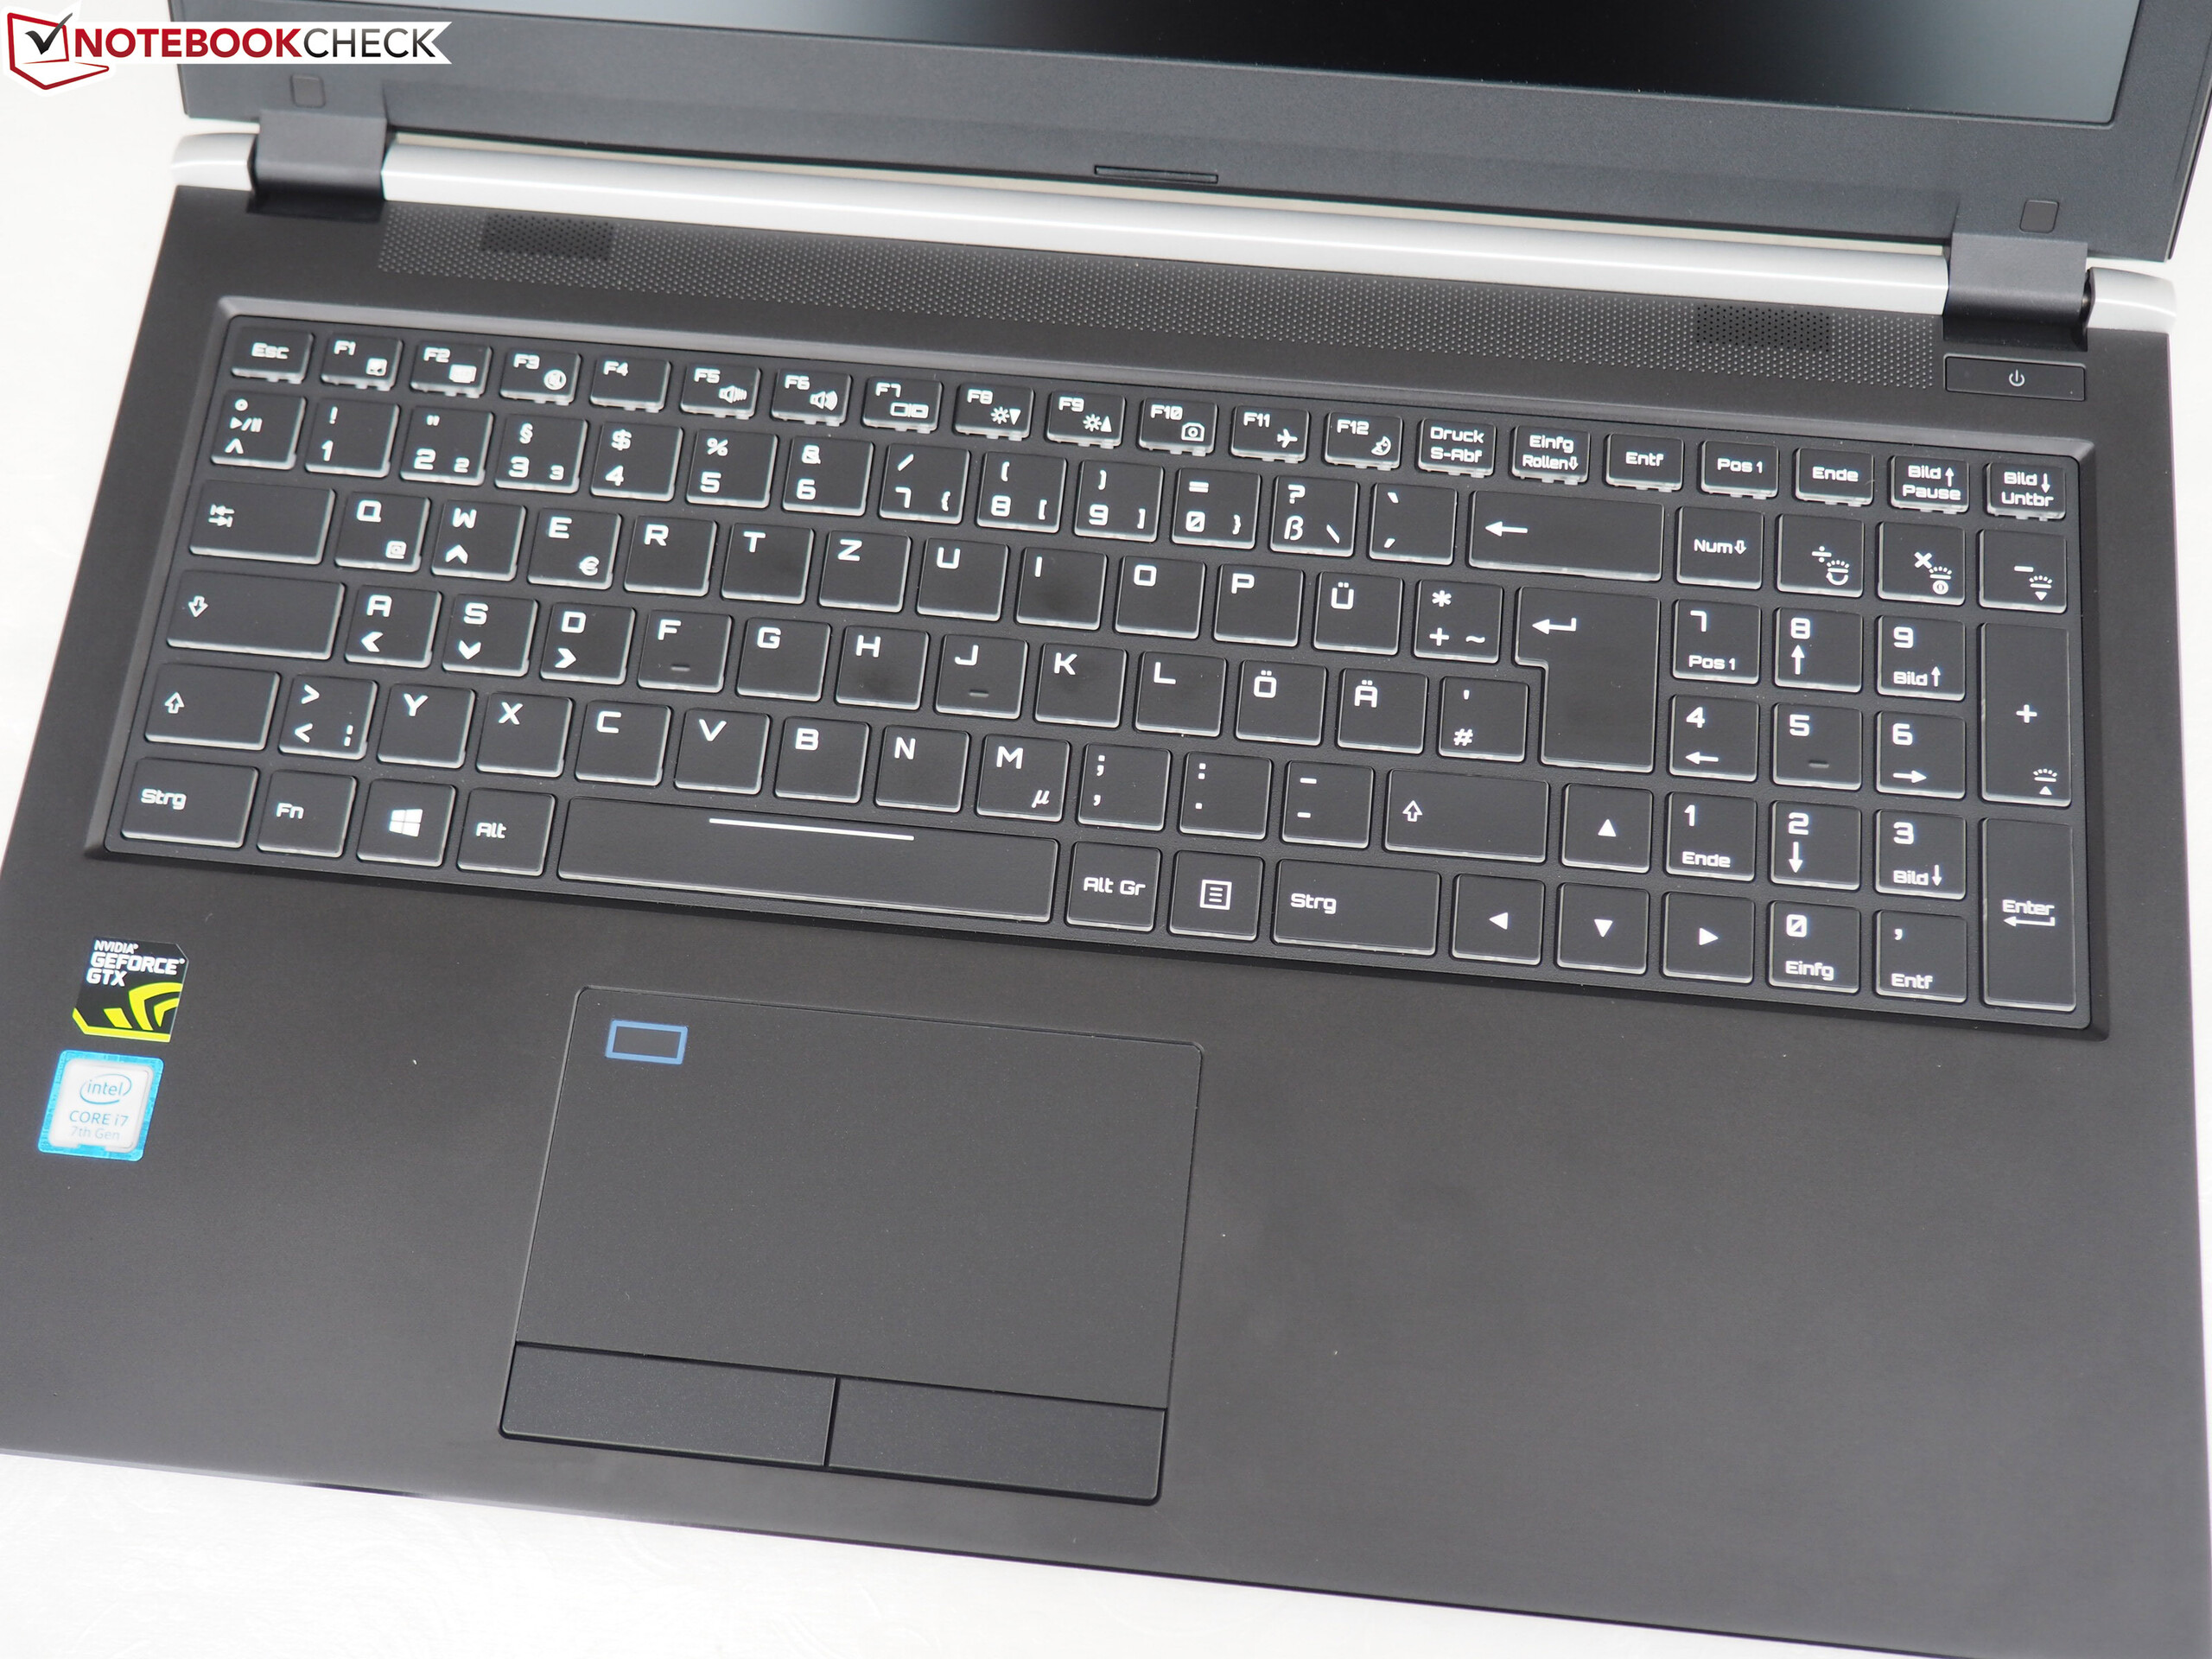
På den positiva sidan finns främst den låga vikten, som gör transport väldigt bekväm. Man hade inte anat den kraftfulla hårdvaran bara genom att titta på denna 15-tummare. Men systemet kan också misstas för en toppskikts-laptop. Man hittar sällan så mycket prestanda i ett så litet utrymme. Dom flesta köpare borde vara nöjda med anslutningarna, inmatningsenheterna och skärmen.
Men Key 15 har svårt att stå sig mot multimedia-eliten. Särskilt Aero 15, som också finns tillgänglig med GTX 1060 och GTX 1070 Max-Q, springer om Schenker-modellen vid flera tillfällen. Gigabyte-konkurrenten är inte bara tystare utan får också poäng på bättre ljud, en mer stabil CPU-hastighet och - genom att utelämna 2.5-tums enhetsplatsen - ett betydligt mycket större batteri. För en del användare kan Thunderbolt 3-porten också vara ett argument för Aero 15.
Schenker Key 15
- 06/14/2018 v6 (old)
Florian Glaser
Price comparison