Test: MSI GE76 Raider 11UH - Avancerad spellaptop med snabb 360 Hz-skärm (Sammanfattning)
Testgrupp
Gradering | Datum | Modell | Vikt | Höjd | Storlek | Upplösning | Pris |
|---|---|---|---|---|---|---|---|
| 86.2 % v7 (old) | 09/2021 | MSI GE76 Raider 11UH-472US i9-11980HK, GeForce RTX 3080 Laptop GPU | 3 kg | 27.4 mm | 17.30" | 1920x1080 | |
| 87.1 % v7 (old) | 02/2021 | MSI GE76 Raider 10UH i7-10870H, GeForce RTX 3080 Laptop GPU | 3 kg | 27.4 mm | 17.30" | 1920x1080 | |
| 88 % v7 (old) | 09/2021 | Gigabyte Aero 17 HDR YD i9-11980HK, GeForce RTX 3080 Laptop GPU | 2.8 kg | 22 mm | 17.30" | 3840x2160 | |
| 85.3 % v7 (old) | 04/2021 | Alienware m17 R4 i9-10980HK, GeForce RTX 3080 Laptop GPU | 3 kg | 22 mm | 17.30" | 1920x1080 |

| SD Card Reader | |
| average JPG Copy Test (av. of 3 runs) | |
| MSI GE76 Raider 10UH (Toshiba Exceria Pro SDXC 64 GB UHS-II) | |
| Alienware m17 R4 (AV PRO microSD 128 GB V60) | |
| Gigabyte Aero 17 HDR YD (AV PRO microSD 128 GB V60) | |
| Genomsnitt av klass Gaming (20.9 - 210, n=54, senaste 2 åren) | |
| MSI GE76 Raider 11UH-472US (AV PRO microSD 128 GB V60) | |
| maximum AS SSD Seq Read Test (1GB) | |
| Alienware m17 R4 (AV PRO microSD 128 GB V60) | |
| MSI GE76 Raider 10UH (Toshiba Exceria Pro SDXC 64 GB UHS-II) | |
| Gigabyte Aero 17 HDR YD (AV PRO microSD 128 GB V60) | |
| Genomsnitt av klass Gaming (25.5 - 261, n=51, senaste 2 åren) | |
| MSI GE76 Raider 11UH-472US (AV PRO microSD 128 GB V60) | |


| |||||||||||||||||||||||||
Distribution av ljusstyrkan: 96 %
Mitt på batteriet: 301 cd/m²
Kontrast: 1204:1 (Svärta: 0.25 cd/m²)
ΔE ColorChecker Calman: 5.66 | ∀{0.5-29.43 Ø4.72}
calibrated: 2.7
ΔE Greyscale Calman: 5.2 | ∀{0.09-98 Ø4.97}
51.2% AdobeRGB 1998 (Argyll 3D)
74.4% sRGB (Argyll 3D)
49.6% Display P3 (Argyll 3D)
Gamma: 2.225
CCT: 6566 K
| MSI GE76 Raider 11UH-472US AU Optronics AUOE295, IPS, 1920x1080, 17.3" | MSI GE76 Raider 10UH AU Optronics B173HAN05.1, IPS, 1920x1080, 17.3" | Gigabyte Aero 17 HDR YD AU Optronics AUO329B, IPS, 3840x2160, 17.3" | Alienware m17 R4 AU Optronics AUOEC91, IPS, 1920x1080, 17.3" | |
|---|---|---|---|---|
| Display | 40% | 68% | 38% | |
| Display P3 Coverage (%) | 49.6 | 71.8 45% | 86.9 75% | 69.8 41% |
| sRGB Coverage (%) | 74.4 | 98.1 32% | 100 34% | 99.7 34% |
| AdobeRGB 1998 Coverage (%) | 51.2 | 73.9 44% | 99.6 95% | 71.6 40% |
| Response Times | -108% | -432% | -47% | |
| Response Time Grey 50% / Grey 80% * (ms) | 6.4 ? | 20.4 ? -219% | 52 ? -713% | 13.2 ? -106% |
| Response Time Black / White * (ms) | 10.4 ? | 10 ? 4% | 26 ? -150% | 9.2 ? 12% |
| PWM Frequency (Hz) | 151500 | |||
| Screen | 5% | 43% | 37% | |
| Brightness middle (cd/m²) | 301 | 324.6 8% | 488 62% | 305 1% |
| Brightness (cd/m²) | 295 | 312 6% | 467 58% | 301 2% |
| Brightness Distribution (%) | 96 | 87 -9% | 86 -10% | 93 -3% |
| Black Level * (cd/m²) | 0.25 | 0.28 -12% | 0.33 -32% | 0.19 24% |
| Contrast (:1) | 1204 | 1159 -4% | 1479 23% | 1605 33% |
| Colorchecker dE 2000 * | 5.66 | 3.87 32% | 1.23 78% | 1.31 77% |
| Colorchecker dE 2000 max. * | 9.75 | 9.35 4% | 2.94 70% | 2.32 76% |
| Colorchecker dE 2000 calibrated * | 2.7 | 1.42 47% | 0.77 71% | 0.91 66% |
| Greyscale dE 2000 * | 5.2 | 6.5 -25% | 1.5 71% | 2.3 56% |
| Gamma | 2.225 99% | 2.23 99% | 2.169 101% | 2.281 96% |
| CCT | 6566 99% | 5702 114% | 6614 98% | 6449 101% |
| Color Space (Percent of AdobeRGB 1998) (%) | 66.3 | 99 | 72 | |
| Color Space (Percent of sRGB) (%) | 98 | 99 | 94 | |
| Totalt genomsnitt (program/inställningar) | -21% /
-3% | -107% /
-19% | 9% /
25% |
* ... mindre är bättre
Visa svarstider
| ↔ Svarstid svart till vitt | ||
|---|---|---|
| 10.4 ms ... stiga ↗ och falla ↘ kombinerat | ↗ 6 ms stiga | 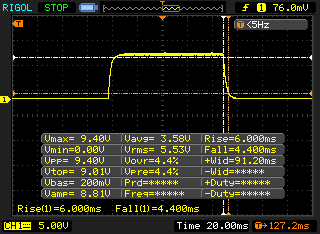 |
| ↘ 4.4 ms hösten | ||
| Skärmen visar bra svarsfrekvens i våra tester, men kan vara för långsam för konkurrenskraftiga spelare. I jämförelse sträcker sig alla testade enheter från 0.1 (minst) till 240 (maximalt) ms. » 28 % av alla enheter är bättre. Det betyder att den uppmätta svarstiden är bättre än genomsnittet av alla testade enheter (19.8 ms). | ||
| ↔ Svarstid 50 % grått till 80 % grått | ||
| 6.4 ms ... stiga ↗ och falla ↘ kombinerat | ↗ 2.8 ms stiga | 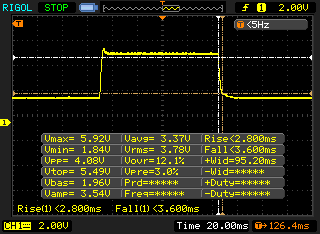 |
| ↘ 3.6 ms hösten | ||
| Skärmen visar väldigt snabba svarsfrekvenser i våra tester och borde vara mycket väl lämpad för fartfyllt spel. I jämförelse sträcker sig alla testade enheter från 0.165 (minst) till 636 (maximalt) ms. » 19 % av alla enheter är bättre. Det betyder att den uppmätta svarstiden är bättre än genomsnittet av alla testade enheter (31 ms). | ||
Skärmflimmer / PWM (Puls-Width Modulation)
| Skärmflimmer / PWM upptäcktes inte | 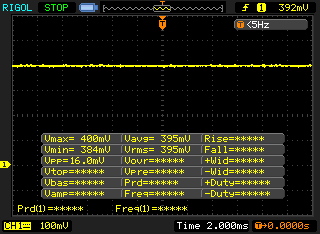 | ||
Som jämförelse: 52 % av alla testade enheter använder inte PWM för att dämpa skärmen. Om PWM upptäcktes mättes ett medelvärde av 7763 (minst: 5 - maximum: 343500) Hz. | |||
| Cinebench R20 | |
| CPU (Single Core) | |
| Genomsnitt av klass Gaming (442 - 895, n=109, senaste 2 åren) | |
| MSI GE76 Raider 11UH-472US (Vorserie) | |
| MSI GE76 Raider 11UH-472US (Serienmodell) | |
| Genomsnitt Intel Core i9-11980HK (572 - 622, n=7) | |
| Gigabyte Aero 17 HDR YD | |
| Alienware m17 R4 | |
| MSI GE76 Raider 10UH | |
| CPU (Multi Core) | |
| Genomsnitt av klass Gaming (4029 - 16108, n=109, senaste 2 åren) | |
| Gigabyte Aero 17 HDR YD | |
| MSI GE76 Raider 11UH-472US (Serienmodell) | |
| MSI GE76 Raider 11UH-472US (Vorserie) | |
| Genomsnitt Intel Core i9-11980HK (3779 - 5256, n=8) | |
| Alienware m17 R4 | |
| MSI GE76 Raider 10UH | |
| Cinebench R15 | |
| CPU Single 64Bit | |
| Genomsnitt av klass Gaming (188.8 - 343, n=109, senaste 2 åren) | |
| Genomsnitt Intel Core i9-11980HK (224 - 244, n=6) | |
| Gigabyte Aero 17 HDR YD | |
| MSI GE76 Raider 11UH-472US (Vorserie) | |
| MSI GE76 Raider 11UH-472US (Serienmodell) | |
| Alienware m17 R4 | |
| MSI GE76 Raider 10UH | |
| CPU Multi 64Bit | |
| Genomsnitt av klass Gaming (1578 - 6271, n=108, senaste 2 åren) | |
| MSI GE76 Raider 11UH-472US (Serienmodell) | |
| MSI GE76 Raider 11UH-472US (Vorserie) | |
| Gigabyte Aero 17 HDR YD | |
| Genomsnitt Intel Core i9-11980HK (1696 - 2287, n=7) | |
| Alienware m17 R4 | |
| MSI GE76 Raider 10UH | |
| Blender - v2.79 BMW27 CPU | |
| MSI GE76 Raider 11UH-472US (Vorserie) | |
| MSI GE76 Raider 11UH-472US (Serienmodell) | |
| MSI GE76 Raider 10UH | |
| Genomsnitt Intel Core i9-11980HK (231 - 284, n=4) | |
| Alienware m17 R4 | |
| Gigabyte Aero 17 HDR YD | |
| Genomsnitt av klass Gaming (80 - 330, n=107, senaste 2 åren) | |
| HWBOT x265 Benchmark v2.2 - 4k Preset | |
| Genomsnitt av klass Gaming (11.5 - 44.3, n=108, senaste 2 åren) | |
| MSI GE76 Raider 11UH-472US (Serienmodell) | |
| MSI GE76 Raider 11UH-472US (Vorserie) | |
| Gigabyte Aero 17 HDR YD | |
| Genomsnitt Intel Core i9-11980HK (13.1 - 16.3, n=5) | |
| Alienware m17 R4 | |
| MSI GE76 Raider 10UH | |
| LibreOffice - 20 Documents To PDF | |
| Alienware m17 R4 | |
| Genomsnitt av klass Gaming (19 - 88.8, n=108, senaste 2 åren) | |
| MSI GE76 Raider 10UH | |
| Genomsnitt Intel Core i9-11980HK (40.6 - 47.7, n=5) | |
| Gigabyte Aero 17 HDR YD | |
| MSI GE76 Raider 11UH-472US (Serienmodell) | |
| MSI GE76 Raider 11UH-472US (Vorserie) | |
| R Benchmark 2.5 - Overall mean | |
| MSI GE76 Raider 10UH | |
| Alienware m17 R4 | |
| MSI GE76 Raider 11UH-472US (Serienmodell) | |
| MSI GE76 Raider 11UH-472US (Vorserie) | |
| Gigabyte Aero 17 HDR YD | |
| Genomsnitt Intel Core i9-11980HK (0.545 - 0.565, n=5) | |
| Genomsnitt av klass Gaming (0.3439 - 0.759, n=109, senaste 2 åren) | |
* ... mindre är bättre
| PCMark 10 / Score | |
| Genomsnitt av klass Gaming (5828 - 11574, n=95, senaste 2 åren) | |
| Gigabyte Aero 17 HDR YD | |
| MSI GE76 Raider 11UH-472US (Serienmodell) | |
| MSI GE76 Raider 11UH-472US | |
| Genomsnitt Intel Core i9-11980HK, NVIDIA GeForce RTX 3080 Laptop GPU (6937 - 7088, n=3) | |
| Alienware m17 R4 | |
| MSI GE76 Raider 10UH | |
| PCMark 10 / Essentials | |
| Genomsnitt av klass Gaming (8810 - 12600, n=99, senaste 2 åren) | |
| MSI GE76 Raider 11UH-472US | |
| MSI GE76 Raider 11UH-472US (Serienmodell) | |
| Gigabyte Aero 17 HDR YD | |
| Genomsnitt Intel Core i9-11980HK, NVIDIA GeForce RTX 3080 Laptop GPU (9665 - 10291, n=3) | |
| MSI GE76 Raider 10UH | |
| Alienware m17 R4 | |
| PCMark 10 / Productivity | |
| Genomsnitt av klass Gaming (6845 - 21327, n=97, senaste 2 åren) | |
| MSI GE76 Raider 11UH-472US (Serienmodell) | |
| MSI GE76 Raider 11UH-472US | |
| Gigabyte Aero 17 HDR YD | |
| Genomsnitt Intel Core i9-11980HK, NVIDIA GeForce RTX 3080 Laptop GPU (8934 - 9107, n=3) | |
| Alienware m17 R4 | |
| MSI GE76 Raider 10UH | |
| PCMark 10 / Digital Content Creation | |
| Genomsnitt av klass Gaming (7602 - 19657, n=97, senaste 2 åren) | |
| MSI GE76 Raider 11UH-472US (Serienmodell) | |
| MSI GE76 Raider 11UH-472US | |
| Gigabyte Aero 17 HDR YD | |
| Genomsnitt Intel Core i9-11980HK, NVIDIA GeForce RTX 3080 Laptop GPU (9855 - 10823, n=3) | |
| MSI GE76 Raider 10UH | |
| Alienware m17 R4 | |
| PCMark 10 Score | 7054 poäng | |
Hjälp | ||
| DPC Latencies / LatencyMon - interrupt to process latency (max), Web, Youtube, Prime95 | |
| MSI GE76 Raider 10UH | |
| MSI GE76 Raider 11UH-472US | |
| Gigabyte Aero 17 HDR YD | |
| Alienware m17 R4 | |
* ... mindre är bättre
| MSI GE76 Raider 11UH-472US Samsung PM9A1 MZVL21T0HCLR | MSI GE76 Raider 10UH WDC PC SN730 SDBPNTY-1T00 | Gigabyte Aero 17 HDR YD Samsung PM9A1 MZVL2512HCJQ | Alienware m17 R4 2x Micron 2300 512 GB (RAID 0) | Genomsnitt Samsung PM9A1 MZVL21T0HCLR | |
|---|---|---|---|---|---|
| CrystalDiskMark 5.2 / 6 | -42% | -2% | -42% | -14% | |
| Write 4K (MB/s) | 238.8 | 157.1 -34% | 230.4 -4% | 93.1 -61% | 194.2 ? -19% |
| Read 4K (MB/s) | 88 | 46.3 -47% | 91.6 4% | 46.79 -47% | 80.6 ? -8% |
| Write Seq (MB/s) | 4306 | 2396 -44% | 4216 -2% | 2853 -34% | 3638 ? -16% |
| Read Seq (MB/s) | 4549 | 2245 -51% | 4543 0% | 2556 -44% | 3838 ? -16% |
| Write 4K Q32T1 (MB/s) | 699 | 436.1 -38% | 667 -5% | 475 -32% | 500 ? -28% |
| Read 4K Q32T1 (MB/s) | 752 | 524 -30% | 728 -3% | 529 -30% | 605 ? -20% |
| Write Seq Q32T1 (MB/s) | 5119 | 3086 -40% | 5043 -1% | 3331 -35% | 4898 ? -4% |
| Read Seq Q32T1 (MB/s) | 7086 | 3363 -53% | 6821 -4% | 3319 -53% | 6775 ? -4% |
| AS SSD | -70% | 0% | -68% | -7% | |
| Seq Read (MB/s) | 5435 | 2967 -45% | 5438 0% | 2733 -50% | 4901 ? -10% |
| Seq Write (MB/s) | 3954 | 2604 -34% | 3904 -1% | 2822 -29% | 3334 ? -16% |
| 4K Read (MB/s) | 52.9 | 42.97 -19% | 56.2 6% | 45.04 -15% | 72.4 ? 37% |
| 4K Write (MB/s) | 158.8 | 107.8 -32% | 165.8 4% | 88.4 -44% | 186 ? 17% |
| 4K-64 Read (MB/s) | 2551 | 1684 -34% | 2489 -2% | 1388 -46% | 1871 ? -27% |
| 4K-64 Write (MB/s) | 3155 | 2164 -31% | 3480 10% | 1227 -61% | 2764 ? -12% |
| Access Time Read * (ms) | 0.044 | 0.116 -164% | 0.054 -23% | 0.079 -80% | 0.0377 ? 14% |
| Access Time Write * (ms) | 0.026 | 0.106 -308% | 0.026 -0% | 0.095 -265% | 0.03431 ? -32% |
| Score Read (Points) | 3148 | 2023 -36% | 3089 -2% | 1706 -46% | 2433 ? -23% |
| Score Write (Points) | 3709 | 2532 -32% | 4036 9% | 1598 -57% | 3284 ? -11% |
| Score Total (Points) | 8383 | 5571 -34% | 8620 3% | 4184 -50% | 6892 ? -18% |
| Totalt genomsnitt (program/inställningar) | -56% /
-58% | -1% /
-1% | -55% /
-57% | -11% /
-10% |
* ... mindre är bättre

DiskSpd Read Loop, Queue Depth 8
| 3DMark 11 Performance | 30194 poäng | |
| 3DMark Cloud Gate Standard Score | 47525 poäng | |
| 3DMark Fire Strike Score | 21608 poäng | |
Hjälp | ||
| The Witcher 3 - 1920x1080 Ultra Graphics & Postprocessing (HBAO+) | |
| Genomsnitt av klass Gaming (95 - 240, n=7, senaste 2 åren) | |
| MSI GE76 Raider 10UH | |
| Alienware m17 R4 | |
| MSI GE76 Raider 11UH-472US | |
| Genomsnitt NVIDIA GeForce RTX 3080 Laptop GPU (85.1 - 123, n=40) | |
| Gigabyte Aero 17 HDR YD | |
| Cyberpunk 2077 1.0 - 1920x1080 Ultra Preset | |
| Alienware m17 R4 | |
| MSI GE76 Raider 11UH-472US | |
| Genomsnitt NVIDIA GeForce RTX 3080 Laptop GPU (52.9 - 84.3, n=9) | |
| Gigabyte Aero 17 HDR YD | |
| GTA V - 1920x1080 High/On (Advanced Graphics Off) AA:2xMSAA + FX AF:8x | |
| Genomsnitt av klass Gaming (110.7 - 189, n=68, senaste 2 åren) | |
| Gigabyte Aero 17 HDR YD | |
| MSI GE76 Raider 11UH-472US | |
| Genomsnitt NVIDIA GeForce RTX 3080 Laptop GPU (137 - 176, n=30) | |
| MSI GE76 Raider 10UH | |
| Alienware m17 R4 | |
| Final Fantasy XV Benchmark - 1920x1080 High Quality | |
| Genomsnitt av klass Gaming (41 - 215, n=98, senaste 2 åren) | |
| MSI GE76 Raider 10UH | |
| MSI GE76 Raider 11UH-472US | |
| Genomsnitt NVIDIA GeForce RTX 3080 Laptop GPU (55.5 - 115, n=34) | |
| Gigabyte Aero 17 HDR YD | |
| Alienware m17 R4 | |
| Dota 2 Reborn - 1920x1080 ultra (3/3) best looking | |
| Genomsnitt av klass Gaming (84.8 - 248, n=110, senaste 2 åren) | |
| Gigabyte Aero 17 HDR YD | |
| MSI GE76 Raider 11UH-472US | |
| Alienware m17 R4 | |
| Genomsnitt NVIDIA GeForce RTX 3080 Laptop GPU (98 - 156, n=45) | |
| MSI GE76 Raider 10UH | |
The Witcher 3 FPS-diagram
| låg | med. | hög | ultra | QHD | 4K | |
|---|---|---|---|---|---|---|
| GTA V (2015) | 182 | 177 | 164 | |||
| The Witcher 3 (2015) | 112 | |||||
| Dota 2 Reborn (2015) | 173 | 159 | 148 | 138 | ||
| Final Fantasy XV Benchmark (2018) | 183 | 136 | 108 | |||
| X-Plane 11.11 (2018) | 122 | 104 | 84.2 | |||
| Far Cry 5 (2018) | 136 | 115 | 113 | 110 | ||
| Strange Brigade (2018) | 446 | 265 | 219 | 196 | ||
| Cyberpunk 2077 1.0 (2020) | 105 | 99.2 | 90.6 | 80.1 | ||
| Diablo 4 (2023) | 184.6 | 124 | 65.5 |
Ljudnivå
| Låg belastning |
| 25 / 27 / 35 dB(A) |
| Hög belastning |
| 54 / 55 dB(A) |
 | ||
30 dB tyst 40 dB(A) hörbar 50 dB(A) högt ljud |
||
min: | ||
(-) Den maximala temperaturen på ovansidan är 46 °C / 115 F, jämfört med genomsnittet av 40.4 °C / 105 F , allt från 21.2 till 68.8 °C för klassen Gaming.
(-) Botten värms upp till maximalt 48 °C / 118 F, jämfört med genomsnittet av 43.2 °C / 110 F
(+) Vid tomgångsbruk är medeltemperaturen för ovansidan 29.3 °C / 85 F, jämfört med enhetsgenomsnittet på 33.9 °C / ### class_avg_f### F.
(-) När du spelar The Witcher 3 är medeltemperaturen för ovansidan 40.7 °C / 105 F, jämfört med enhetsgenomsnittet på 33.9 °C / ## #class_avg_f### F.
(+) Handledsstöden och pekplattan når maximal hudtemperatur (34 °C / 93.2 F) och är därför inte varma.
(-) Medeltemperaturen för handledsstödsområdet på liknande enheter var 28.8 °C / 83.8 F (-5.2 °C / -9.4 F).
MSI GE76 Raider 11UH-472US ljudanalys
(+) | högtalare kan spela relativt högt (87 dB)
Bas 100 - 315 Hz
(±) | reducerad bas - i genomsnitt 14.8% lägre än medianen
(±) | linjäriteten för basen är genomsnittlig (10.5% delta till föregående frekvens)
Mellan 400 - 2000 Hz
(+) | balanserad mellan - endast 4.1% från medianen
(+) | mids är linjära (3.3% delta till föregående frekvens)
Högsta 2 - 16 kHz
(+) | balanserade toppar - endast 3.2% från medianen
(+) | toppar är linjära (4.3% delta till föregående frekvens)
Totalt 100 - 16 000 Hz
(+) | det totala ljudet är linjärt (12.6% skillnad mot median)
Jämfört med samma klass
» 16% av alla testade enheter i den här klassen var bättre, 4% liknande, 81% sämre
» Den bästa hade ett delta på 6%, genomsnittet var 18%, sämst var 132%
Jämfört med alla testade enheter
» 11% av alla testade enheter var bättre, 3% liknande, 86% sämre
» Den bästa hade ett delta på 4%, genomsnittet var 23%, sämst var 134%
Gigabyte Aero 17 HDR YD ljudanalys
(+) | högtalare kan spela relativt högt (88 dB)
Bas 100 - 315 Hz
(-) | nästan ingen bas - i genomsnitt 33.9% lägre än medianen
(±) | linjäriteten för basen är genomsnittlig (9.6% delta till föregående frekvens)
Mellan 400 - 2000 Hz
(+) | balanserad mellan - endast 2.9% från medianen
(+) | mids är linjära (6.5% delta till föregående frekvens)
Högsta 2 - 16 kHz
(±) | högre toppar - i genomsnitt 5.1% högre än medianen
(+) | toppar är linjära (4.7% delta till föregående frekvens)
Totalt 100 - 16 000 Hz
(±) | linjäriteten för det totala ljudet är genomsnittlig (19.8% skillnad mot median)
Jämfört med samma klass
» 70% av alla testade enheter i den här klassen var bättre, 6% liknande, 24% sämre
» Den bästa hade ett delta på 6%, genomsnittet var 18%, sämst var 132%
Jämfört med alla testade enheter
» 50% av alla testade enheter var bättre, 7% liknande, 42% sämre
» Den bästa hade ett delta på 4%, genomsnittet var 23%, sämst var 134%
| Av/Standby | |
| Låg belastning | |
| Hög belastning |
|
Förklaring:
min: | |
| MSI GE76 Raider 11UH-472US i9-11980HK, GeForce RTX 3080 Laptop GPU | MSI GE76 Raider 10UH i7-10870H, GeForce RTX 3080 Laptop GPU | Gigabyte Aero 17 HDR YD i9-11980HK, GeForce RTX 3080 Laptop GPU | Alienware m17 R4 i9-10980HK, GeForce RTX 3080 Laptop GPU | Genomsnitt av klass Gaming | |
|---|---|---|---|---|---|
| Power Consumption | -29% | -44% | -116% | -8% | |
| Idle Minimum * (Watt) | 10 | 15.5 -55% | 25 -150% | 42 -320% | 13 ? -30% |
| Idle Average * (Watt) | 16 | 31.3 -96% | 28 -75% | 48 -200% | 18.7 ? -17% |
| Idle Maximum * (Watt) | 26 | 31.7 -22% | 40 -54% | 58 -123% | 24.3 ? 7% |
| Load Average * (Watt) | 103 | 93.6 9% | 114 -11% | 124 -20% | 108.2 ? -5% |
| Witcher 3 ultra * (Watt) | 204 | 233 -14% | 176 14% | 219 -7% | |
| Load Maximum * (Watt) | 266 | 260.3 2% | 236 11% | 337 -27% | 254 ? 5% |
* ... mindre är bättre
Energiförbrukning: The Witcher 3 - Stress-test
| MSI GE76 Raider 11UH-472US i9-11980HK, GeForce RTX 3080 Laptop GPU, 99.9 Wh | MSI GE76 Raider 10UH i7-10870H, GeForce RTX 3080 Laptop GPU, 99.9 Wh | Gigabyte Aero 17 HDR YD i9-11980HK, GeForce RTX 3080 Laptop GPU, 99 Wh | Alienware m17 R4 i9-10980HK, GeForce RTX 3080 Laptop GPU, 86 Wh | Genomsnitt av klass Gaming | |
|---|---|---|---|---|---|
| Batteridrifttid | 11% | -9% | -38% | 13% | |
| Reader / Idle (h) | 7.8 | 8.2 5% | 8.71 ? 12% | ||
| WiFi v1.3 (h) | 5.5 | 6.3 15% | 5.6 2% | 2.4 -56% | 7 ? 27% |
| Load (h) | 1.5 | 1.7 13% | 1.2 -20% | 1.2 -20% | 1.51 ? 1% |
För
Emot
Omdöme - Toppmodern spellaptop
Läs den fullständiga versionen av den här recensionen på engelska här.
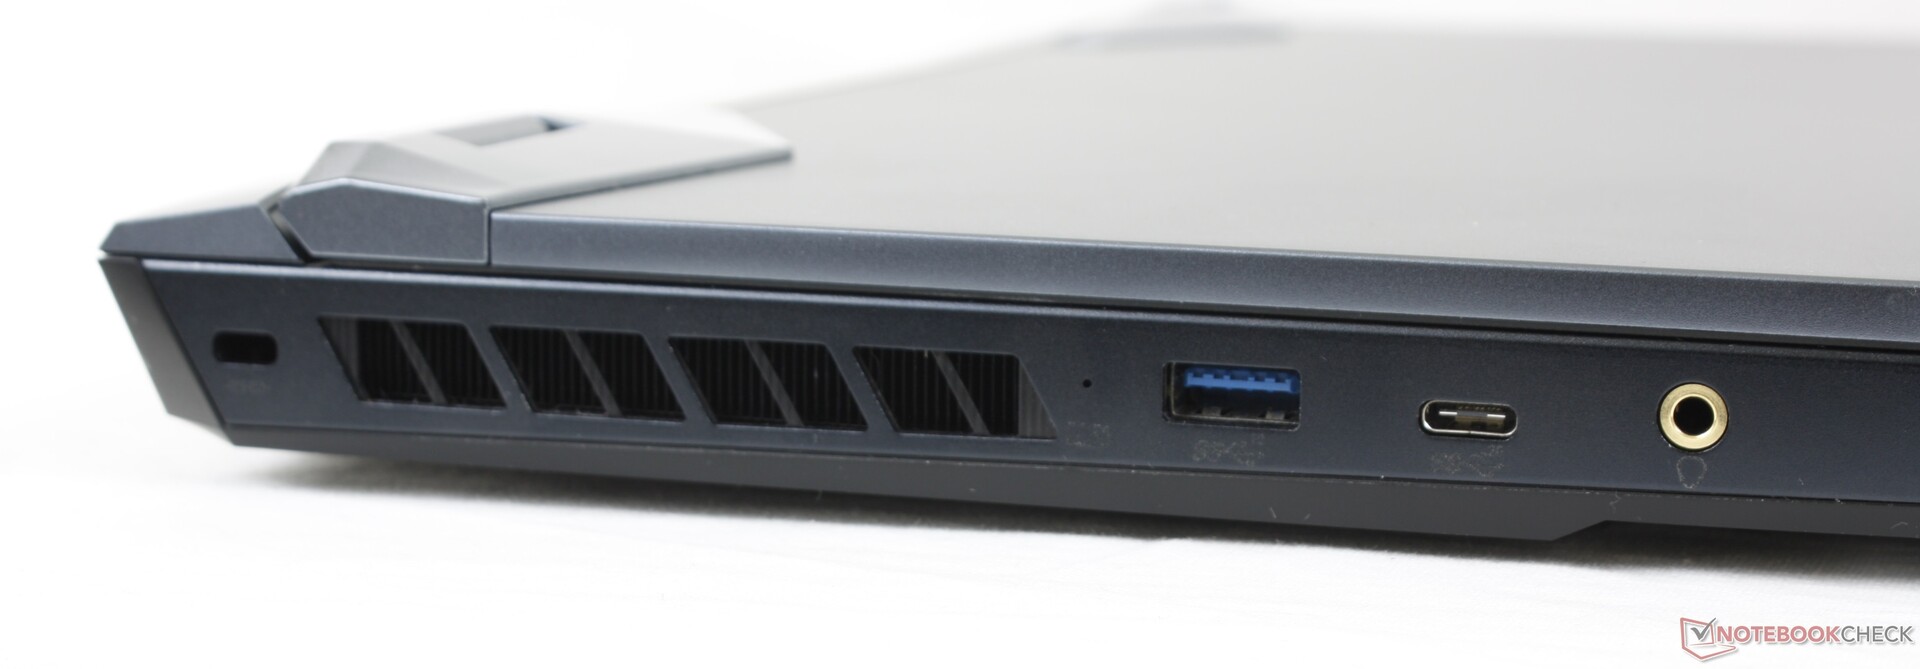
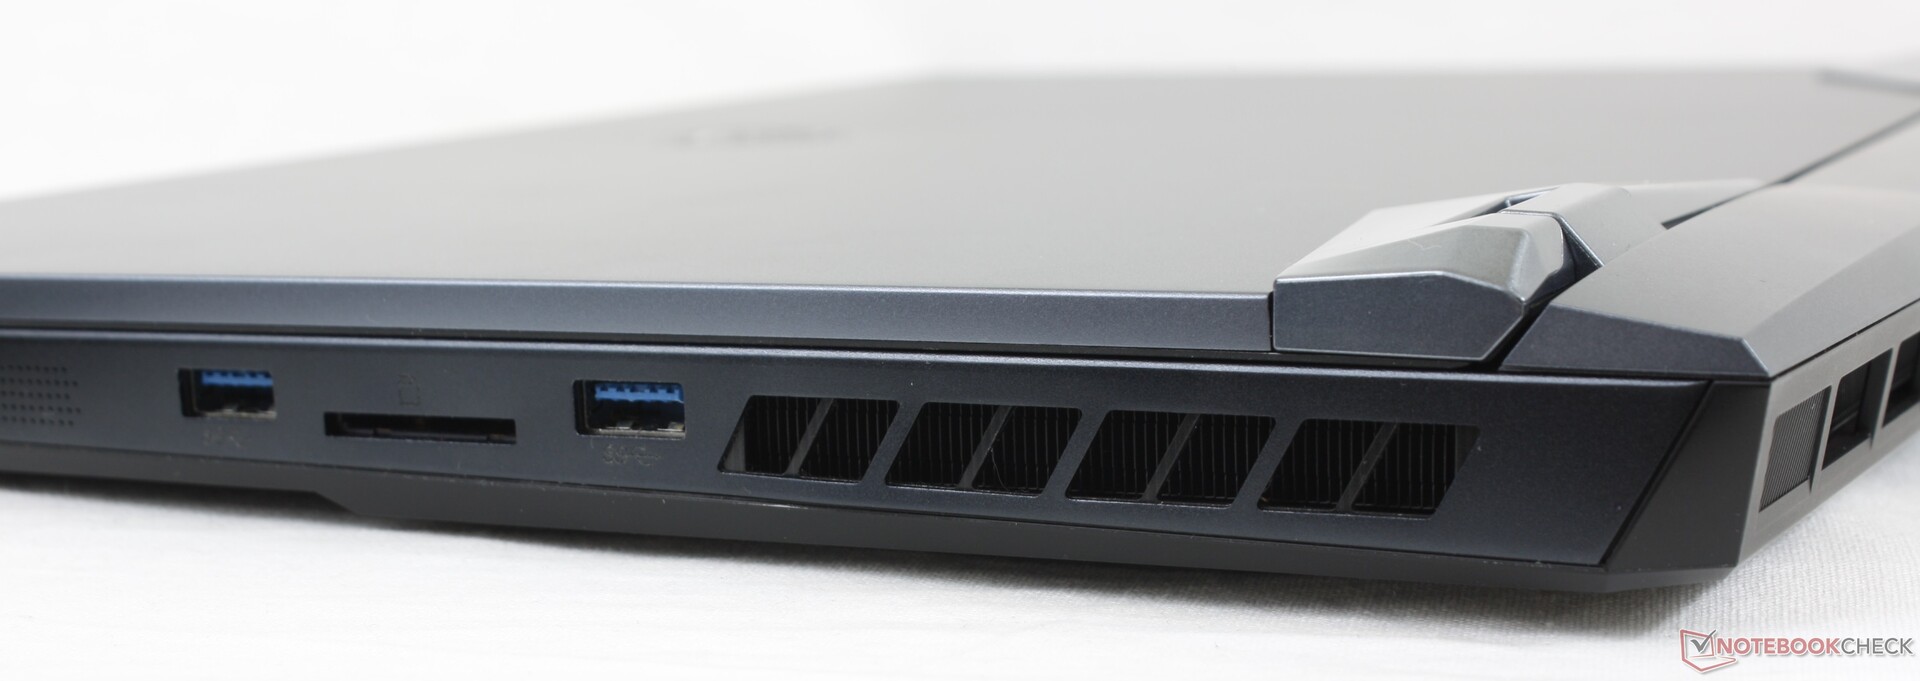
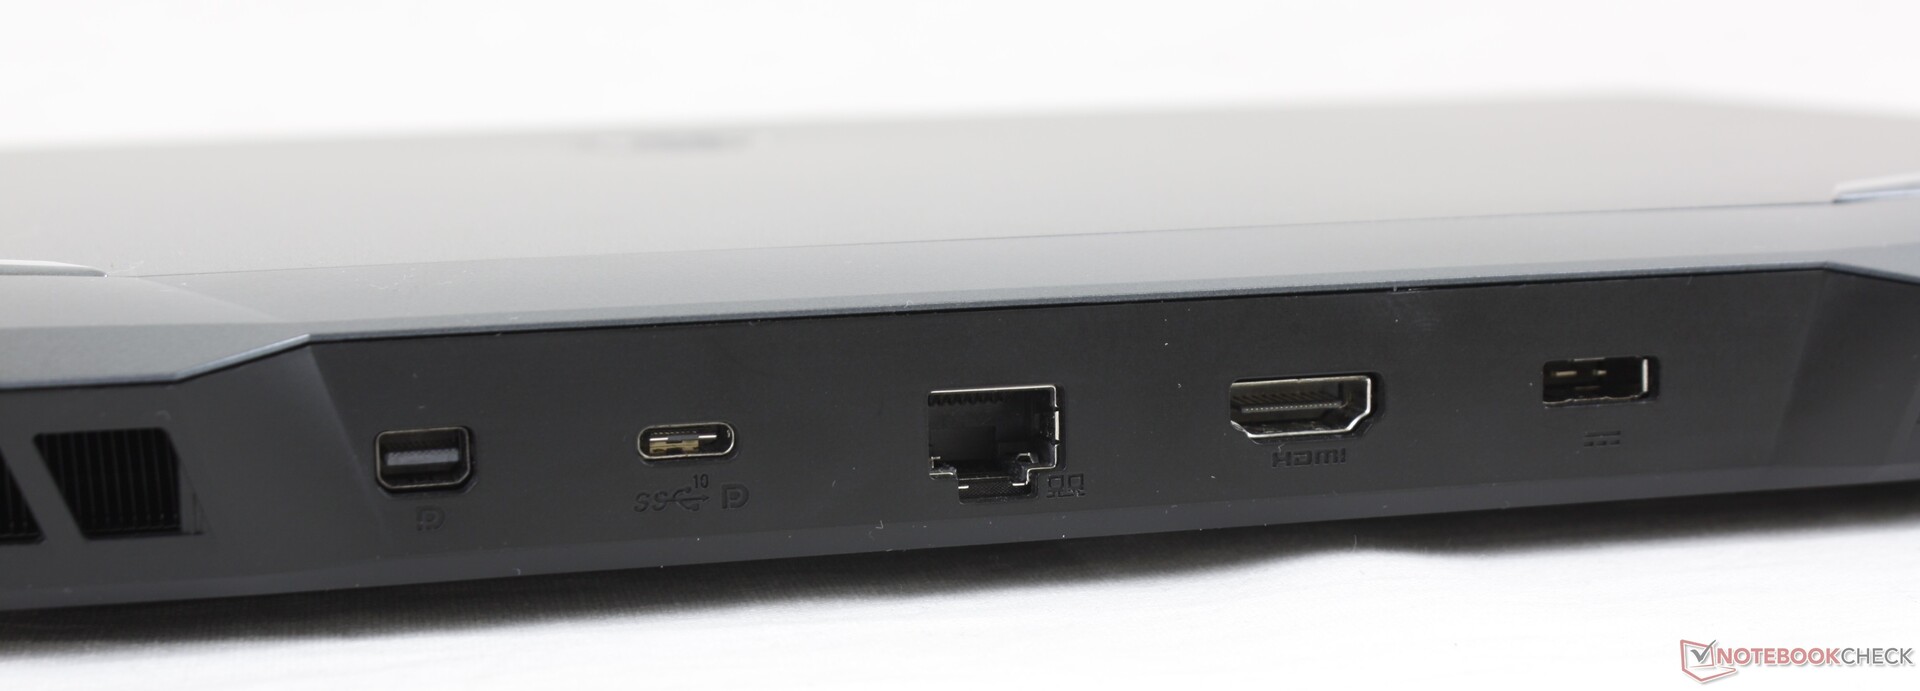
MSI GE76 Raider 11UH har nästan alla funktioner som föregångaren hade. Med en ny CPU och samma Nvidia GeForce RTX 3080 GPU är prestandan åtminstone jämförbar med GE76 Raider 10UH och passar således bra även till de allra senaste spelen. Portutbudet är också samma, men nu har en av USB-C portarna stöd för Thunderbolt 4. Tack vare bra servicemöjligheter går det att uppgradera både RAM och lagring i efterhand.
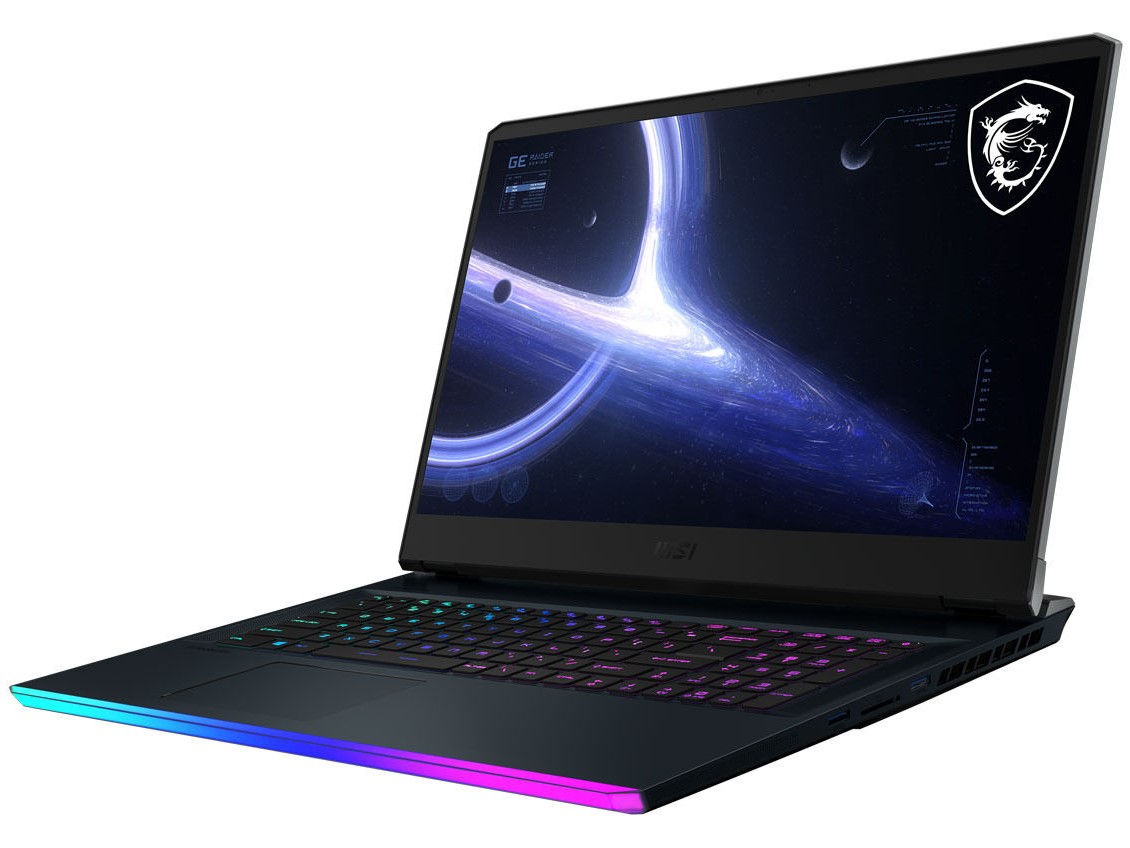
Med GE76 Raider UH11 levererar MSI en kraftfull laptop som passar perfekt till alla moderna spel.
Till skillnad från GE76 Raider 10UH har 11UH nu också mer högupplösta skärmar som tillval. Vår testkonfiguration kom med den snabbaste skärmen med bilduppdatering i 360 Hz, som bara finns i Full HD. Skärmens begränsade färgomfång förtjänar dock en del kritik, för det här kan vi inte acceptera med tanke på priset. Men totalt sett är GE76 en av de bästa bärbara speldatorerna med RTX 3080.
Faktum att webbkameran är på 2.1 MP och fångar upp bilder i aningen högre upplösning än vanligt märks tyvärr knappt vid vardagsbruk. Men MSI GE76 Raider UH11 skiljer sig också i fråga om storlek jämfört med modeller som Gigabyte Aero 17 HDR YD eller Alienware m17 R4. Om du letar efter ett tunt hölje är konkurrenterna ett bättre val.
Uppdatering: Produktionsmodellen har betydligt högre CPU-prestanda än föregångaren GE76 Raider 10UH.
MSI GE76 Raider 11UH-472US
- 08/16/2021 v7 (old)
Mike Wobker
Price comparison
