Test: Huawei Mate 20 X Smartphone (Sammanfattning)


| |||||||||||||||||||||||||
Distribution av ljusstyrkan: 96 %
Mitt på batteriet: 421 cd/m²
Kontrast: ∞:1 (Svärta: 0 cd/m²)
ΔE ColorChecker Calman: 1.1 | ∀{0.5-29.43 Ø4.71}
ΔE Greyscale Calman: 1.4 | ∀{0.09-98 Ø4.96}
97.4% sRGB (Calman 2D)
Gamma: 2.23
CCT: 6723 K
| Huawei Mate 20 X OLED, 2244x1080, 7.2" | Xiaomi Mi Max 3 IPS, 2160x1080, 6.9" | Huawei Mate 20 Pro OLED, 3120x1440, 6.3" | Google Pixel 3 XL AMOLED, 2960x1440, 6.3" | Apple iPhone Xs Max OLED, 2688x1242, 6.5" | Samsung Galaxy Note 9 Super AMOLED, 2960x1440, 6.4" | |
|---|---|---|---|---|---|---|
| Screen | -54% | -4% | -60% | 1% | -122% | |
| Brightness middle (cd/m²) | 421 | 508 21% | 576 37% | 410 -3% | 656 56% | 499 19% |
| Brightness (cd/m²) | 418 | 505 21% | 582 39% | 413 -1% | 659 58% | 506 21% |
| Brightness Distribution (%) | 96 | 91 -5% | 90 -6% | 97 1% | 88 -8% | 96 0% |
| Black Level * (cd/m²) | 0.28 | |||||
| Colorchecker dE 2000 * | 1.1 | 2.85 -159% | 1.3 -18% | 3.16 -187% | 1.7 -55% | 4.62 -320% |
| Colorchecker dE 2000 max. * | 2.2 | 6.21 -182% | 3.5 -59% | 5.5 -150% | 2.8 -27% | 10.91 -396% |
| Greyscale dE 2000 * | 1.4 | 1.7 -21% | 1.6 -14% | 1.7 -21% | 1.7 -21% | 2.2 -57% |
| Gamma | 2.23 99% | 2.226 99% | 2.18 101% | 2.219 99% | 1.998 110% | 2.103 105% |
| CCT | 6723 97% | 6860 95% | 6561 99% | 6653 98% | 6487 100% | 6115 106% |
| Contrast (:1) | 1814 |
* ... mindre är bättre
Skärmflimmer / PWM (Puls-Width Modulation)
| Skärmflimmer / PWM upptäckt | 242.7 Hz | ≤ 99 % ljusstyrka inställning | 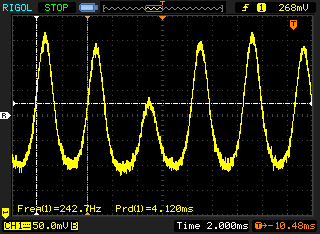 |
Displayens bakgrundsbelysning flimrar vid 242.7 Hz (i värsta fall, t.ex. med PWM) Flimrande upptäckt vid en ljusstyrkeinställning på 99 % och lägre. Det ska inte finnas något flimmer eller PWM över denna ljusstyrkeinställning. Frekvensen för 242.7 Hz är relativt låg, så känsliga användare kommer sannolikt att märka flimmer och uppleva ansträngda ögon vid den angivna ljusstyrkeinställningen och nedan. Som jämförelse: 52 % av alla testade enheter använder inte PWM för att dämpa skärmen. Om PWM upptäcktes mättes ett medelvärde av 7751 (minst: 5 - maximum: 343500) Hz. | |||
Visa svarstider
| ↔ Svarstid svart till vitt | ||
|---|---|---|
| 3.2 ms ... stiga ↗ och falla ↘ kombinerat | ↗ 1.2 ms stiga | 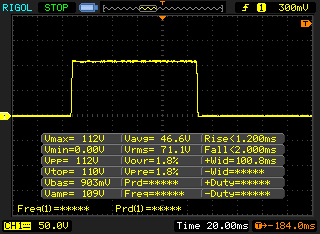 |
| ↘ 2 ms hösten | ||
| Skärmen visar väldigt snabba svarsfrekvenser i våra tester och borde vara mycket väl lämpad för fartfyllt spel. I jämförelse sträcker sig alla testade enheter från 0.1 (minst) till 240 (maximalt) ms. » 15 % av alla enheter är bättre. Det betyder att den uppmätta svarstiden är bättre än genomsnittet av alla testade enheter (19.8 ms). | ||
| ↔ Svarstid 50 % grått till 80 % grått | ||
| 3.6 ms ... stiga ↗ och falla ↘ kombinerat | ↗ 2 ms stiga | 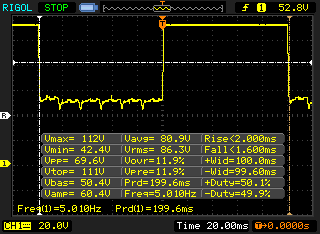 |
| ↘ 1.6 ms hösten | ||
| Skärmen visar väldigt snabba svarsfrekvenser i våra tester och borde vara mycket väl lämpad för fartfyllt spel. I jämförelse sträcker sig alla testade enheter från 0.165 (minst) till 636 (maximalt) ms. » 14 % av alla enheter är bättre. Det betyder att den uppmätta svarstiden är bättre än genomsnittet av alla testade enheter (31 ms). | ||
| AnTuTu v6 - Total Score (sortera efter värde) | |
| Huawei Mate 20 X | |
| Xiaomi Mi Max 3 | |
| Huawei Mate 20 Pro | |
| Google Pixel 3 XL | |
| Samsung Galaxy Note 9 | |
| Genomsnitt HiSilicon Kirin 980 (245662 - 254229, n=9) | |
| JetStream 1.1 - 1.1 Total | |
| Apple iPhone Xs Max (Safari 12) | |
| Huawei Mate 20 Pro (Chrome 69) | |
| Genomsnitt HiSilicon Kirin 980 (93.2 - 109.9, n=9) | |
| Huawei Mate 20 X (hrome 71) | |
| Google Pixel 3 XL (Chrome 70) | |
| Samsung Galaxy Note 9 (Chrome 68) | |
| Xiaomi Mi Max 3 (Chrome 69) | |
| Octane V2 - Total Score | |
| Genomsnitt av klass Smartphone (2800 - 126661, n=141, senaste 2 åren) | |
| Apple iPhone Xs Max (Safari 12) | |
| Huawei Mate 20 Pro (Chrome 69) | |
| Genomsnitt HiSilicon Kirin 980 (20618 - 23285, n=10) | |
| Huawei Mate 20 X (hrome 71) | |
| Google Pixel 3 XL (Chrome 70) | |
| Samsung Galaxy Note 9 (Chrome 68) | |
| Xiaomi Mi Max 3 (Chrome 69) | |
| Mozilla Kraken 1.1 - Total | |
| Xiaomi Mi Max 3 (Chrome 69) | |
| Google Pixel 3 XL (Chrome 70) | |
| Samsung Galaxy Note 9 (Chrome 68) | |
| Genomsnitt HiSilicon Kirin 980 (1948 - 3098, n=10) | |
| Huawei Mate 20 X (hrome 71) | |
| Huawei Mate 20 Pro (Chrome 69) | |
| Genomsnitt av klass Smartphone (257 - 28190, n=120, senaste 2 åren) | |
| Apple iPhone Xs Max (Safari 12) | |
| WebXPRT 3 - Overall | |
| Genomsnitt av klass Smartphone (104 - 380, n=12, senaste 2 åren) | |
| Apple iPhone Xs Max (Safari 12) | |
| Huawei Mate 20 Pro (Chrome 69) | |
| Genomsnitt HiSilicon Kirin 980 (86 - 124, n=10) | |
| Google Pixel 3 XL (Chrome 70) | |
| Huawei Mate 20 X (hrome 71) | |
| Samsung Galaxy Note 9 (Chrome 68) | |
| WebXPRT 2015 - Overall | |
| Apple iPhone Xs Max (Safari 12) | |
| Huawei Mate 20 Pro (Chrome 69) | |
| Google Pixel 3 XL (Chrome 70) | |
| Genomsnitt HiSilicon Kirin 980 (228 - 334, n=5) | |
| Huawei Mate 20 X (hrome 71) | |
| Samsung Galaxy Note 9 (Chrome 68) | |
| Xiaomi Mi Max 3 (Chrome 69) | |
* ... mindre är bättre
| Huawei Mate 20 X | Xiaomi Mi Max 3 | Huawei Mate 20 Pro | Google Pixel 3 XL | Samsung Galaxy Note 9 | Genomsnitt 128 GB UFS 2.1 Flash | Genomsnitt av klass Smartphone | |
|---|---|---|---|---|---|---|---|
| AndroBench 3-5 | -33% | -4% | -17% | -20% | -3% | 316% | |
| Sequential Read 256KB (MB/s) | 912 | 274.6 -70% | 853 -6% | 633 -31% | 805 -12% | 762 ? -16% | 2236 ? 145% |
| Sequential Write 256KB (MB/s) | 182.7 | 185.4 1% | 196.4 7% | 228.6 25% | 196 7% | 300 ? 64% | 1918 ? 950% |
| Random Read 4KB (MB/s) | 144.4 | 72.9 -50% | 157.4 9% | 120.8 -16% | 134 -7% | 154.7 ? 7% | 312 ? 116% |
| Random Write 4KB (MB/s) | 237.6 | 87.1 -63% | 157.8 -34% | 132.7 -44% | 21 -91% | 131.1 ? -45% | 359 ? 51% |
| Sequential Read 256KB SDCard (MB/s) | 83.1 ? | 83.8 ? 1% | 83.2 ? 0% | 77 ? -7% | 76 ? -9% | ||
| Sequential Write 256KB SDCard (MB/s) | 72 ? | 60.3 ? -16% | 72.4 ? 1% | 66.7 ? -7% | 59.6 ? -17% |
Arena of Valor
Asphalt 9: Legends
(+) Den maximala temperaturen på ovansidan är 33.6 °C / 92 F, jämfört med genomsnittet av 35.3 °C / 96 F , allt från 21.9 till 247 °C för klassen Smartphone.
(+) Botten värms upp till maximalt 34.7 °C / 94 F, jämfört med genomsnittet av 34 °C / 93 F
(+) Vid tomgångsbruk är medeltemperaturen för ovansidan 27.4 °C / 81 F, jämfört med enhetsgenomsnittet på 33 °C / ### class_avg_f### F.
Huawei Mate 20 X ljudanalys
(+) | högtalare kan spela relativt högt (84.1 dB)
Bas 100 - 315 Hz
(-) | nästan ingen bas - i genomsnitt 17.3% lägre än medianen
(±) | linjäriteten för basen är genomsnittlig (13.8% delta till föregående frekvens)
Mellan 400 - 2000 Hz
(±) | högre mellan - i genomsnitt 5.7% högre än median
(+) | mids är linjära (4.6% delta till föregående frekvens)
Högsta 2 - 16 kHz
(±) | högre toppar - i genomsnitt 7.1% högre än medianen
(+) | toppar är linjära (5.8% delta till föregående frekvens)
Totalt 100 - 16 000 Hz
(±) | linjäriteten för det totala ljudet är genomsnittlig (20.2% skillnad mot median)
Jämfört med samma klass
» 34% av alla testade enheter i den här klassen var bättre, 9% liknande, 57% sämre
» Den bästa hade ett delta på 11%, genomsnittet var 34%, sämst var 134%
Jämfört med alla testade enheter
» 53% av alla testade enheter var bättre, 8% liknande, 39% sämre
» Den bästa hade ett delta på 4%, genomsnittet var 23%, sämst var 134%
Samsung Galaxy Note 9 ljudanalys
(-) | inte särskilt höga högtalare (71.6 dB)
Bas 100 - 315 Hz
(-) | nästan ingen bas - i genomsnitt 15.6% lägre än medianen
(±) | linjäriteten för basen är genomsnittlig (10.1% delta till föregående frekvens)
Mellan 400 - 2000 Hz
(+) | balanserad mellan - endast 2.9% från medianen
(+) | mids är linjära (4.3% delta till föregående frekvens)
Högsta 2 - 16 kHz
(+) | balanserade toppar - endast 1.6% från medianen
(+) | toppar är linjära (5.7% delta till föregående frekvens)
Totalt 100 - 16 000 Hz
(±) | linjäriteten för det totala ljudet är genomsnittlig (16.2% skillnad mot median)
Jämfört med samma klass
» 6% av alla testade enheter i den här klassen var bättre, 5% liknande, 89% sämre
» Den bästa hade ett delta på 11%, genomsnittet var 34%, sämst var 134%
Jämfört med alla testade enheter
» 26% av alla testade enheter var bättre, 6% liknande, 68% sämre
» Den bästa hade ett delta på 4%, genomsnittet var 23%, sämst var 134%
| Av/Standby | |
| Låg belastning | |
| Hög belastning |
|
Förklaring:
min: | |
| Huawei Mate 20 X 5000 mAh | Xiaomi Mi Max 3 5500 mAh | Huawei Mate 20 Pro 4200 mAh | Google Pixel 3 XL 3430 mAh | Apple iPhone Xs Max 3174 mAh | Samsung Galaxy Note 9 4000 mAh | Genomsnitt HiSilicon Kirin 980 | Genomsnitt av klass Smartphone | |
|---|---|---|---|---|---|---|---|---|
| Power Consumption | 14% | -2% | 8% | 10% | -20% | -3% | -5% | |
| Idle Minimum * (Watt) | 0.79 | 0.7 11% | 0.95 -20% | 0.7 11% | 1 -27% | 0.9 -14% | 0.802 ? -2% | 0.885 ? -12% |
| Idle Average * (Watt) | 1.72 | 1.5 13% | 2.17 -26% | 1.4 19% | 1.4 19% | 1.9 -10% | 2.07 ? -20% | 1.483 ? 14% |
| Idle Maximum * (Watt) | 1.83 | 2.2 -20% | 2.25 -23% | 2 -9% | 1.7 7% | 3.7 -102% | 2.37 ? -30% | 1.671 ? 9% |
| Load Average * (Watt) | 5.53 | 3.8 31% | 4.47 19% | 4.8 13% | 4.6 17% | 5.3 4% | 4.87 ? 12% | 6.73 ? -22% |
| Load Maximum * (Watt) | 9.85 | 6.5 34% | 6.15 38% | 9.5 4% | 6.7 32% | 7.6 23% | 7.46 ? 24% | 11.2 ? -14% |
* ... mindre är bättre
| Huawei Mate 20 X 5000 mAh | Xiaomi Mi Max 3 5500 mAh | Huawei Mate 20 Pro 4200 mAh | Google Pixel 3 XL 3430 mAh | Apple iPhone Xs Max 3174 mAh | Samsung Galaxy Note 9 4000 mAh | |
|---|---|---|---|---|---|---|
| Batteridrifttid | 66% | -8% | -13% | -21% | -1% | |
| Reader / Idle (h) | 33.1 | 29.1 -12% | 28.8 -13% | 21.8 -34% | 28.1 -15% | |
| H.264 (h) | 16.4 | 14.2 -13% | 12.1 -26% | 13.4 -18% | 14.9 -9% | |
| WiFi v1.3 (h) | 13.1 | 21.8 66% | 12.8 -2% | 11.5 -12% | 12.4 -5% | 13.2 1% |
| Load (h) | 5 | 4.7 -6% | 5 0% | 3.7 -26% | 5.9 18% |
För
Emot
Läs den fullständiga versionen av den här recensionen på engelska här.
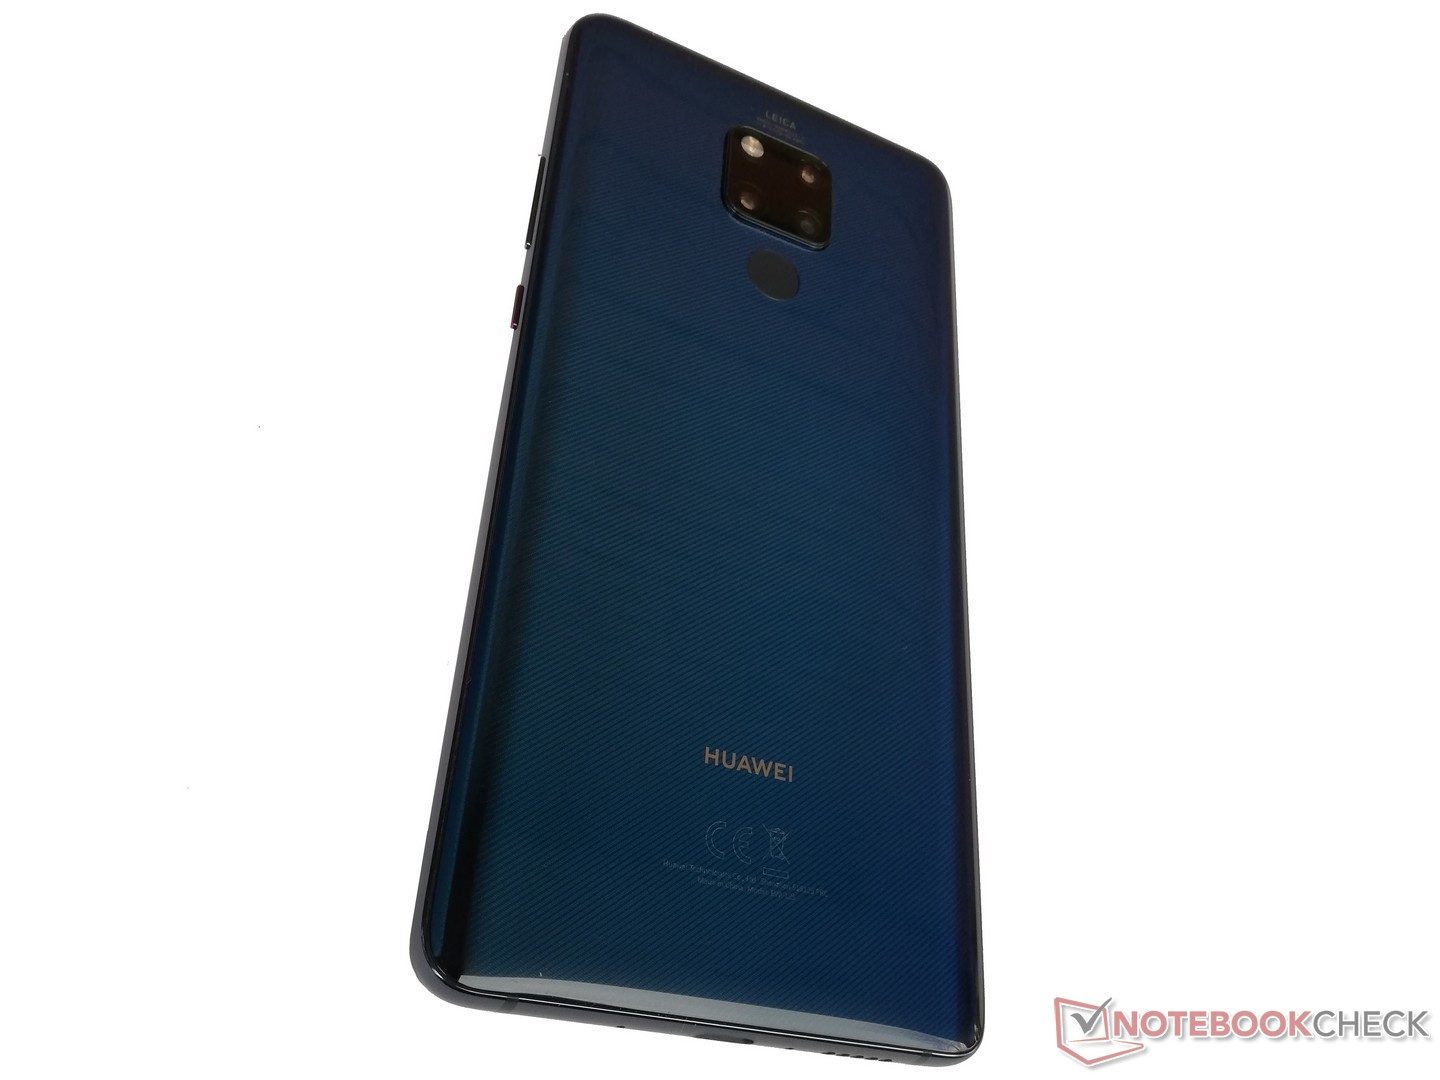
Huawei Mate 20 X har samma kvaliteter som de andra Mate 20-modellerna, vilka vi sen tidigare lärt oss att tycka om. Denna gigantiska smartphone har utmärkt system- och lagringsprestanda samtidigt som kamerorna är av högsta klass. Vidare imponerar OLED-skärmen, precis som LTE- och WiFi-hastigheterna.
Mate 20 X saknar funktionerna som fick Mate 20 Pro att stå ut, såsom 3D-ansiktsigenkänning, trådlös laddning och en snabb laddare på 40W, vilket gjorde oss besvikna. Den har dessutom en mindre ljusstark skärm, vilket är ytterligare en brist.
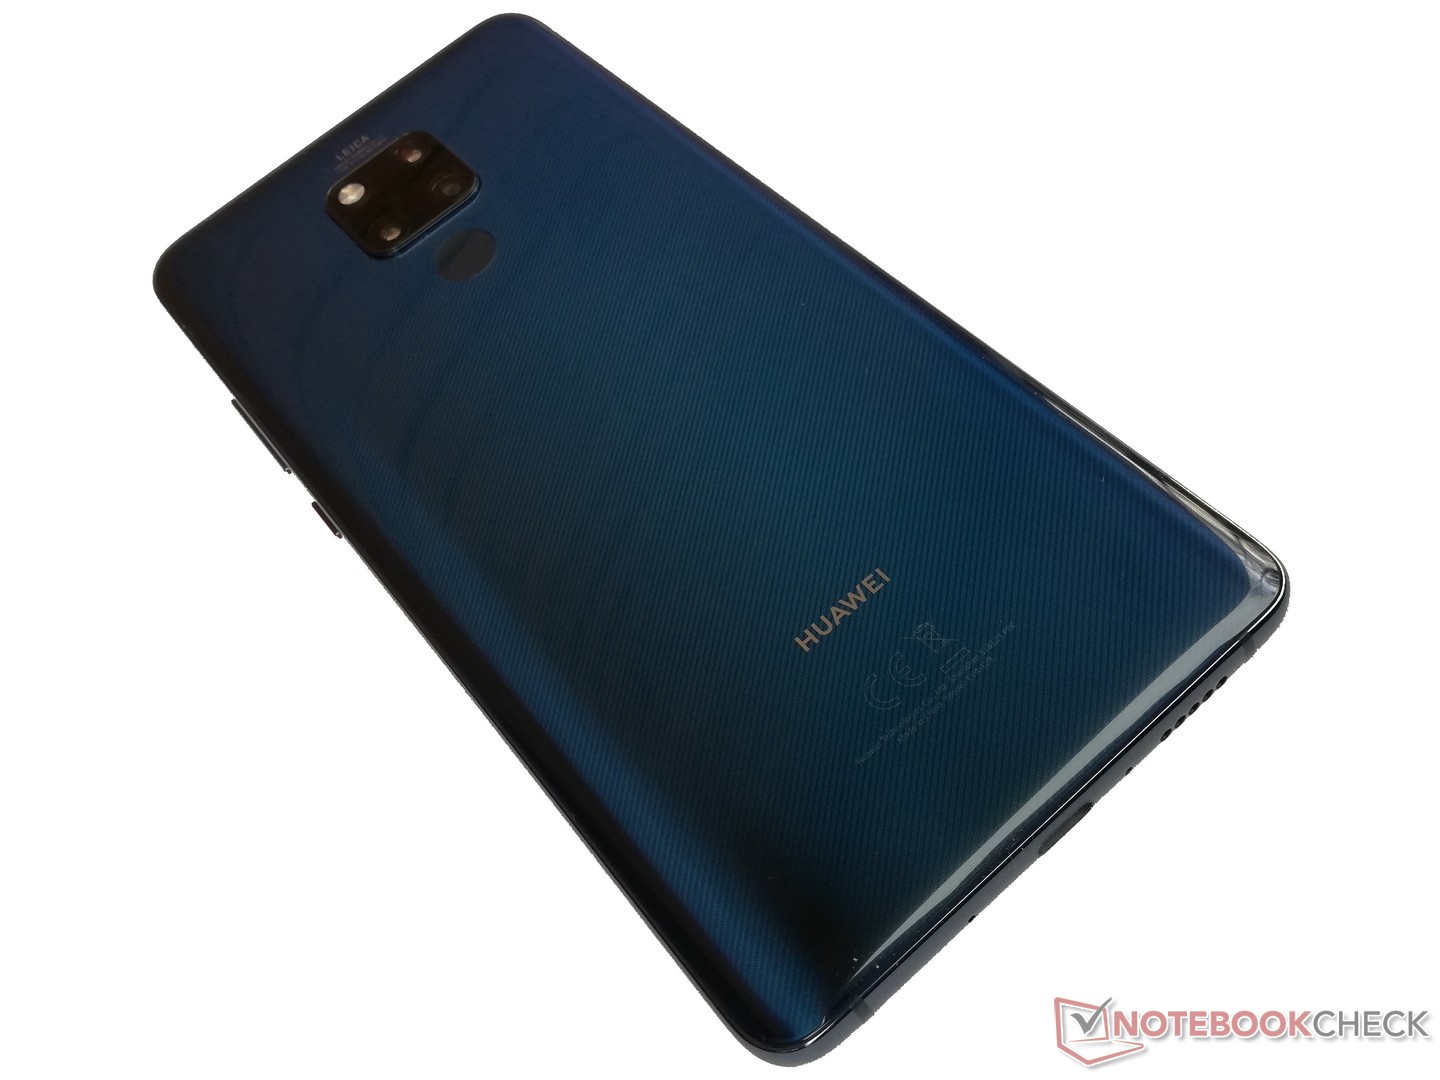
Huawei Mate 20 X är en utmärkt flaggskepps-phablet vars prestanda är unik för en enhet i den här storleken.
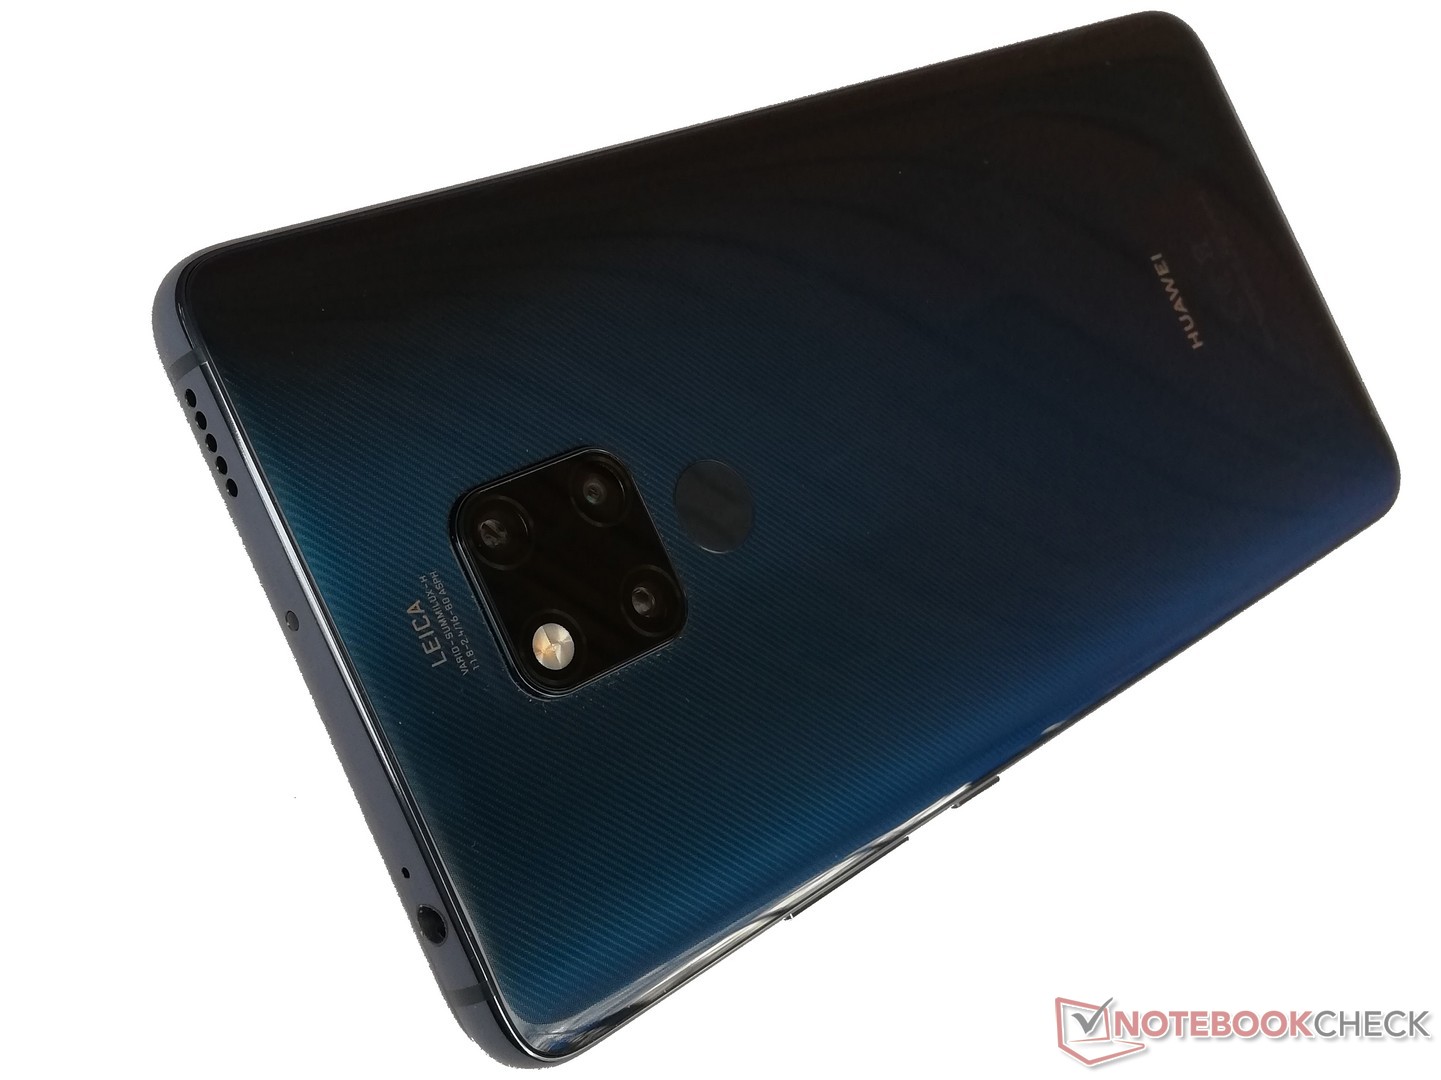
Det är också värt att komma ihåg att andra enheter har uppnått liknande resultat i våra tester och tog nästan lika bra bilder som trippelkamerauppsättningen gjorde. Men du kommer inte hitta ett bättre alternativ till Mate 20 X om du letar efter en flaggskepps-phablet.
Huawei Mate 20 X
- 09/03/2022 v7 (old)
Mike Wobker
Price comparison
