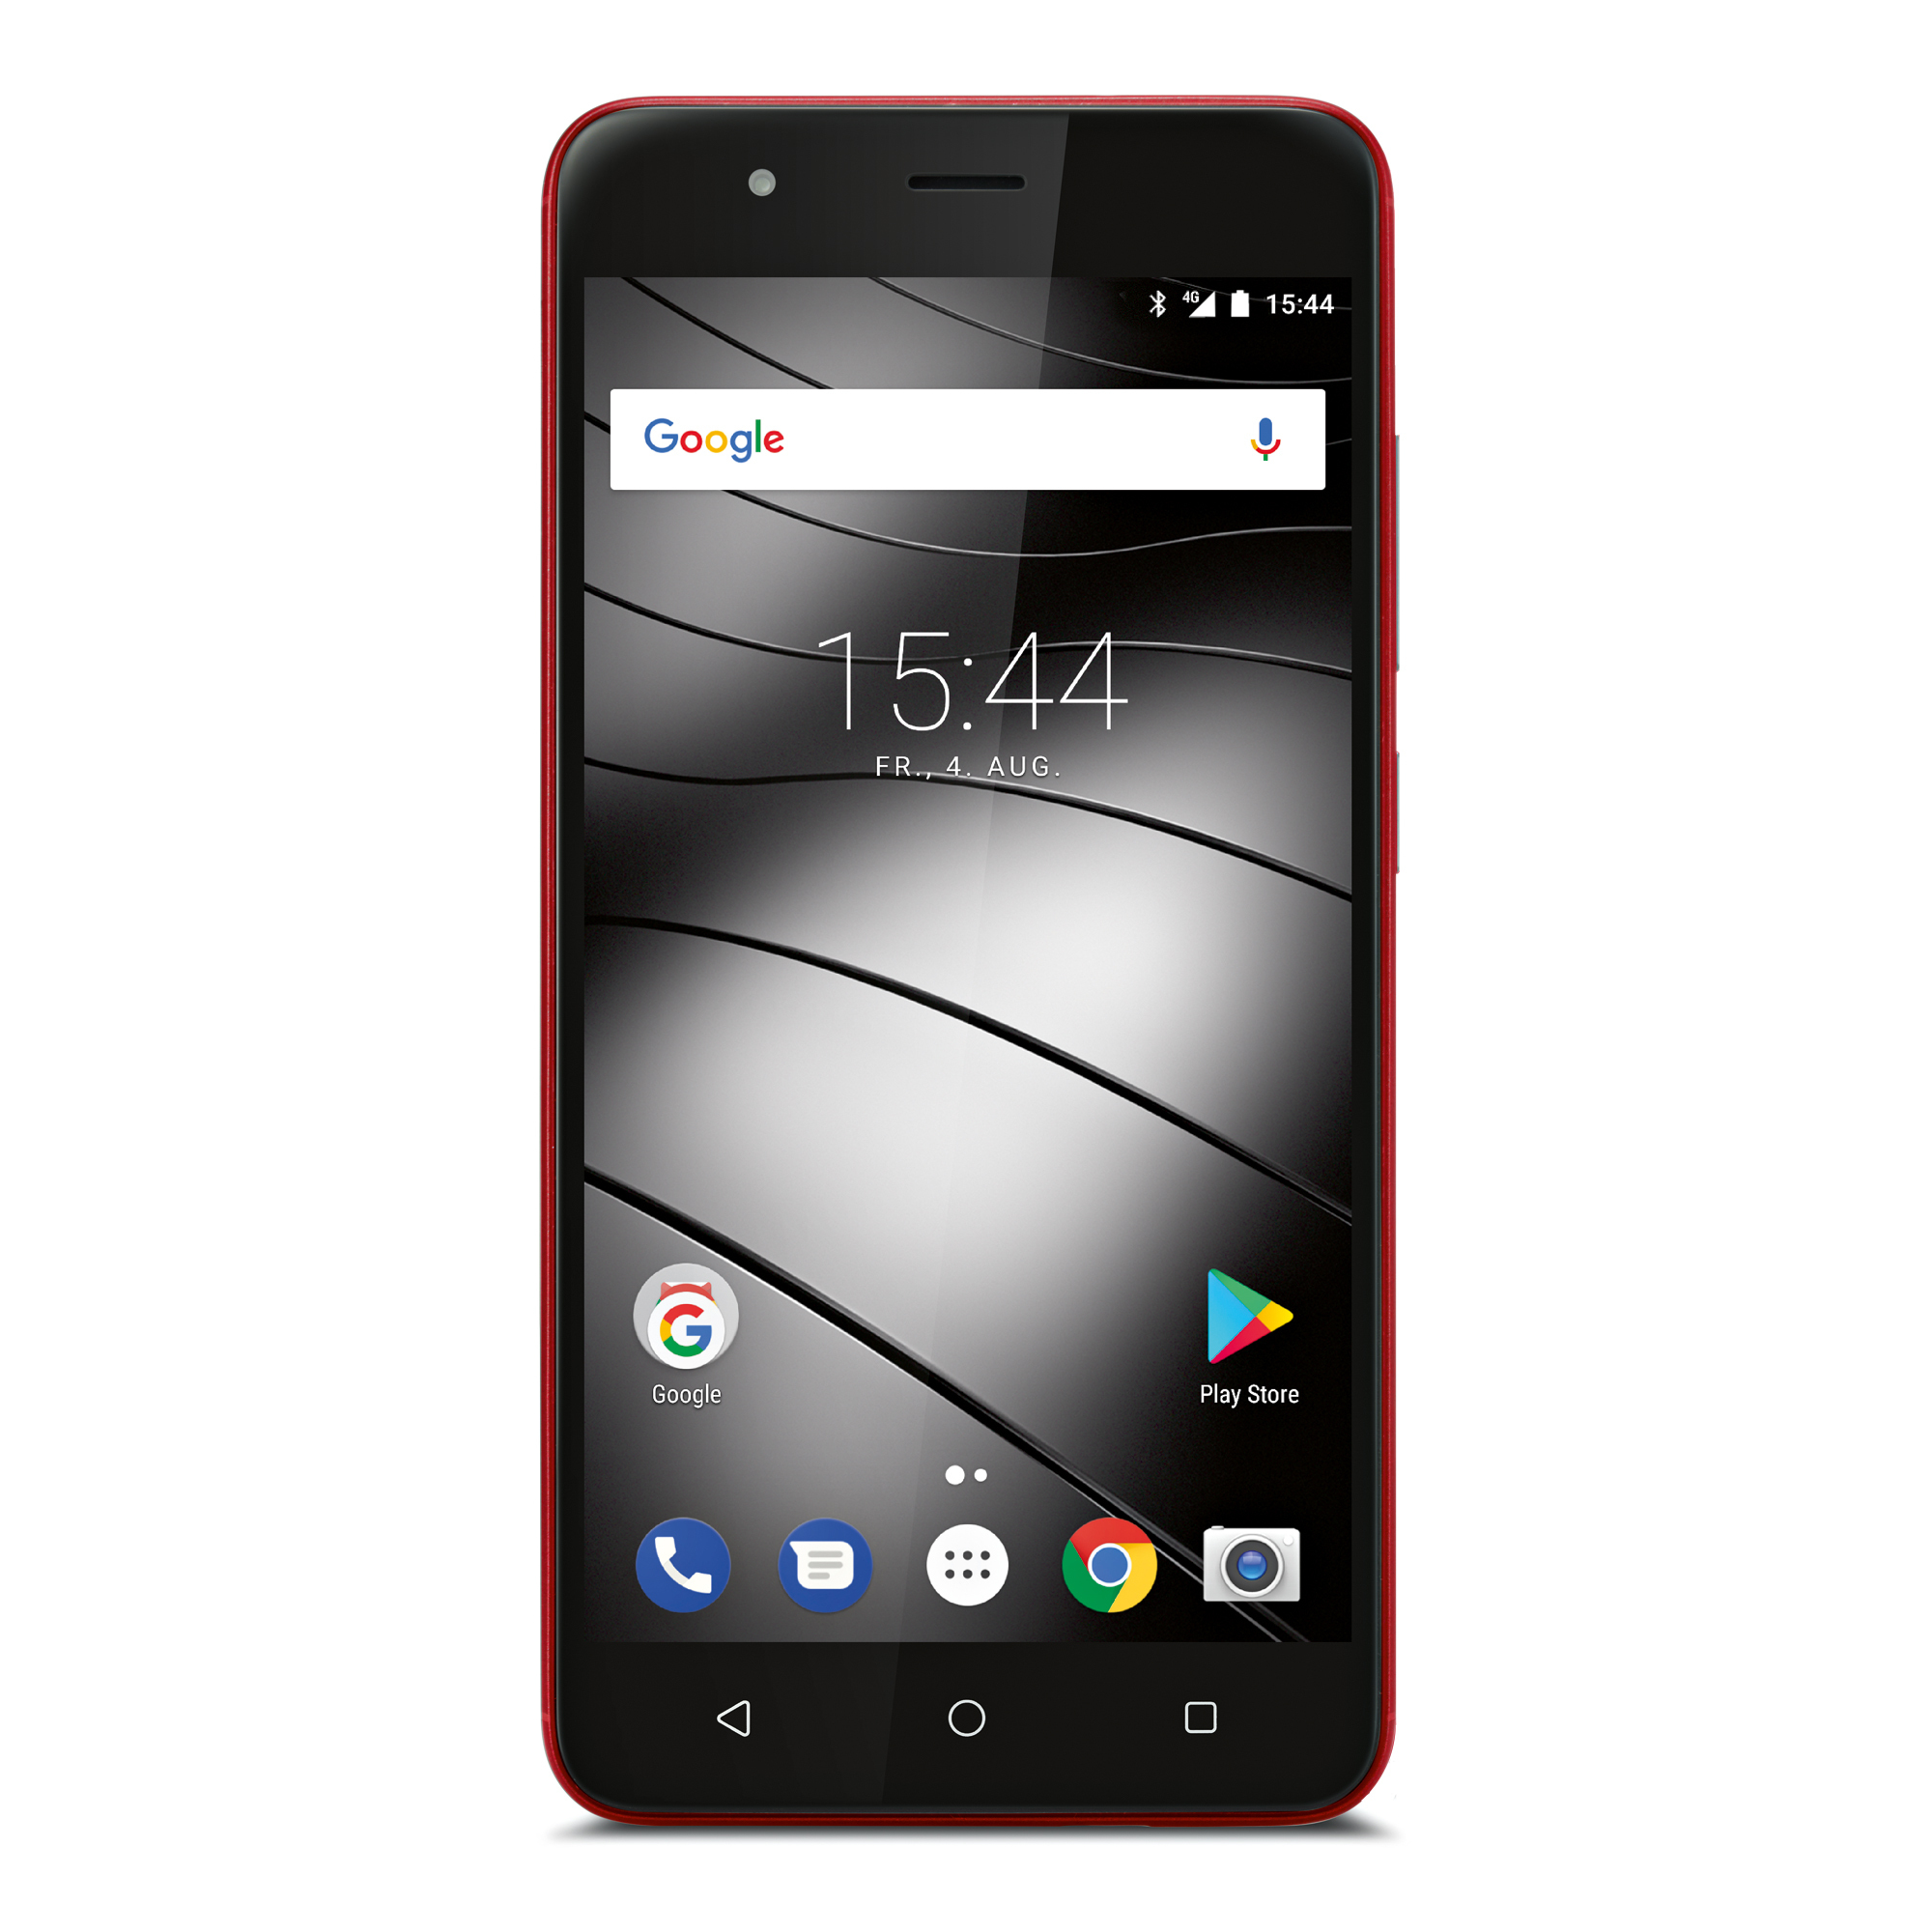
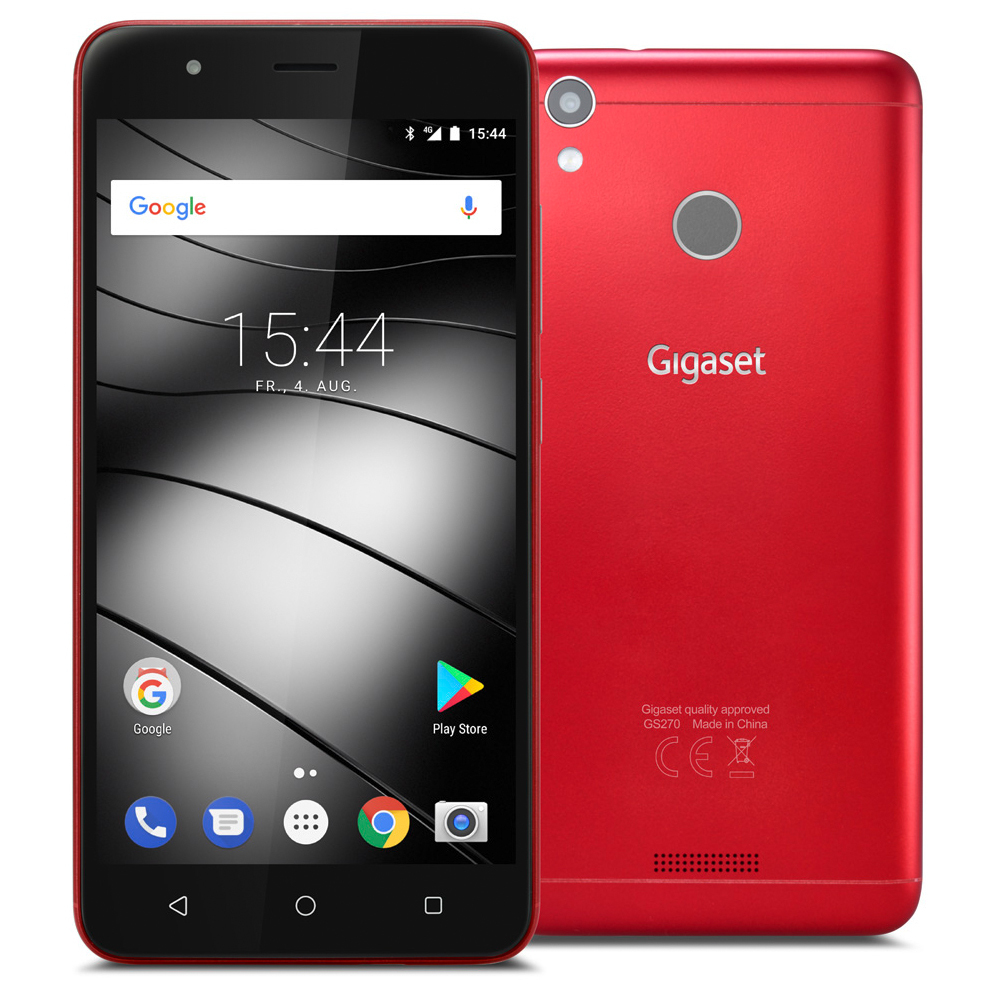
Test: Gigaset GS270 Smartphone (Sammanfattning)
| Networking | |
| iperf3 transmit AX12 | |
| Gigaset GS270 | |
| Oukitel U18 | |
| HTC Desire 12 | |
| Xiaomi Redmi 5 Plus | |
| Huawei Y6 2018 | |
| iperf3 receive AX12 | |
| Oukitel U18 | |
| Gigaset GS270 | |
| HTC Desire 12 | |
| Xiaomi Redmi 5 Plus | |
| Huawei Y6 2018 | |


| |||||||||||||||||||||||||
Distribution av ljusstyrkan: 93 %
Mitt på batteriet: 421 cd/m²
Kontrast: 1581:1 (Svärta: 0.27 cd/m²)
ΔE ColorChecker Calman: 6.4 | ∀{0.5-29.43 Ø4.71}
ΔE Greyscale Calman: 8.6 | ∀{0.09-98 Ø4.96}
89.8% sRGB (Calman 2D)
Gamma: 1.9
CCT: 7366 K
| Gigaset GS270 IPS, 1920x1080, 5.2" | Oukitel U18 LCD IPS, 1512x720, 5.9" | Huawei Y6 2018 IPS, 1440x720, 5.7" | Xiaomi Redmi 5 Plus IPS, 2160x1080, 6" | HTC Desire 12 IPS, 1440x720, 5.5" | |
|---|---|---|---|---|---|
| Screen | -9% | 1% | 12% | 23% | |
| Brightness middle (cd/m²) | 427 | 565 32% | 483 13% | 620 45% | 502 18% |
| Brightness (cd/m²) | 418 | 535 28% | 460 10% | 612 46% | 499 19% |
| Brightness Distribution (%) | 93 | 83 -11% | 88 -5% | 96 3% | 84 -10% |
| Black Level * (cd/m²) | 0.27 | 0.55 -104% | 0.4 -48% | 0.57 -111% | 0.2 26% |
| Contrast (:1) | 1581 | 1027 -35% | 1208 -24% | 1088 -31% | 2510 59% |
| Colorchecker dE 2000 * | 6.4 | 7.1 -11% | 5.8 9% | 3.46 46% | 5.4 16% |
| Colorchecker dE 2000 max. * | 14.24 | 13.7 4% | 12.6 12% | 7.88 45% | 10.8 24% |
| Greyscale dE 2000 * | 8.6 | 6.2 28% | 5 42% | 3.9 55% | 6.2 28% |
| Gamma | 1.9 116% | 2.85 77% | 2.6 85% | 2.073 106% | 2.07 106% |
| CCT | 7366 88% | 7153 91% | 7709 84% | 7230 90% | 7660 85% |
| Colorchecker dE 2000 calibrated * | 4.42 |
* ... mindre är bättre
Skärmflimmer / PWM (Puls-Width Modulation)
| Skärmflimmer / PWM upptäcktes inte | 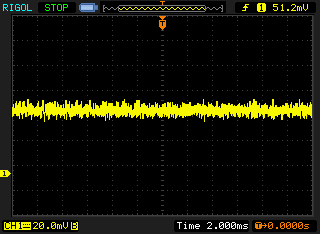 | ||
Som jämförelse: 52 % av alla testade enheter använder inte PWM för att dämpa skärmen. Om PWM upptäcktes mättes ett medelvärde av 7754 (minst: 5 - maximum: 343500) Hz. | |||
Visa svarstider
| ↔ Svarstid svart till vitt | ||
|---|---|---|
| 30 ms ... stiga ↗ och falla ↘ kombinerat | ↗ ms stiga | 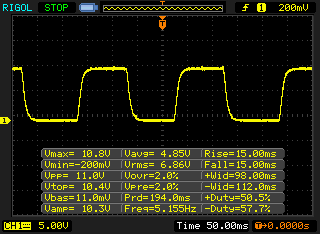 |
| ↘ ms hösten | ||
| Skärmen visar långsamma svarsfrekvenser i våra tester och kommer att vara otillfredsställande för spelare. I jämförelse sträcker sig alla testade enheter från 0.1 (minst) till 240 (maximalt) ms. » 80 % av alla enheter är bättre. Detta innebär att den uppmätta svarstiden är sämre än genomsnittet av alla testade enheter (19.8 ms). | ||
| ↔ Svarstid 50 % grått till 80 % grått | ||
| 56 ms ... stiga ↗ och falla ↘ kombinerat | ↗ ms stiga | 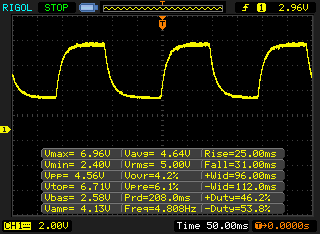 |
| ↘ ms hösten | ||
| Skärmen visar långsamma svarsfrekvenser i våra tester och kommer att vara otillfredsställande för spelare. I jämförelse sträcker sig alla testade enheter från 0.165 (minst) till 636 (maximalt) ms. » 93 % av alla enheter är bättre. Detta innebär att den uppmätta svarstiden är sämre än genomsnittet av alla testade enheter (31 ms). | ||
| AnTuTu v6 - Total Score (sortera efter värde) | |
| Gigaset GS270 | |
| Huawei Y6 2018 | |
| Xiaomi Redmi 5 Plus | |
| HTC Desire 12 | |
| Genomsnitt Mediatek MT6750 (38547 - 44842, n=17) | |
| AnTuTu v7 - Total Score (sortera efter värde) | |
| Gigaset GS270 | |
| Oukitel U18 | |
| Huawei Y6 2018 | |
| Xiaomi Redmi 5 Plus | |
| HTC Desire 12 | |
| Genomsnitt Mediatek MT6750 (52278 - 56639, n=10) | |
| PCMark for Android | |
| Work performance score (sortera efter värde) | |
| Gigaset GS270 | |
| Oukitel U18 | |
| Huawei Y6 2018 | |
| Xiaomi Redmi 5 Plus | |
| Genomsnitt Mediatek MT6750 (3667 - 4532, n=13) | |
| Work 2.0 performance score (sortera efter värde) | |
| Gigaset GS270 | |
| Oukitel U18 | |
| Huawei Y6 2018 | |
| Xiaomi Redmi 5 Plus | |
| HTC Desire 12 | |
| Genomsnitt Mediatek MT6750 (2782 - 3394, n=17) | |
| GFXBench 3.1 | |
| on screen Manhattan ES 3.1 Onscreen (sortera efter värde) | |
| Gigaset GS270 | |
| Oukitel U18 | |
| Huawei Y6 2018 | |
| Xiaomi Redmi 5 Plus | |
| HTC Desire 12 | |
| Genomsnitt Mediatek MT6750 (3.8 - 10, n=17) | |
| Genomsnitt av klass Smartphone (11 - 166, n=113, senaste 2 åren) | |
| 1920x1080 Manhattan ES 3.1 Offscreen (sortera efter värde) | |
| Gigaset GS270 | |
| Oukitel U18 | |
| Huawei Y6 2018 | |
| Xiaomi Redmi 5 Plus | |
| HTC Desire 12 | |
| Genomsnitt Mediatek MT6750 (3.5 - 4.7, n=17) | |
| Genomsnitt av klass Smartphone (8.6 - 413, n=112, senaste 2 åren) | |
| JetStream 1.1 - 1.1 Total | |
| Xiaomi Redmi 5 Plus (Chrome 66) | |
| Huawei Y6 2018 (Chrome 66) | |
| Gigaset GS270 | |
| Oukitel U18 (Chrome 65) | |
| Genomsnitt Mediatek MT6750 (12 - 20.8, n=19) | |
| HTC Desire 12 (Chrome 66.0.3359.158) | |
| Octane V2 - Total Score | |
| Genomsnitt av klass Smartphone (2800 - 126661, n=142, senaste 2 åren) | |
| Xiaomi Redmi 5 Plus (Chrome 66) | |
| Oukitel U18 (Chrome 65) | |
| Gigaset GS270 | |
| Genomsnitt Mediatek MT6750 (1994 - 3506, n=19) | |
| HTC Desire 12 (Chrome 66.0.3359.158) | |
| Huawei Y6 2018 (Chrome 66) | |
| Mozilla Kraken 1.1 - Total | |
| HTC Desire 12 (Chrome 66.0.3359.158) | |
| Huawei Y6 2018 (Chrome 66) | |
| Oukitel U18 (Chrome 65) | |
| Genomsnitt Mediatek MT6750 (11708 - 22627, n=19) | |
| Gigaset GS270 | |
| Xiaomi Redmi 5 Plus (Chrome 66) | |
| Genomsnitt av klass Smartphone (257 - 28190, n=121, senaste 2 åren) | |
| WebXPRT 2015 - Overall | |
| Xiaomi Redmi 5 Plus (Chrome 66) | |
| Huawei Y6 2018 (Chrome 66) | |
| Genomsnitt Mediatek MT6750 (34 - 78, n=5) | |
* ... mindre är bättre
| Gigaset GS270 | Oukitel U18 | Huawei Y6 2018 | Xiaomi Redmi 5 Plus | HTC Desire 12 | Genomsnitt 16 GB eMMC Flash | Genomsnitt av klass Smartphone | |
|---|---|---|---|---|---|---|---|
| AndroBench 3-5 | 20% | 9% | 74% | 7% | -27% | 2209% | |
| Sequential Read 256KB (MB/s) | 269 | 273.1 2% | 254.3 -5% | 270 0% | 211.4 -21% | 164.5 ? -39% | 2225 ? 727% |
| Sequential Write 256KB (MB/s) | 44.86 | 109.2 143% | 65.6 46% | 194.5 334% | 103.8 131% | 43 ? -4% | 1903 ? 4142% |
| Random Read 4KB (MB/s) | 34.64 | 28.7 -17% | 38.8 12% | 79.5 130% | 16.69 -52% | 21.7 ? -37% | 311 ? 798% |
| Random Write 4KB (MB/s) | 10.95 | 12.96 18% | 9 -18% | 7.1 -35% | 7.54 -31% | 8.08 ? -26% | 358 ? 3169% |
| Sequential Read 256KB SDCard (MB/s) | 75.8 | 71.5 ? -6% | 84.9 ? 12% | 84.4 11% | 81.8 ? 8% | 59.1 ? -22% | |
| Sequential Write 256KB SDCard (MB/s) | 58.9 | 47.02 ? -20% | 64 ? 9% | 59.5 1% | 61.1 ? 4% | 39.8 ? -32% |
(±) Den maximala temperaturen på ovansidan är 40.1 °C / 104 F, jämfört med genomsnittet av 35.3 °C / 96 F , allt från 21.9 till 247 °C för klassen Smartphone.
(+) Botten värms upp till maximalt 38.5 °C / 101 F, jämfört med genomsnittet av 34 °C / 93 F
(+) Vid tomgångsbruk är medeltemperaturen för ovansidan 31 °C / 88 F, jämfört med enhetsgenomsnittet på 33 °C / ### class_avg_f### F.
Gigaset GS270 ljudanalys
(±) | högtalarljudstyrkan är genomsnittlig men bra (74.4 dB)
Bas 100 - 315 Hz
(-) | nästan ingen bas - i genomsnitt 27.2% lägre än medianen
(+) | basen är linjär (5.9% delta till föregående frekvens)
Mellan 400 - 2000 Hz
(±) | reducerade mids - i genomsnitt 5.1% lägre än median
(±) | linjäriteten för mids är genomsnittlig (7.5% delta till föregående frekvens)
Högsta 2 - 16 kHz
(+) | balanserade toppar - endast 2.7% från medianen
(+) | toppar är linjära (2.1% delta till föregående frekvens)
Totalt 100 - 16 000 Hz
(±) | linjäriteten för det totala ljudet är genomsnittlig (28.4% skillnad mot median)
Jämfört med samma klass
» 74% av alla testade enheter i den här klassen var bättre, 5% liknande, 21% sämre
» Den bästa hade ett delta på 11%, genomsnittet var 34%, sämst var 134%
Jämfört med alla testade enheter
» 86% av alla testade enheter var bättre, 3% liknande, 12% sämre
» Den bästa hade ett delta på 4%, genomsnittet var 23%, sämst var 134%
HTC Desire 12 ljudanalys
(+) | högtalare kan spela relativt högt (87 dB)
Bas 100 - 315 Hz
(-) | nästan ingen bas - i genomsnitt 35.3% lägre än medianen
(±) | linjäriteten för basen är genomsnittlig (9.4% delta till föregående frekvens)
Mellan 400 - 2000 Hz
(±) | reducerade mids - i genomsnitt 6.3% lägre än median
(±) | linjäriteten för mids är genomsnittlig (10% delta till föregående frekvens)
Högsta 2 - 16 kHz
(±) | högre toppar - i genomsnitt 6.8% högre än medianen
(±) | linjäriteten för toppar är genomsnittlig (8.7% delta till föregående frekvens)
Totalt 100 - 16 000 Hz
(±) | linjäriteten för det totala ljudet är genomsnittlig (27.7% skillnad mot median)
Jämfört med samma klass
» 72% av alla testade enheter i den här klassen var bättre, 5% liknande, 23% sämre
» Den bästa hade ett delta på 11%, genomsnittet var 34%, sämst var 134%
Jämfört med alla testade enheter
» 84% av alla testade enheter var bättre, 3% liknande, 13% sämre
» Den bästa hade ett delta på 4%, genomsnittet var 23%, sämst var 134%
| Av/Standby | |
| Låg belastning | |
| Hög belastning |
|
Förklaring:
min: | |
| Gigaset GS270 5000 mAh | Oukitel U18 4000 mAh | Huawei Y6 2018 3000 mAh | Xiaomi Redmi 5 Plus 4000 mAh | HTC Desire 12 2730 mAh | Genomsnitt Mediatek MT6750 | Genomsnitt av klass Smartphone | |
|---|---|---|---|---|---|---|---|
| Power Consumption | -83% | -58% | -34% | -10% | -29% | -33% | |
| Idle Minimum * (Watt) | 0.8 | 1.12 -40% | 1.7 -113% | 0.7 13% | 1.13 -41% | 1.13 ? -41% | 0.887 ? -11% |
| Idle Average * (Watt) | 1.6 | 2.27 -42% | 2.5 -56% | 2.8 -75% | 2.03 -27% | 2.02 ? -26% | 1.485 ? 7% |
| Idle Maximum * (Watt) | 2 | 2.49 -25% | 3.2 -60% | 3.4 -70% | 2.05 -2% | 2.42 ? -21% | 1.672 ? 16% |
| Load Average * (Watt) | 3.7 | 10.75 -191% | 5.2 -41% | 4.2 -14% | 3.68 1% | 5.21 ? -41% | 6.76 ? -83% |
| Load Maximum * (Watt) | 5.7 | 12.39 -117% | 6.8 -19% | 7.2 -26% | 4.52 21% | 6.56 ? -15% | 11.2 ? -96% |
* ... mindre är bättre
| Gigaset GS270 5000 mAh | Oukitel U18 4000 mAh | Huawei Y6 2018 3000 mAh | Xiaomi Redmi 5 Plus 4000 mAh | HTC Desire 12 2730 mAh | |
|---|---|---|---|---|---|
| Batteridrifttid | |||||
| WiFi v1.3 (h) | 12.3 | 10.7 -13% | 10.7 -13% | 8.3 -33% | 7.3 -41% |
För
Emot
Läs den fullständiga versionen av den här recensionen på engelska här.
I vårt test framstår Gigaset GS270 som en smartphone i det lägre mittenskiktet och som inte har särskilt många större svagheter. Prestandan som erbjuds är vad man kan förvänta sig med tanke på dess hårdvara och utöver en aningen åldrad version av Android så finns det knappt någon anledning att klaga. Även om många konkurrerande enheter får bättre resultat i vissa områden så har dom problem med andra.
Den som köper GS270 får precis vad Gigaset har lovat: en Android-telefon för 2.000 kronor med lång batteritid och ett smidigt system för vardagsanvändning.
För ett pris på 2.000 kronor får intresserade köpare tänka till kring vilka smartphone-funktioner som är viktiga för dem. Tar man bara bilder då och då och inte behöver köra krävande program kommer man få en gedigen enhet som är lämplig för att ringa telefonsamtal och som kan hantera alla dom vanliga apparna. Dessutom går den om dom flesta konkurrenterna med sin långa batteritid.
Gigaset GS270
- 05/27/2018 v6 (old)
Mike Wobker