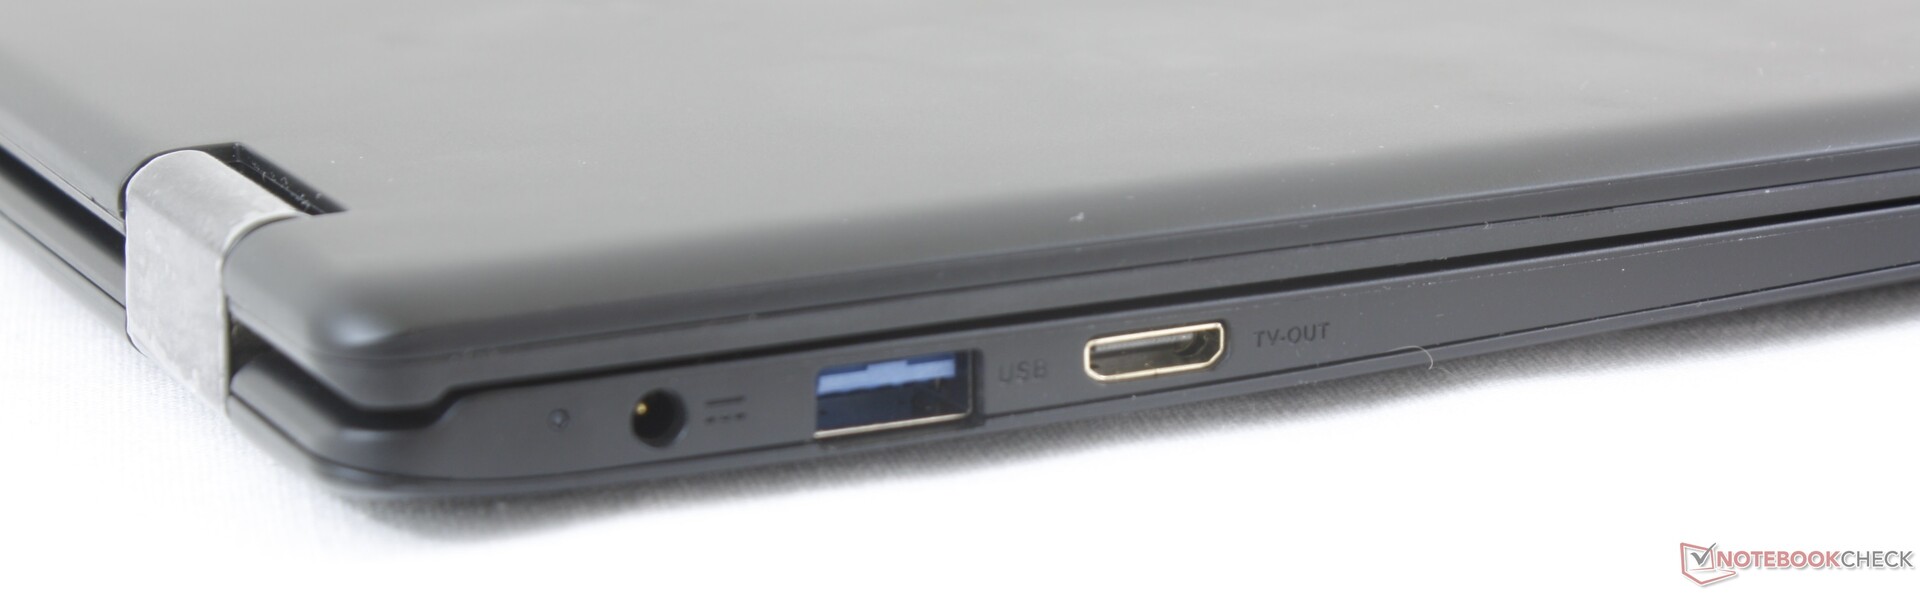
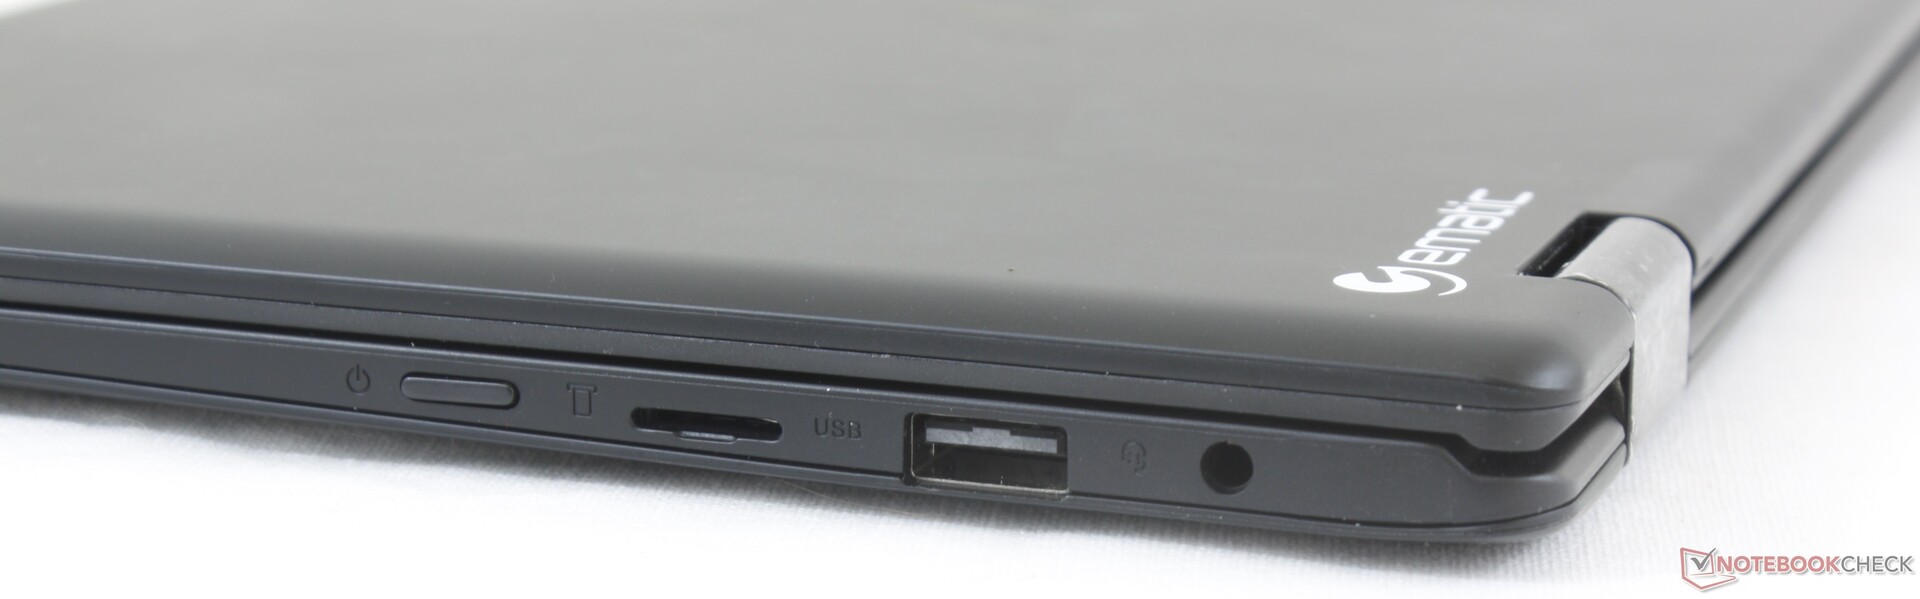
Test: Ematic EWT117 (Atom x5-Z8350) Omvandlingsbar (Sammanfattning)
| SD Card Reader | |
| average JPG Copy Test (av. of 3 runs) | |
| Lenovo Ideapad 120s-11IAP (Toshiba Exceria Pro M401) | |
| Lenovo Yoga 330-11IGM (Toshiba Exceria Pro SDXC 64 GB UHS-II) | |
| Lenovo IdeaPad 330-15ARR-81D2005JGE (Toshiba Exceria Pro SDXC 64 GB UHS-II) | |
| Asus Zenbook UX360CA-FC060T (Toshiba Exceria Pro SDXC 64 GB UHS-II) | |
| Ematic EWT117 (Toshiba Exceria Pro M401) | |
| maximum AS SSD Seq Read Test (1GB) | |
| Lenovo Ideapad 120s-11IAP (Toshiba Exceria Pro M401) | |
| Lenovo Yoga 330-11IGM (Toshiba Exceria Pro SDXC 64 GB UHS-II) | |
| Asus Zenbook UX360CA-FC060T (Toshiba Exceria Pro SDXC 64 GB UHS-II) | |
| Trekstor Yourbook C11B (Toshiba Exceria Pro M501 microSDXC 64GB) | |
| Ematic EWT117 (Toshiba Exceria Pro M401) | |
| Networking | |
| iperf3 transmit AX12 | |
| Trekstor Yourbook C11B | |
| Asus E203MA-FD825TS | |
| Lenovo Yoga 330-11IGM | |
| Ematic EWT117 | |
| iperf3 receive AX12 | |
| Trekstor Yourbook C11B | |
| Lenovo Yoga 330-11IGM | |
| Asus E203MA-FD825TS | |
| Ematic EWT117 | |
| |||||||||||||||||||||||||
Distribution av ljusstyrkan: 88 %
Mitt på batteriet: 194.6 cd/m²
Kontrast: 556:1 (Svärta: 0.35 cd/m²)
ΔE ColorChecker Calman: 8 | ∀{0.5-29.43 Ø4.73}
calibrated: 2.11
ΔE Greyscale Calman: 9 | ∀{0.09-98 Ø4.97}
94.8% sRGB (Argyll 1.6.3 3D)
60.9% AdobeRGB 1998 (Argyll 1.6.3 3D)
66.2% AdobeRGB 1998 (Argyll 3D)
95.1% sRGB (Argyll 3D)
64.8% Display P3 (Argyll 3D)
Gamma: 2.12
CCT: 9539 K
| Ematic EWT117 LC116LF3L01, IPS, 11.6", 1920x1080 | Asus E203MA-FD825TS AUO225C, TN LED, 11.6", 1366x768 | Trekstor Yourbook C11B LC116LF1L01, IPS, 11.6", 1920x1080 | Lenovo Yoga 330-11IGM BOE CQ NT116WHM-N42, TN LED, 11.6", 1366x768 | Lenovo Ideapad 120s-11IAP AU Optronics AUO-B116XTN02.5 , TN LED, 11.6", 1366x768 | Dell Latitude 3189 AU Optronics AUO235C B116XAT, IPS, 11.6", 1366x768 | |
|---|---|---|---|---|---|---|
| Display | -44% | -2% | -37% | -39% | -30% | |
| Display P3 Coverage (%) | 64.8 | 35.75 -45% | 64.4 -1% | 40.42 -38% | 39.03 -40% | 44.96 -31% |
| sRGB Coverage (%) | 95.1 | 53.8 -43% | 92.5 -3% | 60.8 -36% | 58.7 -38% | 67.3 -29% |
| AdobeRGB 1998 Coverage (%) | 66.2 | 36.94 -44% | 65.7 -1% | 41.76 -37% | 40.33 -39% | 46.49 -30% |
| Response Times | 30% | -9% | 12% | -34% | -4% | |
| Response Time Grey 50% / Grey 80% * (ms) | 38.4 ? | 41 ? -7% | 42 ? -9% | 50 ? -30% | 72.8 ? -90% | 40 ? -4% |
| Response Time Black / White * (ms) | 29.6 ? | 10 ? 66% | 32 ? -8% | 14 ? 53% | 22.8 ? 23% | 30.4 ? -3% |
| PWM Frequency (Hz) | 500 ? | 200 ? | 200 ? | |||
| Screen | -25% | 21% | -28% | -32% | 49% | |
| Brightness middle (cd/m²) | 194.6 | 235 21% | 304 56% | 224 15% | 266.2 37% | 291 50% |
| Brightness (cd/m²) | 193 | 227 18% | 267 38% | 213 10% | 251 30% | 284 47% |
| Brightness Distribution (%) | 88 | 93 6% | 77 -12% | 80 -9% | 90 2% | 92 5% |
| Black Level * (cd/m²) | 0.35 | 0.44 -26% | 0.28 20% | 0.52 -49% | 0.67 -91% | 0.16 54% |
| Contrast (:1) | 556 | 534 -4% | 1086 95% | 431 -22% | 397 -29% | 1819 227% |
| Colorchecker dE 2000 * | 8 | 11.73 -47% | 7.28 9% | 11.64 -46% | 12.4 -55% | 3.4 57% |
| Colorchecker dE 2000 max. * | 13.71 | 18.8 -37% | 12.65 8% | 20.8 -52% | 24.5 -79% | 9.6 30% |
| Colorchecker dE 2000 calibrated * | 2.11 | 3.73 -77% | 1.89 10% | |||
| Greyscale dE 2000 * | 9 | 12.64 -40% | 8.34 7% | 13.4 -49% | 14.4 -60% | 1.8 80% |
| Gamma | 2.12 104% | 2.61 84% | 2.33 94% | 2.57 86% | 2.16 102% | 2.14 103% |
| CCT | 9539 68% | 14819 44% | 9038 72% | 15186 43% | 19436 33% | 6544 99% |
| Color Space (Percent of AdobeRGB 1998) (%) | 60.9 | 34 -44% | 60 -1% | 38 -38% | 37 -39% | 42.8 -30% |
| Color Space (Percent of sRGB) (%) | 94.8 | 54 -43% | 92 -3% | 61 -36% | 59 -38% | 67 -29% |
| Totalt genomsnitt (program/inställningar) | -13% /
-22% | 3% /
13% | -18% /
-24% | -35% /
-34% | 5% /
26% |
* ... mindre är bättre
Visa svarstider
| ↔ Svarstid svart till vitt | ||
|---|---|---|
| 29.6 ms ... stiga ↗ och falla ↘ kombinerat | ↗ 18.4 ms stiga | 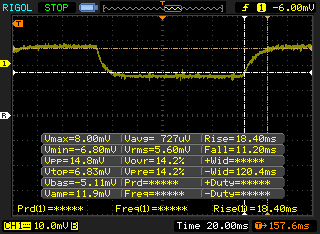 |
| ↘ 11.2 ms hösten | ||
| Skärmen visar relativt långsamma svarsfrekvenser i våra tester och kan vara för långsam för spelare. I jämförelse sträcker sig alla testade enheter från 0.1 (minst) till 240 (maximalt) ms. » 79 % av alla enheter är bättre. Detta innebär att den uppmätta svarstiden är sämre än genomsnittet av alla testade enheter (19.9 ms). | ||
| ↔ Svarstid 50 % grått till 80 % grått | ||
| 38.4 ms ... stiga ↗ och falla ↘ kombinerat | ↗ 19.6 ms stiga | 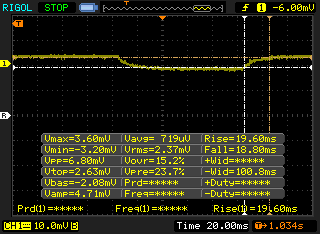 |
| ↘ 18.8 ms hösten | ||
| Skärmen visar långsamma svarsfrekvenser i våra tester och kommer att vara otillfredsställande för spelare. I jämförelse sträcker sig alla testade enheter från 0.165 (minst) till 636 (maximalt) ms. » 57 % av alla enheter är bättre. Detta innebär att den uppmätta svarstiden är sämre än genomsnittet av alla testade enheter (31.1 ms). | ||
Skärmflimmer / PWM (Puls-Width Modulation)
| Skärmflimmer / PWM upptäckt | 500 Hz | ≤ 25 % ljusstyrka inställning | 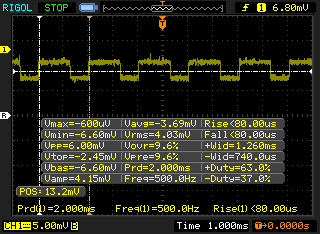 |
Displayens bakgrundsbelysning flimrar vid 500 Hz (i värsta fall, t.ex. med PWM) Flimrande upptäckt vid en ljusstyrkeinställning på 25 % och lägre. Det ska inte finnas något flimmer eller PWM över denna ljusstyrkeinställning. Frekvensen för 500 Hz är relativt hög, så de flesta användare som är känsliga för PWM bör inte märka något flimmer. Det finns dock rapporter om att vissa användare fortfarande är känsliga för PWM vid 500 Hz och högre, så var uppmärksam. Som jämförelse: 52 % av alla testade enheter använder inte PWM för att dämpa skärmen. Om PWM upptäcktes mättes ett medelvärde av 7801 (minst: 5 - maximum: 343500) Hz. | |||

| Cinebench R15 | |
| CPU Single 64Bit | |
| Lenovo IdeaPad 330-15ARR-81D2005JGE | |
| Dell Latitude 13 7370 | |
| Apple MacBook 12 (Early 2015) 1.1 GHz | |
| Asus Zenbook UX360CA-FC060T | |
| Lenovo Yoga 330-11IGM | |
| Dell Latitude 3189 | |
| Lenovo Ideapad 120s-11IAP | |
| Dell Venue 8 Pro 5855 | |
| Genomsnitt Intel Atom x5-Z8350 (25 - 31, n=9) | |
| Ematic EWT117 | |
| CPU Multi 64Bit | |
| Lenovo IdeaPad 330-15ARR-81D2005JGE | |
| Lenovo Yoga 330-11IGM | |
| Apple MacBook 12 (Early 2015) 1.1 GHz | |
| Asus Zenbook UX360CA-FC060T | |
| Dell Latitude 13 7370 | |
| Dell Latitude 3189 | |
| Genomsnitt Intel Atom x5-Z8350 (88 - 101, n=10) | |
| Ematic EWT117 | |
| Lenovo Ideapad 120s-11IAP | |
| Dell Venue 8 Pro 5855 | |
| PCMark 10 | |
| Score | |
| Lenovo Yoga 330-11IGM | |
| Asus E203MA-FD825TS | |
| Trekstor Yourbook C11B | |
| Lenovo Ideapad 120s-11IAP | |
| Ematic EWT117 | |
| Essentials | |
| Asus E203MA-FD825TS | |
| Lenovo Yoga 330-11IGM | |
| Trekstor Yourbook C11B | |
| Lenovo Ideapad 120s-11IAP | |
| Ematic EWT117 | |
| Productivity | |
| Asus E203MA-FD825TS | |
| Lenovo Yoga 330-11IGM | |
| Trekstor Yourbook C11B | |
| Lenovo Ideapad 120s-11IAP | |
| Ematic EWT117 | |
| Digital Content Creation | |
| Lenovo Yoga 330-11IGM | |
| Asus E203MA-FD825TS | |
| Lenovo Ideapad 120s-11IAP | |
| Trekstor Yourbook C11B | |
| Ematic EWT117 | |
| PCMark 8 | |
| Home Score Accelerated v2 | |
| Apple MacBook 12 (Early 2016) 1.1 GHz | |
| Lenovo Yoga 330-11IGM | |
| Dell Latitude 3189 | |
| Asus E203MA-FD825TS | |
| Lenovo Ideapad 120s-11IAP | |
| Trekstor Yourbook C11B | |
| Ematic EWT117 | |
| Work Score Accelerated v2 | |
| Apple MacBook 12 (Early 2016) 1.1 GHz | |
| Lenovo Yoga 330-11IGM | |
| Dell Latitude 3189 | |
| Lenovo Ideapad 120s-11IAP | |
| Trekstor Yourbook C11B | |
| PCMark 8 Home Score Accelerated v2 | 1191 poäng | |
| PCMark 10 Score | 743 poäng | |
Hjälp | ||
| Ematic EWT117 32 GB eMMC Flash | Asus E203MA-FD825TS SanDisk DA4064 | Trekstor Yourbook C11B 64 GB eMMC Flash | Lenovo Yoga 330-11IGM 128 GB eMMC Flash | Lenovo Ideapad 120s-11IAP 64 GB eMMC Flash | |
|---|---|---|---|---|---|
| CrystalDiskMark 5.2 / 6 | 274% | 105% | 131% | 87% | |
| Write 4K (MB/s) | 8.216 | 38.28 366% | 9.498 16% | 14.55 77% | 12.19 48% |
| Read 4K (MB/s) | 12.86 | 12.14 -6% | 4.941 -62% | 13.4 4% | 6.61 -49% |
| Write Seq (MB/s) | 48.87 | 220.2 351% | 114.3 134% | 110.1 125% | 108.2 121% |
| Read Seq (MB/s) | 141.6 | 262 85% | 262.8 86% | 294.9 108% | 167.1 18% |
| Write 4K Q32T1 (MB/s) | 16.47 | 45.72 178% | 15.3 -7% | 14.17 -14% | 15.38 -7% |
| Read 4K Q32T1 (MB/s) | 17.83 | 61 242% | 31.59 77% | 36.92 107% | 31.28 75% |
| Write Seq Q32T1 (MB/s) | 16.72 | 167.1 899% | 111.8 569% | 106.4 536% | 96.2 475% |
| Read Seq Q32T1 (MB/s) | 117.7 | 211.5 80% | 151.5 29% | 238.2 102% | 134.1 14% |

| 3DMark | |
| 1280x720 Cloud Gate Standard Graphics | |
| Apple MacBook 12 (Early 2016) 1.1 GHz | |
| Asus Zenbook UX360CA-FC060T | |
| Dell Latitude 3189 | |
| Dell Latitude 13 7370 | |
| Lenovo Yoga 330-11IGM | |
| Lenovo Ideapad 120s-11IAP | |
| Genomsnitt Intel HD Graphics (Cherry Trail) (1537 - 2272, n=8) | |
| Dell Venue 8 Pro 5855 | |
| 1920x1080 Fire Strike Graphics | |
| Apple MacBook 12 (Early 2016) 1.1 GHz | |
| Dell Latitude 3189 | |
| Dell Latitude 13 7370 | |
| Lenovo Yoga 330-11IGM | |
| Lenovo Ideapad 120s-11IAP | |
| Genomsnitt Intel HD Graphics (Cherry Trail) (193 - 281, n=3) | |
| 1920x1080 Ice Storm Extreme Graphics | |
| Dell Latitude 13 7370 | |
| Dell Latitude 3189 | |
| 2560x1440 Time Spy Graphics | |
| Dell Latitude 3189 | |
| 3DMark 11 Performance | 320 poäng | |
Hjälp | ||
(±) Den maximala temperaturen på ovansidan är 42 °C / 108 F, jämfört med genomsnittet av 35.9 °C / 97 F , allt från 21.4 till 59 °C för klassen Subnotebook.
(±) Botten värms upp till maximalt 42.8 °C / 109 F, jämfört med genomsnittet av 39.2 °C / 103 F
(+) Vid tomgångsbruk är medeltemperaturen för ovansidan 25.9 °C / 79 F, jämfört med enhetsgenomsnittet på 30.8 °C / ### class_avg_f### F.
(+) Handledsstöden och pekplattan är kallare än hudtemperaturen med maximalt 26.2 °C / 79.2 F och är därför svala att ta på.
(±) Medeltemperaturen för handledsstödsområdet på liknande enheter var 28.2 °C / 82.8 F (+2 °C / 3.6 F).
Ematic EWT117 ljudanalys
(±) | högtalarljudstyrkan är genomsnittlig men bra (78.4 dB)
Bas 100 - 315 Hz
(-) | nästan ingen bas - i genomsnitt 20.6% lägre än medianen
(+) | basen är linjär (2.4% delta till föregående frekvens)
Mellan 400 - 2000 Hz
(±) | reducerade mids - i genomsnitt 7.1% lägre än median
(±) | linjäriteten för mids är genomsnittlig (10% delta till föregående frekvens)
Högsta 2 - 16 kHz
(±) | högre toppar - i genomsnitt 6.4% högre än medianen
(±) | linjäriteten för toppar är genomsnittlig (10.4% delta till föregående frekvens)
Totalt 100 - 16 000 Hz
(±) | linjäriteten för det totala ljudet är genomsnittlig (28.1% skillnad mot median)
Jämfört med samma klass
» 89% av alla testade enheter i den här klassen var bättre, 3% liknande, 8% sämre
» Den bästa hade ett delta på 5%, genomsnittet var 18%, sämst var 53%
Jämfört med alla testade enheter
» 85% av alla testade enheter var bättre, 3% liknande, 12% sämre
» Den bästa hade ett delta på 4%, genomsnittet var 24%, sämst var 134%
Apple MacBook 12 (Early 2016) 1.1 GHz ljudanalys
(+) | högtalare kan spela relativt högt (83.6 dB)
Bas 100 - 315 Hz
(±) | reducerad bas - i genomsnitt 11.3% lägre än medianen
(±) | linjäriteten för basen är genomsnittlig (14.2% delta till föregående frekvens)
Mellan 400 - 2000 Hz
(+) | balanserad mellan - endast 2.4% från medianen
(+) | mids är linjära (5.5% delta till föregående frekvens)
Högsta 2 - 16 kHz
(+) | balanserade toppar - endast 2% från medianen
(+) | toppar är linjära (4.5% delta till föregående frekvens)
Totalt 100 - 16 000 Hz
(+) | det totala ljudet är linjärt (10.2% skillnad mot median)
Jämfört med samma klass
» 7% av alla testade enheter i den här klassen var bättre, 2% liknande, 91% sämre
» Den bästa hade ett delta på 5%, genomsnittet var 18%, sämst var 53%
Jämfört med alla testade enheter
» 5% av alla testade enheter var bättre, 1% liknande, 94% sämre
» Den bästa hade ett delta på 4%, genomsnittet var 24%, sämst var 134%
| Av/Standby | |
| Låg belastning | |
| Hög belastning |
|
Förklaring:
min: | |
| Ematic EWT117 Z8350, HD Graphics (Cherry Trail), 32 GB eMMC Flash, IPS, 1920x1080, 11.6" | Asus E203MA-FD825TS Pentium N5000, UHD Graphics 605, SanDisk DA4064, TN LED, 1366x768, 11.6" | Trekstor Yourbook C11B Celeron N3350, HD Graphics 500, 64 GB eMMC Flash, IPS, 1920x1080, 11.6" | Lenovo Yoga 330-11IGM Pentium N5000, UHD Graphics 605, 128 GB eMMC Flash, TN LED, 1366x768, 11.6" | Lenovo Ideapad 120s-11IAP Celeron N3350, HD Graphics 500, 64 GB eMMC Flash, TN LED, 1366x768, 11.6" | Apple MacBook 12 (Early 2016) 1.1 GHz 6Y30, HD Graphics 515, Apple SSD AP0256, IPS, 2304x1440, 12" | |
|---|---|---|---|---|---|---|
| Power Consumption | 10% | -18% | -8% | 15% | -22% | |
| Idle Minimum * (Watt) | 4.2 | 1.9 55% | 3.2 24% | 2.3 45% | 2.8 33% | 2.7 36% |
| Idle Average * (Watt) | 7 | 3.5 50% | 6.1 13% | 4.2 40% | 4.2 40% | 2.7 61% |
| Idle Maximum * (Watt) | 8.5 | 3.9 54% | 7 18% | 5.4 36% | 5.1 40% | 7.2 15% |
| Load Average * (Watt) | 9.4 | 12.7 -35% | 15.4 -64% | 11.8 -26% | 22 -134% | |
| Load Maximum * (Watt) | 11 | 19 -73% | 24.7 -125% | 21.4 -95% | 12.1 -10% | 20.5 -86% |
* ... mindre är bättre
| Ematic EWT117 Z8350, HD Graphics (Cherry Trail), 30.4 Wh | Asus E203MA-FD825TS Pentium N5000, UHD Graphics 605, 38 Wh | Trekstor Yourbook C11B Celeron N3350, HD Graphics 500, 36.48 Wh | Lenovo Yoga 330-11IGM Pentium N5000, UHD Graphics 605, 36 Wh | Lenovo Ideapad 120s-11IAP Celeron N3350, HD Graphics 500, 32 Wh | Apple MacBook 12 (Early 2016) 1.1 GHz 6Y30, HD Graphics 515, 41.4 Wh | |
|---|---|---|---|---|---|---|
| Batteridrifttid | 108% | 110% | 135% | 80% | 110% | |
| WiFi v1.3 (h) | 4 | 8.3 108% | 8.4 110% | 9.4 135% | 7.2 80% | 8.4 110% |
| Reader / Idle (h) | 15.3 | |||||
| Load (h) | 3.8 | 3.9 |
För
Emot
Läs den fullständiga versionen av den här recensionen på engelska här.
Ematic EWT117 är ett klassiskt exempel på att lova för mycket till ett för lågt pris. En fullt fungerande omvandlingsbar laptop med Windows 10 som har en MicroSD-kortläsare, en HDMI-port och en tryckkänslig IPS-skärm på 1080p för under 1.800 kronor är fortfarande för bra för att vara sant utan kraftiga brister. I det här fallet är systemet extraordinärt långsamt, både på grund av sin Atom-processor och på grund av riktigt dålig SSD-prestanda. Till och med enkla saker som ordbehandling eller videouppspelning - vilket Ematic är tänkt att vara bra på - rör sig i snigelhastighet.
Vår enhet visade dessutom upp en del hårdvaruproblem. Styrplattan fick ofta muspekaren att hoppa till utan förvarning och vårt MicroSD-kort fastnade ibland i den fjädrade MicroSD-läsaren.
Den bästa aspekten av Ematic är den tryckkänsliga IPS-skärmen på 1080p som med tanke på priset täcker ett förvånansvärt brett omfång av färger (95 procent av sRGB). Tyvärr betyder detta inte så mycket eftersom resten av systemet är undermåligt.
Vi begär inte mycket från en touch-baserad netbook för 2.000 kronor. Men när till och med en billig Android-surfplatta för 2.000 kronor kan surfa på internet, ordbehandla och spela upp video snabbare än Ematic blir det svårt att rekommendera EWT117 åt de flesta vanliga användare.
Ematic EWT117
- 04/06/2019 v6 (old)
Allen Ngo
Price comparison
