Test: Chuwi AeroBook (2019) Laptop: En kompakt folkfinansierad Ultrabook
| SD Card Reader | |
| average JPG Copy Test (av. of 3 runs) | |
| Dell XPS 13 9380 2019 (Toshiba Exceria Pro SDXC 64 GB UHS-II) | |
| Genomsnitt av klass Subnotebook (23.7 - 188, n=9, senaste 2 åren) | |
| Lenovo IdeaPad 330S-15IKB-81F500N5GE (Toshiba Exceria Pro SDXC 64 GB UHS-II) | |
| Chuwi LapBook SE | |
| Chuwi AeroBook 13 inch 2019 (Toshiba Exceria Pro UHS-II SDXC) | |
| maximum AS SSD Seq Read Test (1GB) | |
| Dell XPS 13 9380 2019 (Toshiba Exceria Pro SDXC 64 GB UHS-II) | |
| Genomsnitt av klass Subnotebook (24.9 - 195, n=8, senaste 2 åren) | |
| Asus E203MA-FD825TS (Toshiba Exceria Pro M501 microSDXC 64GB) | |
| Chuwi LapBook SE | |
| Chuwi AeroBook 13 inch 2019 (Toshiba Exceria Pro UHS-II SDXC) | |
| |||||||||||||||||||||||||
Distribution av ljusstyrkan: 90 %
Mitt på batteriet: 307.6 cd/m²
Kontrast: 905:1 (Svärta: 0.34 cd/m²)
ΔE ColorChecker Calman: 7.31 | ∀{0.5-29.43 Ø4.72}
calibrated: 3.94
ΔE Greyscale Calman: 6.8 | ∀{0.09-98 Ø4.97}
87% sRGB (Argyll 1.6.3 3D)
57% AdobeRGB 1998 (Argyll 1.6.3 3D)
64.1% AdobeRGB 1998 (Argyll 3D)
87.6% sRGB (Argyll 3D)
67.3% Display P3 (Argyll 3D)
Gamma: 1.909
CCT: 7695 K
| Chuwi AeroBook 13 inch 2019 BOE BOE0719, IPS, 13.3", 1920x1080 | Apple MacBook Air 2018 APPA039, IPS, 13.3", 2560x1600 | Asus E203MA-FD825TS AUO225C, TN LED, 11.6", 1366x768 | Lenovo IdeaPad 330S-15IKB-81F500N5GE BOE0700, IPS, 15.6", 1920x1080 | Apple MacBook 12 2017 APPA027, LED IPS, 12", 2304x1440 | Chuwi LapBook SE 13.3", 1920x1080 | Dell XPS 13 9380 2019 ID: AUO 282B B133ZAN Dell: 90NTH, IPS, 13.3", 3840x2160 | |
|---|---|---|---|---|---|---|---|
| Display | 7% | -43% | -37% | 3% | 1% | ||
| Display P3 Coverage (%) | 67.3 | 67.8 1% | 35.75 -47% | 39.85 -41% | 65 -3% | 64.7 -4% | |
| sRGB Coverage (%) | 87.6 | 96.1 10% | 53.8 -39% | 58.8 -33% | 94.8 8% | 93.1 6% | |
| AdobeRGB 1998 Coverage (%) | 64.1 | 69.8 9% | 36.94 -42% | 41.17 -36% | 66.5 4% | 65.3 2% | |
| Response Times | -8% | 22% | -20% | -12% | -7% | -50% | |
| Response Time Grey 50% / Grey 80% * (ms) | 34 ? | 39.6 ? -16% | 41 ? -21% | 44 ? -29% | 40.8 ? -20% | 39.2 ? -15% | 58 ? -71% |
| Response Time Black / White * (ms) | 28 ? | 28 ? -0% | 10 ? 64% | 31 ? -11% | 29.2 ? -4% | 27.7 ? 1% | 36 ? -29% |
| PWM Frequency (Hz) | 2000 ? | 113600 ? | 86000 ? | 116000 | 200 ? | ||
| Screen | 37% | -36% | -8% | -9% | 23% | ||
| Brightness middle (cd/m²) | 307.6 | 320 4% | 235 -24% | 283 -8% | 227 -26% | 404 31% | |
| Brightness (cd/m²) | 295 | 315 7% | 227 -23% | 252 -15% | 210 -29% | 389 32% | |
| Brightness Distribution (%) | 90 | 95 6% | 93 3% | 75 -17% | 89 -1% | 85 -6% | |
| Black Level * (cd/m²) | 0.34 | 0.29 15% | 0.44 -29% | 0.63 -85% | 0.44 -29% | 0.37 -9% | |
| Contrast (:1) | 905 | 1103 22% | 534 -41% | 449 -50% | 516 -43% | 1092 21% | |
| Colorchecker dE 2000 * | 7.31 | 1.2 84% | 11.73 -60% | 4.02 45% | 6.6 10% | 3.72 49% | |
| Colorchecker dE 2000 max. * | 11.92 | 3.2 73% | 18.8 -58% | 8.77 26% | 12.2 -2% | 7.38 38% | |
| Colorchecker dE 2000 calibrated * | 3.94 | 0.5 87% | 3.73 5% | 4.03 -2% | 1.9 52% | 2.06 48% | |
| Greyscale dE 2000 * | 6.8 | 0.8 88% | 12.64 -86% | 0.8 88% | 7.9 -16% | 4.44 35% | |
| Gamma | 1.909 115% | 2.2 100% | 2.61 84% | 2.35 94% | 2.16 102% | 2.34 94% | |
| CCT | 7695 84% | 6548 99% | 14819 44% | 6552 99% | 8879 73% | 7095 92% | |
| Color Space (Percent of AdobeRGB 1998) (%) | 57 | 62.1 9% | 34 -40% | 38 -33% | 60 5% | ||
| Color Space (Percent of sRGB) (%) | 87 | 96 10% | 54 -38% | 58 -33% | 93 7% | ||
| Totalt genomsnitt (program/inställningar) | 12% /
26% | -19% /
-30% | -22% /
-15% | -12% /
-12% | -4% /
-6% | -9% /
10% |
* ... mindre är bättre
Visa svarstider
| ↔ Svarstid svart till vitt | ||
|---|---|---|
| 28 ms ... stiga ↗ och falla ↘ kombinerat | ↗ 14.8 ms stiga | 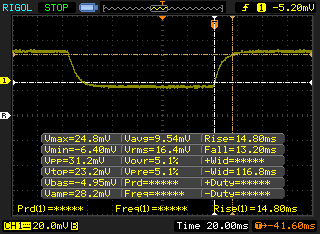 |
| ↘ 13.2 ms hösten | ||
| Skärmen visar relativt långsamma svarsfrekvenser i våra tester och kan vara för långsam för spelare. I jämförelse sträcker sig alla testade enheter från 0.1 (minst) till 240 (maximalt) ms. » 71 % av alla enheter är bättre. Detta innebär att den uppmätta svarstiden är sämre än genomsnittet av alla testade enheter (19.8 ms). | ||
| ↔ Svarstid 50 % grått till 80 % grått | ||
| 34 ms ... stiga ↗ och falla ↘ kombinerat | ↗ 15.2 ms stiga | 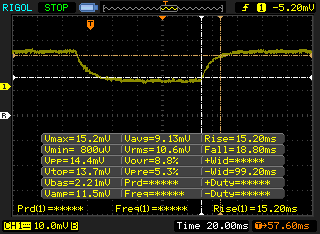 |
| ↘ 18.8 ms hösten | ||
| Skärmen visar långsamma svarsfrekvenser i våra tester och kommer att vara otillfredsställande för spelare. I jämförelse sträcker sig alla testade enheter från 0.165 (minst) till 636 (maximalt) ms. » 47 % av alla enheter är bättre. Det betyder att den uppmätta svarstiden liknar genomsnittet av alla testade enheter (31 ms). | ||
Skärmflimmer / PWM (Puls-Width Modulation)
| Skärmflimmer / PWM upptäckt | 2000 Hz | ≤ 99 % ljusstyrka inställning | 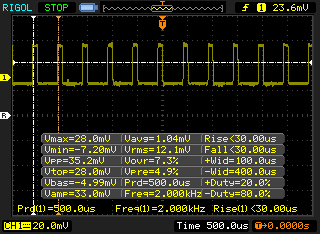 |
Displayens bakgrundsbelysning flimrar vid 2000 Hz (i värsta fall, t.ex. med PWM) Flimrande upptäckt vid en ljusstyrkeinställning på 99 % och lägre. Det ska inte finnas något flimmer eller PWM över denna ljusstyrkeinställning. Frekvensen för 2000 Hz är ganska hög, så de flesta användare som är känsliga för PWM bör inte märka något flimmer. Som jämförelse: 52 % av alla testade enheter använder inte PWM för att dämpa skärmen. Om PWM upptäcktes mättes ett medelvärde av 7775 (minst: 5 - maximum: 343500) Hz. | |||
| Cinebench R10 | |
| Rendering Multiple CPUs 32Bit | |
| Genomsnitt av klass Subnotebook (14395 - 51868, n=13, senaste 2 åren) | |
| Genomsnitt Intel Core m3-6Y30 (6194 - 7355, n=4) | |
| Chuwi LapBook SE | |
| Rendering Single 32Bit | |
| Genomsnitt av klass Subnotebook (2299 - 10697, n=13, senaste 2 åren) | |
| Genomsnitt Intel Core m3-6Y30 (3286 - 3477, n=4) | |
| Chuwi LapBook SE | |
| wPrime 2.10 - 1024m | |
| Genomsnitt Intel Core m3-6Y30 (788 - 864, n=3) | |
| Chuwi LapBook SE | |
| Genomsnitt av klass Subnotebook (145.3 - 1250, n=9, senaste 2 åren) | |
* ... mindre är bättre
| PCMark 8 Home Score Accelerated v2 | 2650 poäng | |
| PCMark 8 Work Score Accelerated v2 | 3735 poäng | |
| PCMark 10 Score | 2138 poäng | |
Hjälp | ||
| Chuwi AeroBook 13 inch 2019 Netac SSD 256GB | Apple MacBook Air 2018 Apple SSD AP0256 | Apple MacBook 12 2017 Apple SSD AP0256 | Asus E203MA-FD825TS SanDisk DA4064 | Lenovo IdeaPad 330S-15IKB-81F500N5GE | Chuwi LapBook SE SanDisk DF4032 | Dell XPS 13 9380 2019 SK hynix PC401 HFS256GD9TNG | Genomsnitt Netac SSD 256GB | |
|---|---|---|---|---|---|---|---|---|
| CrystalDiskMark 5.2 / 6 | 113% | 99% | -59% | 19% | -78% | 99% | -7% | |
| Write 4K (MB/s) | 81.8 | 118 44% | 95.7 17% | 38.28 -53% | 11.17 -86% | 84.6 3% | 86 ? 5% | |
| Read 4K (MB/s) | 33.97 | 29.97 -12% | 22.8 -33% | 12.14 -64% | 7.2 -79% | 38.52 13% | 23.2 ? -32% | |
| Write Seq (MB/s) | 422.4 | 1000 137% | 867 105% | 220.2 -48% | 158.1 -63% | 87.7 -79% | 557 32% | 364 ? -14% |
| Read Seq (MB/s) | 502 | 1218 143% | 940 87% | 262 -48% | 892 78% | 247 -51% | 1393 177% | 432 ? -14% |
| Write 4K Q32T1 (MB/s) | 152.9 | 232.1 52% | 342 124% | 45.72 -70% | 162.2 6% | 12.29 -92% | 339.5 122% | 188.9 ? 24% |
| Read 4K Q32T1 (MB/s) | 175.4 | 254 45% | 437.5 149% | 61 -65% | 320.4 83% | 32.46 -81% | 255.4 46% | 185.9 ? 6% |
| Write Seq Q32T1 (MB/s) | 464.9 | 1001 115% | 1085 133% | 167.1 -64% | 160.2 -66% | 92 -80% | 558 20% | 398 ? -14% |
| Read Seq Q32T1 (MB/s) | 530 | 2555 382% | 1634 208% | 211.5 -60% | 933 76% | 150.1 -72% | 2541 379% | 456 ? -14% |

| 3DMark 11 Performance | 1121 poäng | |
| 3DMark Cloud Gate Standard Score | 4145 poäng | |
| 3DMark Fire Strike Score | 617 poäng | |
Hjälp | ||
| låg | med. | hög | ultra | |
|---|---|---|---|---|
| BioShock Infinite (2013) | 32 | 13 | ||
| Rocket League (2017) | 28 | 11 | ||
| Team Fortress 2 (2017) | 42 | 30 | 14 |
(±) Den maximala temperaturen på ovansidan är 44 °C / 111 F, jämfört med genomsnittet av 35.9 °C / 97 F , allt från 21.4 till 59 °C för klassen Subnotebook.
(-) Botten värms upp till maximalt 53.4 °C / 128 F, jämfört med genomsnittet av 39.2 °C / 103 F
(+) Vid tomgångsbruk är medeltemperaturen för ovansidan 31.9 °C / 89 F, jämfört med enhetsgenomsnittet på 30.8 °C / ### class_avg_f### F.
(±) Handledsstöden och pekplattan kan bli väldigt varma vid beröring med maximalt 36.2 °C / 97.2 F.
(-) Medeltemperaturen för handledsstödsområdet på liknande enheter var 28.2 °C / 82.8 F (-8 °C / -14.4 F).
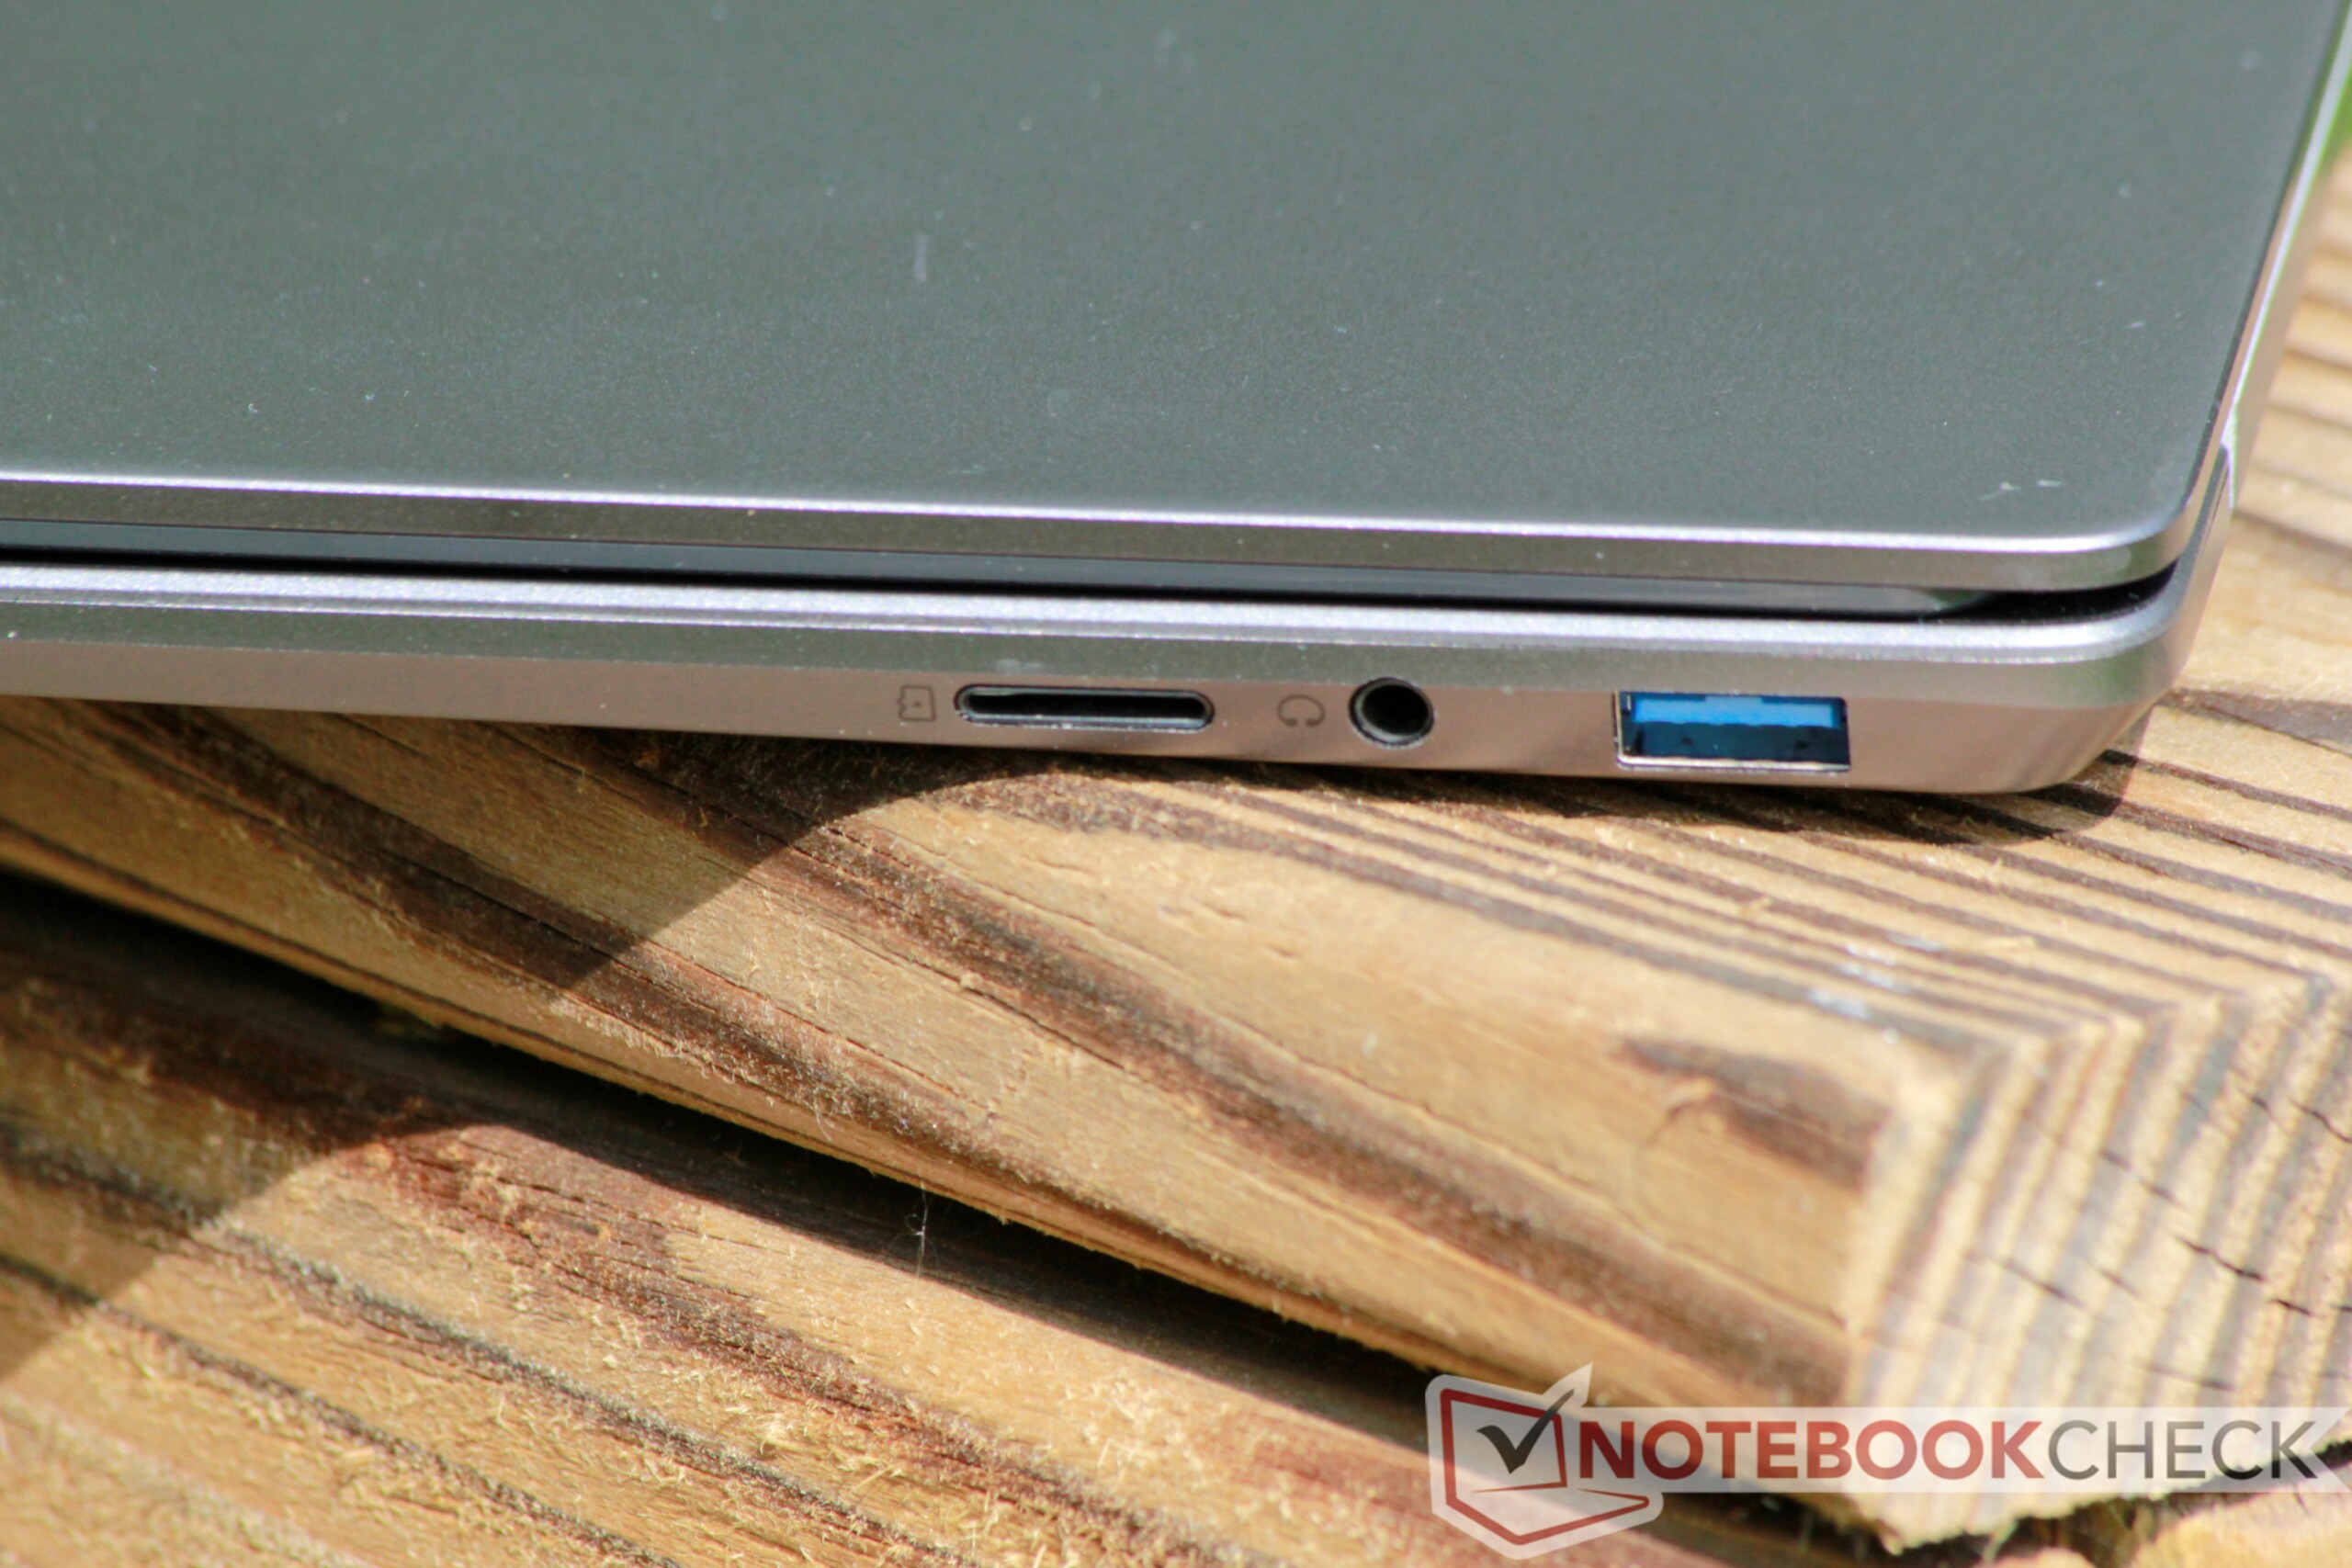
Chuwi AeroBook 13 inch 2019 ljudanalys
(±) | högtalarljudstyrkan är genomsnittlig men bra (76.7 dB)
Bas 100 - 315 Hz
(-) | nästan ingen bas - i genomsnitt 23% lägre än medianen
(+) | basen är linjär (5.2% delta till föregående frekvens)
Mellan 400 - 2000 Hz
(±) | högre mellan - i genomsnitt 8.5% högre än median
(±) | linjäriteten för mids är genomsnittlig (12.7% delta till föregående frekvens)
Högsta 2 - 16 kHz
(±) | högre toppar - i genomsnitt 8.6% högre än medianen
(±) | linjäriteten för toppar är genomsnittlig (11.2% delta till föregående frekvens)
Totalt 100 - 16 000 Hz
(-) | det totala ljudet är inte linjärt (37.3% skillnad mot median)
Jämfört med samma klass
» 97% av alla testade enheter i den här klassen var bättre, 1% liknande, 1% sämre
» Den bästa hade ett delta på 5%, genomsnittet var 18%, sämst var 53%
Jämfört med alla testade enheter
» 94% av alla testade enheter var bättre, 1% liknande, 5% sämre
» Den bästa hade ett delta på 4%, genomsnittet var 24%, sämst var 134%
Apple MacBook Air 2018 ljudanalys
(±) | högtalarljudstyrkan är genomsnittlig men bra (75 dB)
Bas 100 - 315 Hz
(±) | reducerad bas - i genomsnitt 8.1% lägre än medianen
(±) | linjäriteten för basen är genomsnittlig (10% delta till föregående frekvens)
Mellan 400 - 2000 Hz
(+) | balanserad mellan - endast 2.9% från medianen
(+) | mids är linjära (5.6% delta till föregående frekvens)
Högsta 2 - 16 kHz
(+) | balanserade toppar - endast 2.2% från medianen
(+) | toppar är linjära (4.5% delta till föregående frekvens)
Totalt 100 - 16 000 Hz
(+) | det totala ljudet är linjärt (12.3% skillnad mot median)
Jämfört med samma klass
» 16% av alla testade enheter i den här klassen var bättre, 5% liknande, 80% sämre
» Den bästa hade ett delta på 5%, genomsnittet var 18%, sämst var 53%
Jämfört med alla testade enheter
» 10% av alla testade enheter var bättre, 3% liknande, 87% sämre
» Den bästa hade ett delta på 4%, genomsnittet var 24%, sämst var 134%
Apple MacBook 12 2017 ljudanalys
(+) | högtalare kan spela relativt högt (83.9 dB)
Bas 100 - 315 Hz
(-) | nästan ingen bas - i genomsnitt 15% lägre än medianen
(±) | linjäriteten för basen är genomsnittlig (8.8% delta till föregående frekvens)
Mellan 400 - 2000 Hz
(+) | balanserad mellan - endast 2% från medianen
(+) | mids är linjära (3.8% delta till föregående frekvens)
Högsta 2 - 16 kHz
(+) | balanserade toppar - endast 2.3% från medianen
(+) | toppar är linjära (3.3% delta till föregående frekvens)
Totalt 100 - 16 000 Hz
(+) | det totala ljudet är linjärt (11.6% skillnad mot median)
Jämfört med samma klass
» 12% av alla testade enheter i den här klassen var bättre, 3% liknande, 84% sämre
» Den bästa hade ett delta på 5%, genomsnittet var 18%, sämst var 53%
Jämfört med alla testade enheter
» 8% av alla testade enheter var bättre, 2% liknande, 90% sämre
» Den bästa hade ett delta på 4%, genomsnittet var 24%, sämst var 134%
| Av/Standby | |
| Låg belastning | |
| Hög belastning |
|
Förklaring:
min: | |
| Chuwi AeroBook 13 inch 2019 6Y30, HD Graphics 515, Netac SSD 256GB, IPS, 1920x1080, 13.3" | Apple MacBook Air 2018 i5-8210Y, UHD Graphics 617, Apple SSD AP0256, IPS, 2560x1600, 13.3" | Apple MacBook 12 2017 m3-7Y32, HD Graphics 615, Apple SSD AP0256, LED IPS, 2304x1440, 12" | Asus E203MA-FD825TS Pentium N5000, UHD Graphics 605, SanDisk DA4064, TN LED, 1366x768, 11.6" | Lenovo IdeaPad 330S-15IKB-81F500N5GE i5-8250U, UHD Graphics 620, , IPS, 1920x1080, 15.6" | Chuwi LapBook SE Celeron N4100, UHD Graphics 600, SanDisk DF4032, , 1920x1080, 13.3" | Dell XPS 13 9380 2019 i5-8265U, UHD Graphics 620, SK hynix PC401 HFS256GD9TNG, IPS, 3840x2160, 13.3" | |
|---|---|---|---|---|---|---|---|
| Power Consumption | 7% | 28% | 49% | -9% | 26% | -36% | |
| Idle Minimum * (Watt) | 4.6 | 2.2 52% | 2 57% | 1.9 59% | 5 -9% | 2.7 41% | 4.8 -4% |
| Idle Average * (Watt) | 7.8 | 5.7 27% | 5.4 31% | 3.5 55% | 7.6 3% | 6.3 19% | 8.6 -10% |
| Idle Maximum * (Watt) | 8.9 | 10.3 -16% | 6.6 26% | 3.9 56% | 8.6 3% | 7.6 15% | 10.4 -17% |
| Load Average * (Watt) | 20.9 | 25.6 -22% | 22 -5% | 12.7 39% | 25.6 -22% | 12.6 40% | 37.9 -81% |
| Load Maximum * (Watt) | 28.6 | 30.6 -7% | 20 30% | 19 34% | 34 -19% | 24.6 14% | 48.5 -70% |
* ... mindre är bättre
| Chuwi AeroBook 13 inch 2019 6Y30, HD Graphics 515, 38 Wh | Apple MacBook Air 2018 i5-8210Y, UHD Graphics 617, 50.3 Wh | Apple MacBook 12 2017 m3-7Y32, HD Graphics 615, 41.4 Wh | Asus E203MA-FD825TS Pentium N5000, UHD Graphics 605, 38 Wh | Lenovo IdeaPad 330S-15IKB-81F500N5GE i5-8250U, UHD Graphics 620, 52 Wh | Chuwi LapBook SE Celeron N4100, UHD Graphics 600, 37 Wh | Dell XPS 13 9380 2019 i5-8265U, UHD Graphics 620, 52 Wh | |
|---|---|---|---|---|---|---|---|
| Batteridrifttid | 54% | 45% | 34% | 14% | 130% | 53% | |
| Reader / Idle (h) | 9.3 | 12.6 35% | 17.2 85% | ||||
| WiFi v1.3 (h) | 6.2 | 11.1 79% | 9 45% | 8.3 34% | 5.8 -6% | 7.4 19% | 8.3 34% |
| Load (h) | 1.7 | 2.2 29% | 1.9 12% | 5.8 241% | 2.4 41% |
För
Emot
Läs den fullständiga versionen av den här recensionen på engelska här.
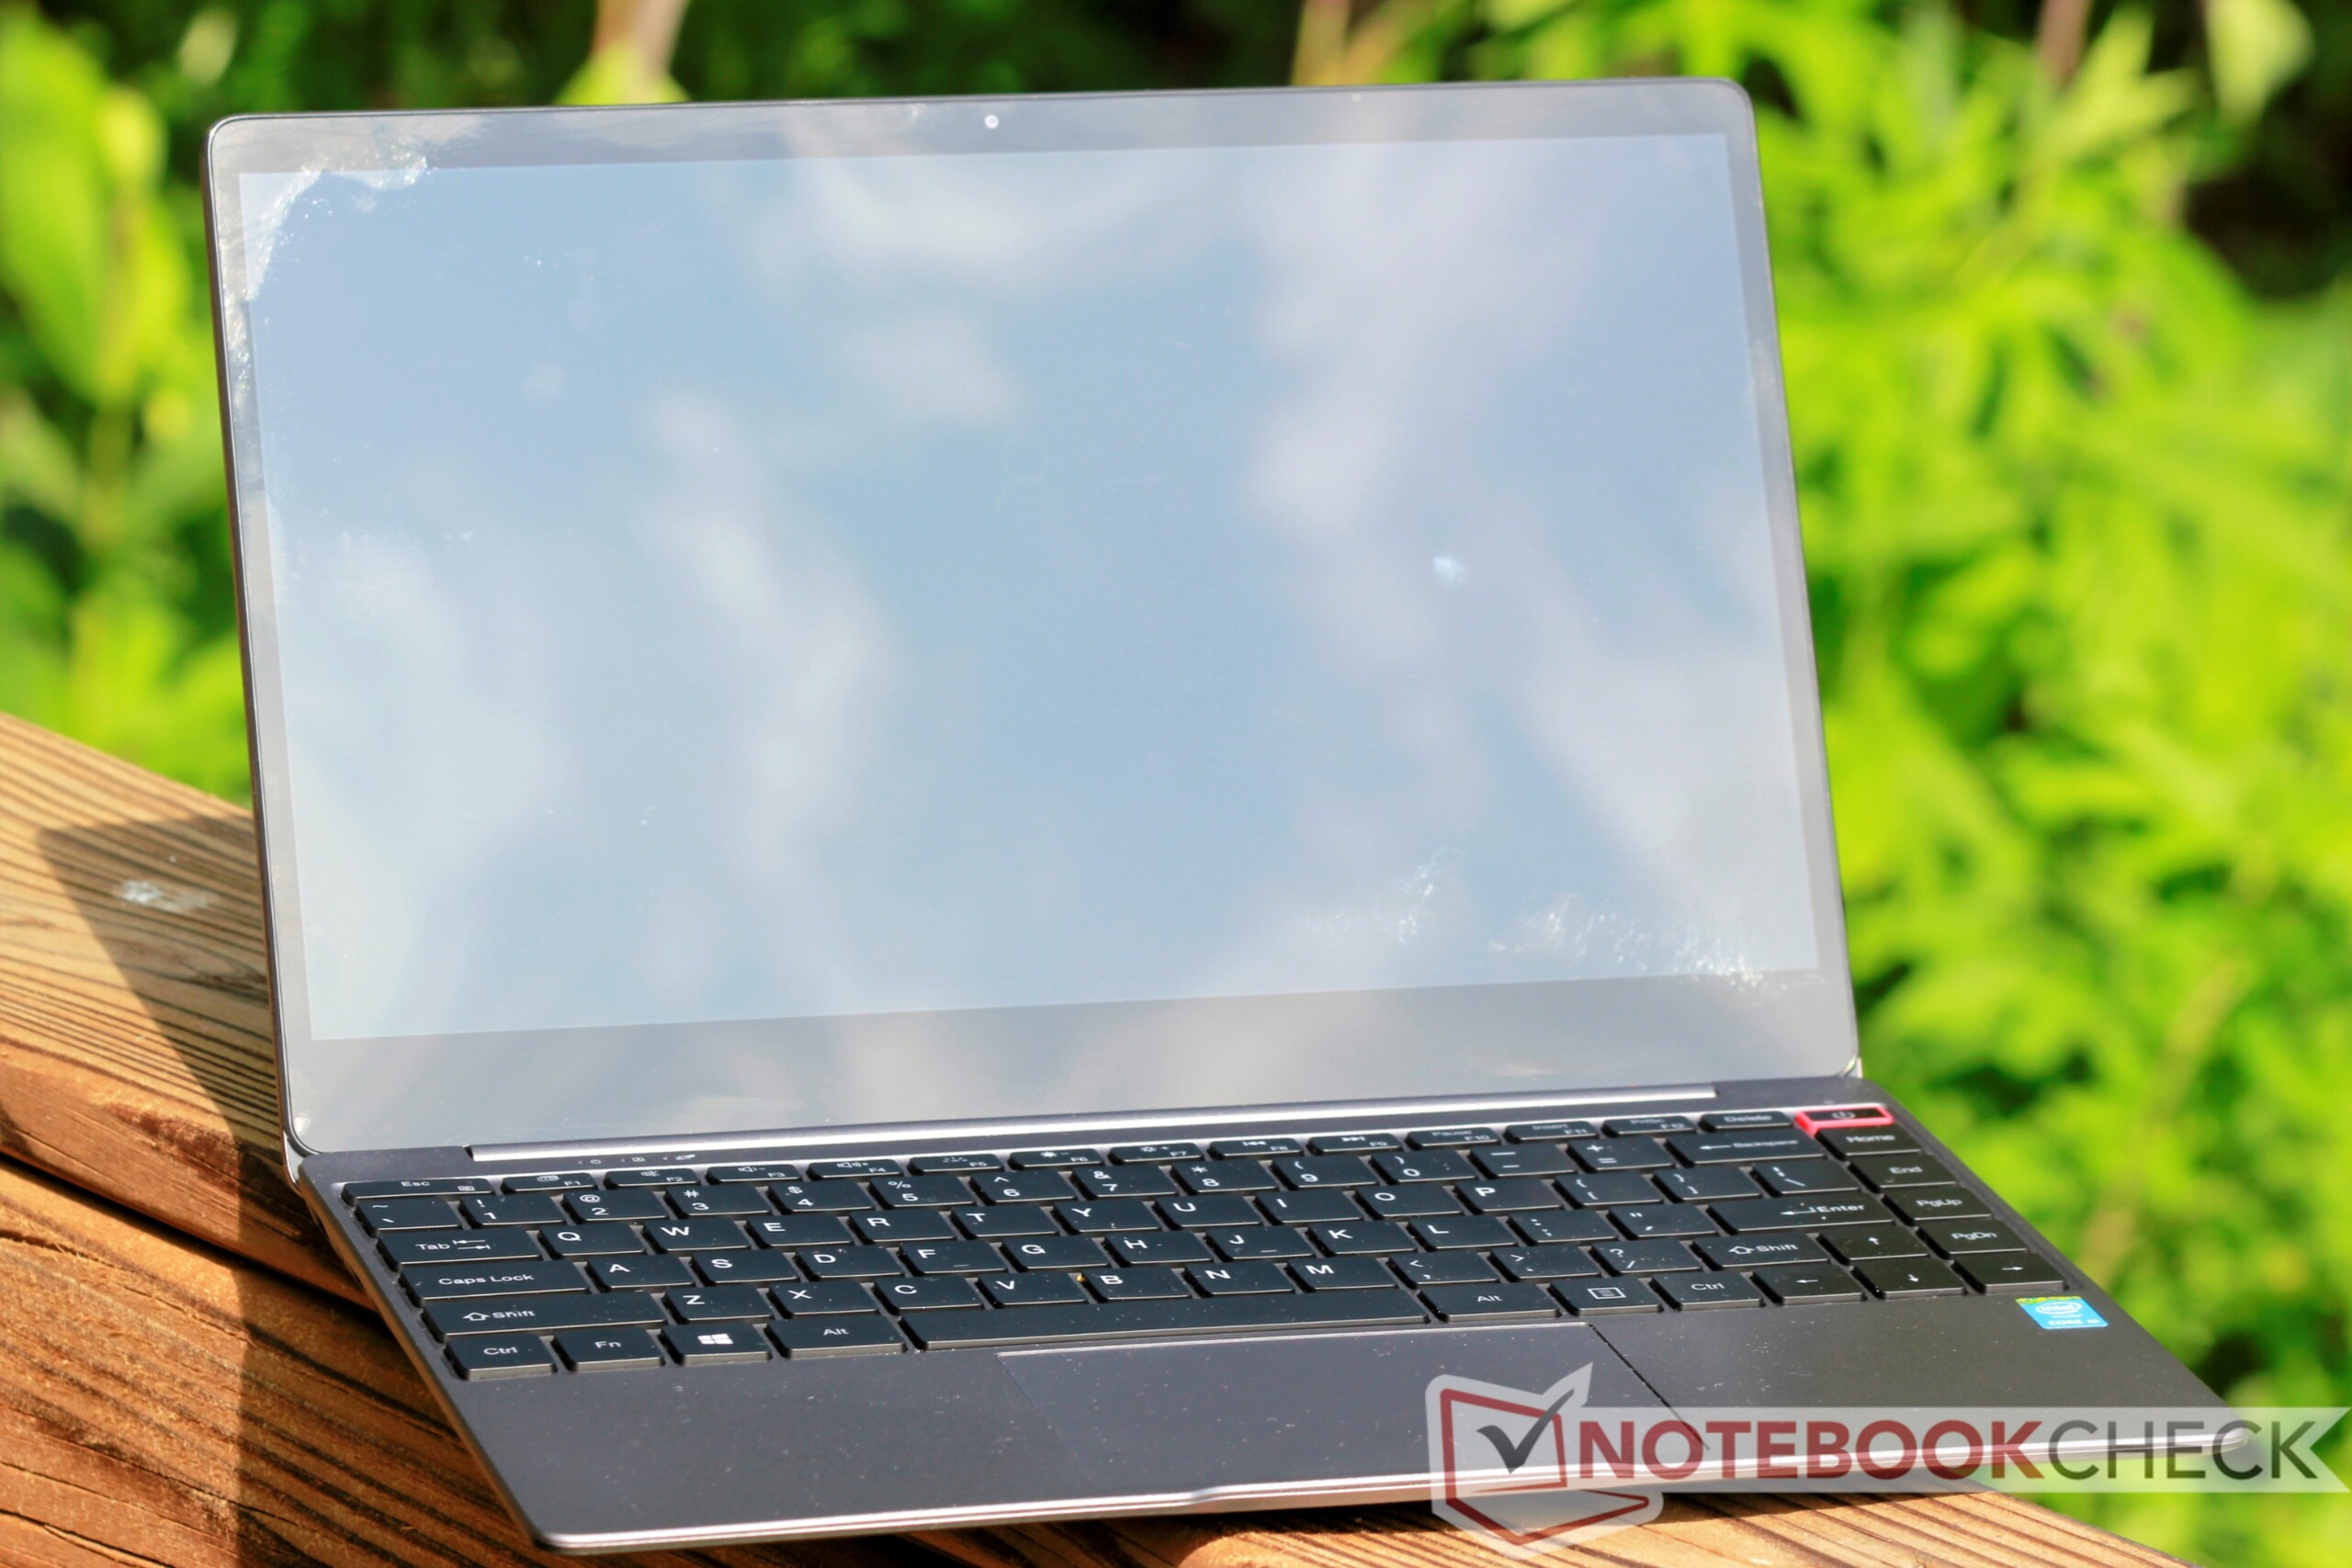
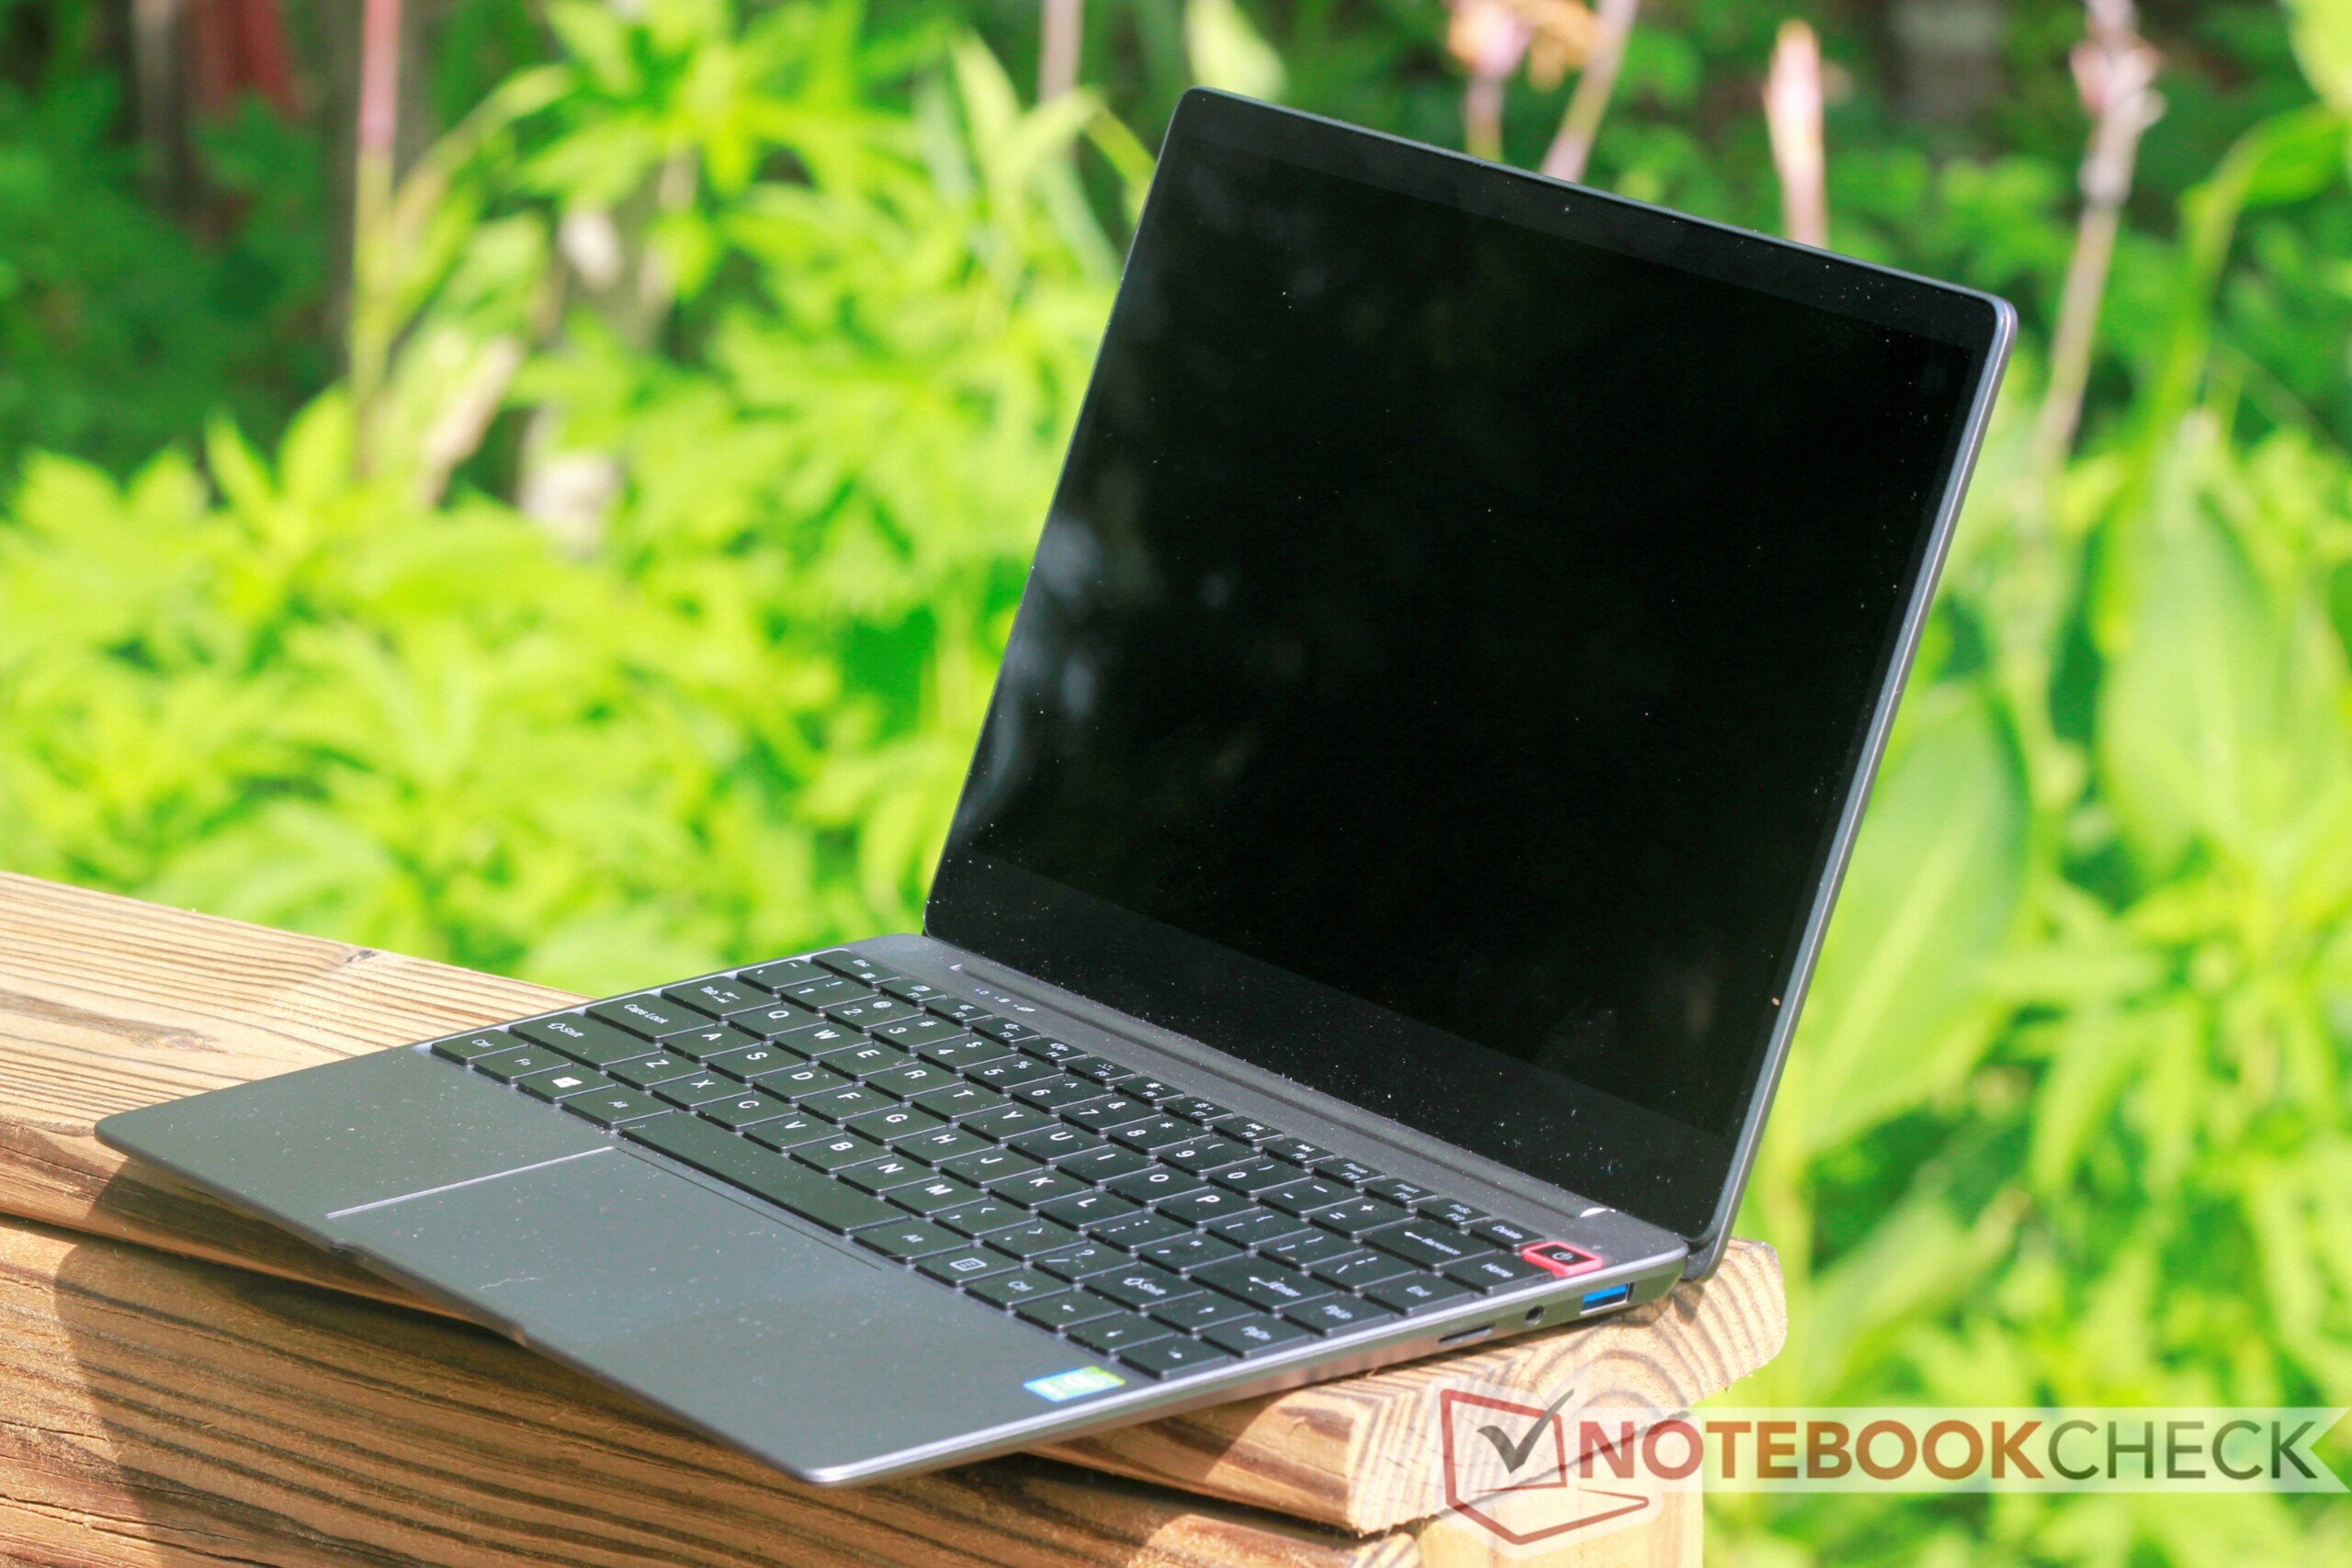
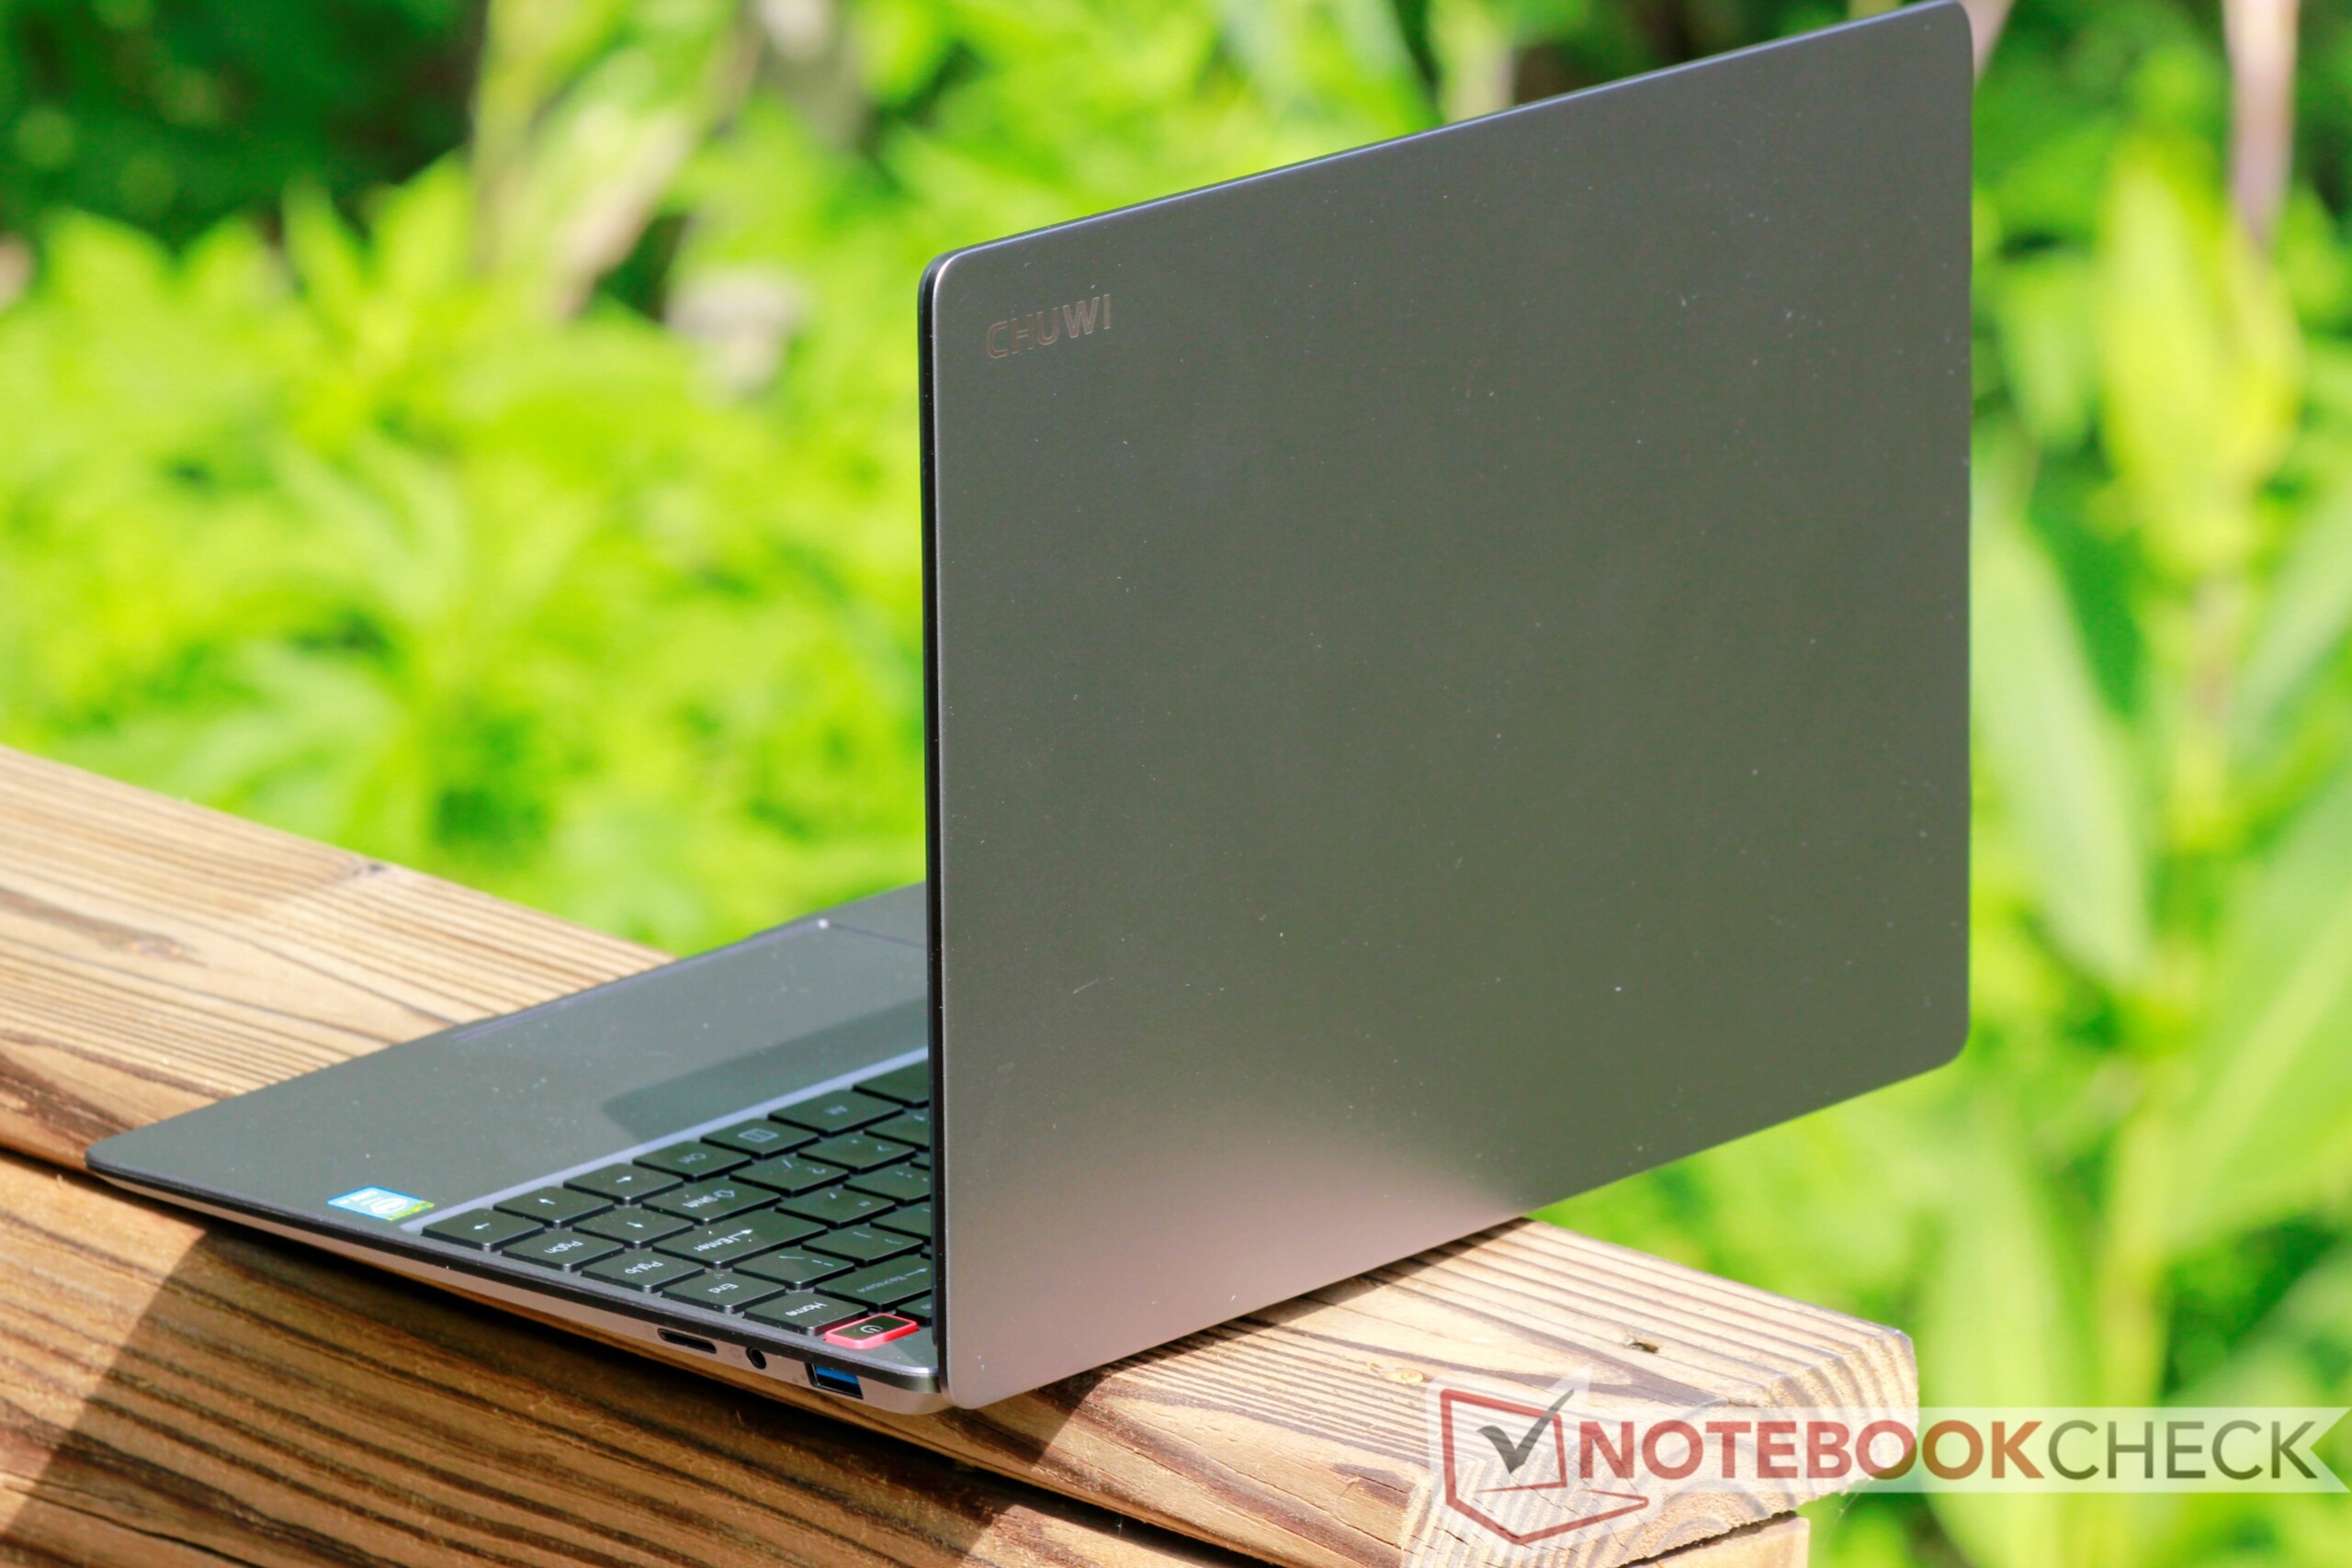
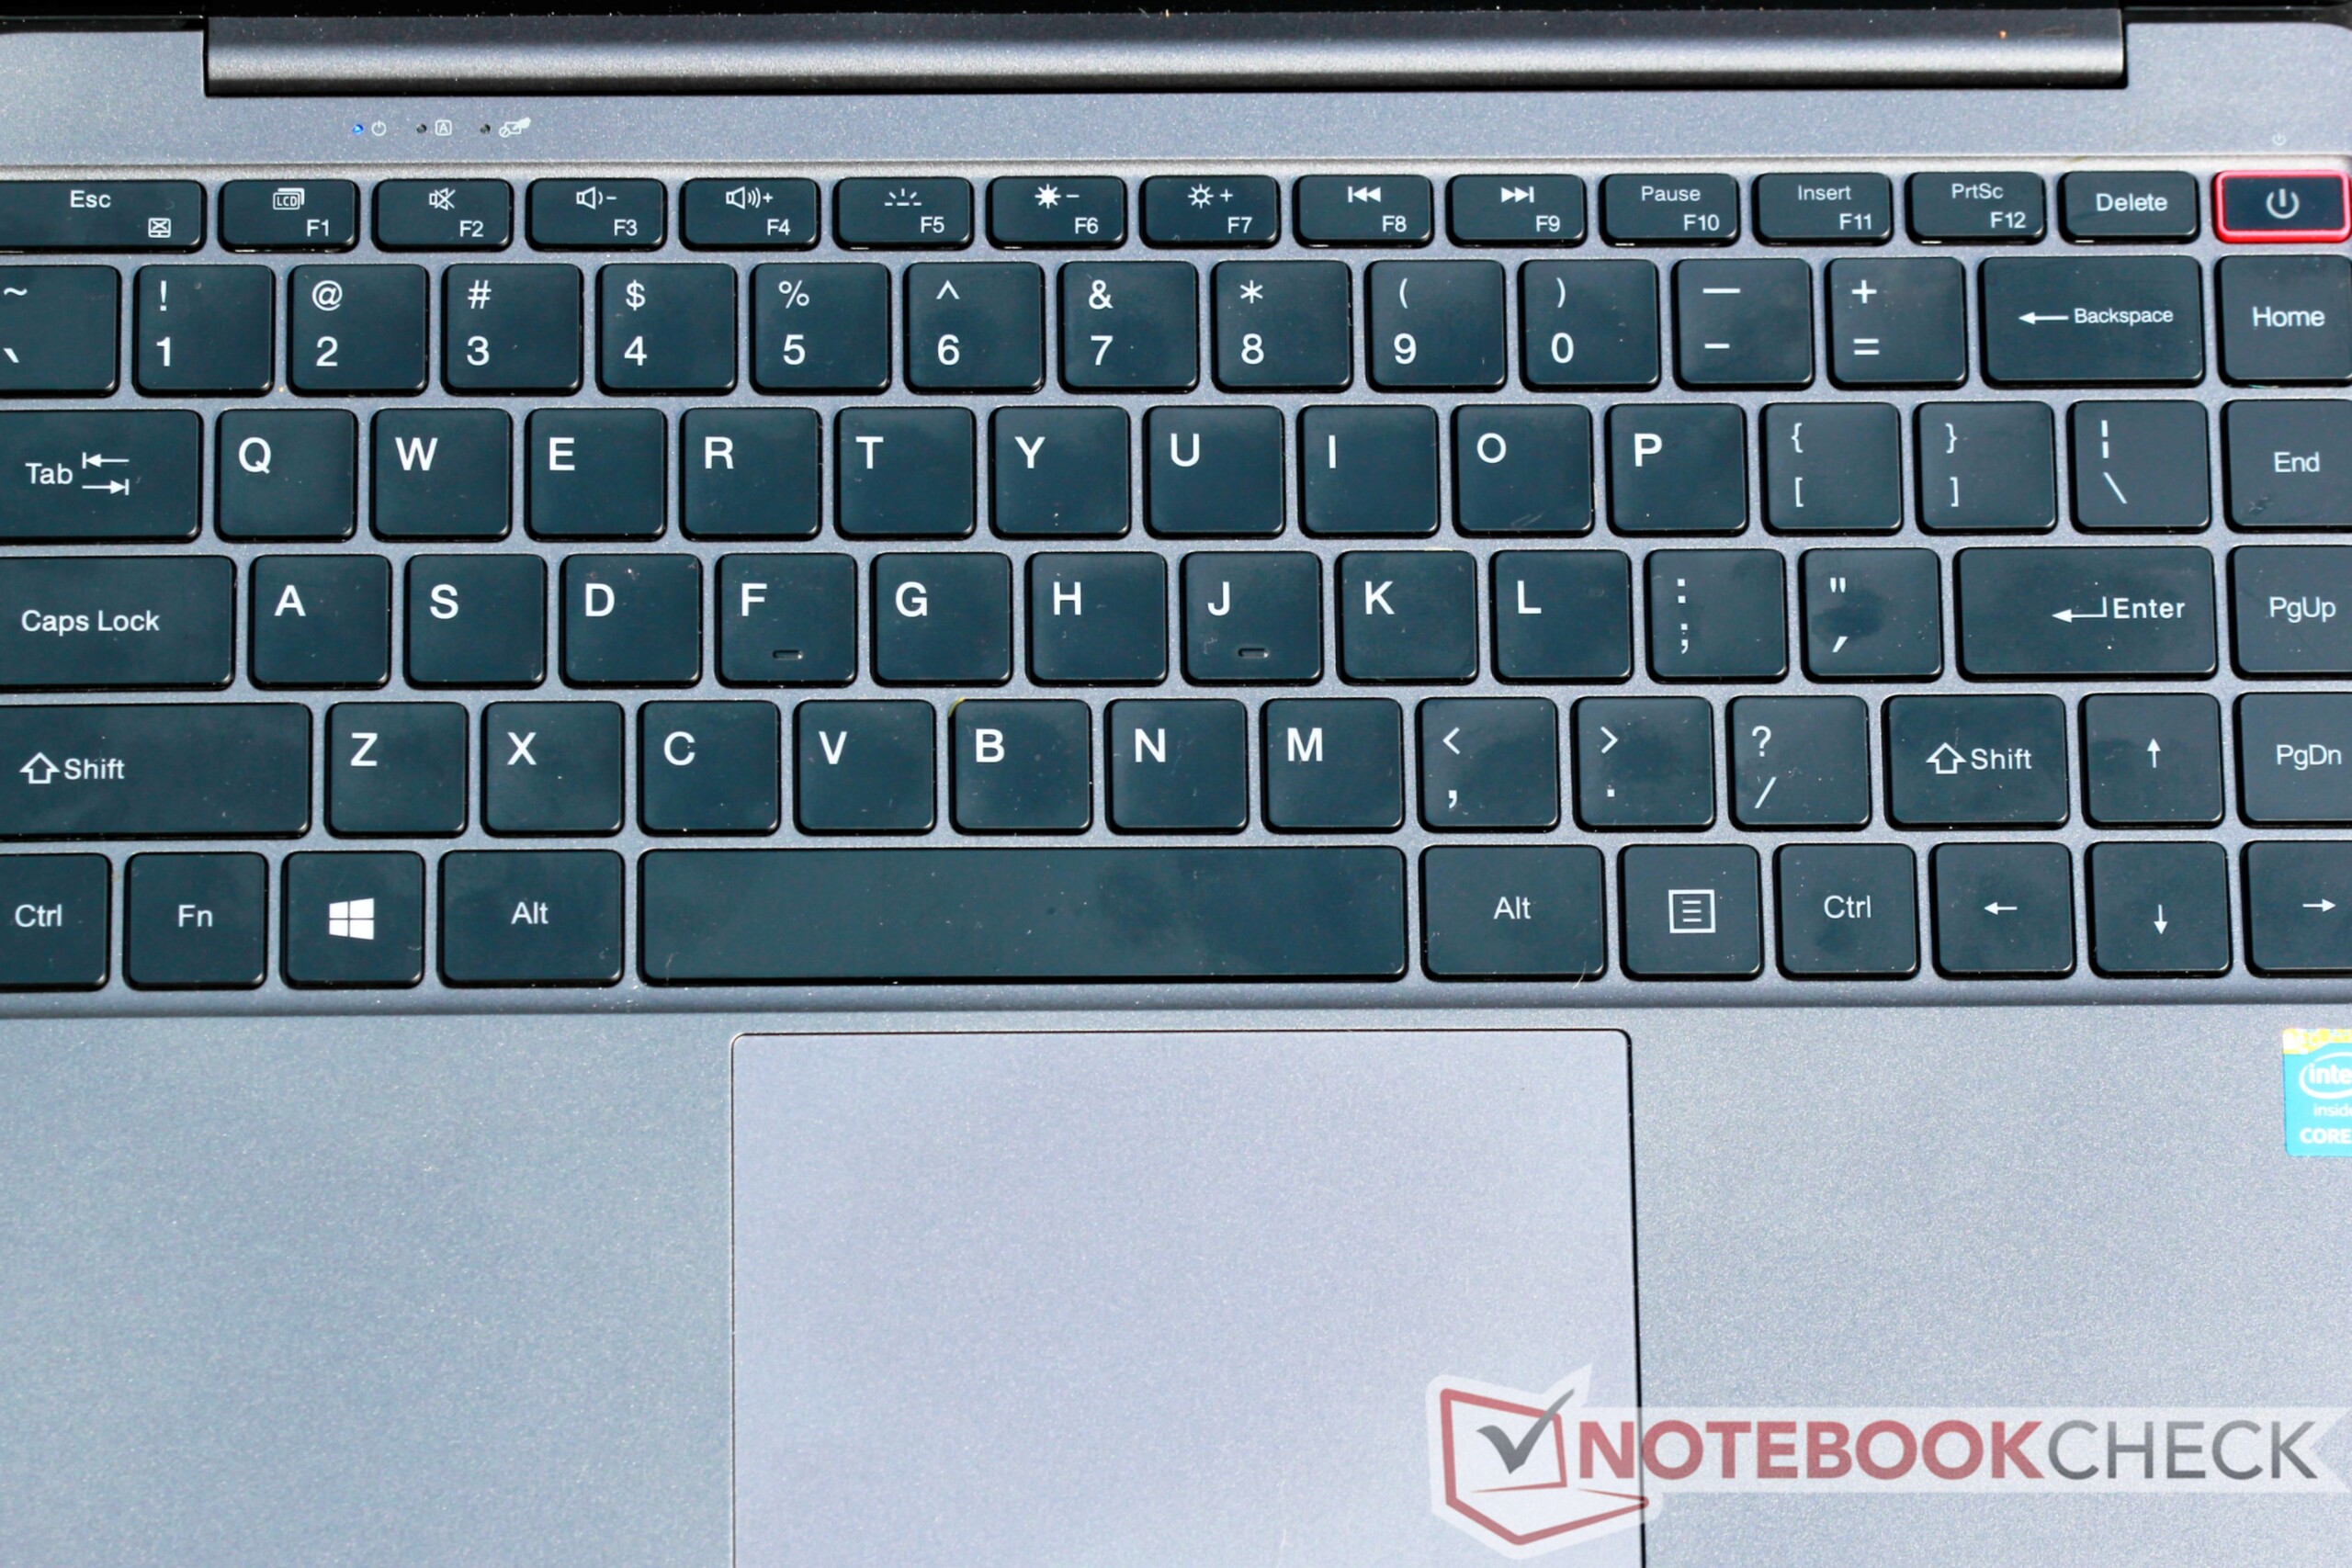
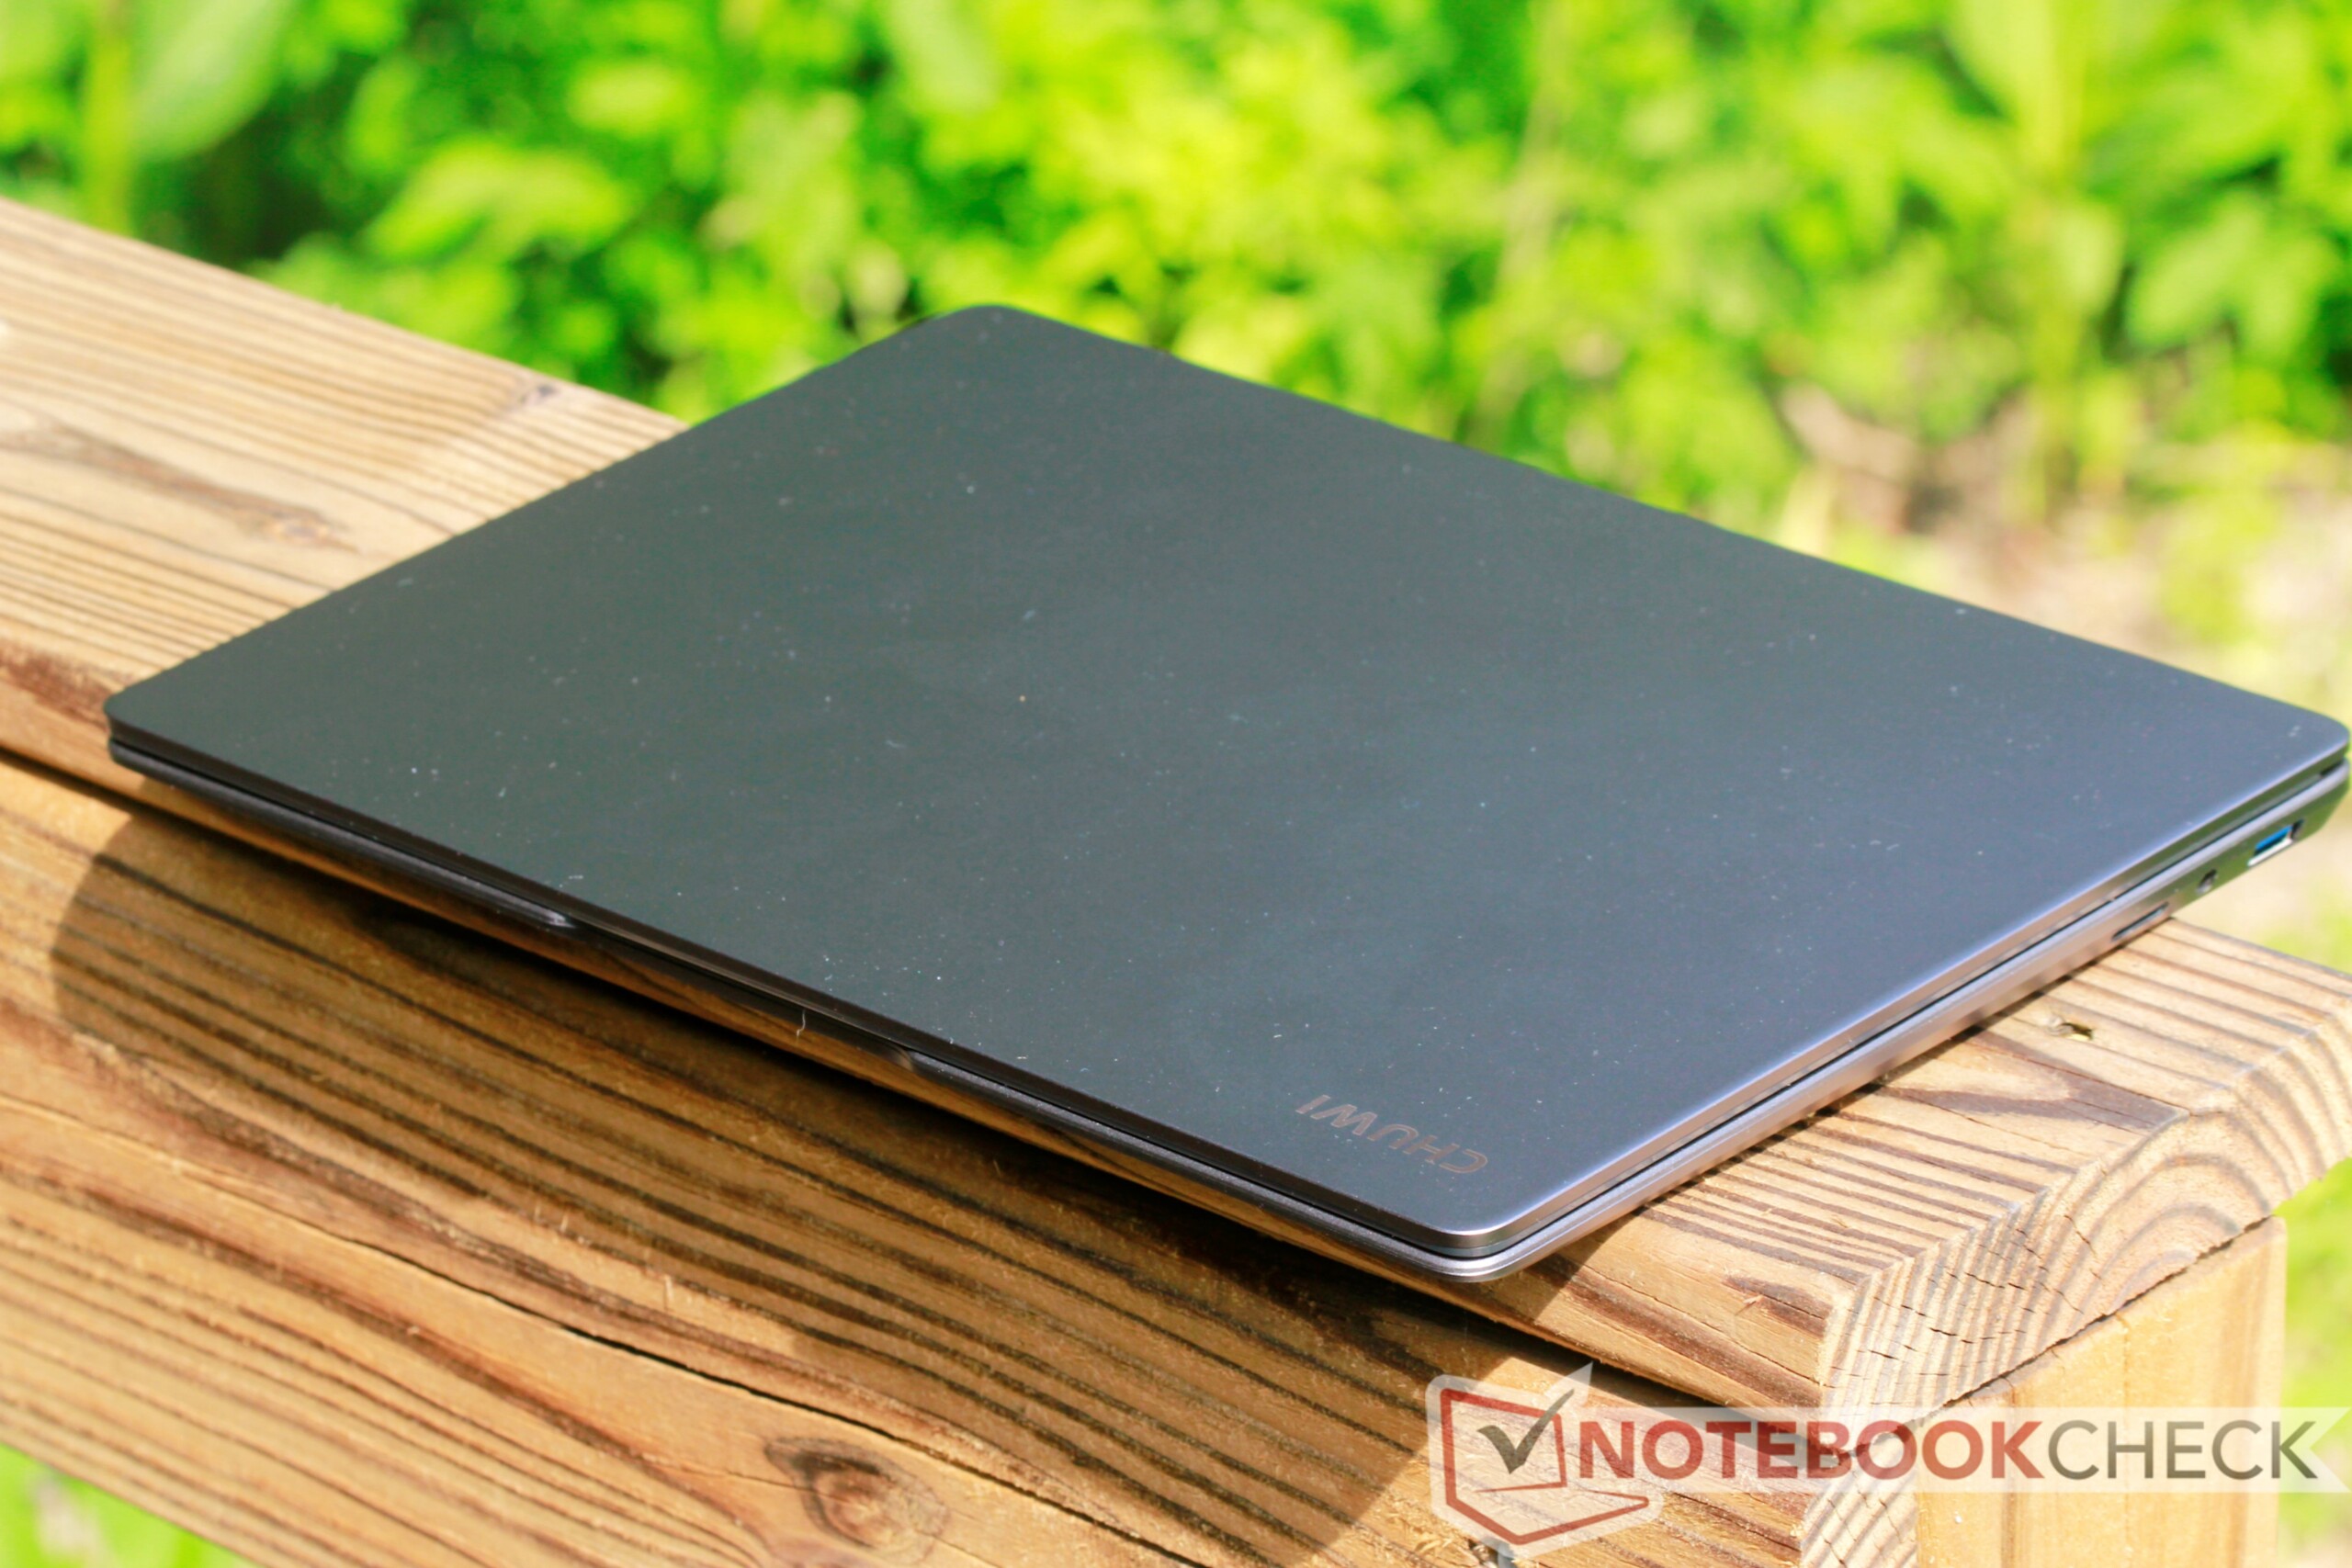
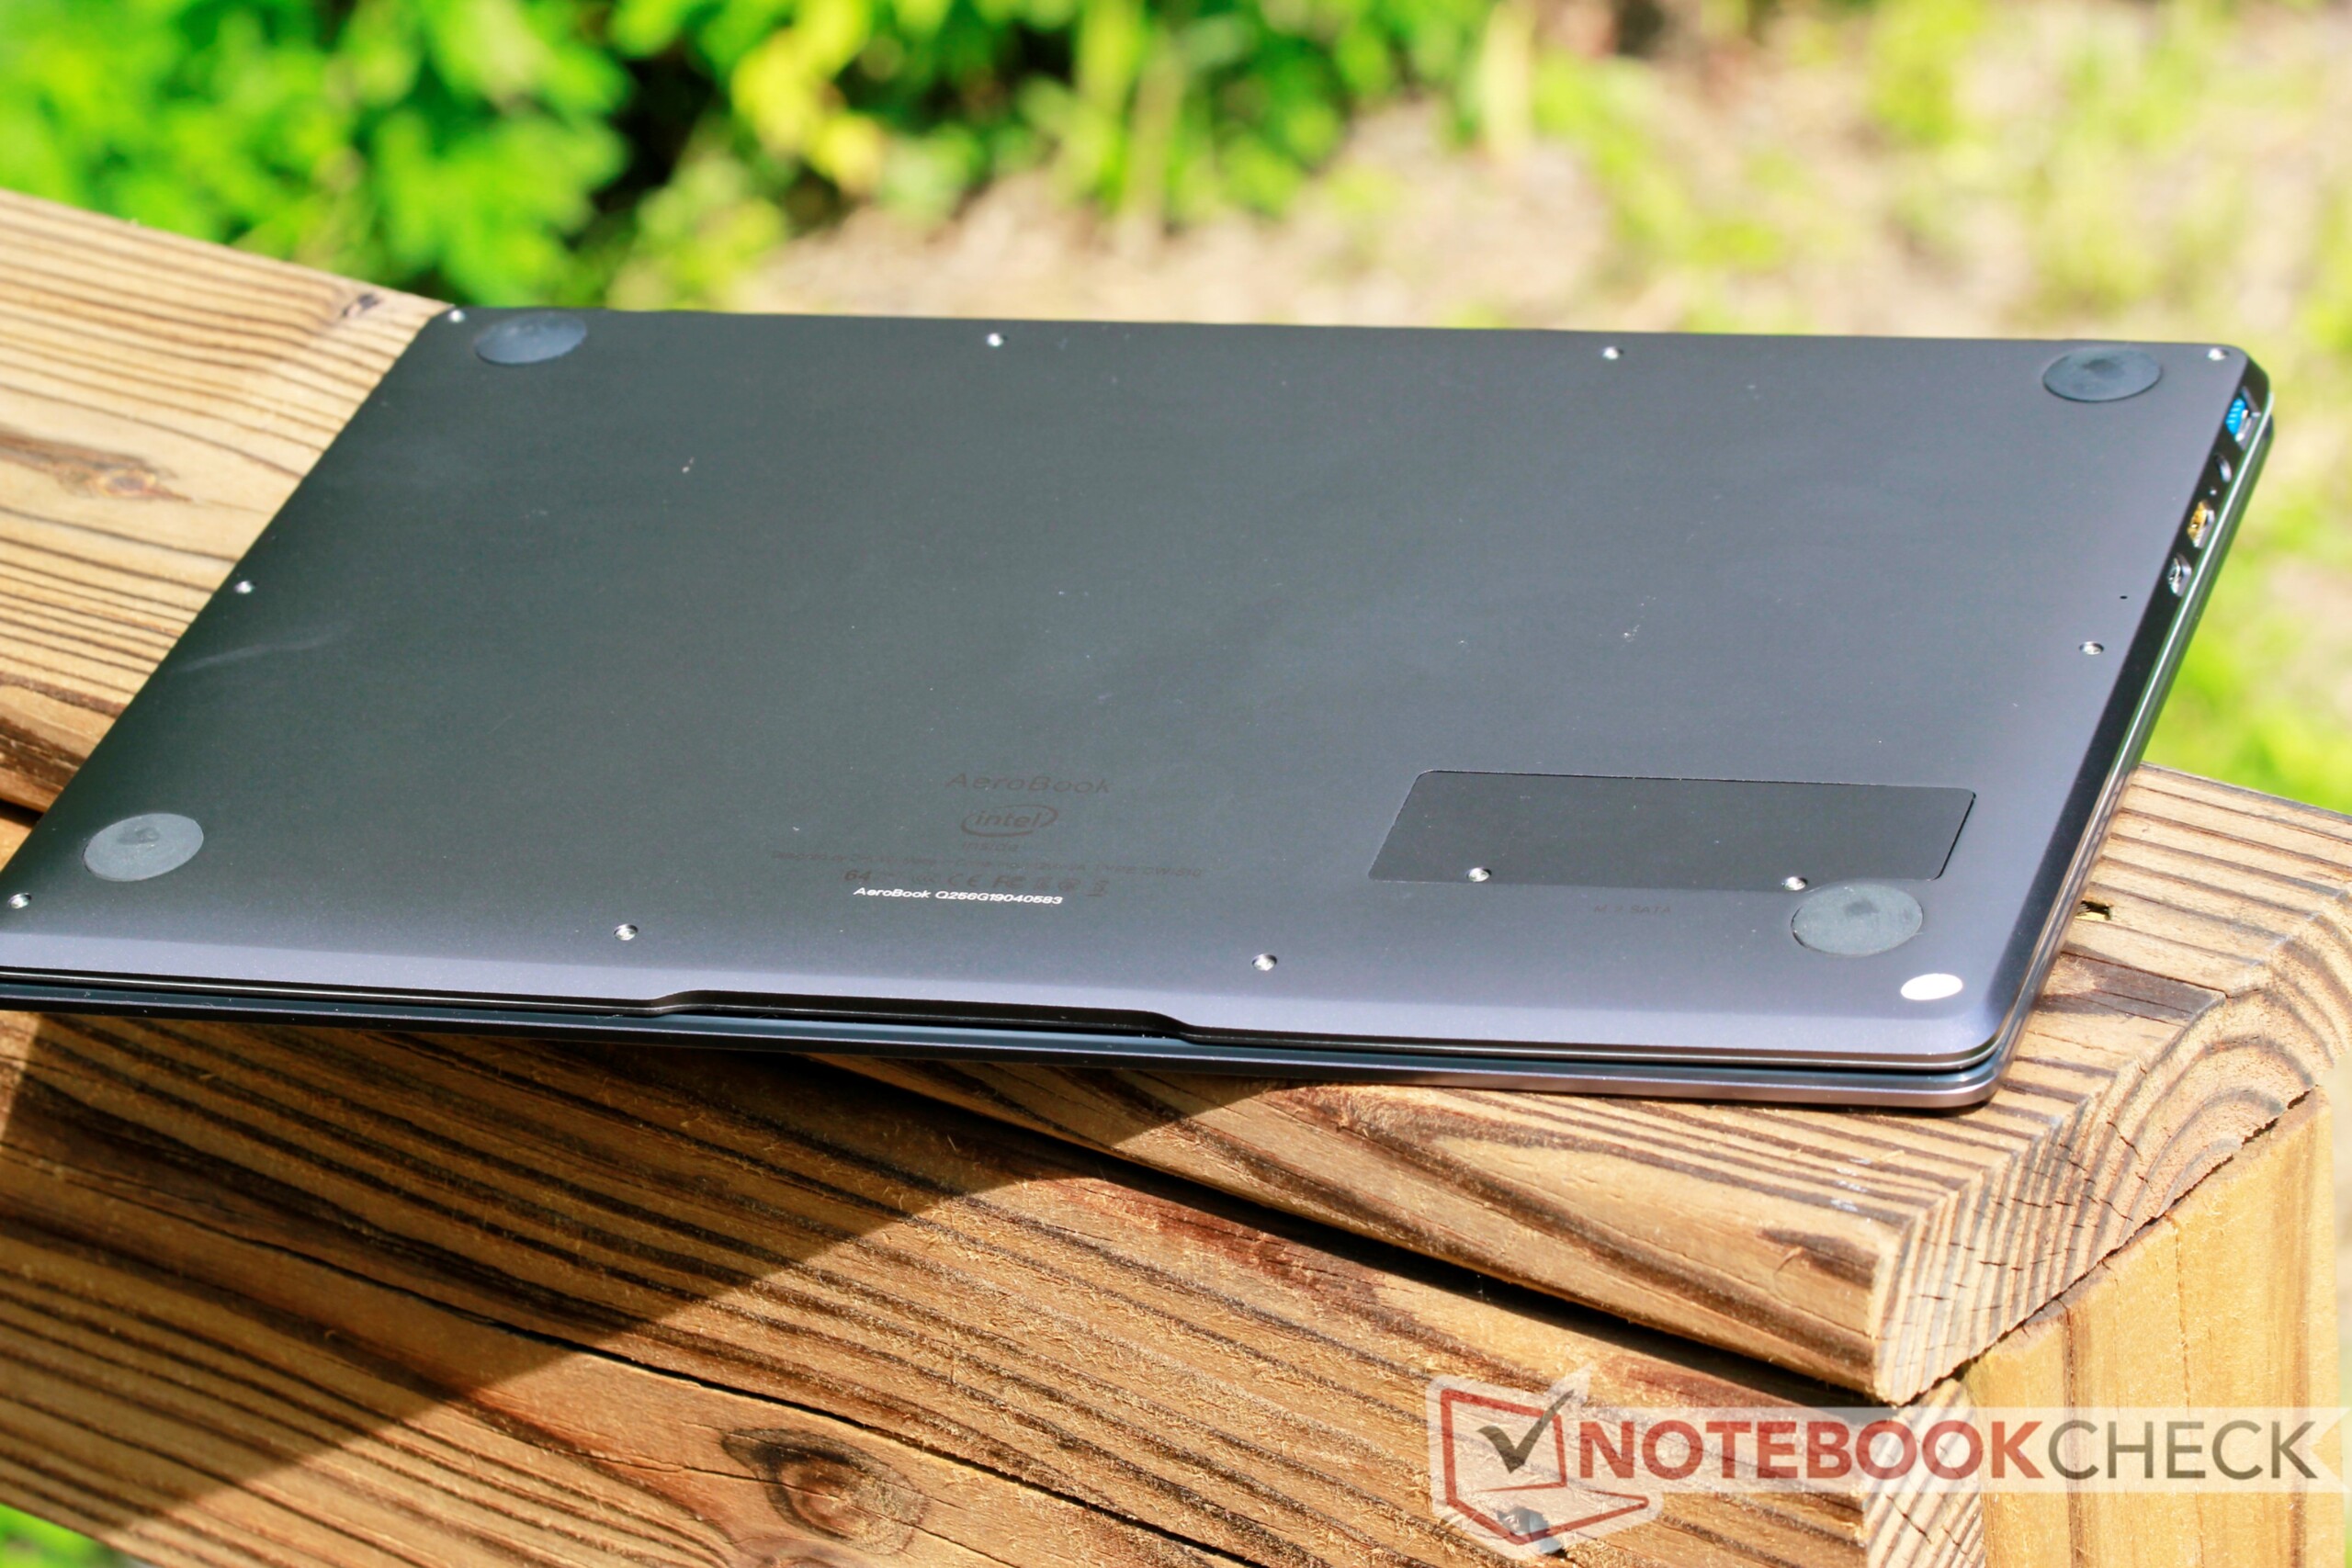
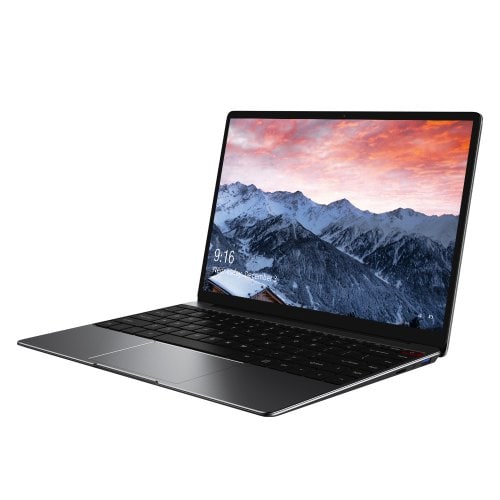
Chuwis AeroBook är en skaplig klon av Apples 12-tums MacBook. Chuwi gör flera saker rätt: designen är förstklassig, den har utmärkt konstruktionskvalitet och tangentbordet och styrplattan är riktigt bra med tanke på prislappen på 5.000 kronor.
Tyvärr misslyckas AeroBook, i likhet med MacBook 12, att imponera i fråga om kraft. Dessutom kan inte Chuwi förlita sig på mjukvaruoptimering på samma sätt som MacBook kan. Även om Apples kompakta laptop kan driva videoströmning i 4K och skapligt komplext kontorsarbete tack vare optimeringar i MacOS så hamnar AeroBook efter när det kommer till dessa uppgifter och förvisas istället till samma användarkategori som Chromebook-modeller eller andra billiga Windows-baserade laptops.
Sammanfattningsvis är Chuwi AeroBook en snygg laptop gjord för att konsumera innehåll, skriva anteckningar eller utföra enklare kontorsarbete. Något tyngre kommer få användaren att längta efter mer.
Intresserade köpare kan spara $30 genom att använda kupongkoden "CHUWINOTE" på den här Amazon-länken.
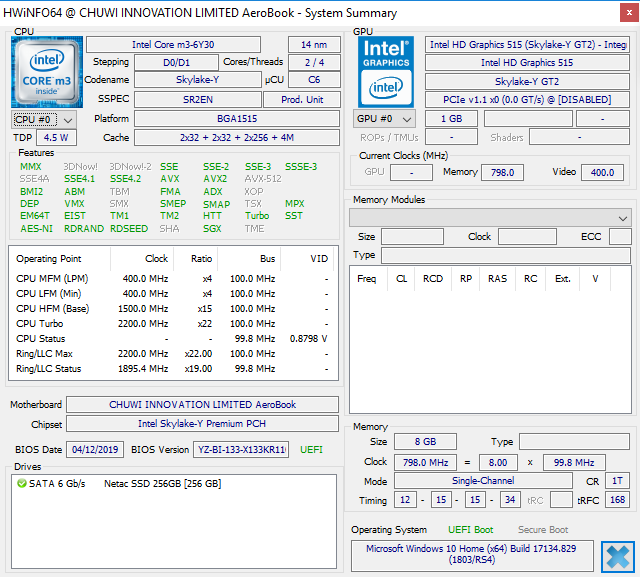
Chuwi AeroBook 13 inch 2019
- 09/26/2019 v7 (old)
Sam Medley
Price comparison
