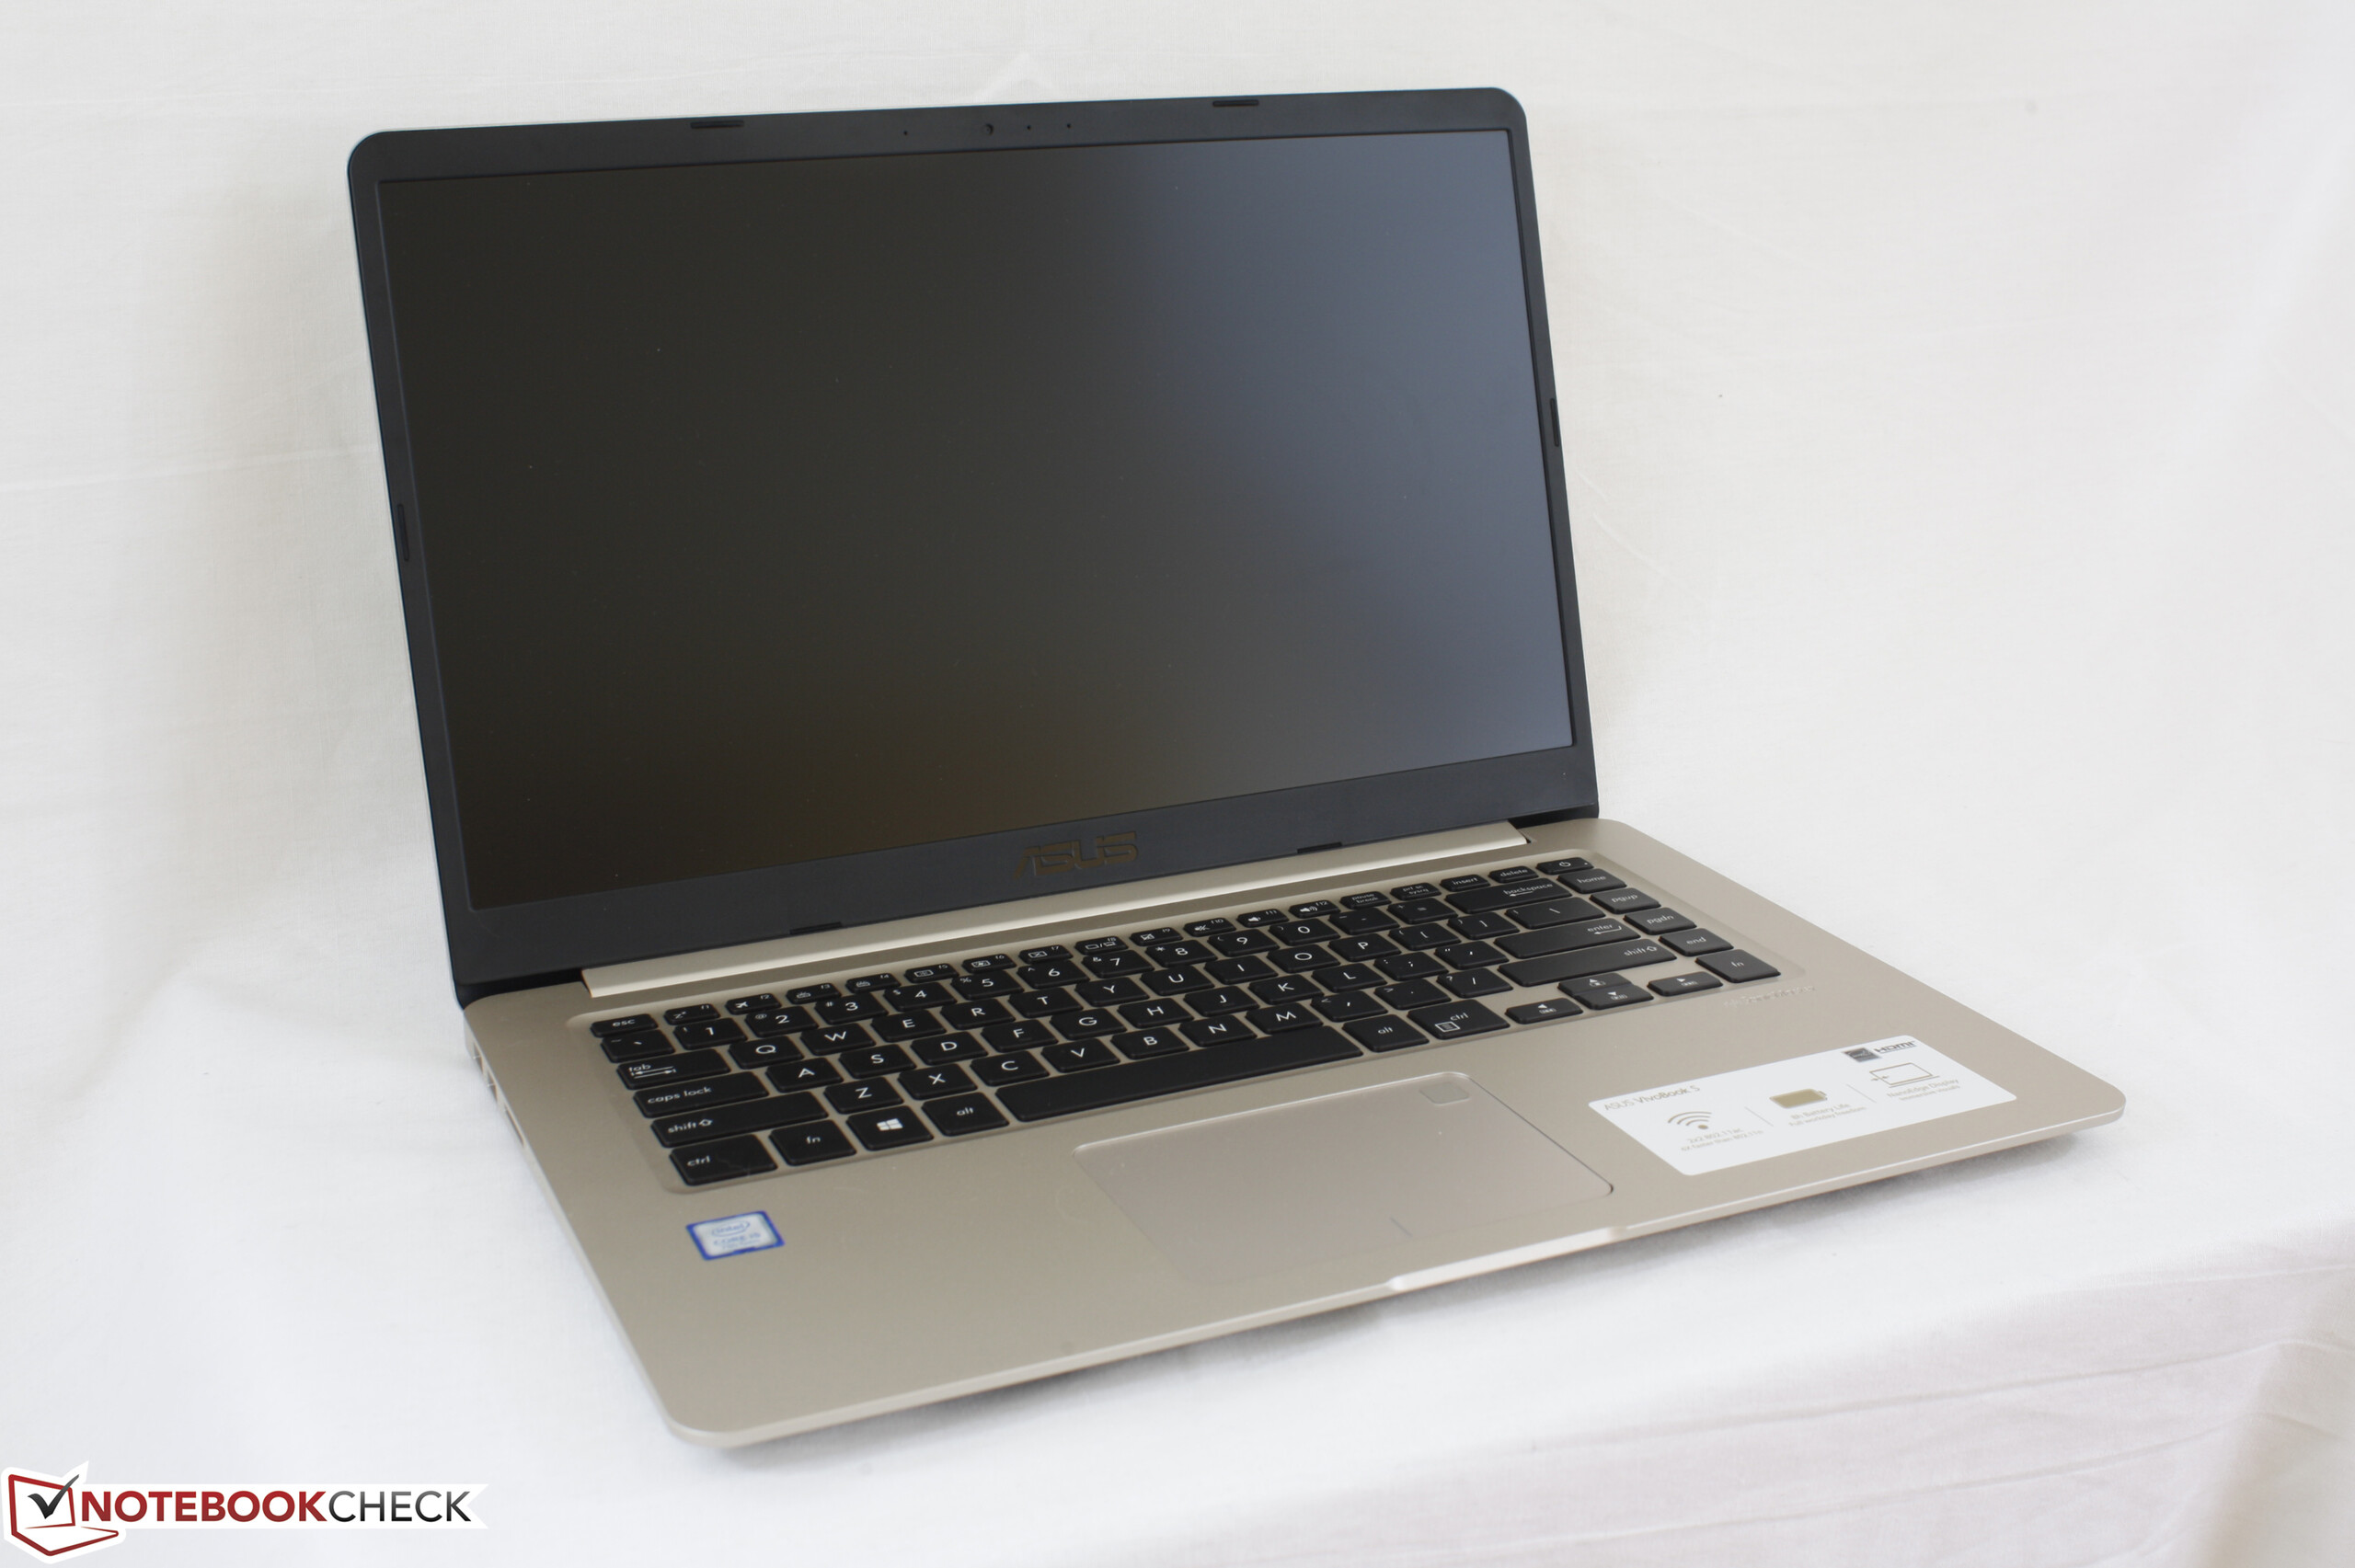
Test: Asus VivoBook S15 S510UQ (i5-7200U, 940MX) Laptop (Sammanfattning)
| SD Card Reader | |
| average JPG Copy Test (av. of 3 runs) | |
| HP Pavilion 15 Power 1GK62AV (Toshiba Exceria Pro SDXC 64 GB UHS-II) | |
| Lenovo ThinkPad E570-20H6S00000 (Toshiba Exceria Pro SDXC 64 GB UHS-II) | |
| Asus Vivobook S15 S510UQ-BQ189T (Toshiba Exceria Pro SDXC 64 GB UHS-II) | |
| Acer Swift 3 SF315-51G-55Z9 (Toshiba Exceria Pro SDXC 64 GB UHS-II) | |
| maximum AS SSD Seq Read Test (1GB) | |
| HP Pavilion 15 Power 1GK62AV (Toshiba Exceria Pro SDXC 64 GB UHS-II) | |
| Lenovo ThinkPad E570-20H6S00000 (Toshiba Exceria Pro SDXC 64 GB UHS-II) | |
| Asus Vivobook S15 S510UQ-BQ189T (Toshiba Exceria Pro SDXC 64 GB UHS-II) | |
| Acer Swift 3 SF315-51G-55Z9 (Toshiba Exceria Pro SDXC 64 GB UHS-II) | |
| Networking | |
| iperf3 transmit AX12 | |
| Asus Vivobook S15 S510UQ-BQ189T | |
| Acer Swift 3 SF315-51G-55Z9 | |
| HP Pavilion 15 Power 1GK62AV | |
| Lenovo ThinkPad E570-20H6S00000 | |
| iperf3 receive AX12 | |
| HP Pavilion 15 Power 1GK62AV | |
| Acer Swift 3 SF315-51G-55Z9 | |
| Asus Vivobook S15 S510UQ-BQ189T | |
| Lenovo ThinkPad E570-20H6S00000 | |
| |||||||||||||||||||||||||
Distribution av ljusstyrkan: 86 %
Mitt på batteriet: 293 cd/m²
Kontrast: 1172:1 (Svärta: 0.25 cd/m²)
ΔE ColorChecker Calman: 3.81 | ∀{0.5-29.43 Ø4.71}
ΔE Greyscale Calman: 2.66 | ∀{0.09-98 Ø4.96}
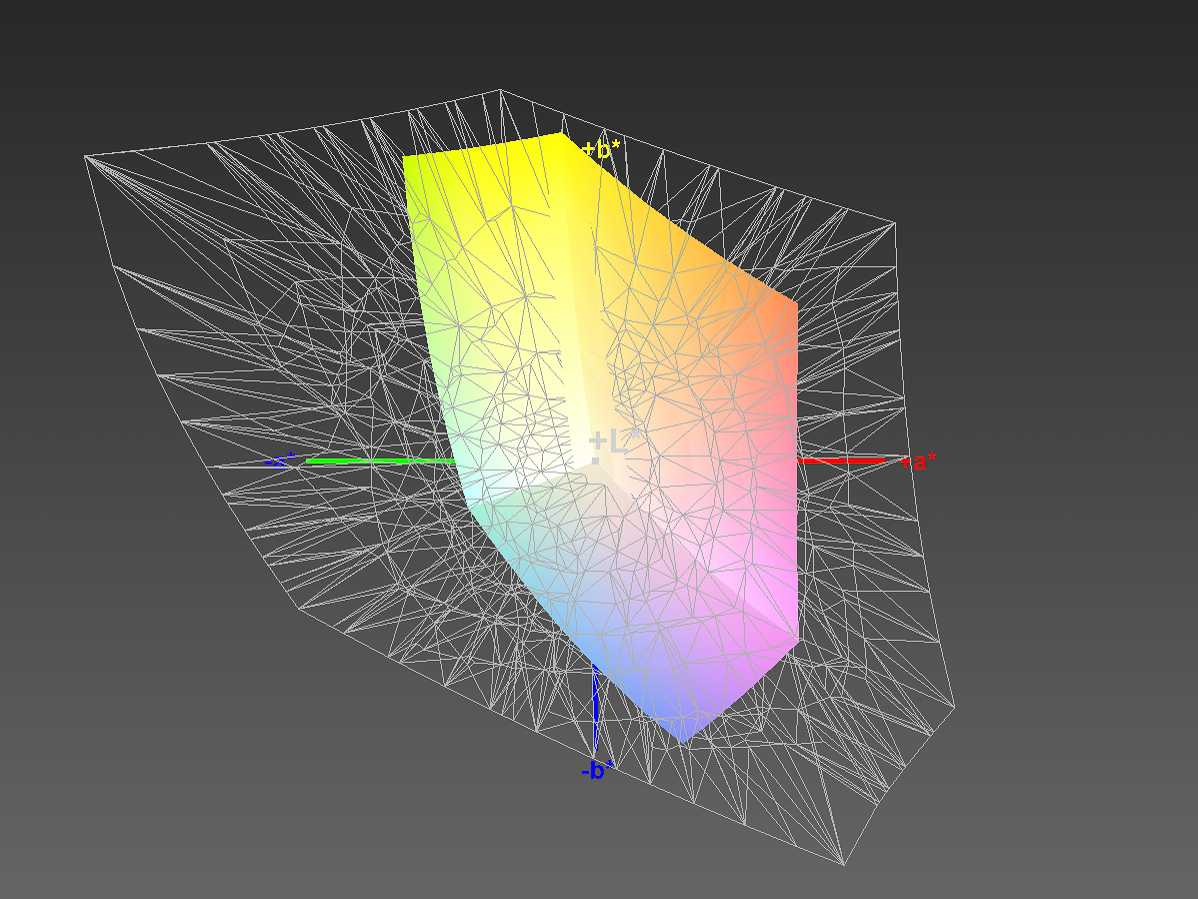
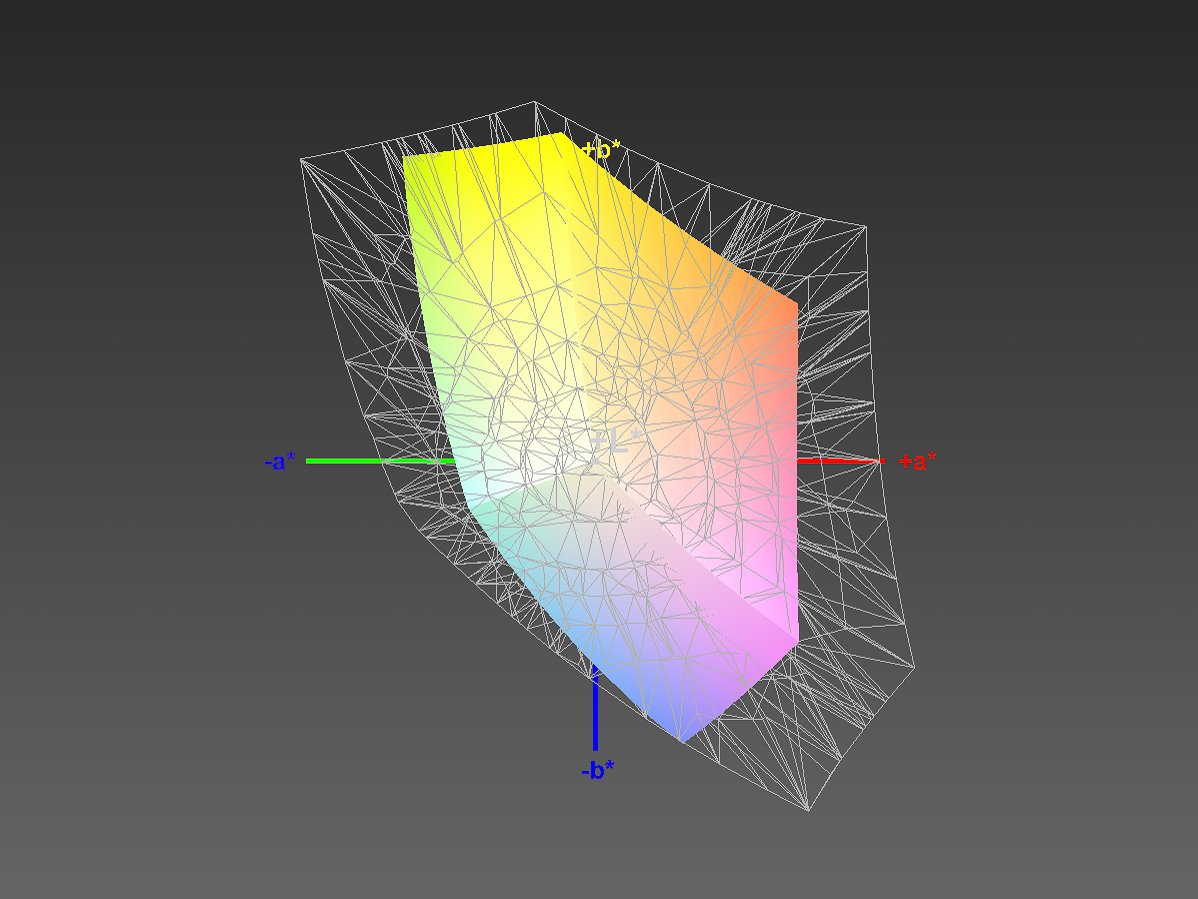
58% sRGB (Argyll 1.6.3 3D)
37% AdobeRGB 1998 (Argyll 1.6.3 3D)
40.23% AdobeRGB 1998 (Argyll 3D)
58.5% sRGB (Argyll 3D)
38.94% Display P3 (Argyll 3D)
Gamma: 2.54
CCT: 6541 K
| Asus Vivobook S15 S510UQ-BQ189T AU Optronics B156W02 / AUO B156HAN02.1, , 1920x1080, 15.6" | Acer Swift 3 SF315-51G-55Z9 BOE0700 / BOE CQ NV156FHM-N48, , 1920x1080, 15.6" | Lenovo ThinkPad E570-20H6S00000 AUO B156HAN04.4, , 1920x1080, 15.6" | HP Pavilion 15 Power 1GK62AV ID: AU Optronics AUO41ED, , 1920x1080, 15.6" | |
|---|---|---|---|---|
| Display | -0% | -1% | -0% | |
| Display P3 Coverage (%) | 38.94 | 39.02 0% | 38.65 -1% | 38.81 0% |
| sRGB Coverage (%) | 58.5 | 57.7 -1% | 58 -1% | 57.9 -1% |
| AdobeRGB 1998 Coverage (%) | 40.23 | 40.31 0% | 39.94 -1% | 40.03 0% |
| Response Times | -2% | 7% | 9% | |
| Response Time Grey 50% / Grey 80% * (ms) | 47 ? | 42 ? 11% | 44.8 ? 5% | 38.8 ? 17% |
| Response Time Black / White * (ms) | 28 ? | 32 ? -14% | 25.6 ? 9% | 28 ? -0% |
| PWM Frequency (Hz) | 1087 ? | |||
| Screen | -10% | -15% | -23% | |
| Brightness middle (cd/m²) | 293 | 248 -15% | 242 -17% | 256.6 -12% |
| Brightness (cd/m²) | 275 | 239 -13% | 243 -12% | 243 -12% |
| Brightness Distribution (%) | 86 | 69 -20% | 75 -13% | 81 -6% |
| Black Level * (cd/m²) | 0.25 | 0.18 28% | 0.24 4% | 0.19 24% |
| Contrast (:1) | 1172 | 1378 18% | 1008 -14% | 1351 15% |
| Colorchecker dE 2000 * | 3.81 | 4.85 -27% | 4.65 -22% | 5 -31% |
| Colorchecker dE 2000 max. * | 6.64 | 8.34 -26% | 9.64 -45% | 20.1 -203% |
| Greyscale dE 2000 * | 2.66 | 3.84 -44% | 3.39 -27% | 2.7 -2% |
| Gamma | 2.54 87% | 2.29 96% | 2.7 81% | 2.32 95% |
| CCT | 6541 99% | 6790 96% | 6246 104% | 6599 98% |
| Color Space (Percent of AdobeRGB 1998) (%) | 37 | 37 0% | 36.69 -1% | 36.7 -1% |
| Color Space (Percent of sRGB) (%) | 58 | 57 -2% | 57.66 -1% | 57.7 -1% |
| Totalt genomsnitt (program/inställningar) | -4% /
-7% | -3% /
-9% | -5% /
-14% |
* ... mindre är bättre
Visa svarstider
| ↔ Svarstid svart till vitt | ||
|---|---|---|
| 28 ms ... stiga ↗ och falla ↘ kombinerat | ↗ 16 ms stiga | 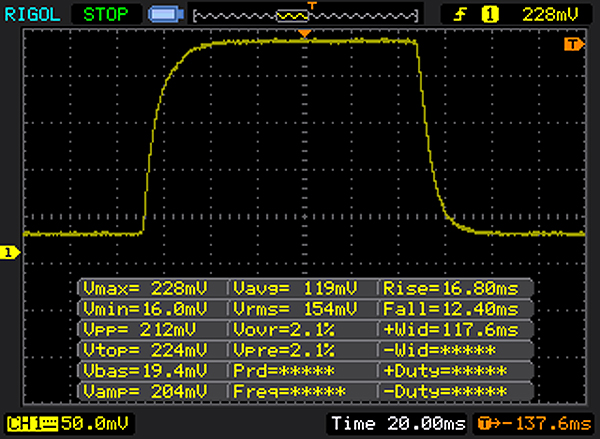 |
| ↘ 12 ms hösten | ||
| Skärmen visar relativt långsamma svarsfrekvenser i våra tester och kan vara för långsam för spelare. I jämförelse sträcker sig alla testade enheter från 0.1 (minst) till 240 (maximalt) ms. » 71 % av alla enheter är bättre. Detta innebär att den uppmätta svarstiden är sämre än genomsnittet av alla testade enheter (19.8 ms). | ||
| ↔ Svarstid 50 % grått till 80 % grått | ||
| 47 ms ... stiga ↗ och falla ↘ kombinerat | ↗ 21 ms stiga | 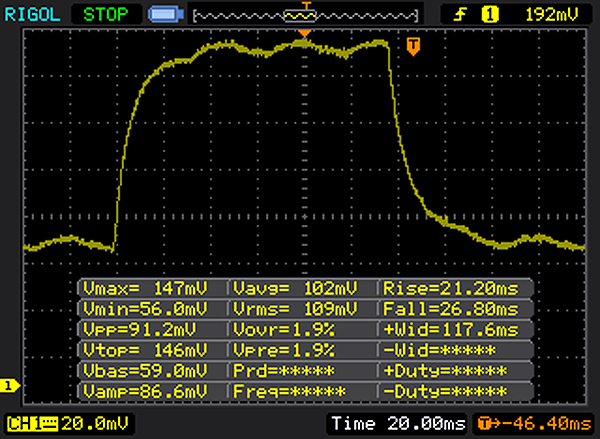 |
| ↘ 26 ms hösten | ||
| Skärmen visar långsamma svarsfrekvenser i våra tester och kommer att vara otillfredsställande för spelare. I jämförelse sträcker sig alla testade enheter från 0.165 (minst) till 636 (maximalt) ms. » 81 % av alla enheter är bättre. Detta innebär att den uppmätta svarstiden är sämre än genomsnittet av alla testade enheter (31 ms). | ||
Skärmflimmer / PWM (Puls-Width Modulation)
| Skärmflimmer / PWM upptäcktes inte | ||
Som jämförelse: 52 % av alla testade enheter använder inte PWM för att dämpa skärmen. Om PWM upptäcktes mättes ett medelvärde av 7754 (minst: 5 - maximum: 343500) Hz. | ||
| Cinebench R15 | |
| CPU Single 64Bit | |
| HP Pavilion 15 Power 1GK62AV | |
| Acer Swift 3 SF315-51G-57E5 | |
| Asus Vivobook S15 S510UQ-BQ189T | |
| Lenovo ThinkPad E570-20H6S00000 | |
| Acer Swift 3 SF315-51G-55Z9 | |
| CPU Multi 64Bit | |
| HP Pavilion 15 Power 1GK62AV | |
| Acer Swift 3 SF315-51G-57E5 | |
| Asus Vivobook S15 S510UQ-BQ189T | |
| Lenovo ThinkPad E570-20H6S00000 | |
| Acer Swift 3 SF315-51G-55Z9 | |
| PCMark 8 | |
| Home Score Accelerated v2 | |
| HP Pavilion 15 Power 1GK62AV | |
| Acer Swift 3 SF315-51G-55Z9 | |
| Lenovo ThinkPad E570-20H6S00000 | |
| Asus Vivobook S15 S510UQ-BQ189T | |
| Work Score Accelerated v2 | |
| HP Pavilion 15 Power 1GK62AV | |
| Lenovo ThinkPad E570-20H6S00000 | |
| Acer Swift 3 SF315-51G-55Z9 | |
| Asus Vivobook S15 S510UQ-BQ189T | |
| PCMark 8 Home Score Accelerated v2 | 3468 poäng | |
| PCMark 8 Work Score Accelerated v2 | 4483 poäng | |
Hjälp | ||
| Asus Vivobook S15 S510UQ-BQ189T Toshiba SG5 THNSNK128GVN8 | Acer Swift 3 SF315-51G-55Z9 Kingston RBUSNS8180DS3128GH | Lenovo ThinkPad E570-20H6S00000 Toshiba THNSF5256GPUK | HP Pavilion 15 Power 1GK62AV SK Hynix HFS256G39TND-N210A | |
|---|---|---|---|---|
| CrystalDiskMark 3.0 | 46% | 139% | 4% | |
| Read Seq (MB/s) | 437.6 | 462.2 6% | 1140 161% | 491.6 12% |
| Write Seq (MB/s) | 138.6 | 409.9 196% | 468.1 238% | 141.7 2% |
| Read 512 (MB/s) | 368.6 | 310.3 -16% | 759 106% | 345.6 -6% |
| Write 512 (MB/s) | 138.2 | 216.6 57% | 414 200% | 142.6 3% |
| Read 4k (MB/s) | 16.05 | 31.89 99% | 34.3 114% | 18.83 17% |
| Write 4k (MB/s) | 86.2 | 73.2 -15% | 123.4 43% | 76.3 -11% |
| Read 4k QD32 (MB/s) | 279.1 | 287.9 3% | 530 90% | 348.5 25% |
| Write 4k QD32 (MB/s) | 121.8 | 170.6 40% | 319.2 162% | 104.8 -14% |

| 3DMark 11 - 1280x720 Performance GPU | |
| HP Pavilion 15 Power 1GK62AV | |
| Acer Swift 3 SF315-51G-55Z9 | |
| Lenovo ThinkPad E570-20H6S00000 | |
| Asus Vivobook S15 S510UQ-BQ189T | |
| 3DMark | |
| 1280x720 Cloud Gate Standard Graphics | |
| HP Pavilion 15 Power 1GK62AV | |
| Lenovo ThinkPad E570-20H6S00000 | |
| Acer Swift 3 SF315-51G-55Z9 | |
| Asus Vivobook S15 S510UQ-BQ189T | |
| 1920x1080 Fire Strike Graphics | |
| HP Pavilion 15 Power 1GK62AV | |
| Acer Swift 3 SF315-51G-55Z9 | |
| Lenovo ThinkPad E570-20H6S00000 | |
| Asus Vivobook S15 S510UQ-BQ189T | |
| 3DMark 11 Performance | 2843 poäng | |
| 3DMark Cloud Gate Standard Score | 7748 poäng | |
| 3DMark Fire Strike Score | 1944 poäng | |
Hjälp | ||
| låg | med. | hög | ultra | |
|---|---|---|---|---|
| The Witcher 3 (2015) | 41.4 | 25.4 | ||
| Rise of the Tomb Raider (2016) | 46.9 | 26.1 | ||
| Farming Simulator 17 (2016) | 43.8 | 29.8 |
Ljudnivå
| Låg belastning |
| 31.2 / 31.2 / 31.2 dB(A) |
| Hårddisk |
| 31.6 dB(A) |
| Hög belastning |
| 43.3 / 43.3 dB(A) |
 | ||
30 dB tyst 40 dB(A) hörbar 50 dB(A) högt ljud |
||
min: | ||
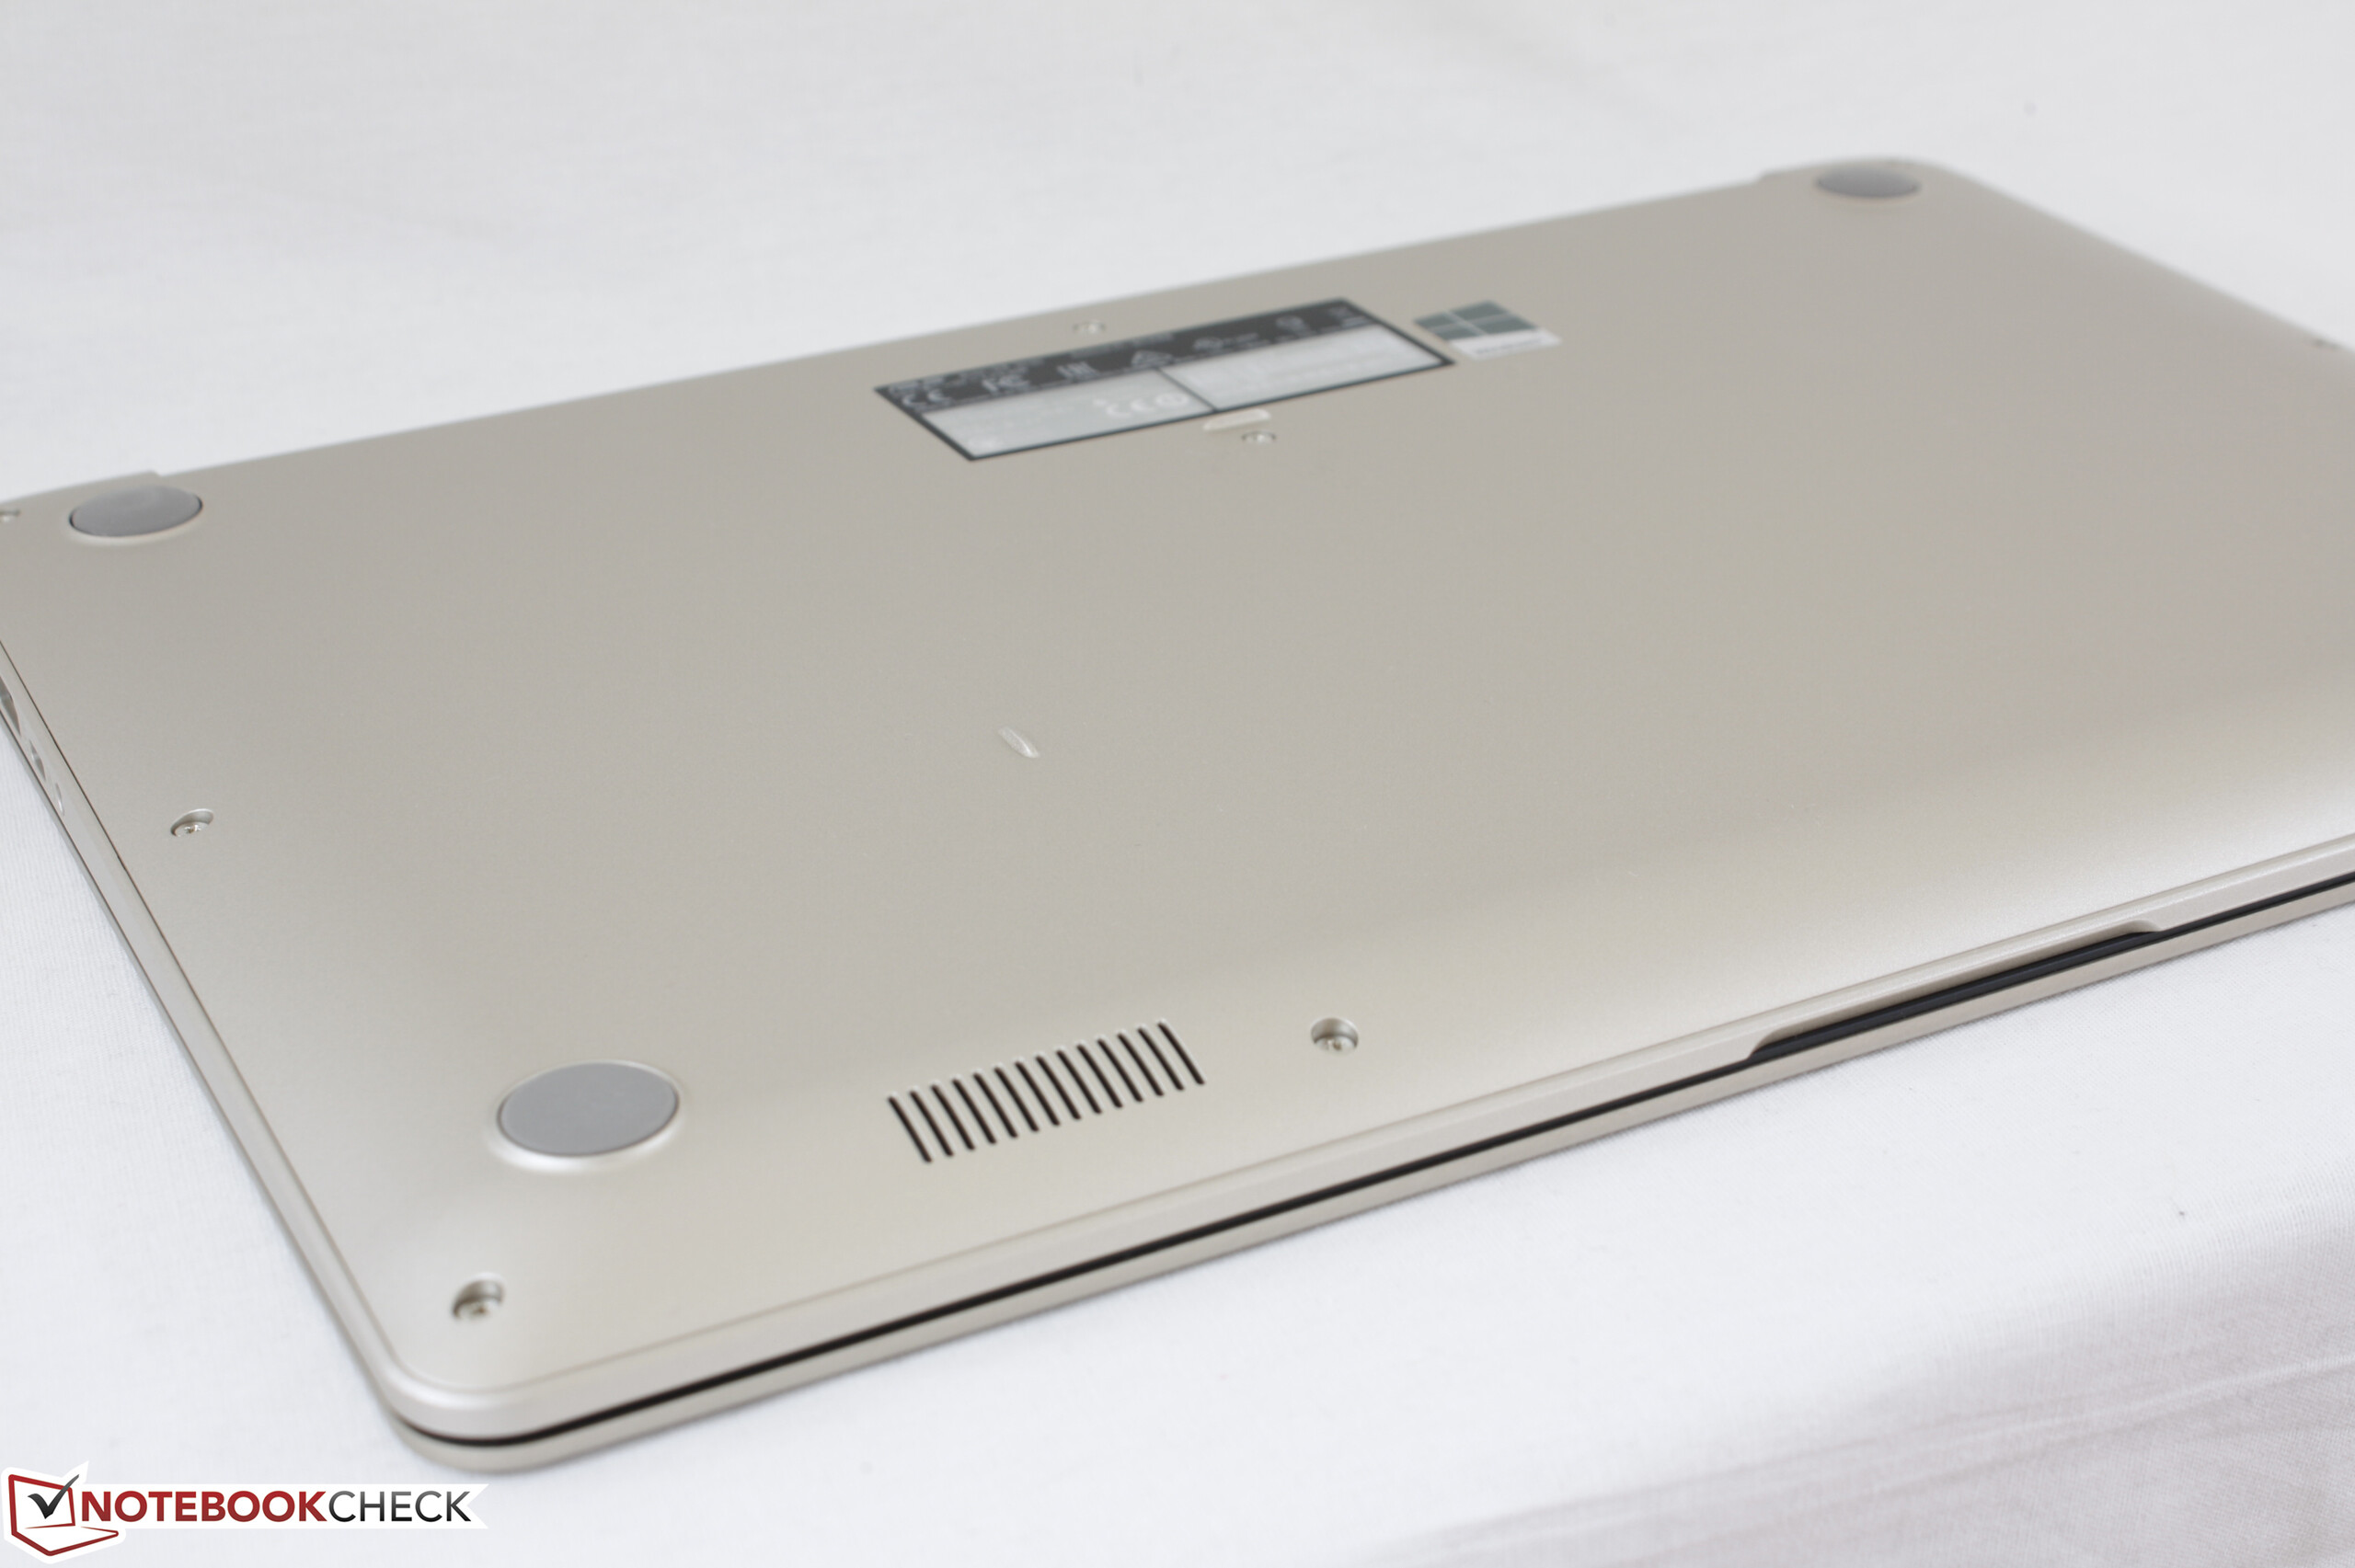
(+) Den maximala temperaturen på ovansidan är 38.2 °C / 101 F, jämfört med genomsnittet av 36.8 °C / 98 F , allt från 21 till 71 °C för klassen Multimedia.
(-) Botten värms upp till maximalt 49 °C / 120 F, jämfört med genomsnittet av 39.1 °C / 102 F
(+) Vid tomgångsbruk är medeltemperaturen för ovansidan 21.9 °C / 71 F, jämfört med enhetsgenomsnittet på 31.3 °C / ### class_avg_f### F.
(+) Handledsstöden och pekplattan är kallare än hudtemperaturen med maximalt 26 °C / 78.8 F och är därför svala att ta på.
(+) Medeltemperaturen för handledsstödsområdet på liknande enheter var 28.7 °C / 83.7 F (+2.7 °C / 4.9 F).
Asus Vivobook S15 S510UQ-BQ189T ljudanalys
(±) | högtalarljudstyrkan är genomsnittlig men bra (73.4 dB)
Bas 100 - 315 Hz
(-) | nästan ingen bas - i genomsnitt 19% lägre än medianen
(±) | linjäriteten för basen är genomsnittlig (10.7% delta till föregående frekvens)
Mellan 400 - 2000 Hz
(+) | balanserad mellan - endast 2% från medianen
(+) | mids är linjära (4.3% delta till föregående frekvens)
Högsta 2 - 16 kHz
(+) | balanserade toppar - endast 3.6% från medianen
(+) | toppar är linjära (3.3% delta till föregående frekvens)
Totalt 100 - 16 000 Hz
(±) | linjäriteten för det totala ljudet är genomsnittlig (17.1% skillnad mot median)
Jämfört med samma klass
» 47% av alla testade enheter i den här klassen var bättre, 7% liknande, 46% sämre
» Den bästa hade ett delta på 5%, genomsnittet var 17%, sämst var 45%
Jämfört med alla testade enheter
» 31% av alla testade enheter var bättre, 8% liknande, 61% sämre
» Den bästa hade ett delta på 4%, genomsnittet var 23%, sämst var 134%
Acer Swift 3 SF315-51G-55Z9 ljudanalys
(±) | högtalarljudstyrkan är genomsnittlig men bra (77.5 dB)
Bas 100 - 315 Hz
(-) | nästan ingen bas - i genomsnitt 27.8% lägre än medianen
(±) | linjäriteten för basen är genomsnittlig (11.1% delta till föregående frekvens)
Mellan 400 - 2000 Hz
(+) | balanserad mellan - endast 4.4% från medianen
(+) | mids är linjära (5.1% delta till föregående frekvens)
Högsta 2 - 16 kHz
(±) | högre toppar - i genomsnitt 6% högre än medianen
(±) | linjäriteten för toppar är genomsnittlig (7.2% delta till föregående frekvens)
Totalt 100 - 16 000 Hz
(±) | linjäriteten för det totala ljudet är genomsnittlig (20.8% skillnad mot median)
Jämfört med samma klass
» 71% av alla testade enheter i den här klassen var bättre, 7% liknande, 22% sämre
» Den bästa hade ett delta på 5%, genomsnittet var 17%, sämst var 45%
Jämfört med alla testade enheter
» 56% av alla testade enheter var bättre, 8% liknande, 36% sämre
» Den bästa hade ett delta på 4%, genomsnittet var 23%, sämst var 134%
Lenovo ThinkPad E570-20H6S00000 ljudanalys
(±) | högtalarljudstyrkan är genomsnittlig men bra (80.7 dB)
Bas 100 - 315 Hz
(-) | nästan ingen bas - i genomsnitt 16.8% lägre än medianen
(-) | basen är inte linjär (16.4% delta till föregående frekvens)
Mellan 400 - 2000 Hz
(±) | högre mellan - i genomsnitt 5.1% högre än median
(±) | linjäriteten för mids är genomsnittlig (9.5% delta till föregående frekvens)
Högsta 2 - 16 kHz
(+) | balanserade toppar - endast 2.7% från medianen
(+) | toppar är linjära (6.5% delta till föregående frekvens)
Totalt 100 - 16 000 Hz
(±) | linjäriteten för det totala ljudet är genomsnittlig (19.6% skillnad mot median)
Jämfört med samma klass
» 64% av alla testade enheter i den här klassen var bättre, 7% liknande, 29% sämre
» Den bästa hade ett delta på 5%, genomsnittet var 17%, sämst var 45%
Jämfört med alla testade enheter
» 49% av alla testade enheter var bättre, 7% liknande, 44% sämre
» Den bästa hade ett delta på 4%, genomsnittet var 23%, sämst var 134%
HP Pavilion 15 Power 1GK62AV ljudanalys
(-) | inte särskilt höga högtalare (68.5 dB)
Bas 100 - 315 Hz
(-) | nästan ingen bas - i genomsnitt 17.7% lägre än medianen
(±) | linjäriteten för basen är genomsnittlig (13.4% delta till föregående frekvens)
Mellan 400 - 2000 Hz
(+) | balanserad mellan - endast 4.2% från medianen
(±) | linjäriteten för mids är genomsnittlig (8.8% delta till föregående frekvens)
Högsta 2 - 16 kHz
(+) | balanserade toppar - endast 3.5% från medianen
(±) | linjäriteten för toppar är genomsnittlig (11.6% delta till föregående frekvens)
Totalt 100 - 16 000 Hz
(±) | linjäriteten för det totala ljudet är genomsnittlig (26.8% skillnad mot median)
Jämfört med samma klass
» 92% av alla testade enheter i den här klassen var bättre, 2% liknande, 6% sämre
» Den bästa hade ett delta på 5%, genomsnittet var 17%, sämst var 45%
Jämfört med alla testade enheter
» 82% av alla testade enheter var bättre, 4% liknande, 14% sämre
» Den bästa hade ett delta på 4%, genomsnittet var 23%, sämst var 134%
| Av/Standby | |
| Låg belastning | |
| Hög belastning |
|
Förklaring:
min: | |
| Asus Vivobook S15 S510UQ-BQ189T i5-7200U, GeForce 940MX, Toshiba SG5 THNSNK128GVN8, IPS, 1920x1080, 15.6" | Lenovo IdeaPad 320-15IKB 80XL01NEGE i5-7200U, GeForce 940MX, SK Hynix HFS256G3BTND, TN LED, 1920x1080, 15.6" | Acer Swift 3 SF315-51G-55Z9 i5-7200U, GeForce MX150, Kingston RBUSNS8180DS3128GH, IPS, 1920x1080, 15.6" | Lenovo ThinkPad E570-20H6S00000 i5-7200U, GeForce GTX 950M, Toshiba THNSF5256GPUK, IPS LED, 1920x1080, 15.6" | HP Pavilion 15 Power 1GK62AV i7-7700HQ, GeForce GTX 1050 Mobile, SK Hynix HFS256G39TND-N210A, IPS, 1920x1080, 15.6" | |
|---|---|---|---|---|---|
| Power Consumption | 21% | 1% | 6% | -84% | |
| Idle Minimum * (Watt) | 3.6 | 2.9 19% | 3.7 -3% | 2.8 22% | 9.4 -161% |
| Idle Average * (Watt) | 6.8 | 5.9 13% | 6.2 9% | 6.3 7% | 9.7 -43% |
| Idle Maximum * (Watt) | 9.5 | 7.3 23% | 8.4 12% | 6.9 27% | 16.8 -77% |
| Load Average * (Watt) | 51.6 | 39.5 23% | 50 3% | 51.6 -0% | 76.5 -48% |
| Load Maximum * (Watt) | 56 | 42 25% | 65.2 -16% | 69.7 -24% | 105.6 -89% |
| Witcher 3 ultra * (Watt) | 86.5 |
* ... mindre är bättre
| Asus Vivobook S15 S510UQ-BQ189T i5-7200U, GeForce 940MX, 42 Wh | Acer Swift 3 SF315-51G-55Z9 i5-7200U, GeForce MX150, 49 Wh | Lenovo ThinkPad E570-20H6S00000 i5-7200U, GeForce GTX 950M, 41 Wh | HP Pavilion 15 Power 1GK62AV i7-7700HQ, GeForce GTX 1050 Mobile, 70 Wh | |
|---|---|---|---|---|
| Batteridrifttid | 104% | 90% | 88% | |
| Reader / Idle (h) | 7.1 | 15.3 115% | 14.7 107% | 16.2 128% |
| WiFi v1.3 (h) | 4.3 | 8.5 98% | 7.7 79% | 8 86% |
| Load (h) | 1.2 | 2.4 100% | 2.2 83% | 1.8 50% |
För
Emot
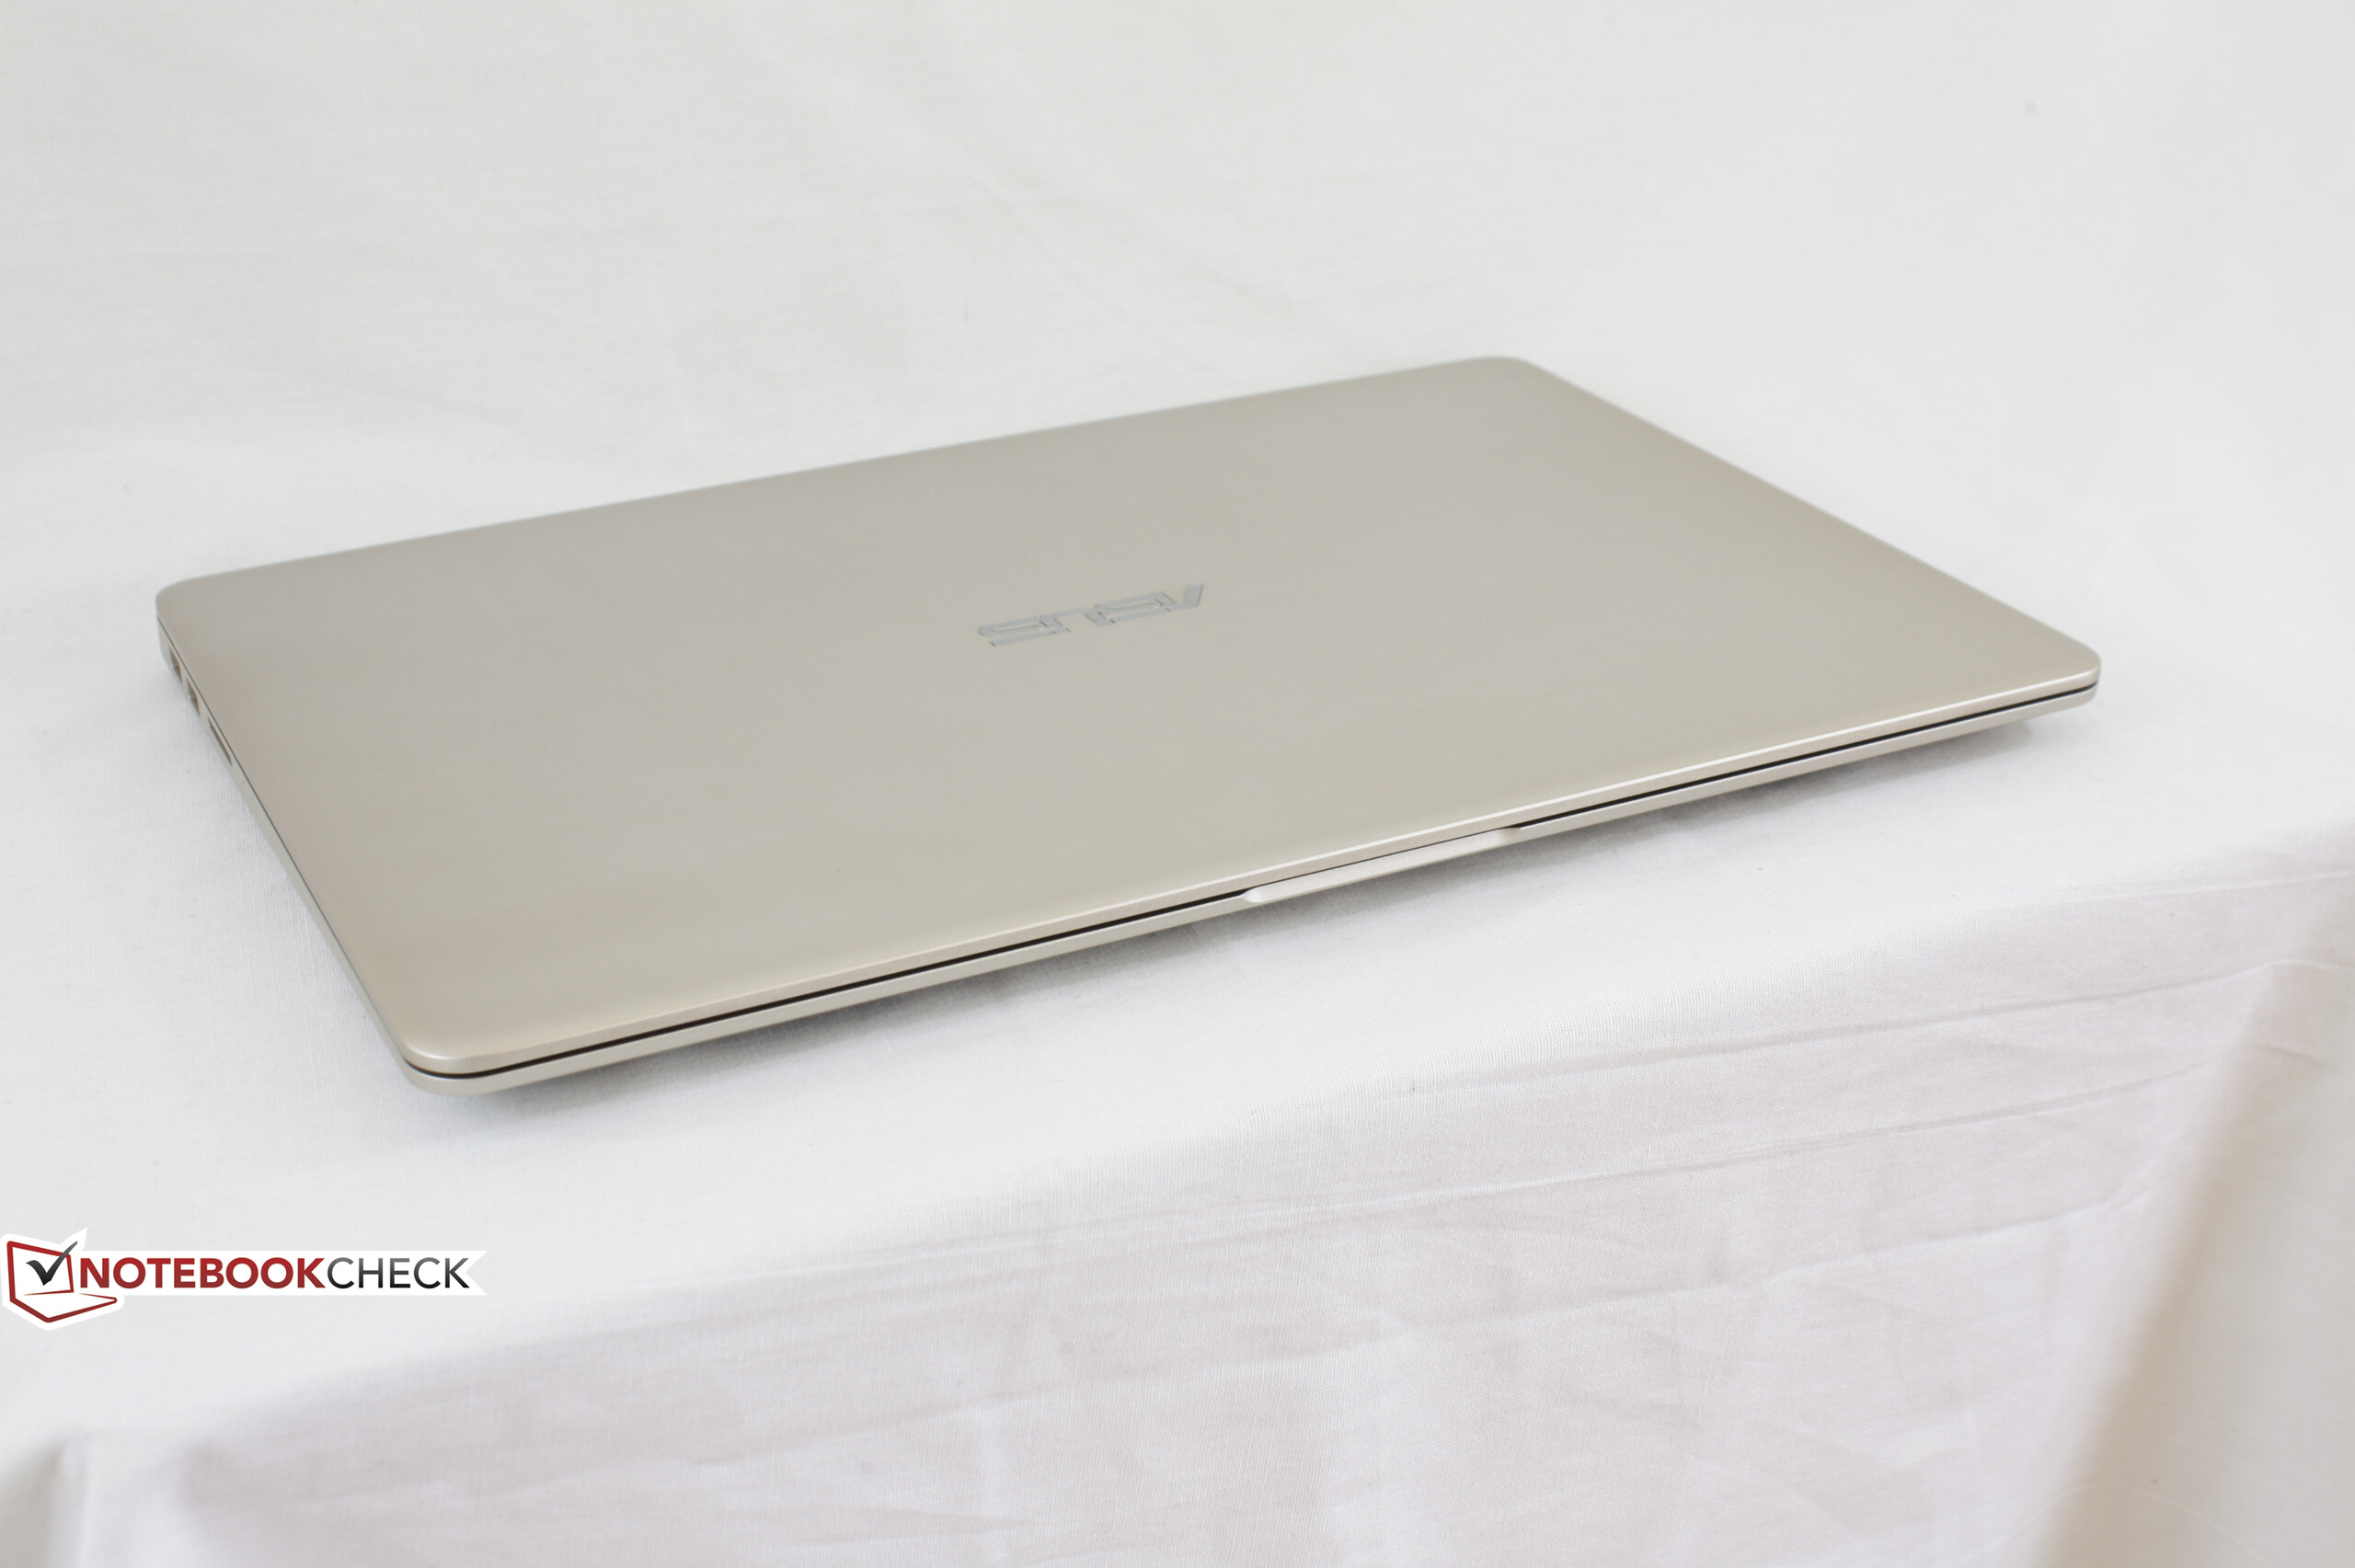
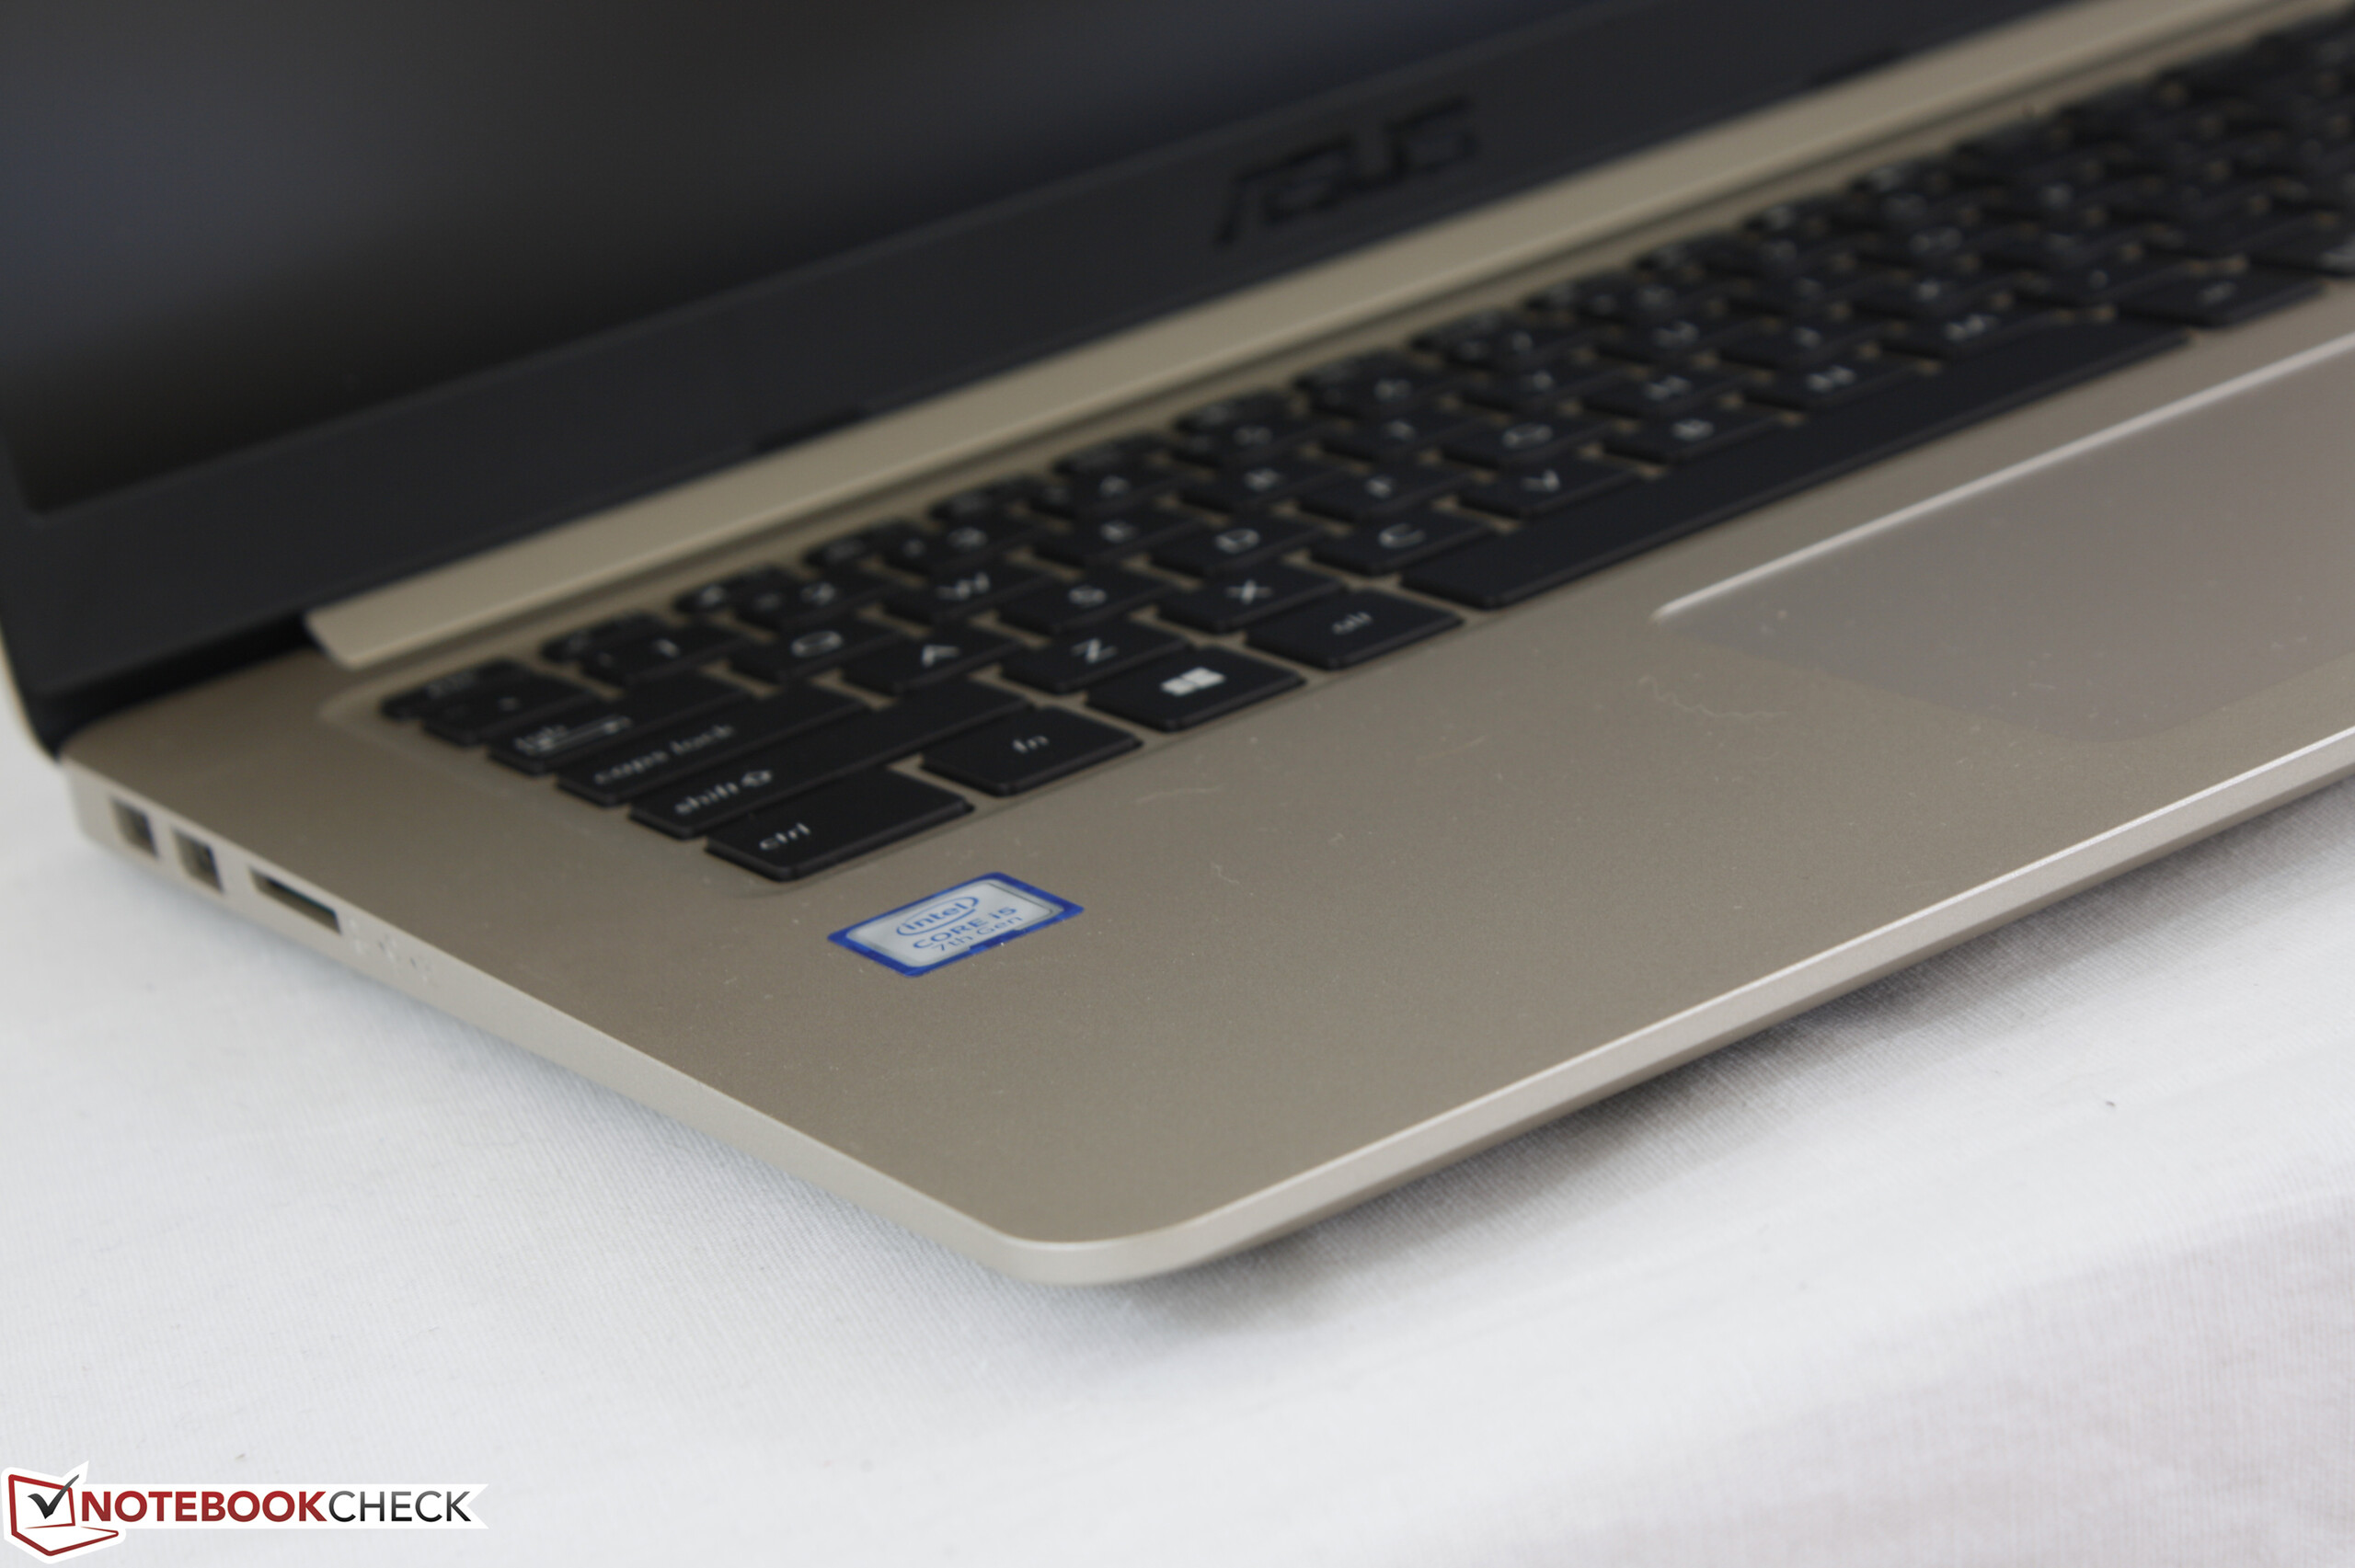
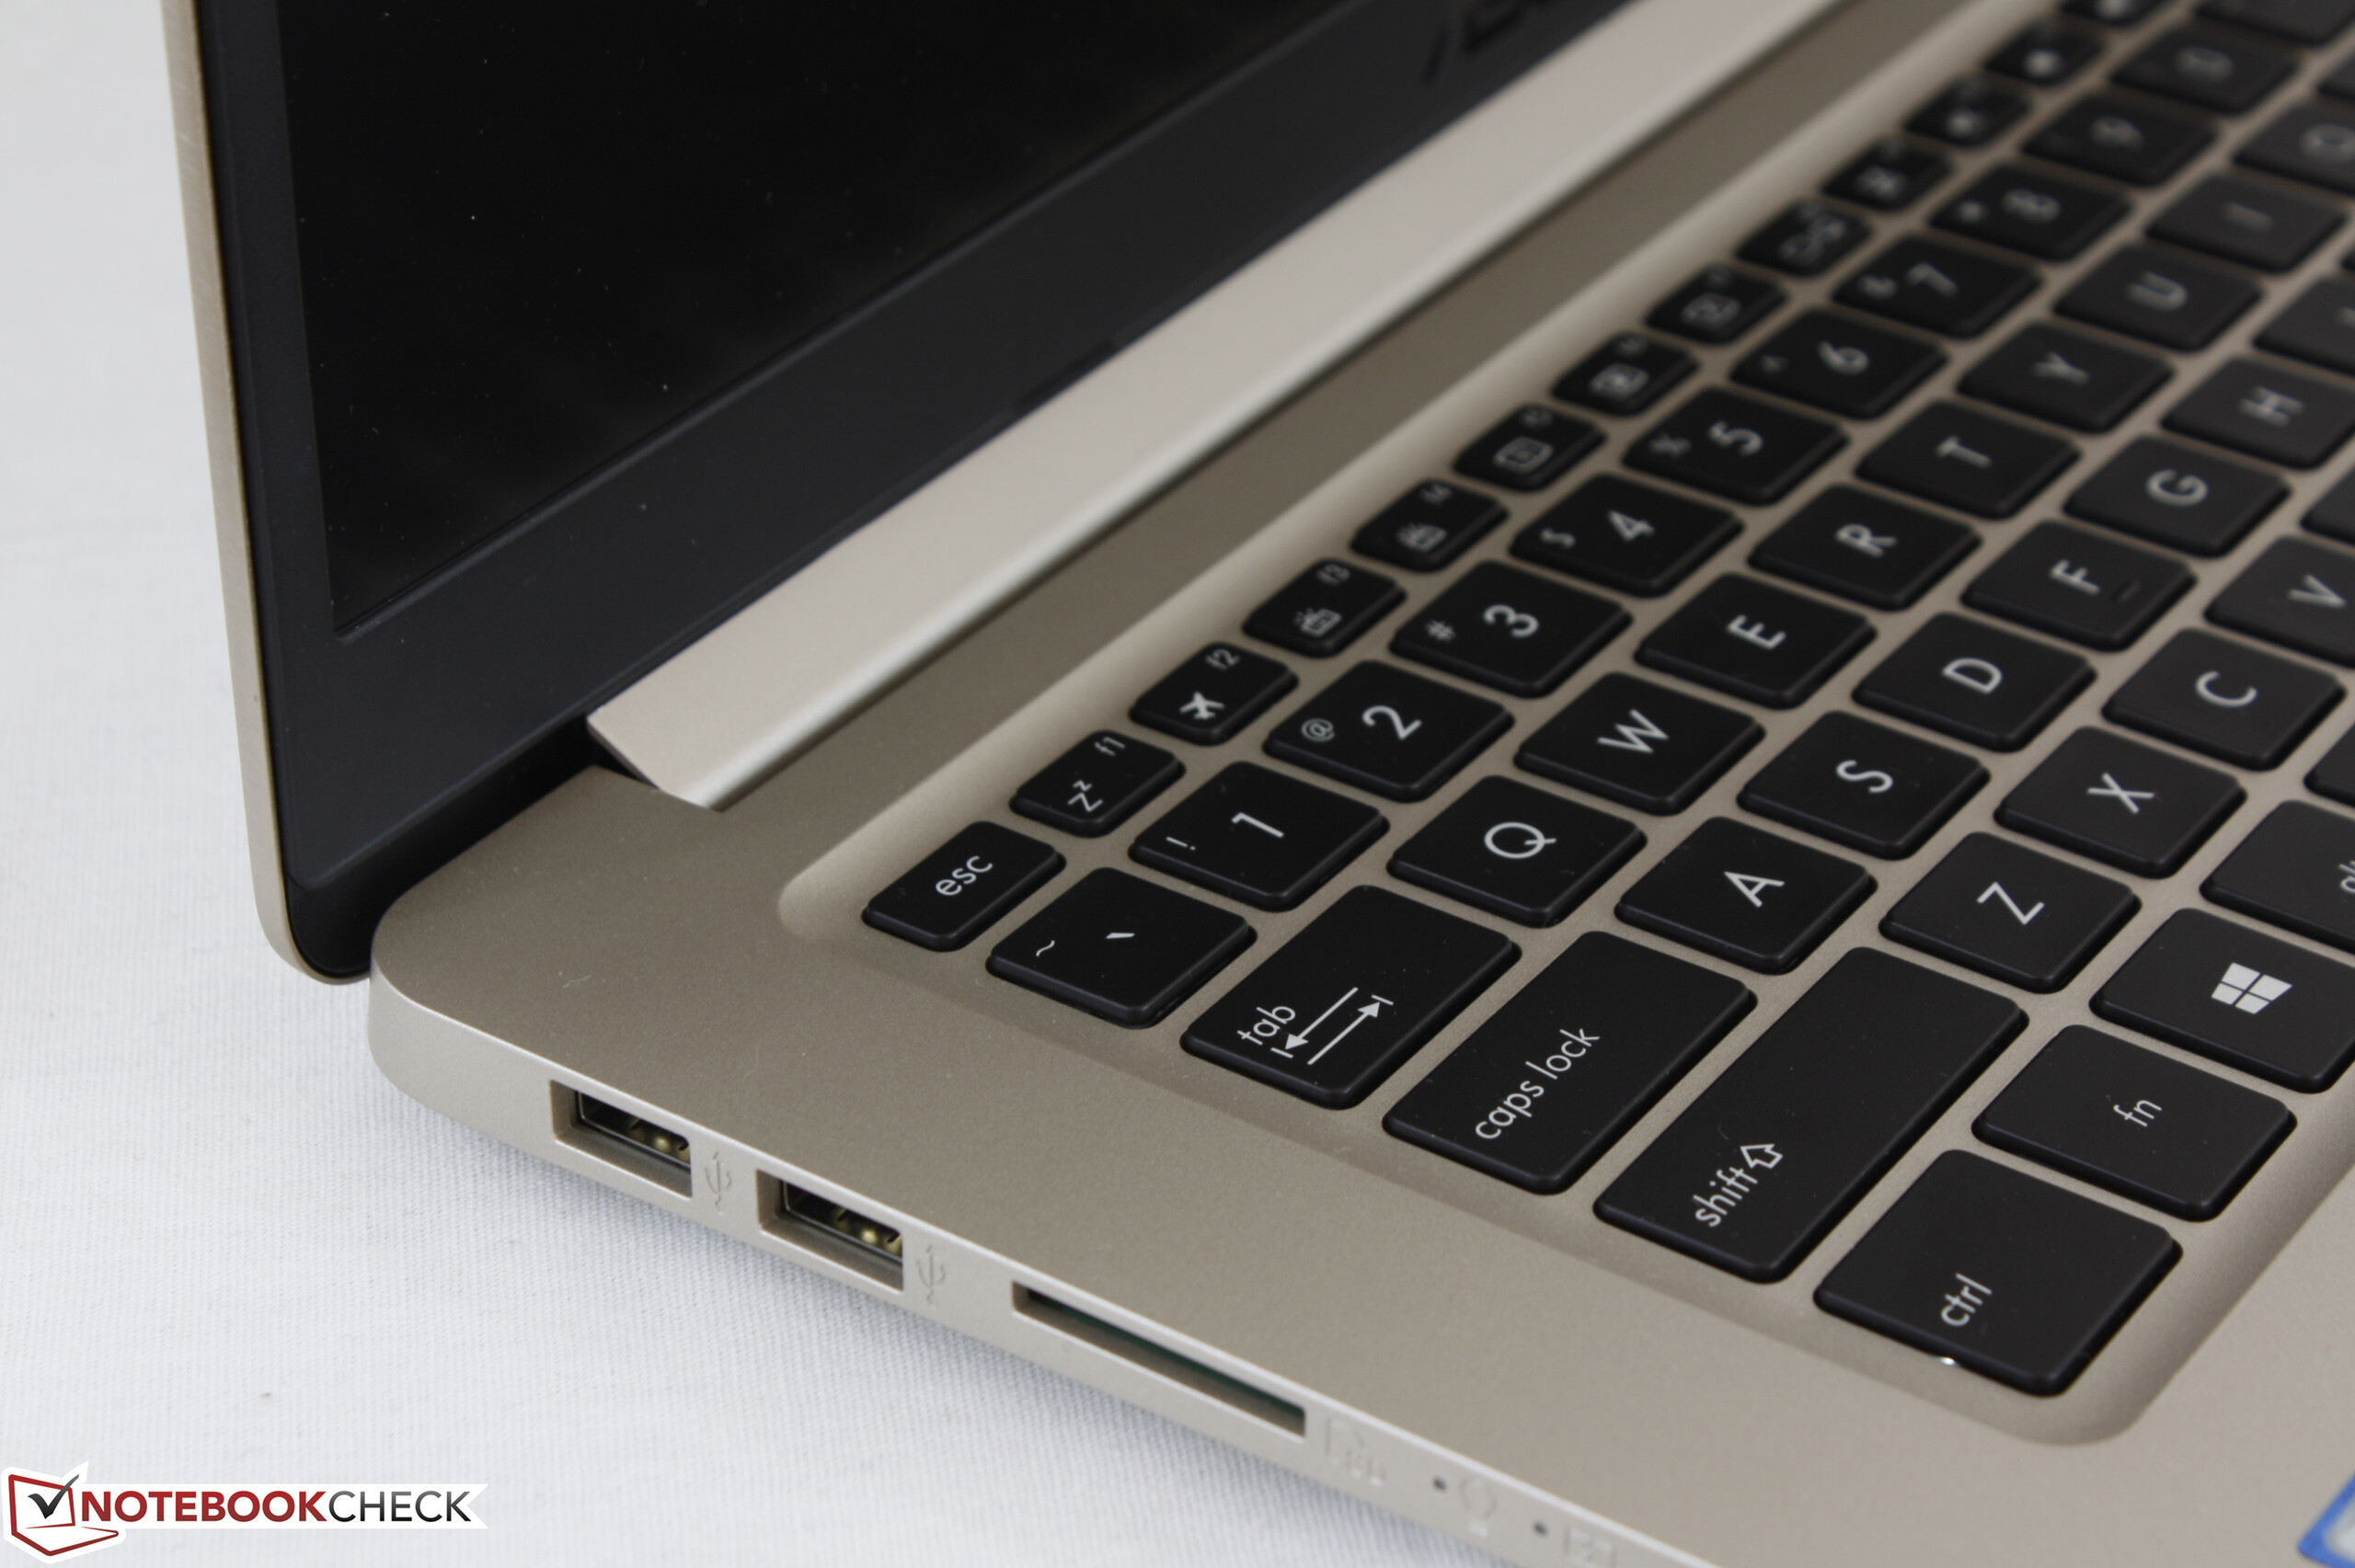
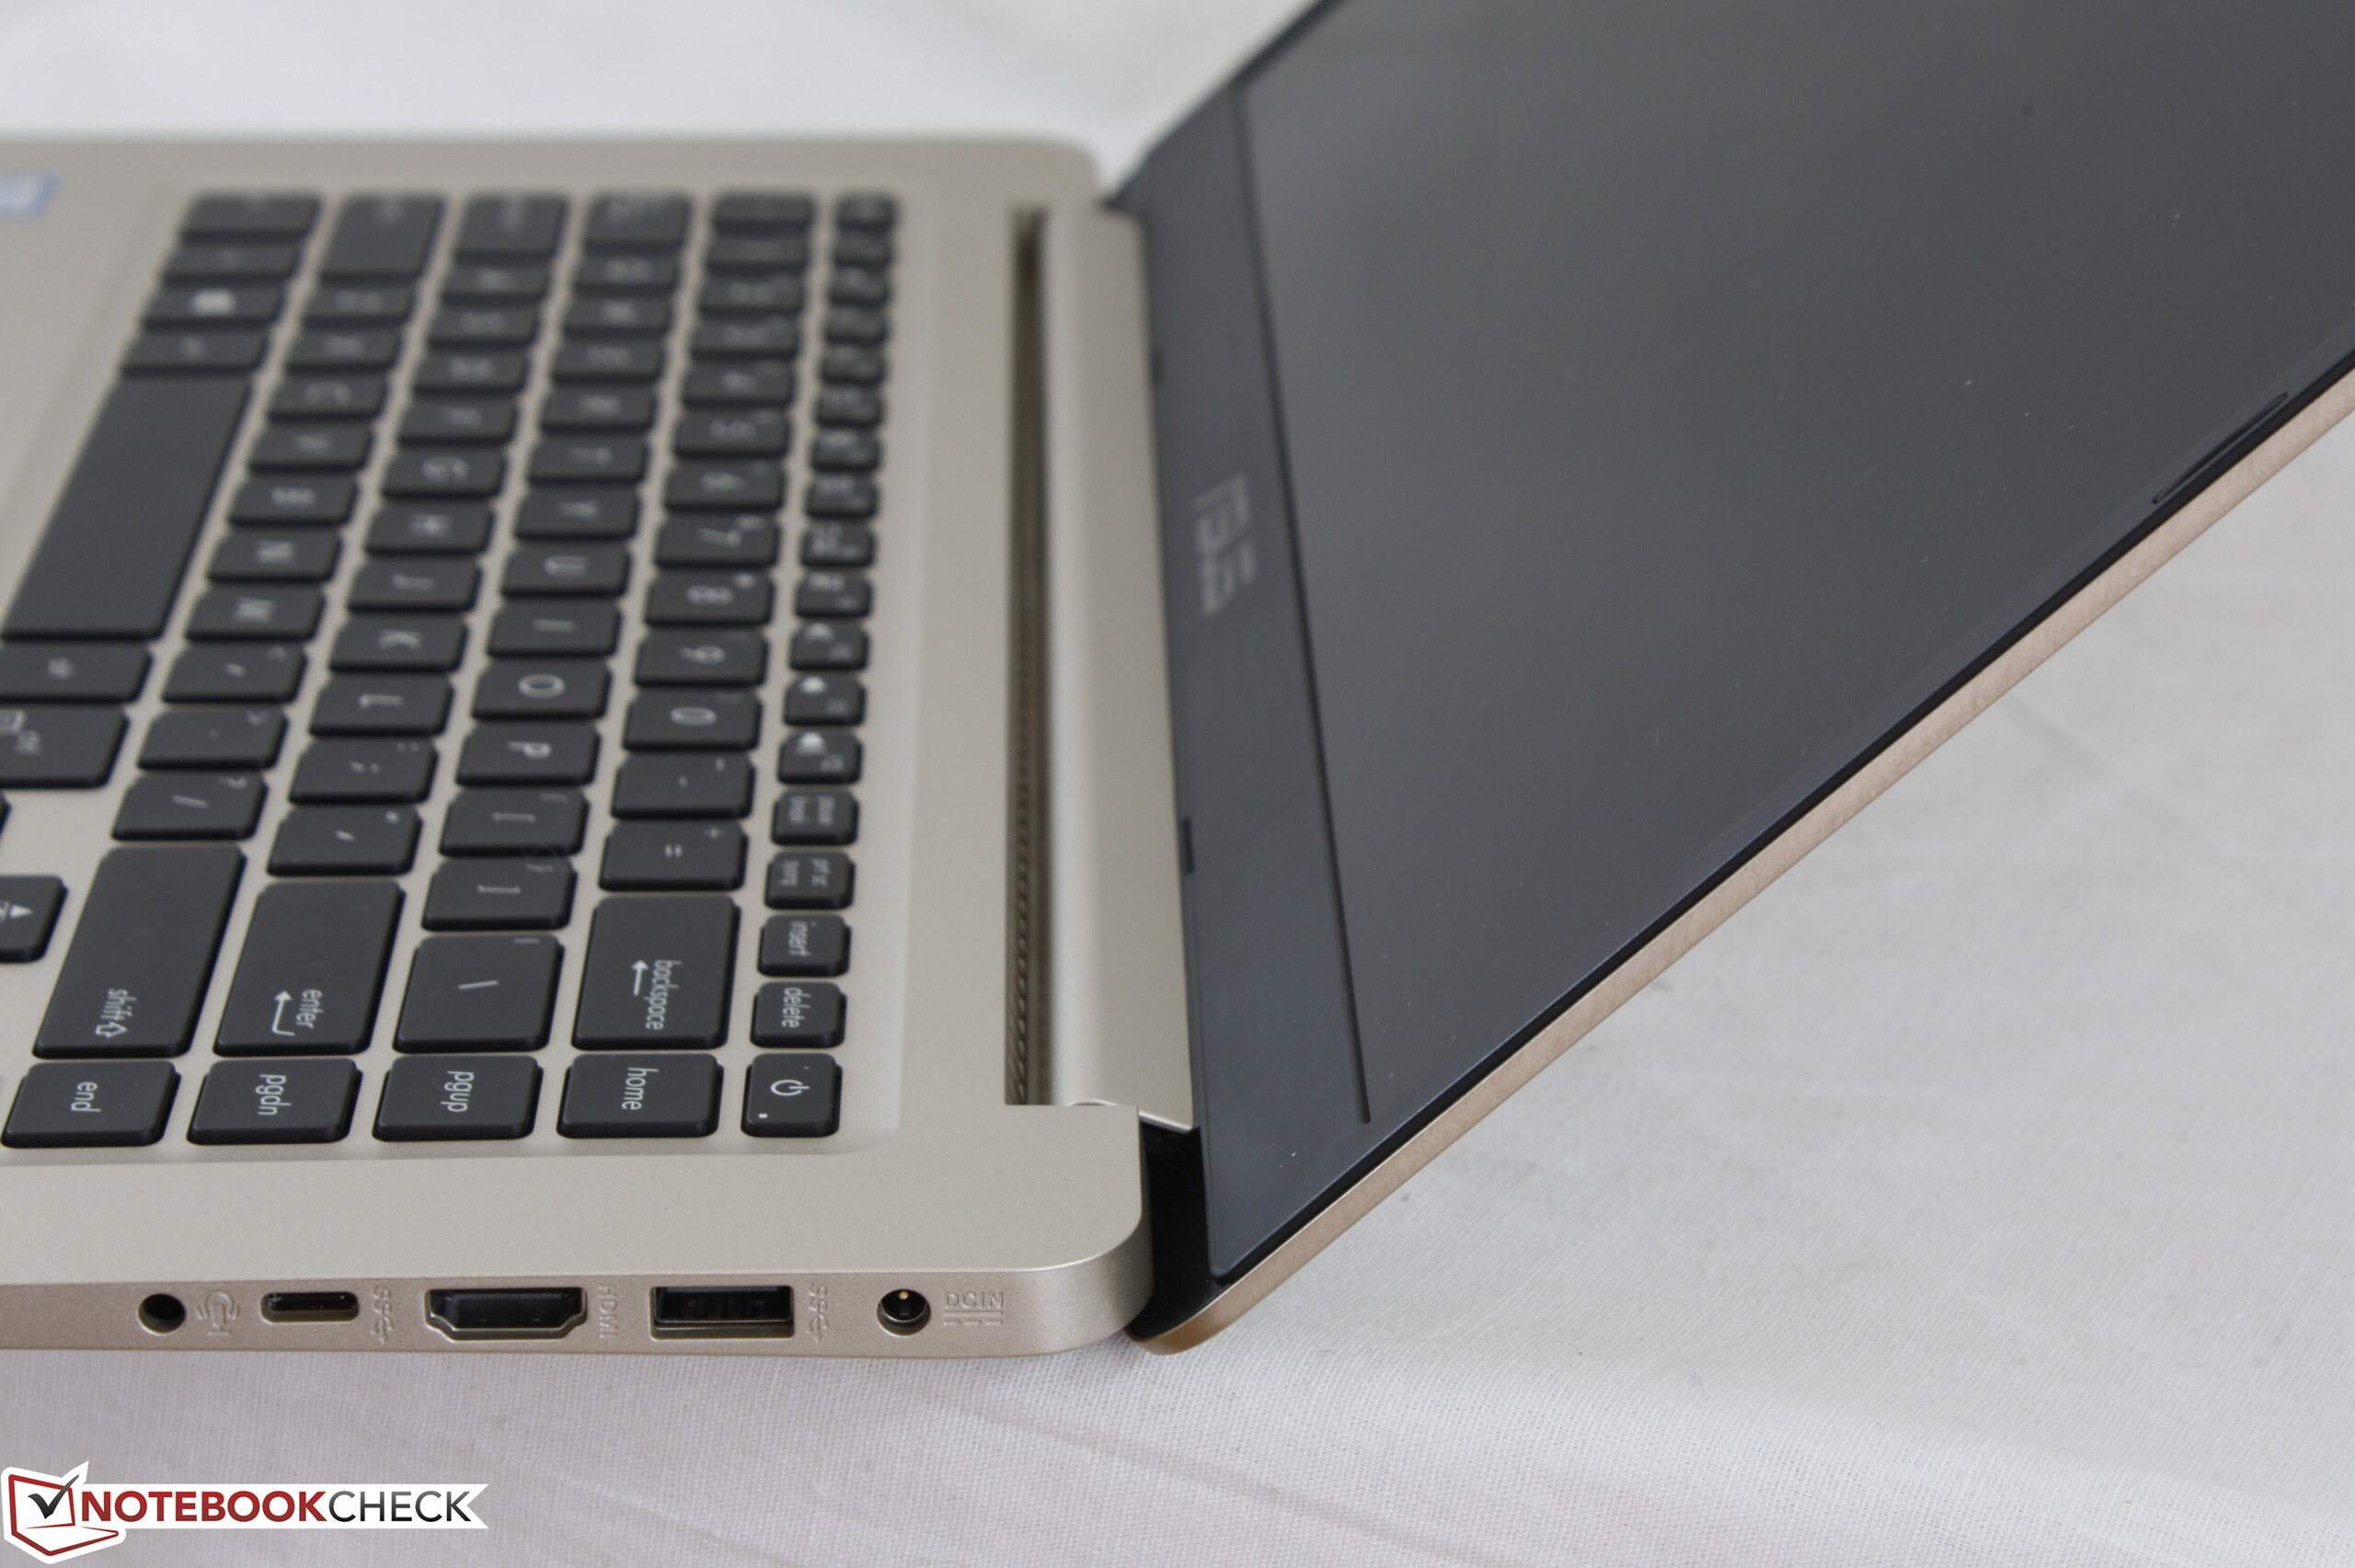
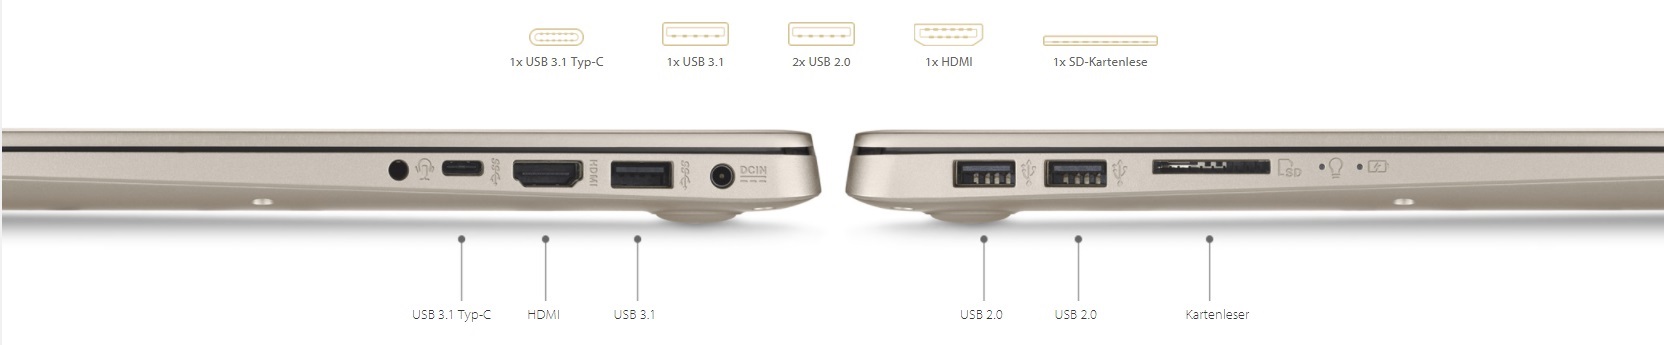
Tyvärr Asus, men er stiliga VivoBook S15 S510UQ är på många sätt ett misslyckande. Testenheten säljs för nästan 9 800 SEK (1000 Euro) på marknaden och det rimmar illa med höljets mediokra stabiliteten och tangentbordet som bara knappt får godkänt. Och vad finns det för syfte med TPM, fingeravtrycksläsare, liten storlek och låg vikt om batteriet dör efter bara fyra timmar? Hur kan bildbehandling dra nytta från bra kontrast och rätt färger om inte ens sRGB-färgrymden är helt täckt. Varför använder Asus ett grafikkort som inte förbättrar saker istället för att välja det avsevärt snabbare GeForce MX150? Var hittade Taiwaneserna en SSD vars tempo är så utdaterat? Hur passar 2x USB 2.0, den snigelaktiga kortläsaren och den riktigt dåliga webkameran priset?
I vår mening har Asus blivit ett offer för sin modell-strategi här. Modellvarianterna i samma serie börjar med priser där vi skulle kunna stå ut med sådana sparåtgärder, men vi förväntar oss helt enkelt mer för ~9 800 SEK (1000 Euro). Den som letar efter en kompakt 15-tums multimedialaptop för att ta med på resan skulle klara sig mycket bättre med exempelvis Acer Swift 3 SF315 i en av dess många varianter vi har testat det senaste.
Asus Vivobook S15 S510UQ-BQ189T
- 10/17/2017 v6 (old)
Sven Kloevekorn