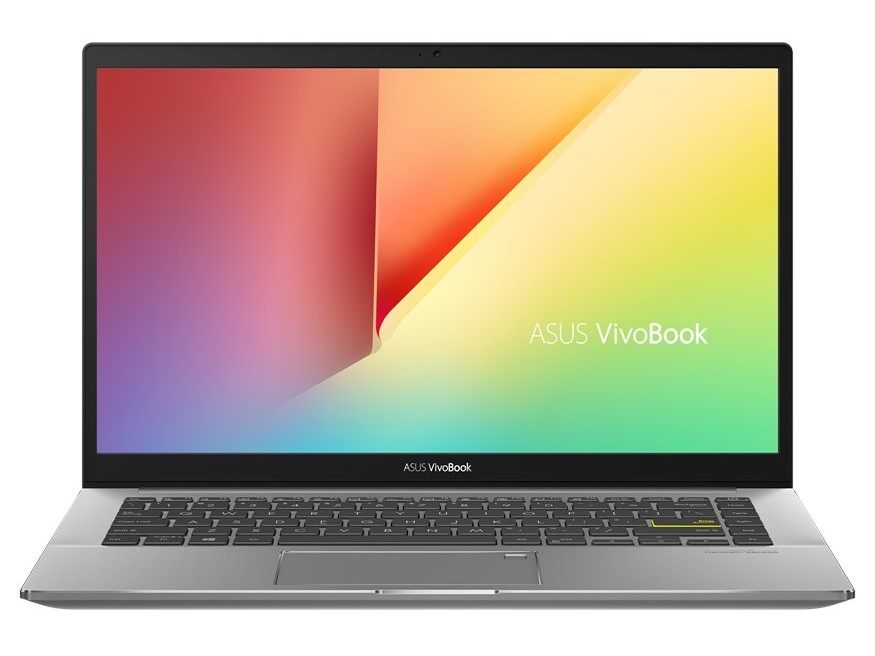
Test: Asus VivoBook S14 S433FL - Färgglad laptop med robust hölje (Sammanfattning)
Gradering | Datum | Modell | Vikt | Höjd | Storlek | Upplösning | Pris |
|---|---|---|---|---|---|---|---|
| 80.7 % v7 (old) | 07/2020 | Asus VivoBook S14 S433FL i7-10510U, GeForce MX250 | 1.4 kg | 16 mm | 14.00" | 1920x1080 | |
| 86.5 % v7 (old) | 06/2020 | Acer Swift 3 SF314-42-R4XJ R7 4700U, Vega 7 | 1.2 kg | 16.55 mm | 14.00" | 1920x1080 | |
| 85.6 % v7 (old) | 04/2020 | Schenker VIA 14 i5-10210U, UHD Graphics 620 | 1.1 kg | 16.5 mm | 14.00" | 1920x1080 | |
| 77.8 % v7 (old) | 01/2020 | HP Pavilion 14-ce3040ng i7-1065G7, GeForce MX250 | 1.6 kg | 18 mm | 14.00" | 1920x1080 |
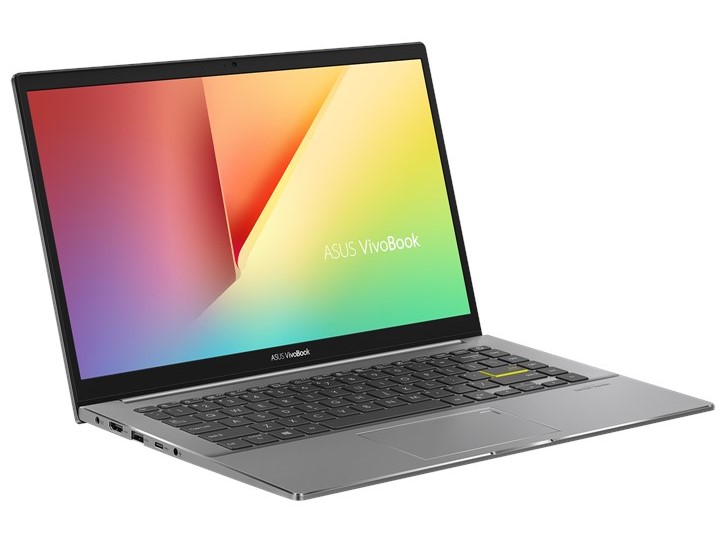
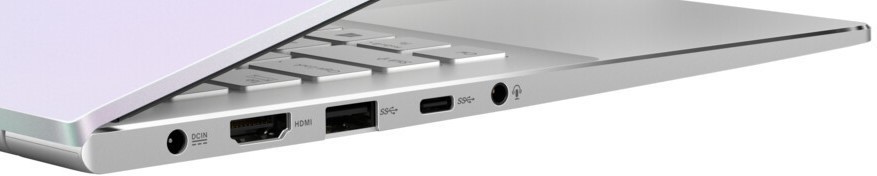
Portkonfiguration

| SD Card Reader | |
| average JPG Copy Test (av. of 3 runs) | |
| Genomsnitt av klass Multimedia (23 - 531, n=37, senaste 2 åren) | |
| Schenker VIA 14 | |
| HP Pavilion 14-ce3040ng (Toshiba Exceria Pro SDXC 64 GB UHS-II) | |
| Asus VivoBook S14 S433FL (Toshiba Exceria Pro M501 microSDXC 64GB) | |
| maximum AS SSD Seq Read Test (1GB) | |
| Genomsnitt av klass Multimedia (37.3 - 1455, n=36, senaste 2 åren) | |
| Schenker VIA 14 (Toshiba Exceria pro M501 64 GB UHS-II) | |
| HP Pavilion 14-ce3040ng (Toshiba Exceria Pro SDXC 64 GB UHS-II) | |
| Asus VivoBook S14 S433FL (Toshiba Exceria Pro M501 microSDXC 64GB) | |

")
")
| |||||||||||||||||||||||||
Distribution av ljusstyrkan: 68 %
Mitt på batteriet: 216 cd/m²
Kontrast: 1419:1 (Svärta: 0.155 cd/m²)
ΔE ColorChecker Calman: 5.23 | ∀{0.5-29.43 Ø4.71}
calibrated: 4.4
ΔE Greyscale Calman: 3.77 | ∀{0.09-98 Ø4.96}
62% sRGB (Argyll 1.6.3 3D)
40% AdobeRGB 1998 (Argyll 1.6.3 3D)
42.99% AdobeRGB 1998 (Argyll 3D)
62% sRGB (Argyll 3D)
41.55% Display P3 (Argyll 3D)
Gamma: 2.35
CCT: 6666 K
| Asus VivoBook S14 S433FL Chi Mei CMN14D4, IPS, 1920x1080, 14" | Acer Swift 3 SF314-42-R4XJ AU Optronics B140HAN04.0, IPS, 1920x1080, 14" | Schenker VIA 14 B140HAN06.2, a-Si AHVA-IPS LED, 1920x1080, 14" | HP Pavilion 14-ce3040ng AUO543D, IPS, 1920x1080, 14" | |
|---|---|---|---|---|
| Display | -10% | 65% | 59% | |
| Display P3 Coverage (%) | 41.55 | 37.2 -10% | 69.8 68% | 66.5 60% |
| sRGB Coverage (%) | 62 | 55.9 -10% | 99.6 61% | 98.4 59% |
| AdobeRGB 1998 Coverage (%) | 42.99 | 38.43 -11% | 71.6 67% | 68.2 59% |
| Response Times | -13% | -63% | -51% | |
| Response Time Grey 50% / Grey 80% * (ms) | 34 ? | 41 ? -21% | 60.8 ? -79% | 60.8 ? -79% |
| Response Time Black / White * (ms) | 24 ? | 25 ? -4% | 35.2 ? -47% | 29.6 ? -23% |
| PWM Frequency (Hz) | 250 ? | |||
| Screen | 3% | 44% | 27% | |
| Brightness middle (cd/m²) | 220 | 269 22% | 335 52% | 395 80% |
| Brightness (cd/m²) | 204 | 244 20% | 309 51% | 375 84% |
| Brightness Distribution (%) | 68 | 83 22% | 84 24% | 91 34% |
| Black Level * (cd/m²) | 0.155 | 0.23 -48% | 0.17 -10% | 0.26 -68% |
| Contrast (:1) | 1419 | 1170 -18% | 1971 39% | 1519 7% |
| Colorchecker dE 2000 * | 5.23 | 4.94 6% | 2.3 56% | 5.92 -13% |
| Colorchecker dE 2000 max. * | 21.51 | 20.37 5% | 5 77% | 9.79 54% |
| Colorchecker dE 2000 calibrated * | 4.4 | 5.03 -14% | 1 77% | 0.91 79% |
| Greyscale dE 2000 * | 3.77 | 1.71 55% | 3.9 -3% | 6.69 -77% |
| Gamma | 2.35 94% | 2.52 87% | 2.19 100% | 2.78 79% |
| CCT | 6666 98% | 6535 99% | 6556 99% | 7596 86% |
| Color Space (Percent of AdobeRGB 1998) (%) | 40 | 35 -12% | 65.5 64% | 63 58% |
| Color Space (Percent of sRGB) (%) | 62 | 56 -10% | 99.6 61% | 98 58% |
| Totalt genomsnitt (program/inställningar) | -7% /
-2% | 15% /
35% | 12% /
23% |
* ... mindre är bättre
Visa svarstider
| ↔ Svarstid svart till vitt | ||
|---|---|---|
| 24 ms ... stiga ↗ och falla ↘ kombinerat | ↗ 14 ms stiga | 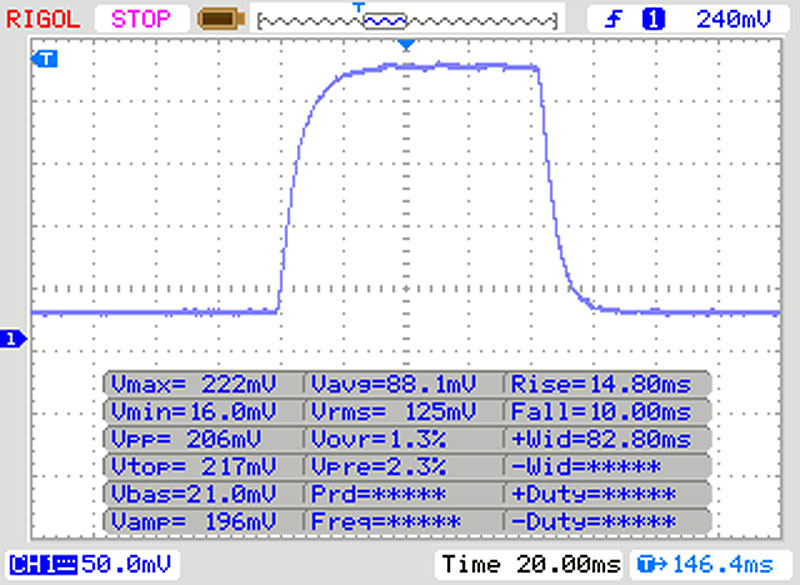 |
| ↘ 10 ms hösten | ||
| Skärmen visar bra svarsfrekvens i våra tester, men kan vara för långsam för konkurrenskraftiga spelare. I jämförelse sträcker sig alla testade enheter från 0.1 (minst) till 240 (maximalt) ms. » 54 % av alla enheter är bättre. Detta innebär att den uppmätta svarstiden är sämre än genomsnittet av alla testade enheter (19.8 ms). | ||
| ↔ Svarstid 50 % grått till 80 % grått | ||
| 34 ms ... stiga ↗ och falla ↘ kombinerat | ↗ 16 ms stiga | 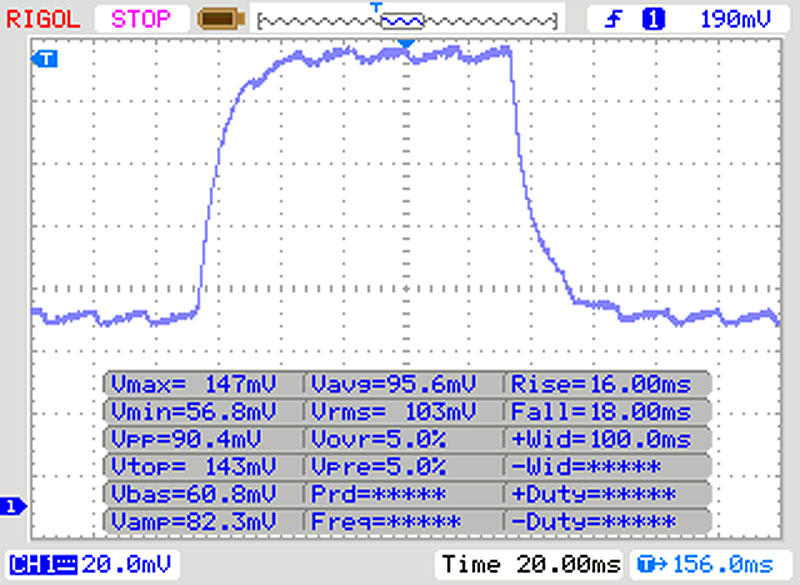 |
| ↘ 18 ms hösten | ||
| Skärmen visar långsamma svarsfrekvenser i våra tester och kommer att vara otillfredsställande för spelare. I jämförelse sträcker sig alla testade enheter från 0.165 (minst) till 636 (maximalt) ms. » 47 % av alla enheter är bättre. Det betyder att den uppmätta svarstiden liknar genomsnittet av alla testade enheter (31 ms). | ||
Skärmflimmer / PWM (Puls-Width Modulation)
| Skärmflimmer / PWM upptäckt | 250 Hz | ≤ 20 % ljusstyrka inställning | 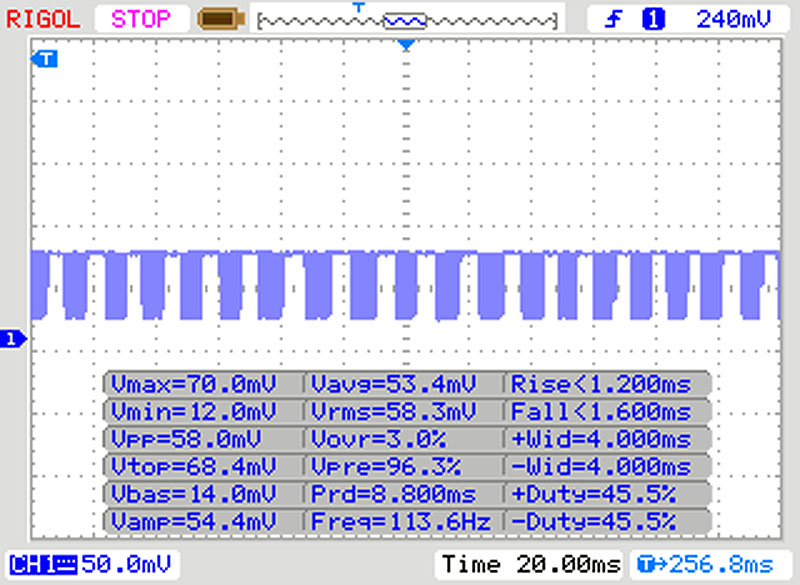 |
Displayens bakgrundsbelysning flimrar vid 250 Hz (i värsta fall, t.ex. med PWM) Flimrande upptäckt vid en ljusstyrkeinställning på 20 % och lägre. Det ska inte finnas något flimmer eller PWM över denna ljusstyrkeinställning. Frekvensen för 250 Hz är relativt låg, så känsliga användare kommer sannolikt att märka flimmer och uppleva ansträngda ögon vid den angivna ljusstyrkeinställningen och nedan. Som jämförelse: 52 % av alla testade enheter använder inte PWM för att dämpa skärmen. Om PWM upptäcktes mättes ett medelvärde av 7754 (minst: 5 - maximum: 343500) Hz. | |||
Cinebench R15: CPU Single 64Bit | CPU Multi 64Bit
Blender: v2.79 BMW27 CPU
7-Zip 18.03: 7z b 4 -mmt1 | 7z b 4
Geekbench 5.5: Single-Core | Multi-Core
HWBOT x265 Benchmark v2.2: 4k Preset
LibreOffice : 20 Documents To PDF
R Benchmark 2.5: Overall mean
| Cinebench R20 / CPU (Single Core) | |
| Genomsnitt av klass Multimedia (425 - 853, n=57, senaste 2 åren) | |
| HP Pavilion 14-ce3040ng | |
| Acer Swift 3 SF314-42-R4XJ | |
| Asus VivoBook S14 S433FL | |
| Genomsnitt Intel Core i7-10510U (362 - 497, n=37) | |
| Schenker VIA 14 | |
| Cinebench R20 / CPU (Multi Core) | |
| Genomsnitt av klass Multimedia (1887 - 12912, n=57, senaste 2 åren) | |
| Acer Swift 3 SF314-42-R4XJ | |
| HP Pavilion 14-ce3040ng | |
| Asus VivoBook S14 S433FL | |
| Genomsnitt Intel Core i7-10510U (1015 - 1897, n=38) | |
| Schenker VIA 14 | |
| Cinebench R15 / CPU Single 64Bit | |
| Genomsnitt av klass Multimedia (184.8 - 326, n=59, senaste 2 åren) | |
| HP Pavilion 14-ce3040ng | |
| Acer Swift 3 SF314-42-R4XJ | |
| Genomsnitt Intel Core i7-10510U (113 - 202, n=42) | |
| Asus VivoBook S14 S433FL | |
| Schenker VIA 14 | |
| Cinebench R15 / CPU Multi 64Bit | |
| Genomsnitt av klass Multimedia (856 - 5224, n=61, senaste 2 åren) | |
| Acer Swift 3 SF314-42-R4XJ | |
| Schenker VIA 14 | |
| HP Pavilion 14-ce3040ng | |
| Genomsnitt Intel Core i7-10510U (482 - 856, n=45) | |
| Asus VivoBook S14 S433FL | |
| Blender / v2.79 BMW27 CPU | |
| Schenker VIA 14 | |
| Genomsnitt Intel Core i7-10510U (628 - 1051, n=31) | |
| Asus VivoBook S14 S433FL | |
| Acer Swift 3 SF314-42-R4XJ | |
| Genomsnitt av klass Multimedia (100 - 557, n=58, senaste 2 åren) | |
| 7-Zip 18.03 / 7z b 4 -mmt1 | |
| Genomsnitt av klass Multimedia (3666 - 7545, n=56, senaste 2 åren) | |
| Asus VivoBook S14 S433FL | |
| Genomsnitt Intel Core i7-10510U (3747 - 4981, n=31) | |
| Acer Swift 3 SF314-42-R4XJ | |
| Schenker VIA 14 | |
| 7-Zip 18.03 / 7z b 4 | |
| Genomsnitt av klass Multimedia (26062 - 130368, n=55, senaste 2 åren) | |
| Acer Swift 3 SF314-42-R4XJ | |
| Genomsnitt Intel Core i7-10510U (12196 - 21298, n=31) | |
| Asus VivoBook S14 S433FL | |
| Schenker VIA 14 | |
| Geekbench 5.5 / Single-Core | |
| Genomsnitt av klass Multimedia (805 - 2974, n=56, senaste 2 åren) | |
| Asus VivoBook S14 S433FL | |
| Genomsnitt Intel Core i7-10510U (977 - 1287, n=31) | |
| Acer Swift 3 SF314-42-R4XJ | |
| Schenker VIA 14 | |
| Geekbench 5.5 / Multi-Core | |
| Genomsnitt av klass Multimedia (4652 - 20422, n=56, senaste 2 åren) | |
| Acer Swift 3 SF314-42-R4XJ | |
| Schenker VIA 14 | |
| Asus VivoBook S14 S433FL | |
| Genomsnitt Intel Core i7-10510U (2474 - 4484, n=31) | |
| HWBOT x265 Benchmark v2.2 / 4k Preset | |
| Genomsnitt av klass Multimedia (5.26 - 36.1, n=56, senaste 2 åren) | |
| Acer Swift 3 SF314-42-R4XJ | |
| Genomsnitt Intel Core i7-10510U (3.41 - 6.04, n=31) | |
| Asus VivoBook S14 S433FL | |
| Schenker VIA 14 | |
| LibreOffice / 20 Documents To PDF | |
| Genomsnitt Intel Core i7-10510U (50.7 - 77.8, n=27) | |
| Acer Swift 3 SF314-42-R4XJ | |
| Asus VivoBook S14 S433FL | |
| Genomsnitt av klass Multimedia (23.9 - 146.7, n=57, senaste 2 åren) | |
| R Benchmark 2.5 / Overall mean | |
| Schenker VIA 14 | |
| Genomsnitt Intel Core i7-10510U (0.637 - 0.81, n=28) | |
| Asus VivoBook S14 S433FL | |
| Acer Swift 3 SF314-42-R4XJ | |
| Genomsnitt av klass Multimedia (0.3604 - 0.947, n=56, senaste 2 åren) | |
* ... mindre är bättre
| PCMark 10 Score | 3933 poäng | |
Hjälp | ||
| DPC Latencies / LatencyMon - interrupt to process latency (max), Web, Youtube, Prime95 | |
| Schenker VIA 14 | |
| Acer Swift 3 SF314-42-R4XJ | |
| Asus VivoBook S14 S433FL | |
* ... mindre är bättre
| Asus VivoBook S14 S433FL Intel Optane Memory H10 with Solid State Storage 32GB + 512GB HBRPEKNX0202A(L/H) | Acer Swift 3 SF314-42-R4XJ Samsung PM991 MZVLQ1T0HALB | Schenker VIA 14 Seagate FireCuda 520 SSD ZP1000GM30002 | HP Pavilion 14-ce3040ng Toshiba XG6 KXG60ZNV1T02 | Genomsnitt Intel Optane Memory H10 with Solid State Storage 32GB + 512GB HBRPEKNX0202A(L/H) | Genomsnitt av klass Multimedia | |
|---|---|---|---|---|---|---|
| CrystalDiskMark 5.2 / 6 | 13% | 74% | 63% | -4% | 116% | |
| Write 4K (MB/s) | 124.9 | 98.8 -21% | 201 61% | 181.6 45% | 110.3 ? -12% | 164.4 ? 32% |
| Read 4K (MB/s) | 147.9 | 32.44 -78% | 60.2 -59% | 57.4 -61% | 131.9 ? -11% | 68 ? -54% |
| Write Seq (MB/s) | 753 | 1582 110% | 2471 228% | 1982 163% | 569 ? -24% | 2667 ? 254% |
| Read Seq (MB/s) | 1223 | 1471 20% | 2104 72% | 1899 55% | 1372 ? 12% | 3134 ? 156% |
| Write 4K Q32T1 (MB/s) | 369.2 | 375.4 2% | 323.6 -12% | 509 38% | 387 ? 5% | 463 ? 25% |
| Read 4K Q32T1 (MB/s) | 358.1 | 491.9 37% | 551 54% | 545 52% | 375 ? 5% | 584 ? 63% |
| Write Seq Q32T1 (MB/s) | 1057 | 1574 49% | 3407 222% | 3072 191% | 1141 ? 8% | 4640 ? 339% |
| Read Seq Q32T1 (MB/s) | 2738 | 2329 -15% | 3475 27% | 3281 20% | 2439 ? -11% | 5867 ? 114% |
| AS SSD | 37% | 215% | 166% | -3% | 206% | |
| Seq Read (MB/s) | 957 | 1960 105% | 2488 160% | 2762 189% | 1056 ? 10% | 4493 ? 369% |
| Seq Write (MB/s) | 353.1 | 1547 338% | 2615 641% | 2493 606% | 429 ? 21% | 3037 ? 760% |
| 4K Read (MB/s) | 62.4 | 31.56 -49% | 72.8 17% | 52.1 -17% | 61.9 ? -1% | 61.5 ? -1% |
| 4K Write (MB/s) | 122.8 | 116.6 -5% | 172.3 40% | 147.5 20% | 105 ? -14% | 184.5 ? 50% |
| 4K-64 Read (MB/s) | 386.2 | 454.7 18% | 2052 431% | 1473 281% | 459 ? 19% | 1084 ? 181% |
| 4K-64 Write (MB/s) | 605 | 262.1 -57% | 1746 189% | 1456 141% | 644 ? 6% | 2215 ? 266% |
| Access Time Read * (ms) | 0.107 | 0.06 44% | 0.094 12% | 0.1019 ? 5% | 0.06171 ? 42% | |
| Access Time Write * (ms) | 0.046 | 0.034 26% | 0.022 52% | 0.03 35% | 0.09417 ? -105% | 0.07475 ? -63% |
| Score Read (Points) | 544 | 682 25% | 2373 336% | 1801 231% | 627 ? 15% | 1595 ? 193% |
| Score Write (Points) | 763 | 533 -30% | 2180 186% | 1853 143% | 792 ? 4% | 2703 ? 254% |
| Score Total (Points) | 1581 | 1552 -2% | 5782 266% | 4568 189% | 1732 ? 10% | 5053 ? 220% |
| Totalt genomsnitt (program/inställningar) | 25% /
26% | 145% /
156% | 115% /
123% | -4% /
-3% | 161% /
168% |
* ... mindre är bättre

Kontinuerlig inläsning: DiskSpd Read Loop, Queue Depth 8
| 3DMark 11 Performance | 5022 poäng | |
| 3DMark Fire Strike Score | 3460 poäng | |
| 3DMark Time Spy Score | 1282 poäng | |
Hjälp | ||
| The Witcher 3 | |
| 1024x768 Low Graphics & Postprocessing | |
| Genomsnitt av klass Multimedia (68 - 169, n=4, senaste 2 åren) | |
| Genomsnitt NVIDIA GeForce MX250 (47.4 - 70, n=24) | |
| HP Pavilion 14-ce3040ng | |
| Acer Swift 3 SF314-42-R4XJ | |
| 1366x768 Medium Graphics & Postprocessing | |
| Genomsnitt av klass Multimedia (41 - 73, n=2, senaste 2 åren) | |
| Asus VivoBook S14 S433FL | |
| Genomsnitt NVIDIA GeForce MX250 (30 - 40, n=27) | |
| HP Pavilion 14-ce3040ng | |
| Acer Swift 3 SF314-42-R4XJ | |
| 1920x1080 High Graphics & Postprocessing (Nvidia HairWorks Off) | |
| Genomsnitt av klass Multimedia (22 - 224, n=7, senaste 2 åren) | |
| Asus VivoBook S14 S433FL | |
| Genomsnitt NVIDIA GeForce MX250 (16.3 - 23.1, n=27) | |
| HP Pavilion 14-ce3040ng | |
| Acer Swift 3 SF314-42-R4XJ | |
| 1920x1080 Ultra Graphics & Postprocessing (HBAO+) | |
| Genomsnitt av klass Multimedia (11 - 121, n=7, senaste 2 åren) | |
| Asus VivoBook S14 S433FL | |
| Genomsnitt NVIDIA GeForce MX250 (9 - 16, n=24) | |
| HP Pavilion 14-ce3040ng | |
| Acer Swift 3 SF314-42-R4XJ | |
| X-Plane 11.11 - 1920x1080 high (fps_test=3) | |
| Genomsnitt av klass Multimedia (16.9 - 141.1, n=54, senaste 2 åren) | |
| Genomsnitt NVIDIA GeForce MX250 (9.8 - 52.6, n=17) | |
| Asus VivoBook S14 S433FL | |
| Acer Swift 3 SF314-42-R4XJ | |
| Schenker VIA 14 | |
| låg | med. | hög | ultra | |
|---|---|---|---|---|
| The Witcher 3 (2015) | 36 | 21 | 13 | |
| Dota 2 Reborn (2015) | 102.4 | 90.5 | 71.3 | 63.8 |
| X-Plane 11.11 (2018) | 47.7 | 42.8 | 39.3 |
Ljudnivå
| Låg belastning |
| 31 / 31 / 31.3 dB(A) |
| Hög belastning |
| 43.4 / 41.5 dB(A) |
 | ||
30 dB tyst 40 dB(A) hörbar 50 dB(A) högt ljud |
||
min: | ||
(±) Den maximala temperaturen på ovansidan är 43 °C / 109 F, jämfört med genomsnittet av 36.8 °C / 98 F , allt från 21 till 71 °C för klassen Multimedia.
(±) Botten värms upp till maximalt 44.8 °C / 113 F, jämfört med genomsnittet av 39.1 °C / 102 F
(+) Vid tomgångsbruk är medeltemperaturen för ovansidan 25.7 °C / 78 F, jämfört med enhetsgenomsnittet på 31.3 °C / ### class_avg_f### F.
(±) När du spelar The Witcher 3 är medeltemperaturen för ovansidan 35.2 °C / 95 F, jämfört med enhetsgenomsnittet på 31.3 °C / ## #class_avg_f### F.
(+) Handledsstöden och pekplattan når maximal hudtemperatur (33.2 °C / 91.8 F) och är därför inte varma.
(-) Medeltemperaturen för handledsstödsområdet på liknande enheter var 28.7 °C / 83.7 F (-4.5 °C / -8.1 F).
Asus VivoBook S14 S433FL ljudanalys
(-) | inte särskilt höga högtalare (70.2 dB)
Bas 100 - 315 Hz
(-) | nästan ingen bas - i genomsnitt 18.1% lägre än medianen
(-) | basen är inte linjär (16.5% delta till föregående frekvens)
Mellan 400 - 2000 Hz
(+) | balanserad mellan - endast 4.8% från medianen
(±) | linjäriteten för mids är genomsnittlig (7.1% delta till föregående frekvens)
Högsta 2 - 16 kHz
(+) | balanserade toppar - endast 2.6% från medianen
(±) | linjäriteten för toppar är genomsnittlig (7.3% delta till föregående frekvens)
Totalt 100 - 16 000 Hz
(±) | linjäriteten för det totala ljudet är genomsnittlig (19.5% skillnad mot median)
Jämfört med samma klass
» 63% av alla testade enheter i den här klassen var bättre, 7% liknande, 29% sämre
» Den bästa hade ett delta på 5%, genomsnittet var 17%, sämst var 45%
Jämfört med alla testade enheter
» 49% av alla testade enheter var bättre, 7% liknande, 44% sämre
» Den bästa hade ett delta på 4%, genomsnittet var 23%, sämst var 134%
Apple MacBook 12 (Early 2016) 1.1 GHz ljudanalys
(+) | högtalare kan spela relativt högt (83.6 dB)
Bas 100 - 315 Hz
(±) | reducerad bas - i genomsnitt 11.3% lägre än medianen
(±) | linjäriteten för basen är genomsnittlig (14.2% delta till föregående frekvens)
Mellan 400 - 2000 Hz
(+) | balanserad mellan - endast 2.4% från medianen
(+) | mids är linjära (5.5% delta till föregående frekvens)
Högsta 2 - 16 kHz
(+) | balanserade toppar - endast 2% från medianen
(+) | toppar är linjära (4.5% delta till föregående frekvens)
Totalt 100 - 16 000 Hz
(+) | det totala ljudet är linjärt (10.2% skillnad mot median)
Jämfört med samma klass
» 7% av alla testade enheter i den här klassen var bättre, 2% liknande, 90% sämre
» Den bästa hade ett delta på 5%, genomsnittet var 18%, sämst var 53%
Jämfört med alla testade enheter
» 5% av alla testade enheter var bättre, 1% liknande, 94% sämre
» Den bästa hade ett delta på 4%, genomsnittet var 23%, sämst var 134%
| Av/Standby | |
| Låg belastning | |
| Hög belastning |
|
Förklaring:
min: | |
För
Emot
Omdöme - Mångsidig livsstilslaptop
Läs den fullständiga versionen av den här recensionen på engelska här.
Asus VivoBook S14 visade sig vara en riktigt mångsidig laptop i vårt test. Den har mer än tillräckligt med prestanda för kontorsapplikationer och prestandan från ett Nvidia GeForce MX250 räcker också för den som vill spela ett spel då och då. Tillsammans med bra batteritid och liten storlek är denna 14-tumslaptop dessutom en bra mobil kollega.
Asus VivoBook S14 S433FL är en bra allt-i-allo som presterar bra i många situationer.
Det enda vi kan klaga på är den långsamma microSD-kortläsaren och tangentbordet, som var lite för mjukt för vår smak. I övrigt är konfigurationen definitivt tillräcklig för datorns pris. Men känsliga användare skulle kunna få problem med PWM på låga ljusstyrkenivåer samt ett visst spoltjut som uppstår när nätadaptern är ansluten. Vill man ha en fingeravtrycksläsare får man dessutom vara utan ett numeriskt tangentbord, eller tvärtom.
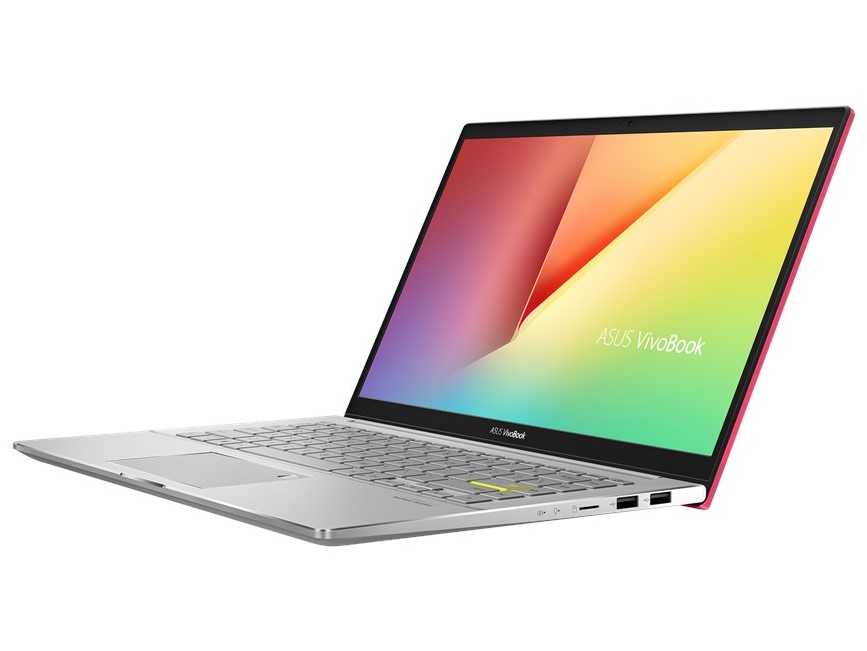
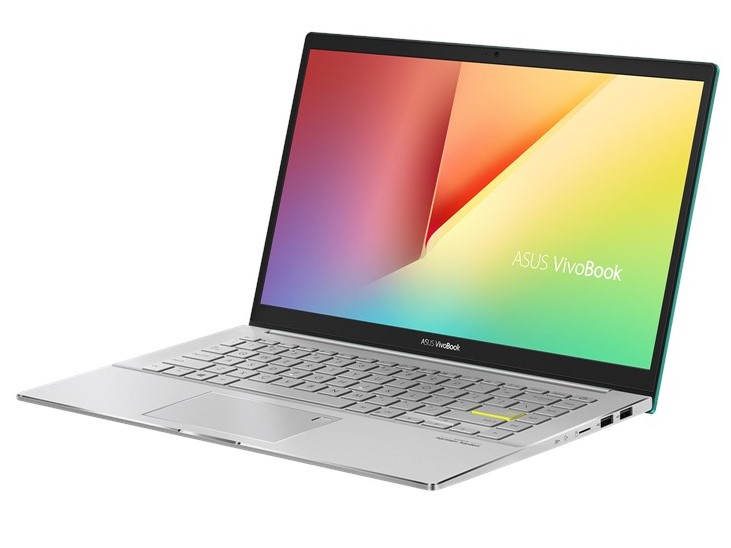
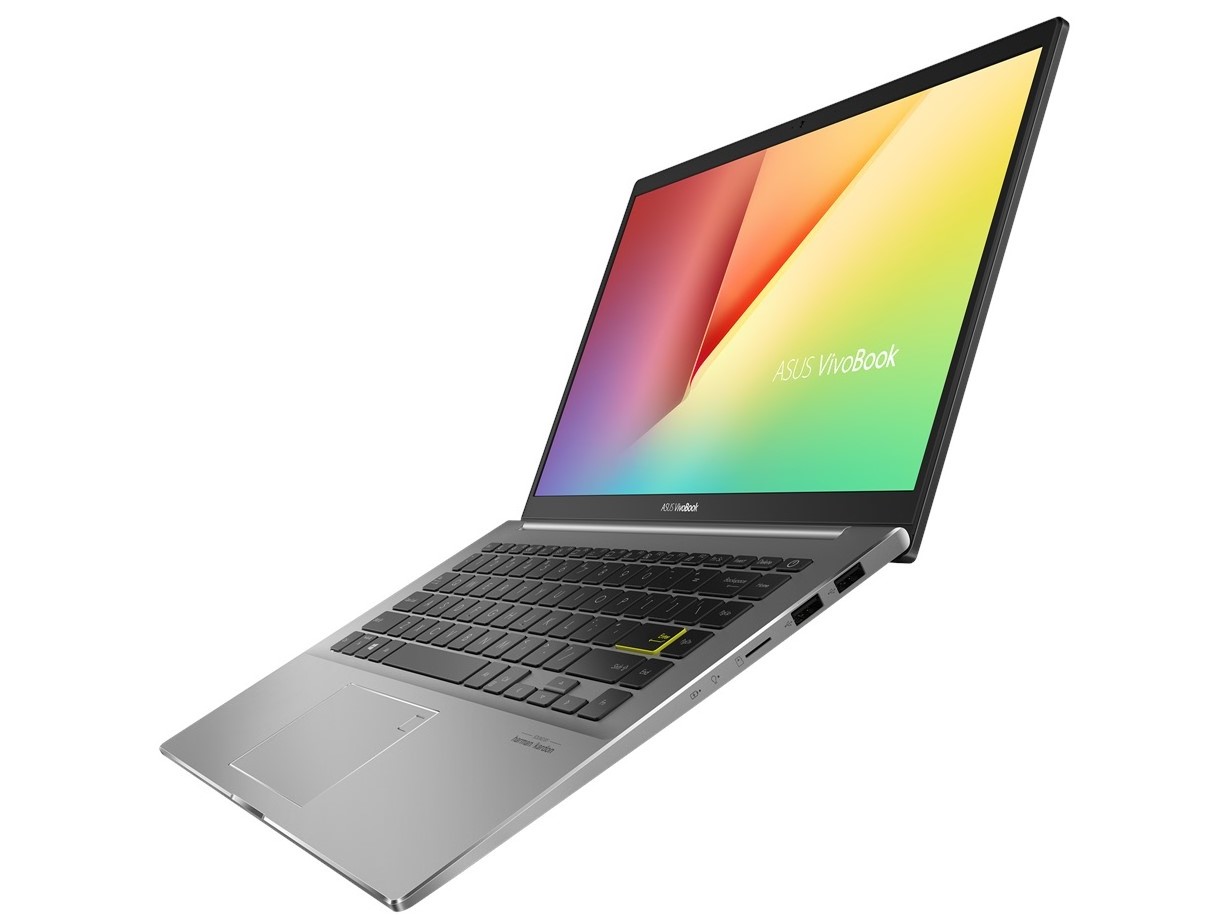
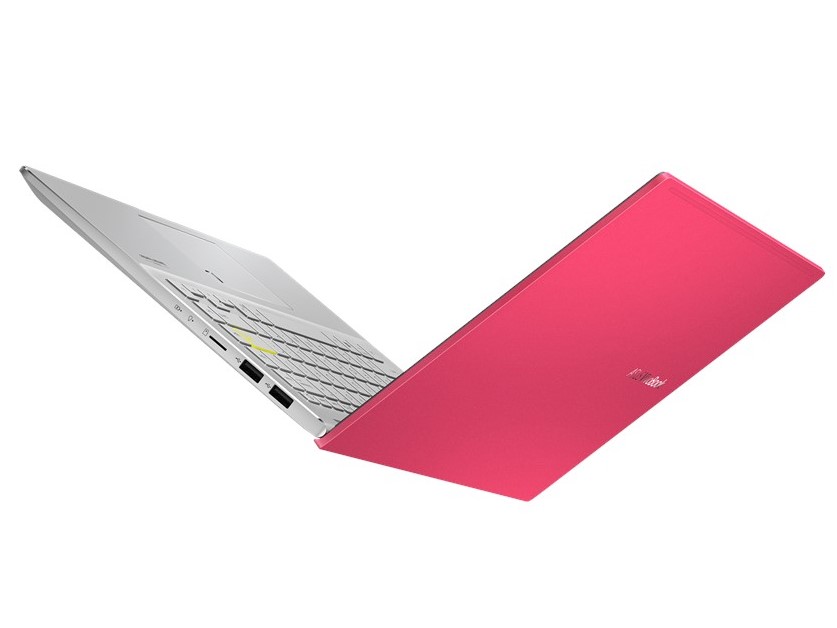
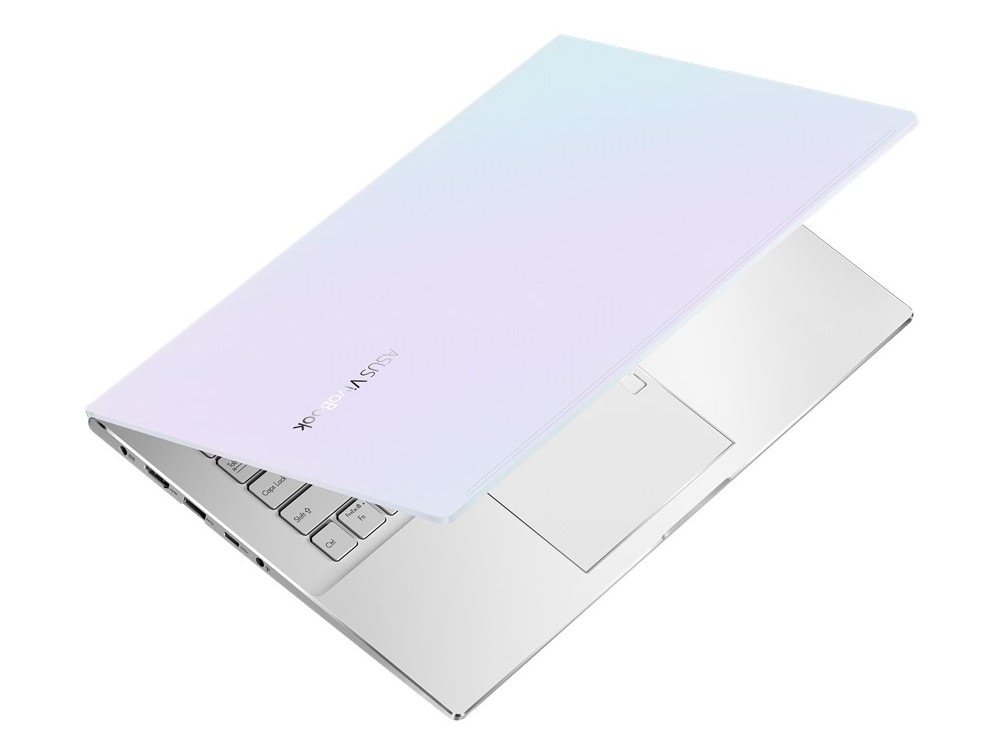
Asus VivoBook S14 S433FL
- 07/20/2020 v7 (old)
Mike Wobker
Price comparison
