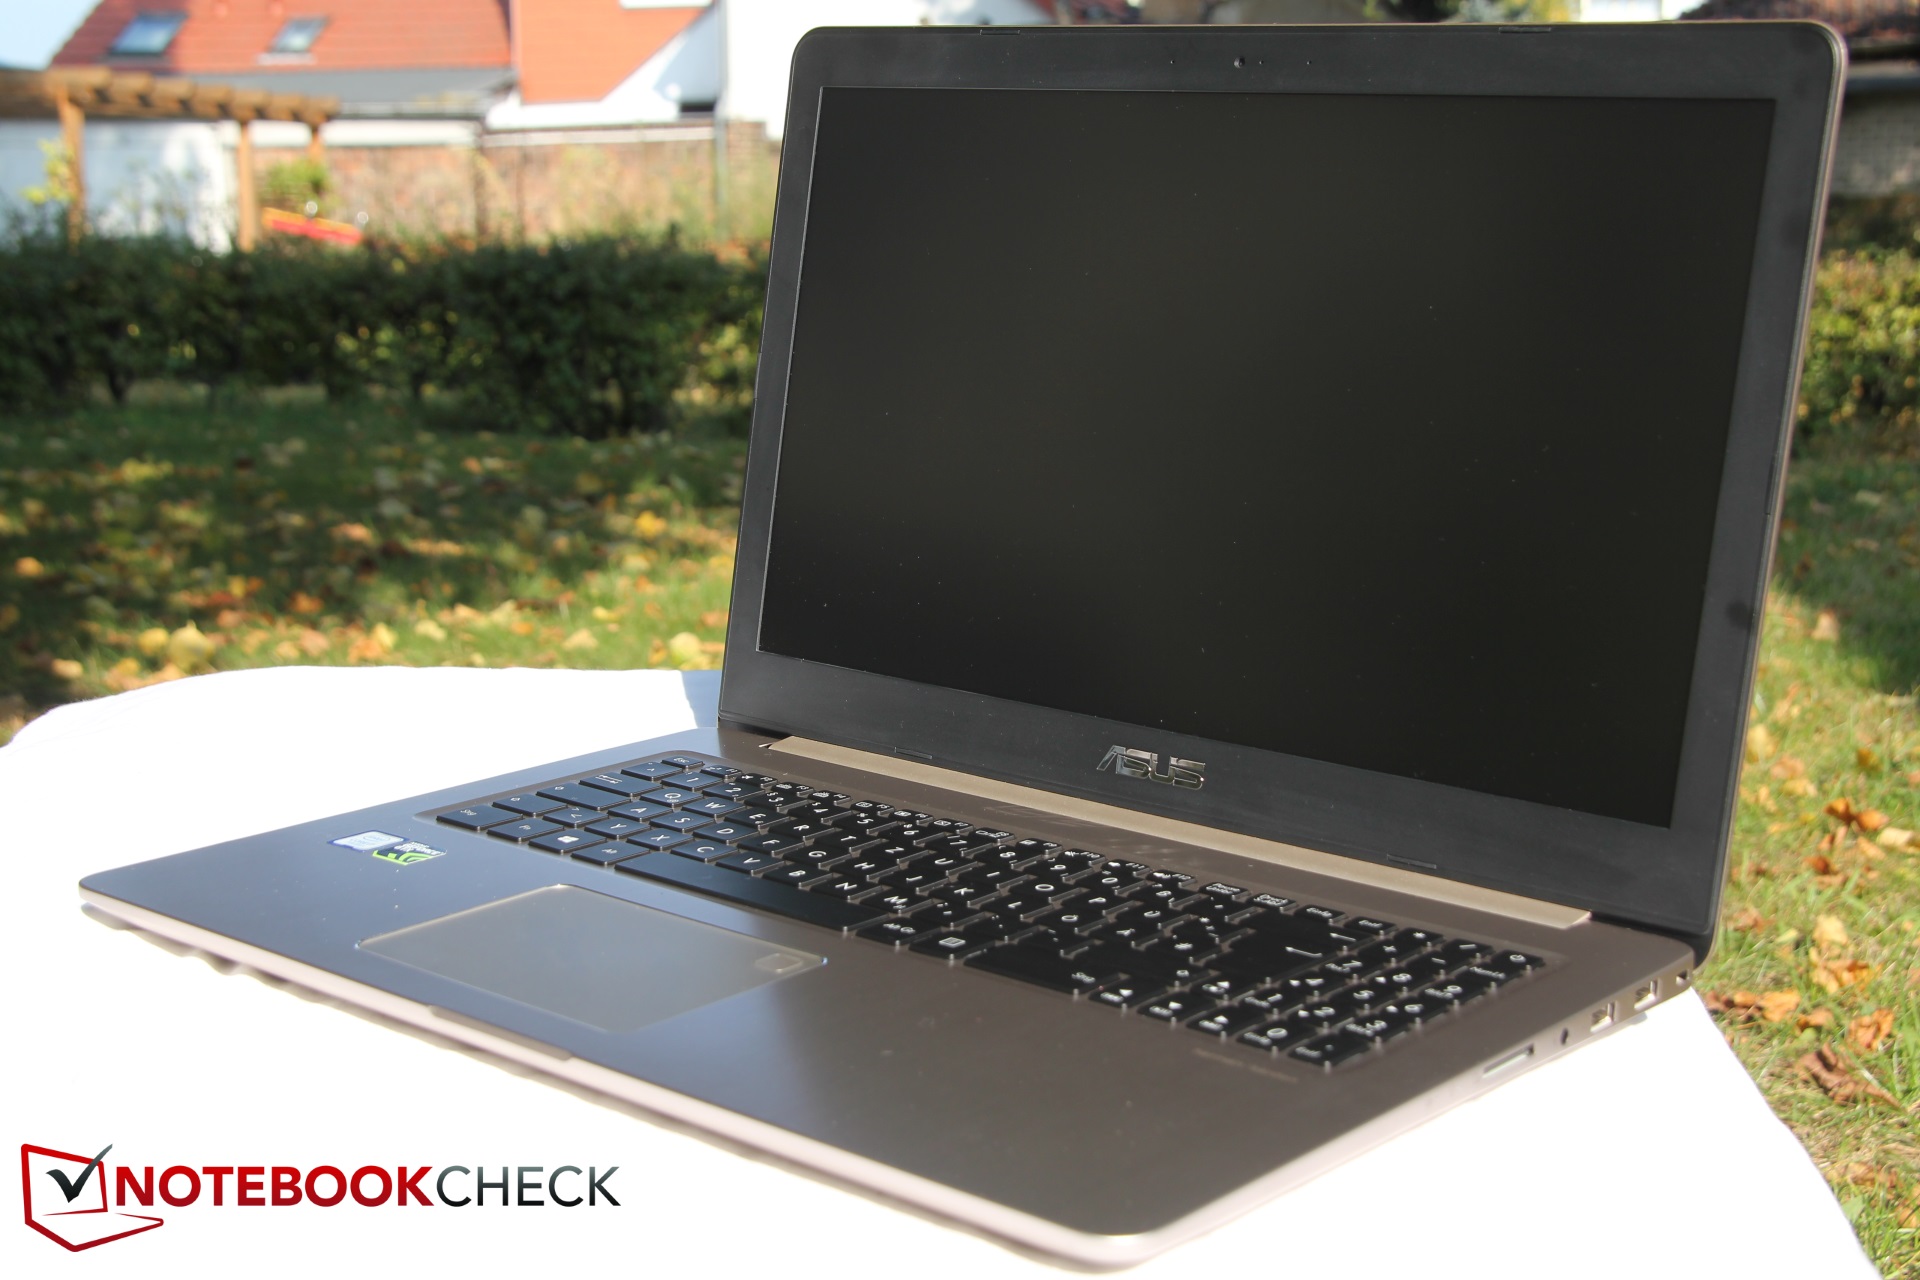
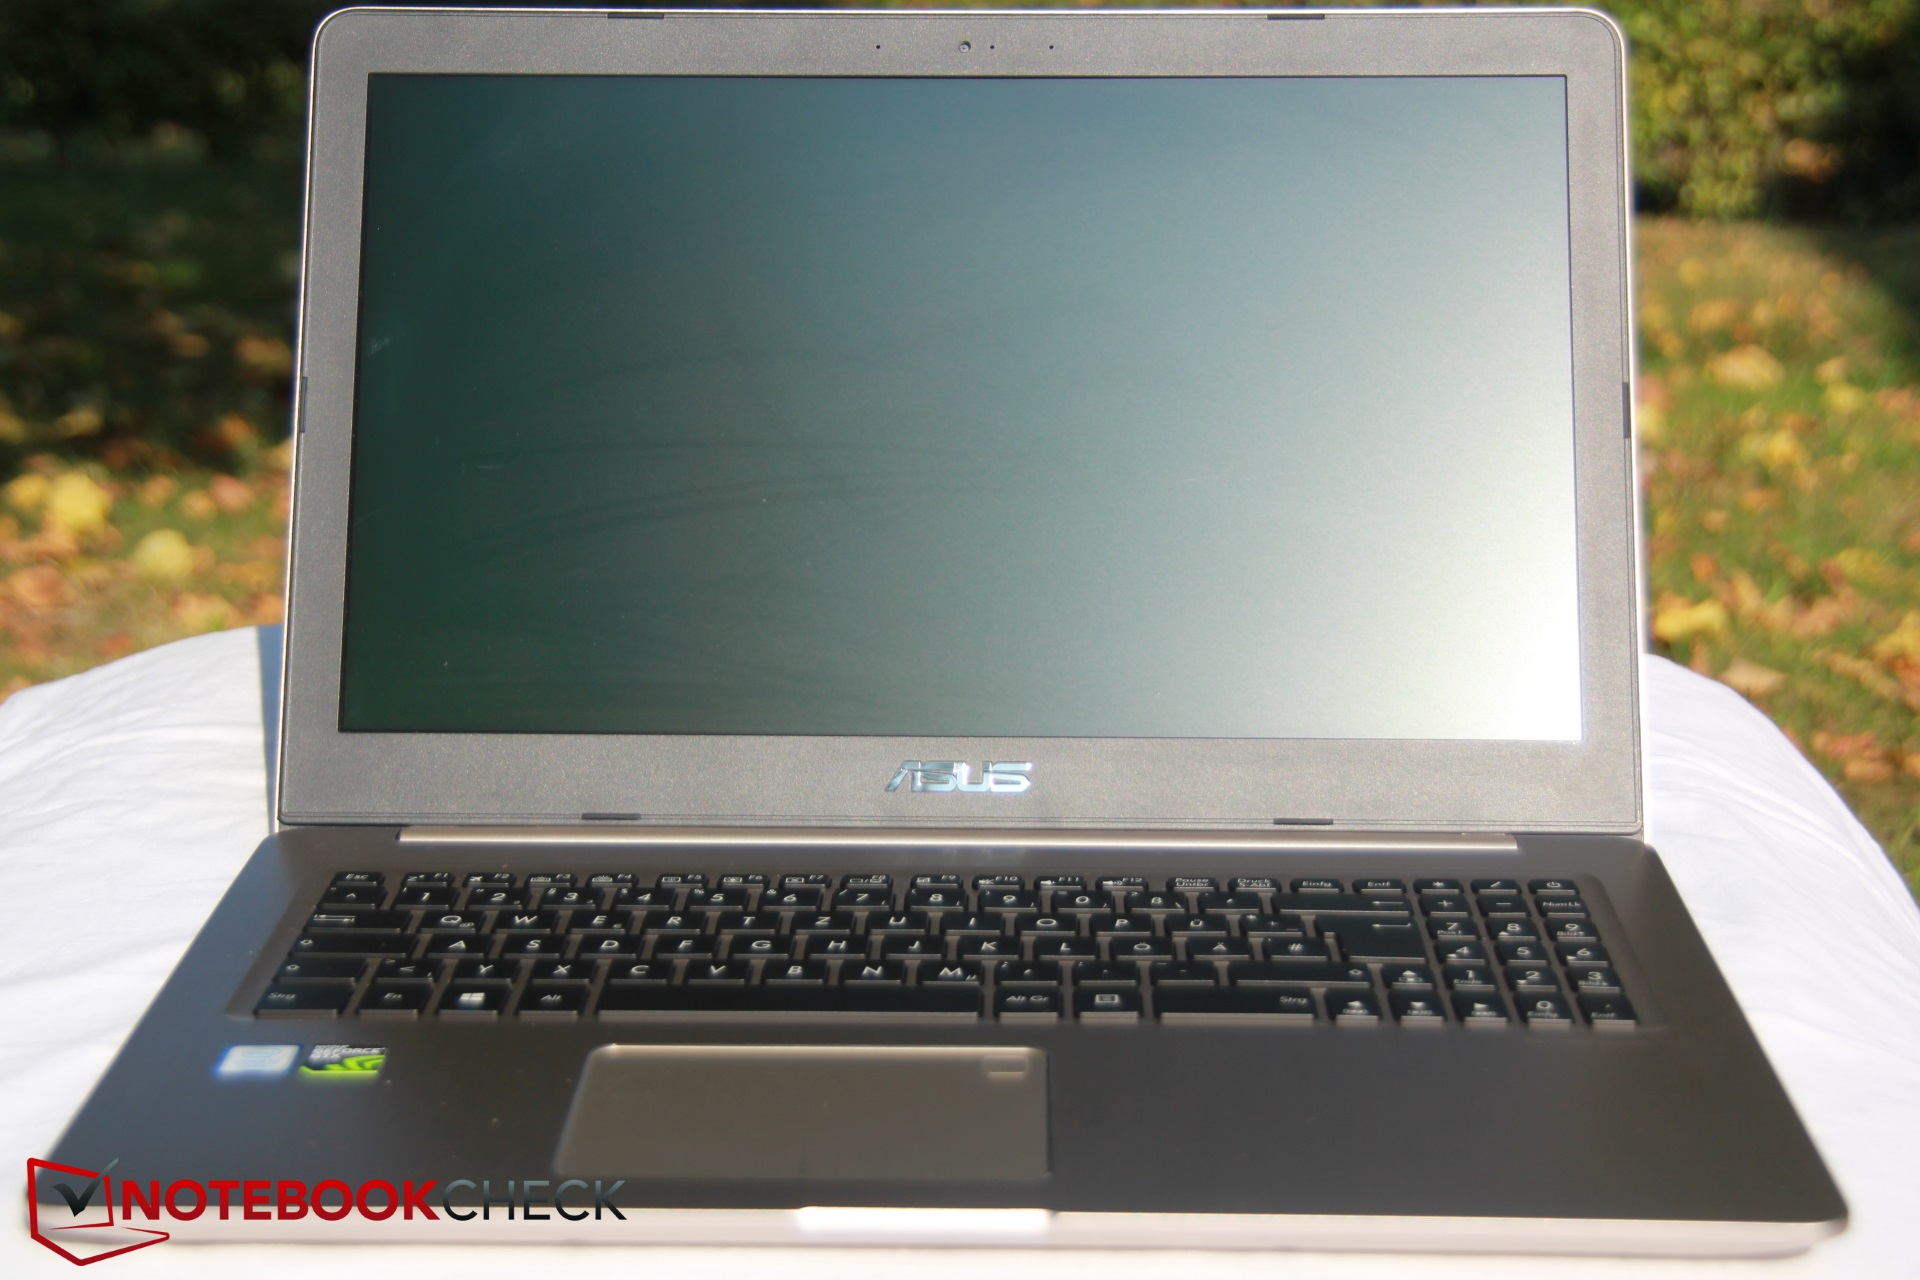
Test: Asus VivoBook Pro 15 (i7-7700HQ, GTX 1050) Laptop (Sammanfattning)
| Networking | |
| iperf3 transmit AX12 | |
| Asus VivoBook Pro 15 N580VD-DM028T | |
| Dell XPS 15 2017 9560 (7300HQ, Full-HD) | |
| Acer Aspire VX15 VX5-591G-589S | |
| HP Pavilion 15t-X7P42AV | |
| Asus ZenBook Pro UX550VD | |
| Gigabyte Sabre 15G | |
| iperf3 receive AX12 | |
| Dell XPS 15 2017 9560 (7300HQ, Full-HD) | |
| Acer Aspire VX15 VX5-591G-589S | |
| HP Pavilion 15t-X7P42AV | |
| Asus ZenBook Pro UX550VD | |
| Asus VivoBook Pro 15 N580VD-DM028T | |
| Gigabyte Sabre 15G | |
| |||||||||||||||||||||||||
Distribution av ljusstyrkan: 85 %
Mitt på batteriet: 246 cd/m²
Kontrast: 515:1 (Svärta: 0.48 cd/m²)
ΔE ColorChecker Calman: 5.39 | ∀{0.5-29.43 Ø4.73}
ΔE Greyscale Calman: 5.25 | ∀{0.09-98 Ø4.97}
60% sRGB (Argyll 1.6.3 3D)
38% AdobeRGB 1998 (Argyll 1.6.3 3D)
41.27% AdobeRGB 1998 (Argyll 3D)
59.8% sRGB (Argyll 3D)
39.92% Display P3 (Argyll 3D)
Gamma: 2.48
CCT: 7609 K
| Asus VivoBook Pro 15 N580VD-DM028T INNOLUX N156HGA-EAB, , 1920x1080, 15.6" | Asus ZenBook Pro UX550VD CMN15E8 (N156HCE-EN1), , 1920x1080, 15.6" | Gigabyte Sabre 15G ID: LGD0533, Name: LG Display LP156WF6-SPK3, , 1920x1080, 15.6" | HP Pavilion 15t-X7P42AV AU Optronics AUO41ED, , 1920x1080, 15.6" | Acer Aspire VX15 VX5-591G-589S BOE CQ NV156HFM-N42, , 1920x1080, 15.6" | Dell XPS 15 2017 9560 (7300HQ, Full-HD) Sharp SHP1453 LQ156M1, , 1920x1080, 15.6" | |
|---|---|---|---|---|---|---|
| Display | 59% | -2% | -5% | 1% | 70% | |
| Display P3 Coverage (%) | 39.92 | 65.7 65% | 38.97 -2% | 38.03 -5% | 40.56 2% | 68.9 73% |
| sRGB Coverage (%) | 59.8 | 90.3 51% | 58.2 -3% | 56.5 -6% | 59.4 -1% | 98.9 65% |
| AdobeRGB 1998 Coverage (%) | 41.27 | 65.9 60% | 40.3 -2% | 39.29 -5% | 41.9 2% | 70.9 72% |
| Response Times | -49% | -35% | -55% | -84% | -163% | |
| Response Time Grey 50% / Grey 80% * (ms) | 44 ? | 38.8 ? 12% | 32 ? 27% | 44.4 ? -1% | 46 ? -5% | 54 ? -23% |
| Response Time Black / White * (ms) | 13 ? | 27.2 ? -109% | 25.6 ? -97% | 27.2 ? -109% | 34 ? -162% | 52.4 ? -303% |
| PWM Frequency (Hz) | 25000 ? | 25910 ? | 20000 ? | 20000 ? | ||
| Screen | 36% | -18% | -16% | 23% | 46% | |
| Brightness middle (cd/m²) | 247 | 335 36% | 248.4 1% | 209.7 -15% | 277 12% | 400 62% |
| Brightness (cd/m²) | 224 | 313 40% | 241 8% | 193 -14% | 268 20% | 392 75% |
| Brightness Distribution (%) | 85 | 83 -2% | 84 -1% | 75 -12% | 91 7% | 89 5% |
| Black Level * (cd/m²) | 0.48 | 0.27 44% | 0.3 37% | 0.19 60% | 0.26 46% | 0.26 46% |
| Contrast (:1) | 515 | 1241 141% | 828 61% | 1104 114% | 1065 107% | 1538 199% |
| Colorchecker dE 2000 * | 5.39 | 4.7 13% | 7.5 -39% | 7.8 -45% | 5.05 6% | 4.9 9% |
| Colorchecker dE 2000 max. * | 7.98 | 8.1 -2% | 25.2 -216% | 24.1 -202% | 8.93 -12% | 11 -38% |
| Greyscale dE 2000 * | 5.25 | 5.8 -10% | 6.5 -24% | 7.3 -39% | 2.97 43% | 7.2 -37% |
| Gamma | 2.48 89% | 2.06 107% | 2.19 100% | 2.39 92% | 2.39 92% | 2.11 104% |
| CCT | 7609 85% | 6518 100% | 7852 83% | 5771 113% | 6466 101% | 6911 94% |
| Color Space (Percent of AdobeRGB 1998) (%) | 38 | 58.7 54% | 37 -3% | 39.3 3% | 38 0% | 64.2 69% |
| Color Space (Percent of sRGB) (%) | 60 | 90.1 50% | 57.9 -3% | 56.5 -6% | 59 -2% | 98.9 65% |
| Totalt genomsnitt (program/inställningar) | 15% /
30% | -18% /
-17% | -25% /
-19% | -20% /
4% | -16% /
23% |
* ... mindre är bättre
Visa svarstider
| ↔ Svarstid svart till vitt | ||
|---|---|---|
| 13 ms ... stiga ↗ och falla ↘ kombinerat | ↗ 10 ms stiga | 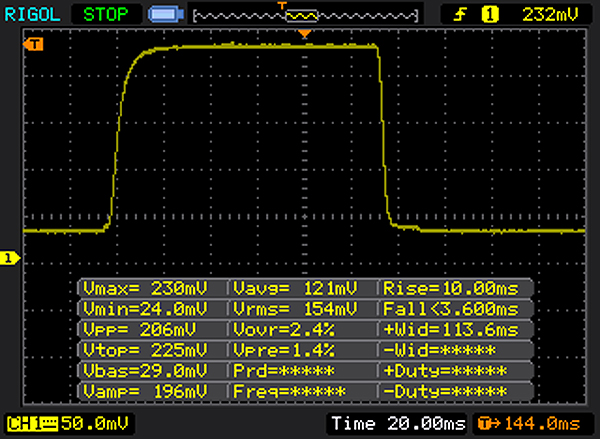 |
| ↘ 3 ms hösten | ||
| Skärmen visar bra svarsfrekvens i våra tester, men kan vara för långsam för konkurrenskraftiga spelare. I jämförelse sträcker sig alla testade enheter från 0.1 (minst) till 240 (maximalt) ms. » 33 % av alla enheter är bättre. Det betyder att den uppmätta svarstiden är bättre än genomsnittet av alla testade enheter (19.9 ms). | ||
| ↔ Svarstid 50 % grått till 80 % grått | ||
| 44 ms ... stiga ↗ och falla ↘ kombinerat | ↗ 25 ms stiga | 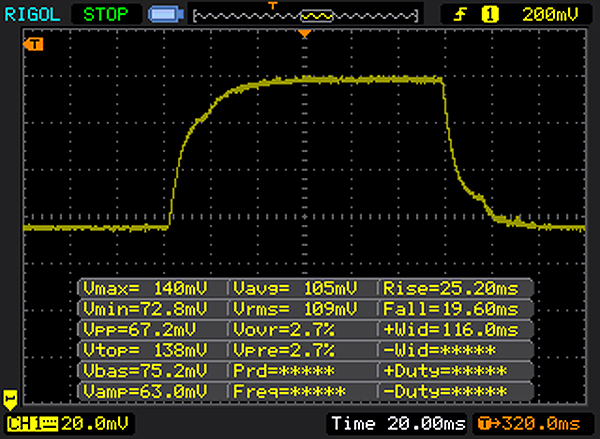 |
| ↘ 19 ms hösten | ||
| Skärmen visar långsamma svarsfrekvenser i våra tester och kommer att vara otillfredsställande för spelare. I jämförelse sträcker sig alla testade enheter från 0.165 (minst) till 636 (maximalt) ms. » 73 % av alla enheter är bättre. Detta innebär att den uppmätta svarstiden är sämre än genomsnittet av alla testade enheter (31.1 ms). | ||
Skärmflimmer / PWM (Puls-Width Modulation)
| Skärmflimmer / PWM upptäckt | 25000 Hz | ≤ 30 % ljusstyrka inställning | 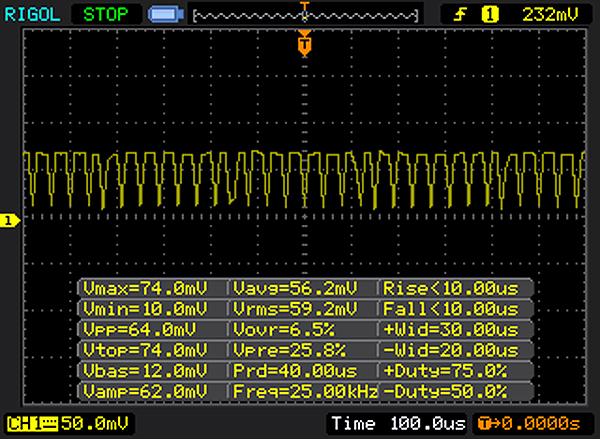 |
Displayens bakgrundsbelysning flimrar vid 25000 Hz (i värsta fall, t.ex. med PWM) Flimrande upptäckt vid en ljusstyrkeinställning på 30 % och lägre. Det ska inte finnas något flimmer eller PWM över denna ljusstyrkeinställning. Frekvensen för 25000 Hz är ganska hög, så de flesta användare som är känsliga för PWM bör inte märka något flimmer. Som jämförelse: 52 % av alla testade enheter använder inte PWM för att dämpa skärmen. Om PWM upptäcktes mättes ett medelvärde av 7798 (minst: 5 - maximum: 343500) Hz. | |||
| Cinebench R15 | |
| CPU Multi 64Bit | |
| HP Pavilion 15t-X7P42AV | |
| Asus ZenBook Pro UX550VD | |
| Gigabyte Sabre 15G | |
| Asus VivoBook Pro 15 N580VD-DM028T | |
| Acer Aspire VX15 VX5-591G-589S | |
| Dell XPS 15 2017 9560 (7300HQ, Full-HD) | |
| CPU Single 64Bit | |
| HP Pavilion 15t-X7P42AV | |
| Asus ZenBook Pro UX550VD | |
| Gigabyte Sabre 15G | |
| Acer Aspire VX15 VX5-591G-589S | |
| Asus VivoBook Pro 15 N580VD-DM028T | |
| Dell XPS 15 2017 9560 (7300HQ, Full-HD) | |
| Cinebench R11.5 | |
| CPU Multi 64Bit | |
| Gigabyte Sabre 15G | |
| Asus VivoBook Pro 15 N580VD-DM028T | |
| HP Pavilion 15t-X7P42AV | |
| CPU Single 64Bit | |
| Gigabyte Sabre 15G | |
| HP Pavilion 15t-X7P42AV | |
| Asus VivoBook Pro 15 N580VD-DM028T | |
| Cinebench R10 | |
| Rendering Multiple CPUs 64Bit | |
| Asus VivoBook Pro 15 N580VD-DM028T | |
| Rendering Single CPUs 64Bit | |
| Asus VivoBook Pro 15 N580VD-DM028T | |
| PCMark 8 | |
| Home Score Accelerated v2 | |
| Asus ZenBook Pro UX550VD | |
| HP Pavilion 15t-X7P42AV | |
| Asus VivoBook Pro 15 N580VD-DM028T | |
| Acer Aspire VX15 VX5-591G-589S | |
| Dell XPS 15 2017 9560 (7300HQ, Full-HD) | |
| Gigabyte Sabre 15G | |
| Work Score Accelerated v2 | |
| Gigabyte Sabre 15G | |
| Asus ZenBook Pro UX550VD | |
| Asus VivoBook Pro 15 N580VD-DM028T | |
| Dell XPS 15 2017 9560 (7300HQ, Full-HD) | |
| HP Pavilion 15t-X7P42AV | |
| PCMark 8 Home Score Accelerated v2 | 3833 poäng | |
| PCMark 8 Work Score Accelerated v2 | 4934 poäng | |
Hjälp | ||
| Asus VivoBook Pro 15 N580VD-DM028T Micron 1100 MTFDDAV256TBN | Asus ZenBook Pro UX550VD Samsung PM961 NVMe MZVLW512HMJP | HP Pavilion 15t-X7P42AV Samsung CM871a MZNTY128HDHP | Acer Aspire VX15 VX5-591G-589S Hynix HFS128G39TND | Dell XPS 15 2017 9560 (7300HQ, Full-HD) WDC WD10SPCX-75KHST0 + SanDisk Z400s M.2 2242 32 GB Cache | |
|---|---|---|---|---|---|
| CrystalDiskMark 3.0 | 142% | 9% | -3% | -80% | |
| Read Seq (MB/s) | 483.9 | 1434 196% | 522 8% | 510 5% | 123 -75% |
| Write Seq (MB/s) | 408.3 | 1365 234% | 476.6 17% | 137.6 -66% | 74.2 -82% |
| Read 512 (MB/s) | 319 | 614 92% | 399.7 25% | 362.1 14% | 101.7 -68% |
| Write 512 (MB/s) | 346.7 | 688 98% | 185.4 -47% | 137.2 -60% | 42.51 -88% |
| Read 4k (MB/s) | 24.77 | 60.6 145% | 33.12 34% | 35.18 42% | 10.84 -56% |
| Write 4k (MB/s) | 79.4 | 158 99% | 89.8 13% | 104.8 32% | 1.021 -99% |
| Read 4k QD32 (MB/s) | 246.1 | 617 151% | 400.9 63% | 375.8 53% | 69.8 -72% |
| Write 4k QD32 (MB/s) | 241.5 | 525 117% | 140.2 -42% | 138.1 -43% | 1.057 -100% |

| 3DMark 11 - 1280x720 Performance GPU | |
| Dell XPS 15 2017 9560 (7300HQ, Full-HD) | |
| Acer Aspire VX15 VX5-591G-589S | |
| Gigabyte Sabre 15G | |
| Asus VivoBook Pro 15 N580VD-DM028T | |
| HP Pavilion 15t-X7P42AV | |
| Asus ZenBook Pro UX550VD | |
| 3DMark | |
| 1280x720 Cloud Gate Standard Graphics | |
| Dell XPS 15 2017 9560 (7300HQ, Full-HD) | |
| Gigabyte Sabre 15G | |
| HP Pavilion 15t-X7P42AV | |
| Asus VivoBook Pro 15 N580VD-DM028T | |
| Asus ZenBook Pro UX550VD | |
| 1920x1080 Fire Strike Graphics | |
| Dell XPS 15 2017 9560 (7300HQ, Full-HD) | |
| Gigabyte Sabre 15G | |
| HP Pavilion 15t-X7P42AV | |
| Asus ZenBook Pro UX550VD | |
| Asus VivoBook Pro 15 N580VD-DM028T | |
| 3DMark 11 Performance | 7558 poäng | |
| 3DMark Cloud Gate Standard Score | 20059 poäng | |
| 3DMark Fire Strike Score | 5452 poäng | |
Hjälp | ||
| The Witcher 3 | |
| 1024x768 Low Graphics & Postprocessing (sortera efter värde) | |
| Asus VivoBook Pro 15 N580VD-DM028T | |
| HP Pavilion 15t-X7P42AV | |
| Dell XPS 15 2017 9560 (7300HQ, Full-HD) | |
| 1366x768 Medium Graphics & Postprocessing (sortera efter värde) | |
| Asus VivoBook Pro 15 N580VD-DM028T | |
| Asus ZenBook Pro UX550VD | |
| HP Pavilion 15t-X7P42AV | |
| Dell XPS 15 2017 9560 (7300HQ, Full-HD) | |
| 1920x1080 High Graphics & Postprocessing (Nvidia HairWorks Off) (sortera efter värde) | |
| Asus VivoBook Pro 15 N580VD-DM028T | |
| Asus ZenBook Pro UX550VD | |
| Gigabyte Sabre 15G | |
| HP Pavilion 15t-X7P42AV | |
| Dell XPS 15 2017 9560 (7300HQ, Full-HD) | |
| låg | med. | hög | ultra | |
|---|---|---|---|---|
| The Witcher 3 (2015) | 111.4 | 69.8 | 31.02 | 20 |
| Rise of the Tomb Raider (2016) | 124.2 | 69.3 | 39.12 | 31.59 |
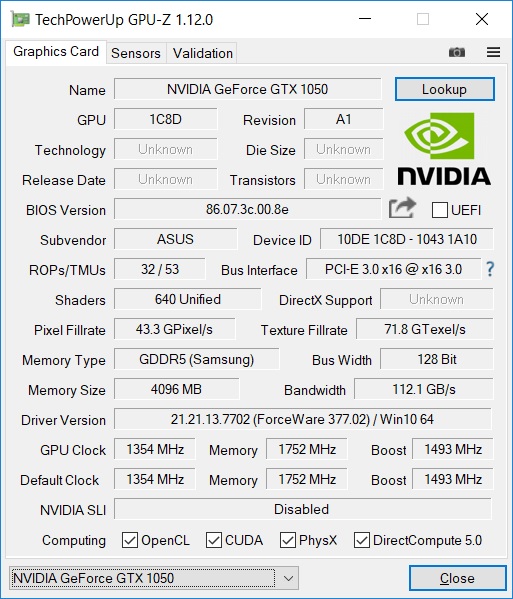
| Asus VivoBook Pro 15 N580VD-DM028T GeForce GTX 1050 Mobile, i7-7700HQ, Micron 1100 MTFDDAV256TBN | Asus ZenBook Pro UX550VD GeForce GTX 1050 Mobile, i7-7700HQ, Samsung PM961 NVMe MZVLW512HMJP | Gigabyte Sabre 15G GeForce GTX 1050 Mobile, i7-7700HQ, Liteonit CV3-8D128 | HP Pavilion 15t-X7P42AV GeForce GTX 1050 Mobile, i7-7700HQ, Samsung CM871a MZNTY128HDHP | Acer Aspire VX15 VX5-591G-589S GeForce GTX 1050 Mobile, i5-7300HQ, Hynix HFS128G39TND | Dell XPS 15 2017 9560 (7300HQ, Full-HD) GeForce GTX 1050 Mobile, i5-7300HQ, WDC WD10SPCX-75KHST0 + SanDisk Z400s M.2 2242 32 GB Cache | |
|---|---|---|---|---|---|---|
| Noise | 7% | -7% | -5% | 7% | -6% | |
| av / miljö * (dB) | 30.5 | 29.4 4% | 28.2 8% | 29.3 4% | 30 2% | 30.3 1% |
| Idle Minimum * (dB) | 30.6 | 29.4 4% | 33 -8% | 32.3 -6% | 30 2% | 31.6 -3% |
| Idle Average * (dB) | 30.9 | 29.9 3% | 33.3 -8% | 32.3 -5% | 30 3% | 31.6 -2% |
| Idle Maximum * (dB) | 31.9 | 29.9 6% | 34.7 -9% | 32.4 -2% | 31.1 3% | 33.4 -5% |
| Load Average * (dB) | 38.6 | 38.3 1% | 44.5 -15% | 44.4 -15% | 31.3 19% | 47.8 -24% |
| Witcher 3 ultra * (dB) | 47.3 | 39.8 16% | 49.2 -4% | |||
| Load Maximum * (dB) | 45.7 | 39.6 13% | 52.8 -16% | 49.2 -8% | 38.9 15% | 47.8 -5% |
* ... mindre är bättre
Ljudnivå
| Låg belastning |
| 30.6 / 30.9 / 31.9 dB(A) |
| Hårddisk |
| 30.9 dB(A) |
| Hög belastning |
| 38.6 / 45.7 dB(A) |
 | ||
30 dB tyst 40 dB(A) hörbar 50 dB(A) högt ljud |
||
min: | ||
(±) Den maximala temperaturen på ovansidan är 41.8 °C / 107 F, jämfört med genomsnittet av 36.8 °C / 98 F , allt från 21 till 71 °C för klassen Multimedia.
(+) Botten värms upp till maximalt 36.8 °C / 98 F, jämfört med genomsnittet av 39.1 °C / 102 F
(+) Vid tomgångsbruk är medeltemperaturen för ovansidan 25.2 °C / 77 F, jämfört med enhetsgenomsnittet på 31.3 °C / ### class_avg_f### F.
(-) När du spelar The Witcher 3 är medeltemperaturen för ovansidan 38.8 °C / 102 F, jämfört med enhetsgenomsnittet på 31.3 °C / ## #class_avg_f### F.
(+) Handledsstöden och pekplattan når maximal hudtemperatur (34.8 °C / 94.6 F) och är därför inte varma.
(-) Medeltemperaturen för handledsstödsområdet på liknande enheter var 28.7 °C / 83.7 F (-6.1 °C / -10.9 F).
| Asus VivoBook Pro 15 N580VD-DM028T GeForce GTX 1050 Mobile, i7-7700HQ, Micron 1100 MTFDDAV256TBN | Asus ZenBook Pro UX550VD GeForce GTX 1050 Mobile, i7-7700HQ, Samsung PM961 NVMe MZVLW512HMJP | Gigabyte Sabre 15G GeForce GTX 1050 Mobile, i7-7700HQ, Liteonit CV3-8D128 | HP Pavilion 15t-X7P42AV GeForce GTX 1050 Mobile, i7-7700HQ, Samsung CM871a MZNTY128HDHP | Acer Aspire VX15 VX5-591G-589S GeForce GTX 1050 Mobile, i5-7300HQ, Hynix HFS128G39TND | Dell XPS 15 2017 9560 (7300HQ, Full-HD) GeForce GTX 1050 Mobile, i5-7300HQ, WDC WD10SPCX-75KHST0 + SanDisk Z400s M.2 2242 32 GB Cache | |
|---|---|---|---|---|---|---|
| Heat | -9% | -8% | 6% | -16% | -14% | |
| Maximum Upper Side * (°C) | 41.8 | 43.6 -4% | 43.6 -4% | 41.8 -0% | 47.2 -13% | 47.6 -14% |
| Maximum Bottom * (°C) | 36.8 | 44.5 -21% | 40.2 -9% | 33.4 9% | 42.2 -15% | 42.1 -14% |
| Idle Upper Side * (°C) | 26.2 | 28 -7% | 27.8 -6% | 24.4 7% | 31.8 -21% | 29.9 -14% |
| Idle Bottom * (°C) | 25.9 | 26.7 -3% | 29.2 -13% | 23.8 8% | 29.5 -14% | 29.8 -15% |
* ... mindre är bättre
Asus VivoBook Pro 15 N580VD-DM028T ljudanalys
(-) | inte särskilt höga högtalare (71.6 dB)
Bas 100 - 315 Hz
(±) | reducerad bas - i genomsnitt 10.1% lägre än medianen
(±) | linjäriteten för basen är genomsnittlig (11.8% delta till föregående frekvens)
Mellan 400 - 2000 Hz
(+) | balanserad mellan - endast 1.6% från medianen
(+) | mids är linjära (4.9% delta till föregående frekvens)
Högsta 2 - 16 kHz
(+) | balanserade toppar - endast 1.3% från medianen
(+) | toppar är linjära (3% delta till föregående frekvens)
Totalt 100 - 16 000 Hz
(+) | det totala ljudet är linjärt (9.3% skillnad mot median)
Jämfört med samma klass
» 13% av alla testade enheter i den här klassen var bättre, 0% liknande, 87% sämre
» Den bästa hade ett delta på 5%, genomsnittet var 17%, sämst var 45%
Jämfört med alla testade enheter
» 3% av alla testade enheter var bättre, 1% liknande, 96% sämre
» Den bästa hade ett delta på 4%, genomsnittet var 24%, sämst var 134%
Apple MacBook 12 (Early 2016) 1.1 GHz ljudanalys
(+) | högtalare kan spela relativt högt (83.6 dB)
Bas 100 - 315 Hz
(±) | reducerad bas - i genomsnitt 11.3% lägre än medianen
(±) | linjäriteten för basen är genomsnittlig (14.2% delta till föregående frekvens)
Mellan 400 - 2000 Hz
(+) | balanserad mellan - endast 2.4% från medianen
(+) | mids är linjära (5.5% delta till föregående frekvens)
Högsta 2 - 16 kHz
(+) | balanserade toppar - endast 2% från medianen
(+) | toppar är linjära (4.5% delta till föregående frekvens)
Totalt 100 - 16 000 Hz
(+) | det totala ljudet är linjärt (10.2% skillnad mot median)
Jämfört med samma klass
» 7% av alla testade enheter i den här klassen var bättre, 2% liknande, 91% sämre
» Den bästa hade ett delta på 5%, genomsnittet var 18%, sämst var 53%
Jämfört med alla testade enheter
» 5% av alla testade enheter var bättre, 1% liknande, 94% sämre
» Den bästa hade ett delta på 4%, genomsnittet var 24%, sämst var 134%
| Av/Standby | |
| Låg belastning | |
| Hög belastning |
|
Förklaring:
min: | |
| Asus VivoBook Pro 15 N580VD-DM028T i7-7700HQ, GeForce GTX 1050 Mobile, Micron 1100 MTFDDAV256TBN, TN, 1920x1080, 15.6" | Asus ZenBook Pro UX550VD i7-7700HQ, GeForce GTX 1050 Mobile, Samsung PM961 NVMe MZVLW512HMJP, IPS, 1920x1080, 15.6" | Gigabyte Sabre 15G i7-7700HQ, GeForce GTX 1050 Mobile, Liteonit CV3-8D128, IPS, 1920x1080, 15.6" | HP Pavilion 15t-X7P42AV i7-7700HQ, GeForce GTX 1050 Mobile, Samsung CM871a MZNTY128HDHP, IPS, 1920x1080, 15.6" | Acer Aspire VX15 VX5-591G-589S i5-7300HQ, GeForce GTX 1050 Mobile, Hynix HFS128G39TND, IPS, 1920x1080, 15.6" | Dell XPS 15 2017 9560 (7300HQ, Full-HD) i5-7300HQ, GeForce GTX 1050 Mobile, WDC WD10SPCX-75KHST0 + SanDisk Z400s M.2 2242 32 GB Cache, LED IGZO IPS InfinityEdge, 1920x1080, 15.6" | |
|---|---|---|---|---|---|---|
| Power Consumption | -2% | -14% | -19% | -27% | -12% | |
| Idle Minimum * (Watt) | 4.7 | 5.05 -7% | 8 -70% | 8.29 -76% | 8.4 -79% | 6.6 -40% |
| Idle Average * (Watt) | 7.7 | 8.2 -6% | 10.9 -42% | 8.9 -16% | 13.1 -70% | 9 -17% |
| Idle Maximum * (Watt) | 10.9 | 12.2 -12% | 11 -1% | 10.2 6% | 14.2 -30% | 10.7 2% |
| Load Average * (Watt) | 82 | 82 -0% | 76.7 6% | 77.1 6% | 50 39% | 77.5 5% |
| Witcher 3 ultra * (Watt) | 109 | 93.1 15% | 94.9 13% | |||
| Load Maximum * (Watt) | 120 | 120 -0% | 106.4 11% | 136.6 -14% | 111 7% | 130 -8% |
* ... mindre är bättre
| Asus VivoBook Pro 15 N580VD-DM028T i7-7700HQ, GeForce GTX 1050 Mobile, 47 Wh | Asus ZenBook Pro UX550VD i7-7700HQ, GeForce GTX 1050 Mobile, 73 Wh | Gigabyte Sabre 15G i7-7700HQ, GeForce GTX 1050 Mobile, 47 Wh | HP Pavilion 15t-X7P42AV i7-7700HQ, GeForce GTX 1050 Mobile, 63.3 Wh | Acer Aspire VX15 VX5-591G-589S i5-7300HQ, GeForce GTX 1050 Mobile, 52.5 Wh | Dell XPS 15 2017 9560 (7300HQ, Full-HD) i5-7300HQ, GeForce GTX 1050 Mobile, 56 Wh | |
|---|---|---|---|---|---|---|
| Batteridrifttid | 32% | -20% | 31% | -15% | -7% | |
| Reader / Idle (h) | 10.2 | 17.7 74% | 8.2 -20% | 16 57% | 9.4 -8% | |
| H.264 (h) | 5.9 | 7.8 32% | ||||
| WiFi v1.3 (h) | 6.5 | 8.9 37% | 4.4 -32% | 6.5 0% | 5.5 -15% | 5.6 -14% |
| Load (h) | 1.4 | 1.2 -14% | 1.3 -7% | 1.9 36% | 1.4 0% | |
| Witcher 3 ultra (h) | 1.1 |
För
Emot
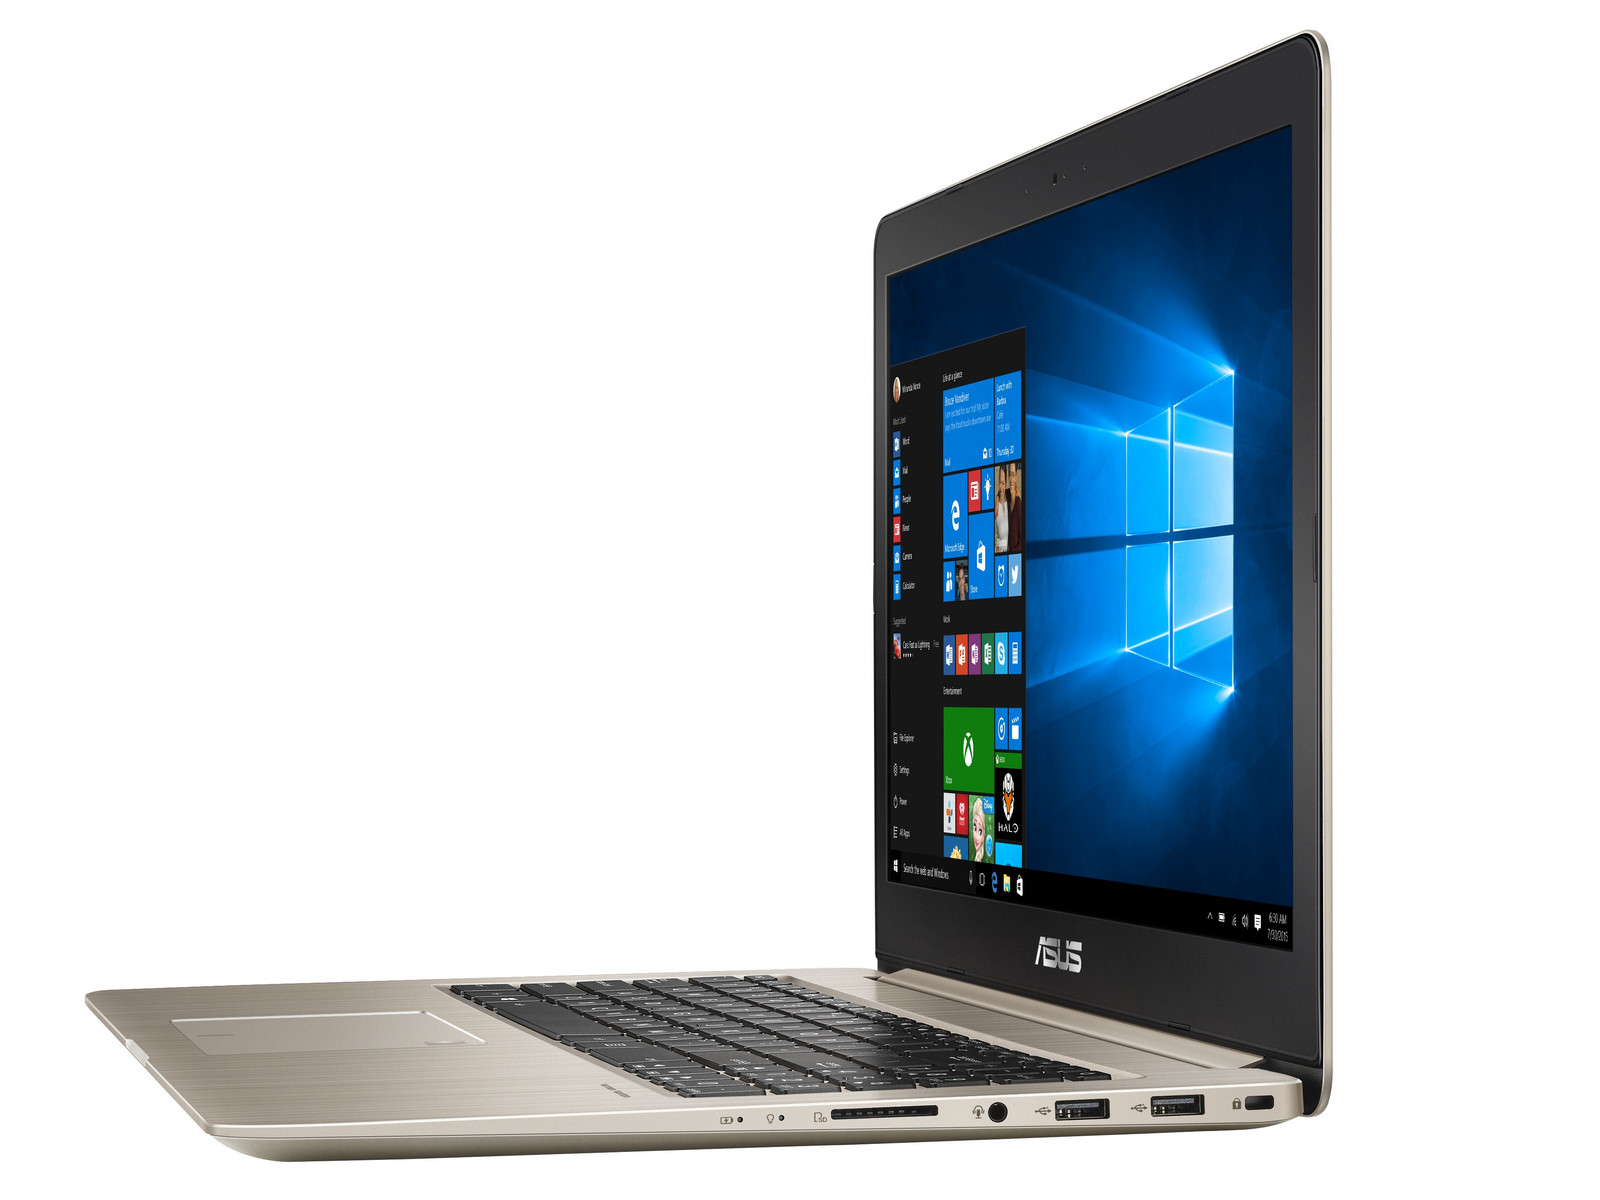
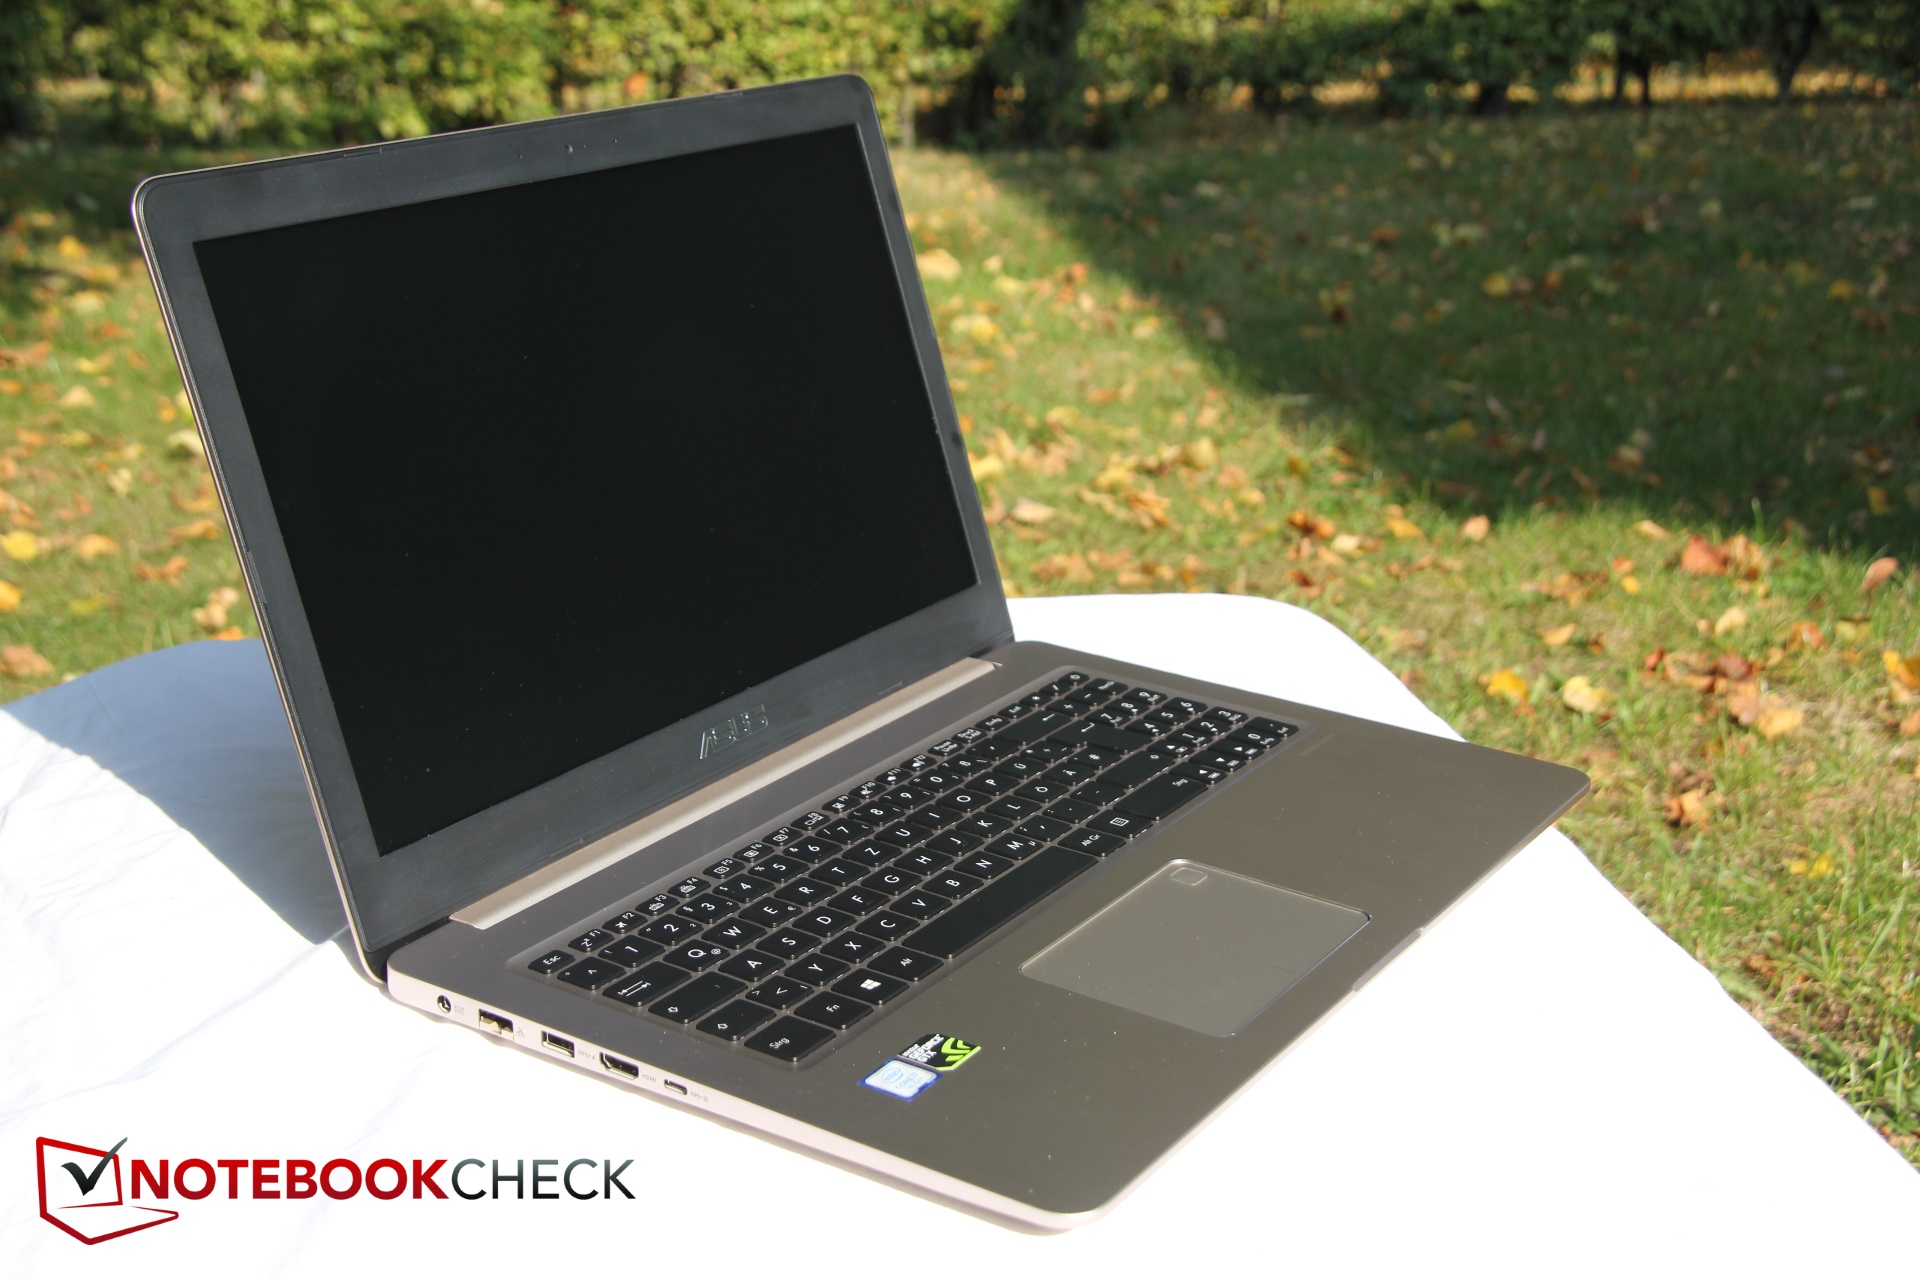
Asus VivoBook Pro 15 har ett elegant chassi och övertygar med effektiv drift vid tomgång, en praktisk vikt, bra högtalare och bra temperaturutveckling.
Vi har fortfarande svårt att rekommendera VivoBook vid skrivande stund, för det förekommer avbrutna anslutningar, extrem strypning på batteri och pulserande fläktar. Alla dessa problem borde gå att fixa med mjukvaruuppdateringar. Men skärmen hamnar också bakom rivalerna och utbudet av portar är magert. Det är fortfarande en av dom dyraste enheterna här.
För tillfället definierar de negativa aspekterna hela upplevelsen. Det är inte nödvändigtvis ett fel på enheten utan verkar snarare vara ett firmware-problem. Asus borde snabbt ha fixat dessa brister, så VivoBook kan vara en bra laptop. Vi tycker också att priset är för högt för tillfället och en del av rivalerna kostar mindre.
Asus VivoBook 15 kämpar fortfarande mot en del buggar såsom fördröjningar och avbrutna anslutningar, avsevärd strypning på batteridrift och dålig fläktkontroll. Du får också en jämförelsevis dålig TN-skärm, så priset är för tillfället inte rättfärdigat.
Asus VivoBook Pro 15 N580VD-DM028T
- 10/09/2017 v6 (old)
Christian Hintze
Price comparison
