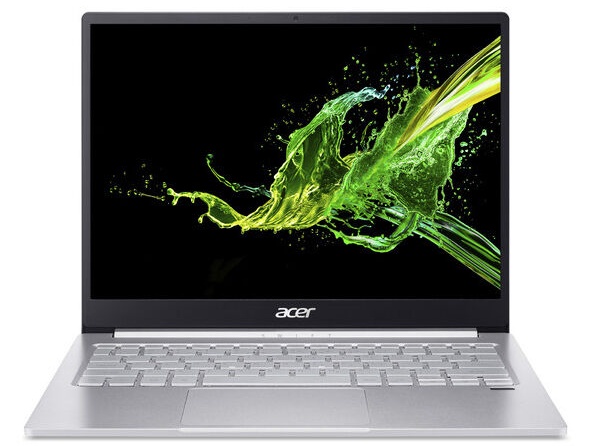
Test: Acer Swift 3 SF313 - En bra subnotebook även med i5 (Sammanfattning)
Gradering | Datum | Modell | Vikt | Höjd | Storlek | Upplösning | Pris |
|---|---|---|---|---|---|---|---|
| 85.9 % v7 (old) | 06/2020 | Acer Swift 3 SF313-52-52AS i5-1035G4, Iris Plus Graphics G4 (Ice Lake 48 EU) | 1.2 kg | 16.6 mm | 13.50" | 2256x1504 | |
| 87 % v7 (old) | 02/2020 | Acer Swift 3 SF313-52-71Y7 i7-1065G7, Iris Plus Graphics G7 (Ice Lake 64 EU) | 1.2 kg | 16.6 mm | 13.50" | 2256x1504 | |
| 84.5 % v7 (old) | HP ProBook 430 G7-8VU53EA i7-10510U, UHD Graphics 620 | 1.4 kg | 18 mm | 13.30" | 1920x1080 | ||
| 84.9 % v7 (old) | 07/2020 | Lenovo IdeaPad S540-13API R5 3550H, Vega 8 | 1.3 kg | 16 mm | 13.30" | 2560x1600 | |
| 84 % v7 (old) | 02/2020 | Microsoft Surface Laptop 3 13 Core i5-1035G7 i5-1035G7, Iris Plus Graphics G7 (Ice Lake 64 EU) | 1.3 kg | 14.5 mm | 13.50" | 2256x1504 |
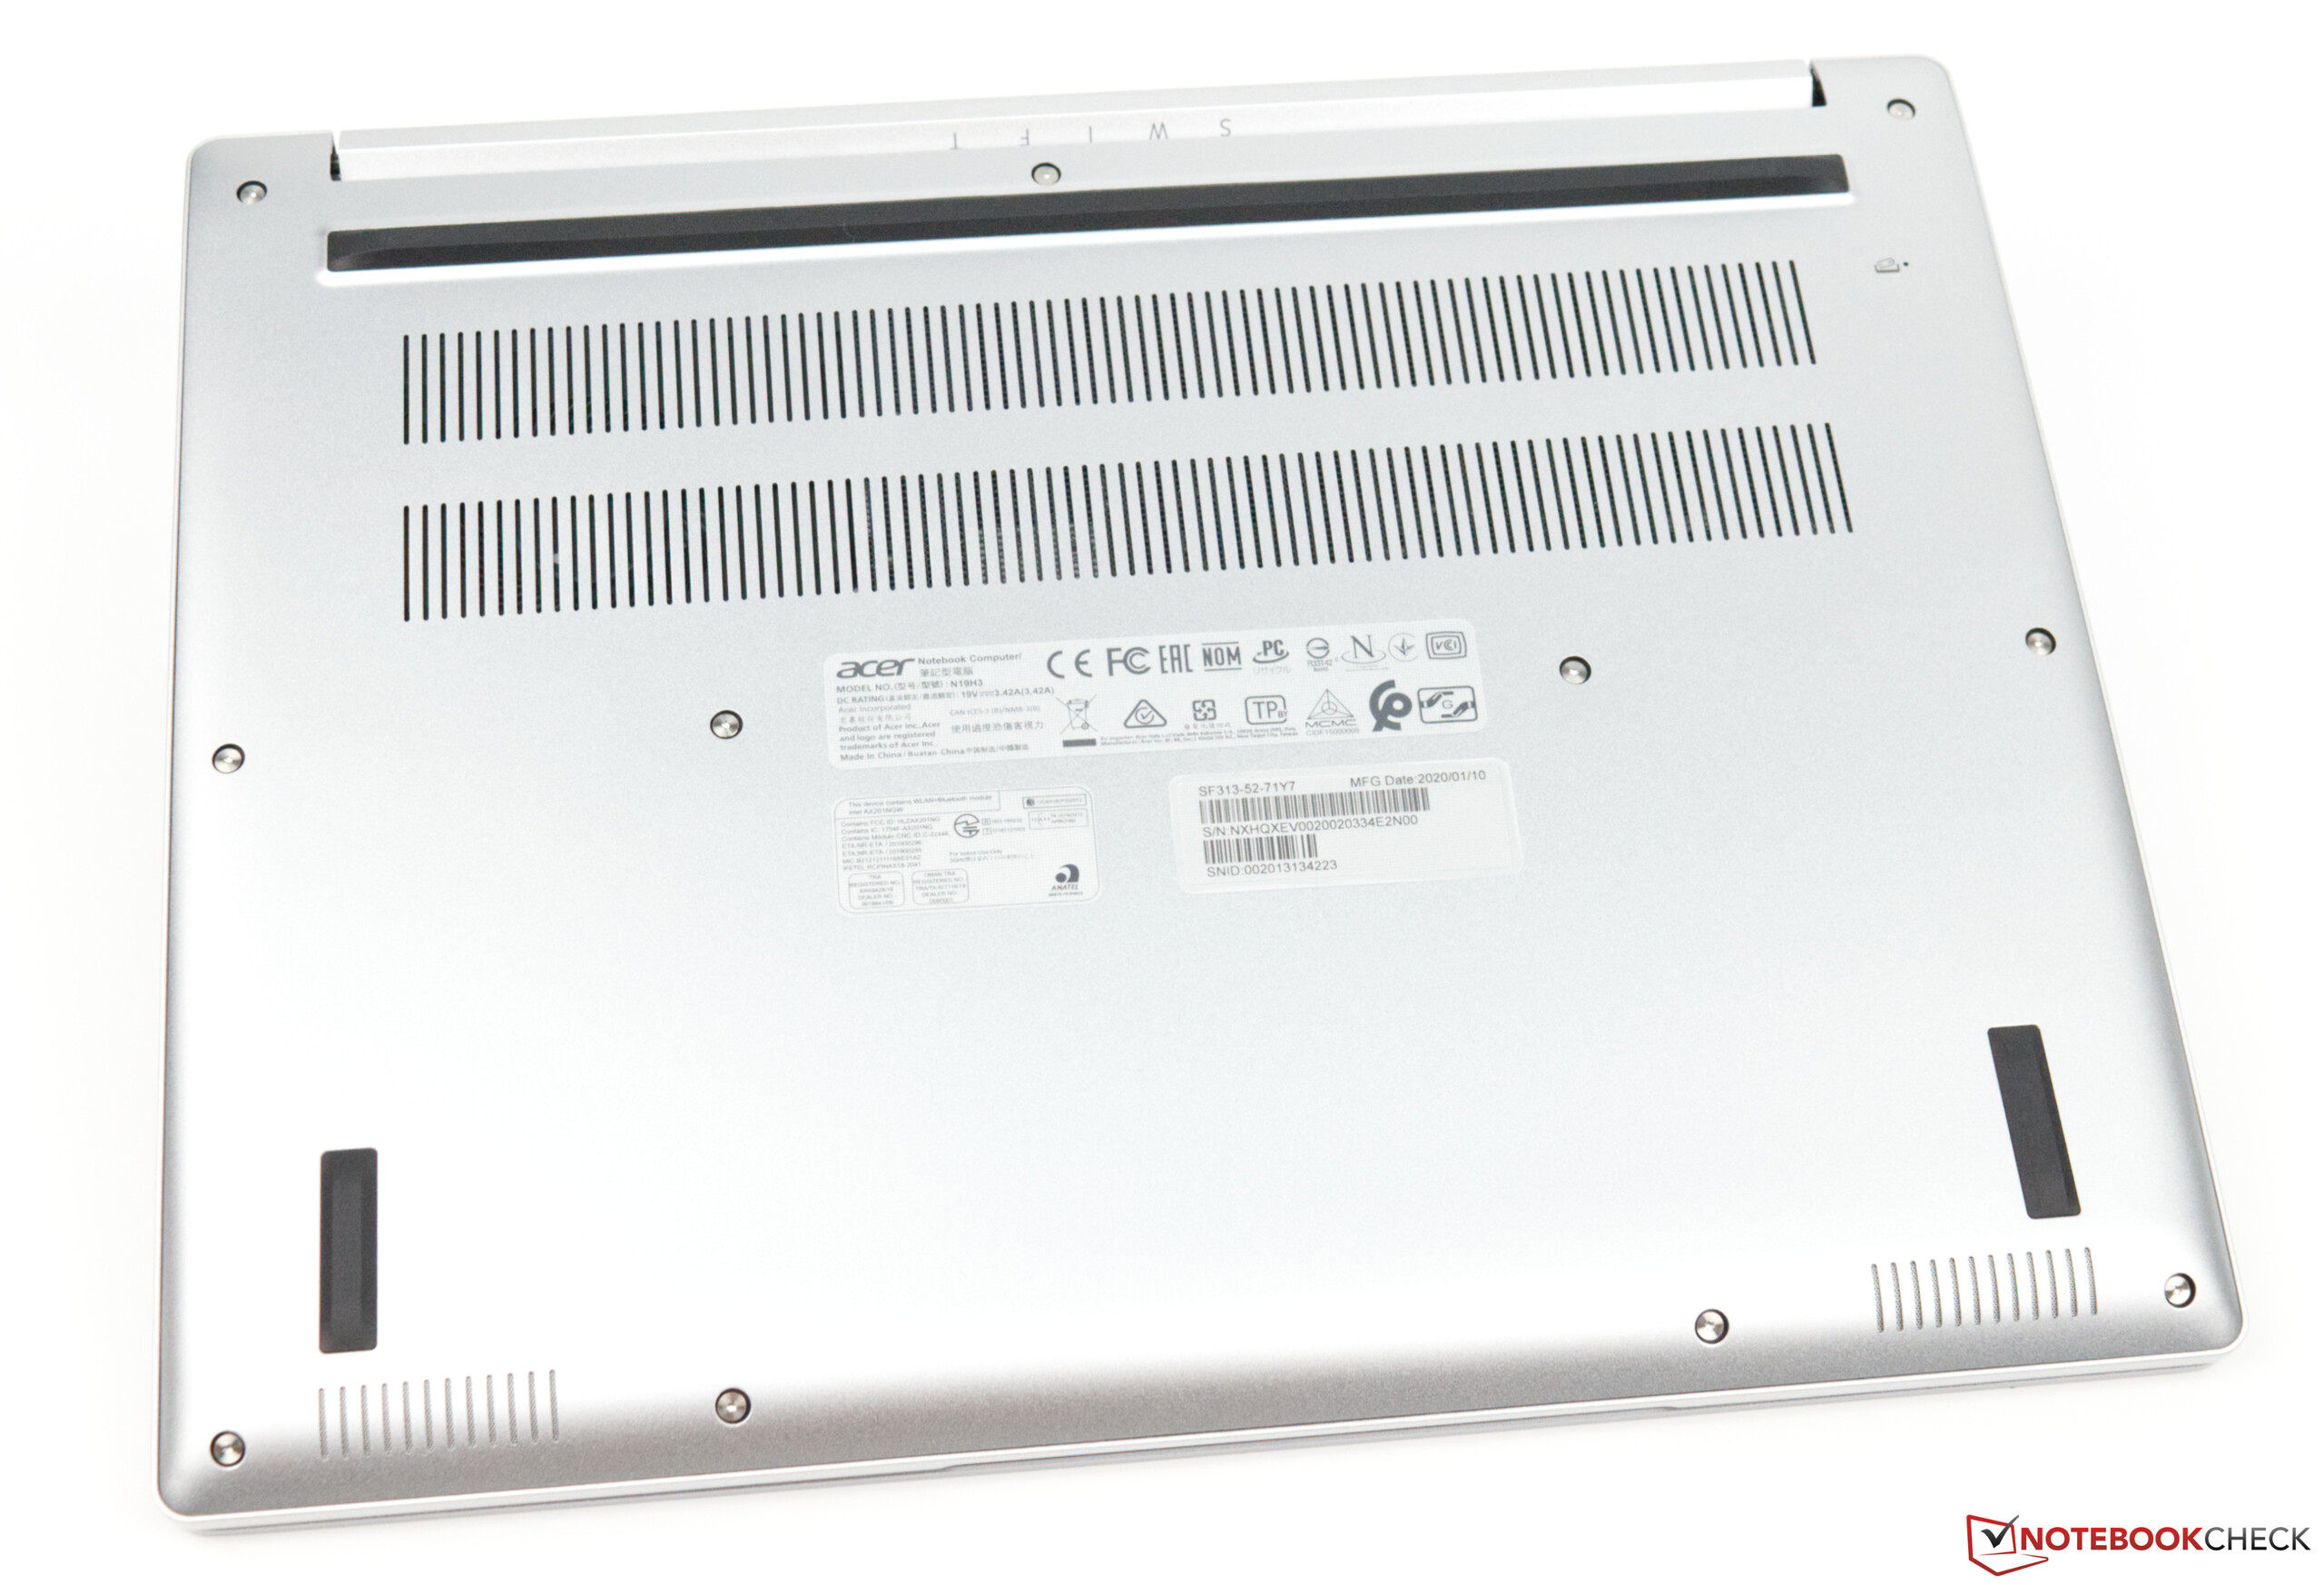
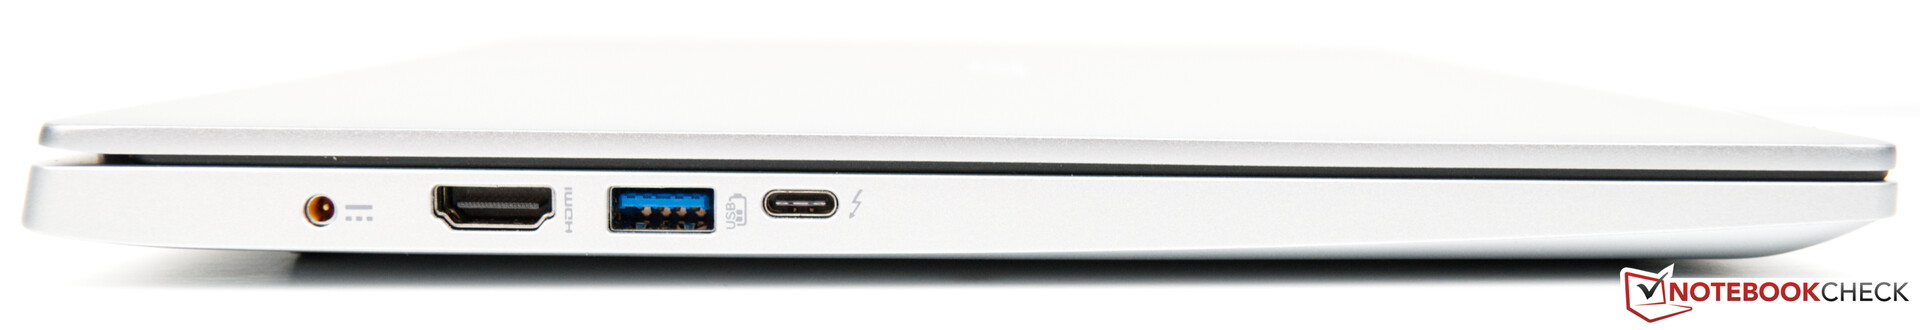
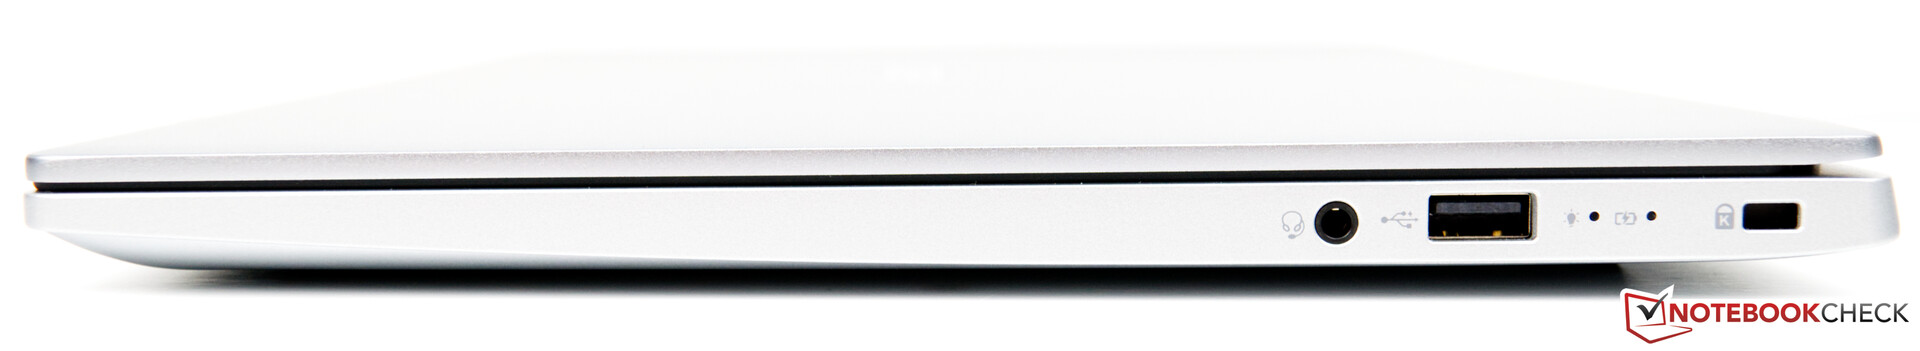
Portar
| Networking | |
| iperf3 transmit AX12 | |
| Microsoft Surface Laptop 3 13 Core i5-1035G7 | |
| HP ProBook 430 G7-8VU53EA | |
| Genomsnitt Intel Wi-Fi 6 AX201 (49.8 - 1775, n=324) | |
| Acer Swift 3 SF313-52-52AS | |
| Lenovo IdeaPad S540-13API | |
| Acer Swift 3 SF313-52-71Y7 | |
| iperf3 receive AX12 | |
| HP ProBook 430 G7-8VU53EA | |
| Genomsnitt Intel Wi-Fi 6 AX201 (136 - 1743, n=324) | |
| Microsoft Surface Laptop 3 13 Core i5-1035G7 | |
| Acer Swift 3 SF313-52-52AS | |
| Lenovo IdeaPad S540-13API | |
| Acer Swift 3 SF313-52-71Y7 | |

, i5-1035G4, SK Hynix BC501 HFM512GDJTNG")
, i5-1035G4, SK Hynix BC501 HFM512GDJTNG")
| |||||||||||||||||||||||||
Distribution av ljusstyrkan: 88 %
Mitt på batteriet: 436 cd/m²
Kontrast: 1425:1 (Svärta: 0.32 cd/m²)
ΔE ColorChecker Calman: 3.49 | ∀{0.5-29.43 Ø4.73}
calibrated: 0.72
ΔE Greyscale Calman: 5.53 | ∀{0.09-98 Ø4.97}
100% sRGB (Argyll 1.6.3 3D)
65% AdobeRGB 1998 (Argyll 1.6.3 3D)
71.3% AdobeRGB 1998 (Argyll 3D)
99.8% sRGB (Argyll 3D)
70.3% Display P3 (Argyll 3D)
Gamma: 2.41
CCT: 6675 K
| Acer Swift 3 SF313-52-52AS BOE08BC, IPS, 2256x1504, 13.5" | Acer Swift 3 SF313-52-71Y7 BOE, NE135FBM-N41, IPS, 2256x1504, 13.5" | HP ProBook 430 G7-8VU53EA BOE08A6, IPS LED, 1920x1080, 13.3" | Lenovo IdeaPad S540-13API CSOT T3 MND307DA1-2, IPS, 2560x1600, 13.3" | Microsoft Surface Laptop 3 13 Core i5-1035G7 Sharp LQ135P1JX51, IPS, 2256x1504, 13.5" | |
|---|---|---|---|---|---|
| Display | 0% | -38% | 2% | -4% | |
| Display P3 Coverage (%) | 70.3 | 70.1 0% | 42.79 -39% | 73.4 4% | 65.7 -7% |
| sRGB Coverage (%) | 99.8 | 99.8 0% | 62.8 -37% | 98.6 -1% | 98.6 -1% |
| AdobeRGB 1998 Coverage (%) | 71.3 | 71.2 0% | 44.21 -38% | 72.6 2% | 67.8 -5% |
| Response Times | -5% | -1% | 5% | -26% | |
| Response Time Grey 50% / Grey 80% * (ms) | 50 ? | 55 ? -10% | 48.8 ? 2% | 45.6 ? 9% | 59.2 ? -18% |
| Response Time Black / White * (ms) | 31 ? | 31 ? -0% | 32 ? -3% | 30.8 ? 1% | 41.6 ? -34% |
| PWM Frequency (Hz) | 192 ? | 208 ? | 1000 ? | 21740 ? | |
| Screen | -15% | -78% | -5% | 12% | |
| Brightness middle (cd/m²) | 456 | 474 4% | 300 -34% | 321 -30% | 403.4 -12% |
| Brightness (cd/m²) | 432 | 426 -1% | 285 -34% | 314 -27% | 397 -8% |
| Brightness Distribution (%) | 88 | 82 -7% | 90 2% | 94 7% | 89 1% |
| Black Level * (cd/m²) | 0.32 | 0.29 9% | 0.25 22% | 0.19 41% | 0.34 -6% |
| Contrast (:1) | 1425 | 1634 15% | 1200 -16% | 1689 19% | 1186 -17% |
| Colorchecker dE 2000 * | 3.49 | 2.38 32% | 5.9 -69% | 3.3 5% | 0.94 73% |
| Colorchecker dE 2000 max. * | 8.4 | 5.88 30% | 20 -138% | 6 29% | 2.92 65% |
| Colorchecker dE 2000 calibrated * | 0.72 | 2.69 -274% | 4.6 -539% | 1.7 -136% | 0.99 -38% |
| Greyscale dE 2000 * | 5.53 | 3.75 32% | 4 28% | 3.5 37% | 0.9 84% |
| Gamma | 2.41 91% | 2.37 93% | 2.23 99% | 2.08 106% | 2.13 103% |
| CCT | 6675 97% | 6466 101% | 7154 91% | 7245 90% | 6620 98% |
| Color Space (Percent of AdobeRGB 1998) (%) | 65 | 65 0% | 40.4 -38% | 64.5 -1% | 62.3 -4% |
| Color Space (Percent of sRGB) (%) | 100 | 100 0% | 62.4 -38% | 98.4 -2% | 98.7 -1% |
| Totalt genomsnitt (program/inställningar) | -7% /
-11% | -39% /
-61% | 1% /
-3% | -6% /
5% |
* ... mindre är bättre
Visa svarstider
| ↔ Svarstid svart till vitt | ||
|---|---|---|
| 31 ms ... stiga ↗ och falla ↘ kombinerat | ↗ 18 ms stiga | 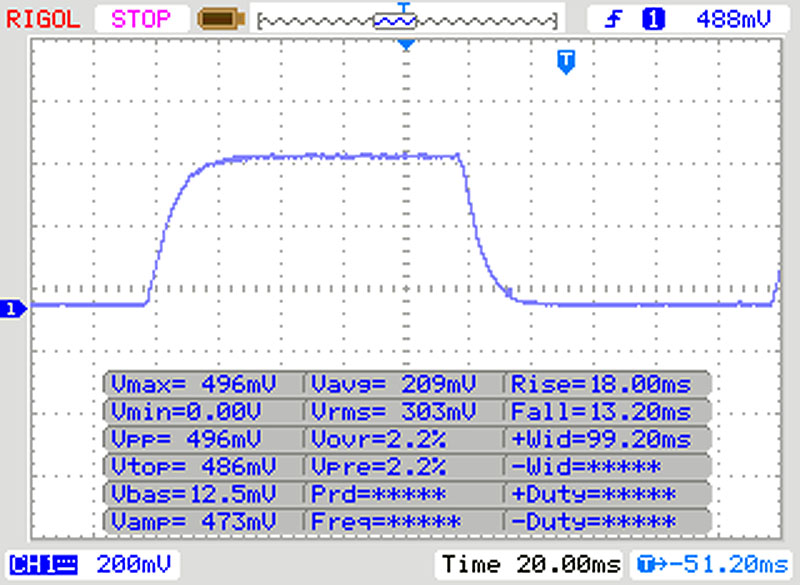 |
| ↘ 13 ms hösten | ||
| Skärmen visar långsamma svarsfrekvenser i våra tester och kommer att vara otillfredsställande för spelare. I jämförelse sträcker sig alla testade enheter från 0.1 (minst) till 240 (maximalt) ms. » 84 % av alla enheter är bättre. Detta innebär att den uppmätta svarstiden är sämre än genomsnittet av alla testade enheter (19.9 ms). | ||
| ↔ Svarstid 50 % grått till 80 % grått | ||
| 50 ms ... stiga ↗ och falla ↘ kombinerat | ↗ 24 ms stiga | 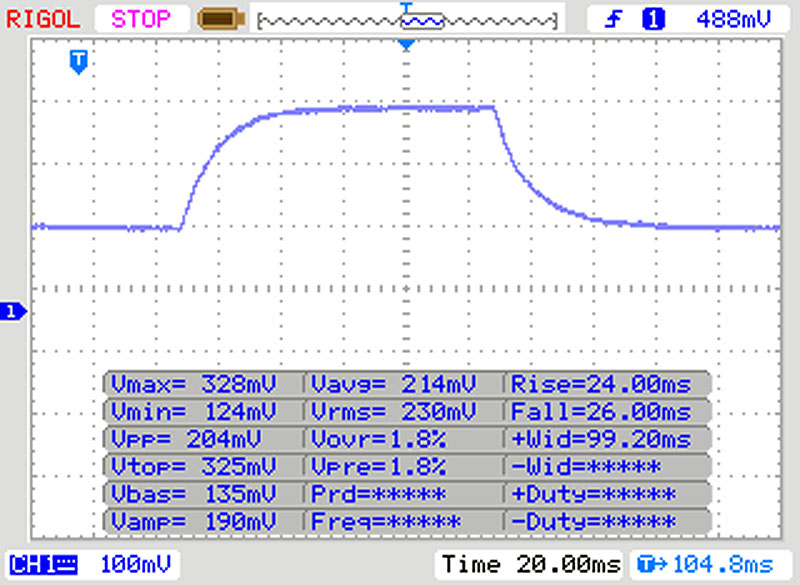 |
| ↘ 26 ms hösten | ||
| Skärmen visar långsamma svarsfrekvenser i våra tester och kommer att vara otillfredsställande för spelare. I jämförelse sträcker sig alla testade enheter från 0.165 (minst) till 636 (maximalt) ms. » 86 % av alla enheter är bättre. Detta innebär att den uppmätta svarstiden är sämre än genomsnittet av alla testade enheter (31.1 ms). | ||
Skärmflimmer / PWM (Puls-Width Modulation)
| Skärmflimmer / PWM upptäckt | 192 Hz | ≤ 90 % ljusstyrka inställning | 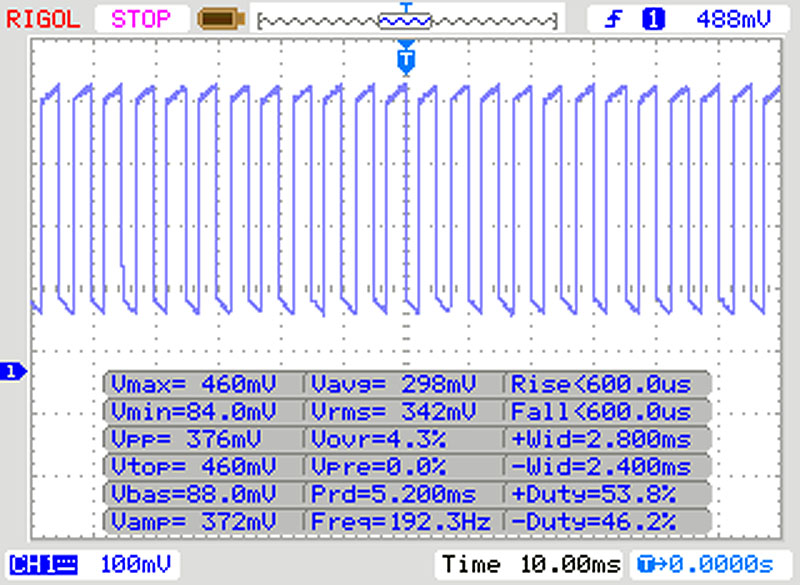 |
Displayens bakgrundsbelysning flimrar vid 192 Hz (i värsta fall, t.ex. med PWM) Flimrande upptäckt vid en ljusstyrkeinställning på 90 % och lägre. Det ska inte finnas något flimmer eller PWM över denna ljusstyrkeinställning. Frekvensen för 192 Hz är relativt låg, så känsliga användare kommer sannolikt att märka flimmer och uppleva ansträngda ögon vid den angivna ljusstyrkeinställningen och nedan. Som jämförelse: 52 % av alla testade enheter använder inte PWM för att dämpa skärmen. Om PWM upptäcktes mättes ett medelvärde av 7798 (minst: 5 - maximum: 343500) Hz. | |||
Cinebench R15: CPU Single 64Bit | CPU Multi 64Bit
Blender: v2.79 BMW27 CPU
7-Zip 18.03: 7z b 4 -mmt1 | 7z b 4
Geekbench 5.5: Single-Core | Multi-Core
HWBOT x265 Benchmark v2.2: 4k Preset
LibreOffice : 20 Documents To PDF
R Benchmark 2.5: Overall mean
| Cinebench R20 / CPU (Single Core) | |
| Genomsnitt av klass Subnotebook (128 - 832, n=59, senaste 2 åren) | |
| Acer Swift 3 SF313-52-71Y7 | |
| HP ProBook 430 G7-8VU53EA | |
| HP ProBook 430 G7-8VU53EA | |
| Microsoft Surface Laptop 3 13 Core i5-1035G7 | |
| Genomsnitt Intel Core i5-1035G4 (357 - 441, n=6) | |
| Lenovo IdeaPad S540-13API | |
| Acer Swift 3 SF313-52-52AS | |
| Acer Swift 3 SF313-52-52AS | |
| Cinebench R20 / CPU (Multi Core) | |
| Genomsnitt av klass Subnotebook (579 - 8541, n=59, senaste 2 åren) | |
| Microsoft Surface Laptop 3 13 Core i5-1035G7 | |
| Lenovo IdeaPad S540-13API | |
| Acer Swift 3 SF313-52-71Y7 | |
| HP ProBook 430 G7-8VU53EA | |
| HP ProBook 430 G7-8VU53EA | |
| Genomsnitt Intel Core i5-1035G4 (892 - 1648, n=6) | |
| Acer Swift 3 SF313-52-52AS | |
| Acer Swift 3 SF313-52-52AS | |
| Cinebench R15 / CPU Single 64Bit | |
| Genomsnitt av klass Subnotebook (72.4 - 322, n=59, senaste 2 åren) | |
| HP ProBook 430 G7-8VU53EA | |
| Acer Swift 3 SF313-52-71Y7 | |
| Microsoft Surface Laptop 3 13 Core i5-1035G7 | |
| Genomsnitt Intel Core i5-1035G4 (146.4 - 172, n=5) | |
| Acer Swift 3 SF313-52-52AS | |
| Lenovo IdeaPad S540-13API | |
| Cinebench R15 / CPU Multi 64Bit | |
| Genomsnitt av klass Subnotebook (327 - 3345, n=59, senaste 2 åren) | |
| Microsoft Surface Laptop 3 13 Core i5-1035G7 | |
| Lenovo IdeaPad S540-13API | |
| Acer Swift 3 SF313-52-71Y7 | |
| HP ProBook 430 G7-8VU53EA | |
| Genomsnitt Intel Core i5-1035G4 (490 - 676, n=6) | |
| Acer Swift 3 SF313-52-52AS | |
| Blender / v2.79 BMW27 CPU | |
| Acer Swift 3 SF313-52-52AS | |
| Acer Swift 3 SF313-52-52AS | |
| Genomsnitt Intel Core i5-1035G4 (703 - 1075, n=6) | |
| HP ProBook 430 G7-8VU53EA | |
| HP ProBook 430 G7-8VU53EA | |
| Acer Swift 3 SF313-52-71Y7 | |
| Microsoft Surface Laptop 3 13 Core i5-1035G7 | |
| Lenovo IdeaPad S540-13API | |
| Genomsnitt av klass Subnotebook (159 - 2271, n=60, senaste 2 åren) | |
| 7-Zip 18.03 / 7z b 4 -mmt1 | |
| Genomsnitt av klass Subnotebook (2643 - 6699, n=61, senaste 2 åren) | |
| HP ProBook 430 G7-8VU53EA | |
| HP ProBook 430 G7-8VU53EA | |
| Acer Swift 3 SF313-52-71Y7 | |
| Microsoft Surface Laptop 3 13 Core i5-1035G7 | |
| Acer Swift 3 SF313-52-52AS | |
| Acer Swift 3 SF313-52-52AS | |
| Genomsnitt Intel Core i5-1035G4 (1307 - 4190, n=6) | |
| Lenovo IdeaPad S540-13API | |
| 7-Zip 18.03 / 7z b 4 | |
| Genomsnitt av klass Subnotebook (11668 - 77867, n=59, senaste 2 åren) | |
| Microsoft Surface Laptop 3 13 Core i5-1035G7 | |
| HP ProBook 430 G7-8VU53EA | |
| HP ProBook 430 G7-8VU53EA | |
| Acer Swift 3 SF313-52-71Y7 | |
| Lenovo IdeaPad S540-13API | |
| Genomsnitt Intel Core i5-1035G4 (11030 - 19548, n=6) | |
| Acer Swift 3 SF313-52-52AS | |
| Acer Swift 3 SF313-52-52AS | |
| Geekbench 5.5 / Single-Core | |
| Genomsnitt av klass Subnotebook (726 - 2224, n=50, senaste 2 åren) | |
| Acer Swift 3 SF313-52-71Y7 | |
| HP ProBook 430 G7-8VU53EA | |
| HP ProBook 430 G7-8VU53EA | |
| HP ProBook 430 G7-8VU53EA | |
| Genomsnitt Intel Core i5-1035G4 (1081 - 1277, n=5) | |
| Acer Swift 3 SF313-52-52AS | |
| Acer Swift 3 SF313-52-52AS | |
| Geekbench 5.5 / Multi-Core | |
| Genomsnitt av klass Subnotebook (2557 - 17218, n=50, senaste 2 åren) | |
| Acer Swift 3 SF313-52-71Y7 | |
| Genomsnitt Intel Core i5-1035G4 (3261 - 4315, n=5) | |
| Acer Swift 3 SF313-52-52AS | |
| Acer Swift 3 SF313-52-52AS | |
| HP ProBook 430 G7-8VU53EA | |
| HP ProBook 430 G7-8VU53EA | |
| HP ProBook 430 G7-8VU53EA | |
| HWBOT x265 Benchmark v2.2 / 4k Preset | |
| Genomsnitt av klass Subnotebook (0.97 - 25.1, n=59, senaste 2 åren) | |
| Acer Swift 3 SF313-52-71Y7 | |
| Microsoft Surface Laptop 3 13 Core i5-1035G7 | |
| HP ProBook 430 G7-8VU53EA | |
| HP ProBook 430 G7-8VU53EA | |
| Genomsnitt Intel Core i5-1035G4 (3.37 - 5.61, n=6) | |
| Lenovo IdeaPad S540-13API | |
| Acer Swift 3 SF313-52-52AS | |
| Acer Swift 3 SF313-52-52AS | |
| LibreOffice / 20 Documents To PDF | |
| Acer Swift 3 SF313-52-52AS | |
| Acer Swift 3 SF313-52-52AS | |
| HP ProBook 430 G7-8VU53EA | |
| HP ProBook 430 G7-8VU53EA | |
| Genomsnitt Intel Core i5-1035G4 (58.4 - 78.3, n=5) | |
| Genomsnitt av klass Subnotebook (39.9 - 220, n=58, senaste 2 åren) | |
| R Benchmark 2.5 / Overall mean | |
| Acer Swift 3 SF313-52-52AS | |
| Acer Swift 3 SF313-52-52AS | |
| Genomsnitt Intel Core i5-1035G4 (0.701 - 0.825, n=5) | |
| Acer Swift 3 SF313-52-71Y7 | |
| HP ProBook 430 G7-8VU53EA | |
| HP ProBook 430 G7-8VU53EA | |
| Genomsnitt av klass Subnotebook (0.4024 - 1.456, n=60, senaste 2 åren) | |
* ... mindre är bättre
| PCMark 10 Score | 3790 poäng | |
Hjälp | ||
| DPC Latencies / LatencyMon - interrupt to process latency (max), Web, Youtube, Prime95 | |
| HP ProBook 430 G7-8VU53EA | |
| Acer Swift 3 SF313-52-52AS | |
* ... mindre är bättre
| Acer Swift 3 SF313-52-52AS SK Hynix BC501 HFM512GDJTNG | Acer Swift 3 SF313-52-71Y7 Intel SSD 660p 1TB SSDPEKNW010T8 | HP ProBook 430 G7-8VU53EA Toshiba KBG30ZMV256G | Lenovo IdeaPad S540-13API Samsung SSD PM981 MZVLB512HAJQ | Microsoft Surface Laptop 3 13 Core i5-1035G7 SK hynix BC501 HFM256GDGTNG | Genomsnitt SK Hynix BC501 HFM512GDJTNG | Genomsnitt av klass Subnotebook | |
|---|---|---|---|---|---|---|---|
| CrystalDiskMark 5.2 / 6 | 41% | -11% | 60% | -13% | -18% | 122% | |
| Write 4K (MB/s) | 120.6 | 187.4 55% | 124.7 3% | 133.9 11% | 112.3 -7% | 95.5 ? -21% | 153.3 ? 27% |
| Read 4K (MB/s) | 46.88 | 63.8 36% | 48.17 3% | 44.98 -4% | 42.13 -10% | 38.3 ? -18% | 64 ? 37% |
| Write Seq (MB/s) | 1044 | 1776 70% | 694 -34% | 2730 161% | 630 -40% | 759 ? -27% | 2860 ? 174% |
| Read Seq (MB/s) | 1147 | 1693 48% | 757 -34% | 2403 110% | 1023 -11% | 1022 ? -11% | 3311 ? 189% |
| Write 4K Q32T1 (MB/s) | 332.4 | 492.3 48% | 311 -6% | 252.2 -24% | 336.6 1% | 303 ? -9% | 429 ? 29% |
| Read 4K Q32T1 (MB/s) | 443.3 | 539 22% | 495.5 12% | 335.6 -24% | 399.6 -10% | 317 ? -28% | 493 ? 11% |
| Write Seq Q32T1 (MB/s) | 1052 | 1770 68% | 1017 -3% | 2983 184% | 821 -22% | 885 ? -16% | 4606 ? 338% |
| Read Seq Q32T1 (MB/s) | 2171 | 1715 -21% | 1530 -30% | 3535 63% | 2030 -6% | 1803 ? -17% | 5795 ? 167% |
| Write 4K Q8T8 (MB/s) | 899 | 306 ? | 887 ? | ||||
| Read 4K Q8T8 (MB/s) | 630 | 698 ? | 1272 ? | ||||
| AS SSD | 9% | -58% | 58% | -43% | -12% | 82% | |
| Seq Read (MB/s) | 1370 | 1703 24% | 1342 -2% | 2792 104% | 1387 1% | 1323 ? -3% | 4466 ? 226% |
| Seq Write (MB/s) | 1019 | 1373 35% | 768 -25% | 2564 152% | 504 -51% | 697 ? -32% | 2929 ? 187% |
| 4K Read (MB/s) | 50.8 | 56.8 12% | 48.56 -4% | 47.14 -7% | 42.35 -17% | 40.4 ? -20% | 59.2 ? 17% |
| 4K Write (MB/s) | 111.2 | 164.4 48% | 127.7 15% | 89.5 -20% | 120 8% | 100.8 ? -9% | 169.4 ? 52% |
| 4K-64 Read (MB/s) | 770 | 584 -24% | 644 -16% | 1159 51% | 497.4 -35% | 686 ? -11% | 844 ? 10% |
| 4K-64 Write (MB/s) | 713 | 783 10% | 317.3 -55% | 1468 106% | 354.9 -50% | 660 ? -7% | 1697 ? 138% |
| Access Time Read * (ms) | 0.044 | 0.417 | 0.069 | 0.055 | 0.06071 ? | 0.06516 ? | |
| Access Time Write * (ms) | 0.034 | 0.038 -12% | 0.174 -412% | 0.043 -26% | 0.093 -174% | 0.037 ? -9% | 0.05493 ? -62% |
| Score Read (Points) | 958 | 811 -15% | 827 -14% | 1486 55% | 678 -29% | 858 ? -10% | 1348 ? 41% |
| Score Write (Points) | 926 | 1085 17% | 522 -44% | 1814 96% | 525 -43% | 830 ? -10% | 2159 ? 133% |
| Score Total (Points) | 2370 | 2313 -2% | 1757 -26% | 4054 71% | 1520 -36% | 2107 ? -11% | 4135 ? 74% |
| Totalt genomsnitt (program/inställningar) | 25% /
23% | -35% /
-37% | 59% /
59% | -28% /
-30% | -15% /
-15% | 102% /
99% |
* ... mindre är bättre

Inläsning vid kontinuerlig belastning: DiskSpd Read Loop, Queue Depth 8
| 3DMark 11 - 1280x720 Performance GPU | |
| Genomsnitt av klass Subnotebook (995 - 18489, n=57, senaste 2 åren) | |
| Microsoft Surface Laptop 3 13 Core i5-1035G7 | |
| Lenovo IdeaPad S540-13API | |
| Acer Swift 3 SF313-52-71Y7 | |
| Genomsnitt Intel Iris Plus Graphics G4 (Ice Lake 48 EU) (1941 - 3334, n=6) | |
| Acer Swift 3 SF313-52-52AS | |
| HP ProBook 430 G7-8VU53EA | |
| 3DMark - 1920x1080 Fire Strike Graphics | |
| Genomsnitt av klass Subnotebook (832 - 16347, n=58, senaste 2 åren) | |
| Acer Swift 3 SF313-52-71Y7 | |
| Microsoft Surface Laptop 3 13 Core i5-1035G7 | |
| Lenovo IdeaPad S540-13API | |
| Acer Swift 3 SF313-52-52AS | |
| Genomsnitt Intel Iris Plus Graphics G4 (Ice Lake 48 EU) (922 - 2230, n=6) | |
| HP ProBook 430 G7-8VU53EA | |
| 3DMark 11 Performance | 3001 poäng | |
| 3DMark Fire Strike Score | 1820 poäng | |
Hjälp | ||
| Dota 2 Reborn | |
| 1280x720 min (0/3) fastest | |
| Genomsnitt av klass Subnotebook (33.7 - 183.5, n=63, senaste 2 åren) | |
| Acer Swift 3 SF313-52-71Y7 | |
| Lenovo IdeaPad S540-13API | |
| Genomsnitt Intel Iris Plus Graphics G4 (Ice Lake 48 EU) (48.2 - 108, n=6) | |
| HP ProBook 430 G7-8VU53EA | |
| HP ProBook 430 G7-8VU53EA | |
| Acer Swift 3 SF313-52-52AS | |
| Acer Swift 3 SF313-52-52AS | |
| 1366x768 med (1/3) | |
| Genomsnitt av klass Subnotebook (25 - 149.1, n=63, senaste 2 åren) | |
| Lenovo IdeaPad S540-13API | |
| Acer Swift 3 SF313-52-71Y7 | |
| HP ProBook 430 G7-8VU53EA | |
| HP ProBook 430 G7-8VU53EA | |
| Acer Swift 3 SF313-52-52AS | |
| Acer Swift 3 SF313-52-52AS | |
| Genomsnitt Intel Iris Plus Graphics G4 (Ice Lake 48 EU) (23.4 - 43.6, n=6) | |
| 1920x1080 high (2/3) | |
| Genomsnitt av klass Subnotebook (14.8 - 101.2, n=63, senaste 2 åren) | |
| Lenovo IdeaPad S540-13API | |
| Acer Swift 3 SF313-52-71Y7 | |
| HP ProBook 430 G7-8VU53EA | |
| HP ProBook 430 G7-8VU53EA | |
| Genomsnitt Intel Iris Plus Graphics G4 (Ice Lake 48 EU) (12.4 - 23.2, n=4) | |
| X-Plane 11.11 | |
| 1280x720 low (fps_test=1) | |
| Genomsnitt av klass Subnotebook (29.9 - 82.5, n=61, senaste 2 åren) | |
| Acer Swift 3 SF313-52-71Y7 | |
| Lenovo IdeaPad S540-13API | |
| Acer Swift 3 SF313-52-52AS | |
| Acer Swift 3 SF313-52-52AS | |
| Genomsnitt Intel Iris Plus Graphics G4 (Ice Lake 48 EU) (17.8 - 26.5, n=4) | |
| HP ProBook 430 G7-8VU53EA | |
| HP ProBook 430 G7-8VU53EA | |
| 1920x1080 med (fps_test=2) | |
| Genomsnitt av klass Subnotebook (25.1 - 65.9, n=52, senaste 2 åren) | |
| Lenovo IdeaPad S540-13API | |
| HP ProBook 430 G7-8VU53EA | |
| HP ProBook 430 G7-8VU53EA | |
| Acer Swift 3 SF313-52-52AS | |
| Acer Swift 3 SF313-52-52AS | |
| Genomsnitt Intel Iris Plus Graphics G4 (Ice Lake 48 EU) (9.32 - 14.4, n=4) | |
| Acer Swift 3 SF313-52-71Y7 | |
| 1920x1080 high (fps_test=3) | |
| Genomsnitt av klass Subnotebook (20.7 - 50.5, n=52, senaste 2 åren) | |
| Lenovo IdeaPad S540-13API | |
| Acer Swift 3 SF313-52-52AS | |
| Acer Swift 3 SF313-52-52AS | |
| HP ProBook 430 G7-8VU53EA | |
| HP ProBook 430 G7-8VU53EA | |
| Genomsnitt Intel Iris Plus Graphics G4 (Ice Lake 48 EU) (9.16 - 13.2, n=4) | |
| Acer Swift 3 SF313-52-71Y7 | |
| låg | med. | hög | ultra | |
|---|---|---|---|---|
| Dota 2 Reborn (2015) | 69.3 | 41.6 | 19.6 | |
| X-Plane 11.11 (2018) | 26.3 | 14.2 | 13.2 |
Ljudnivå
| Låg belastning |
| 31.2 / 31.2 / 31.2 dB(A) |
| Hög belastning |
| 33.2 / 34.9 dB(A) |
 | ||
30 dB tyst 40 dB(A) hörbar 50 dB(A) högt ljud |
||
min: | ||
(+) Den maximala temperaturen på ovansidan är 34.7 °C / 94 F, jämfört med genomsnittet av 35.9 °C / 97 F , allt från 21.4 till 59 °C för klassen Subnotebook.
(+) Botten värms upp till maximalt 36.4 °C / 98 F, jämfört med genomsnittet av 39.2 °C / 103 F
(+) Vid tomgångsbruk är medeltemperaturen för ovansidan 25.9 °C / 79 F, jämfört med enhetsgenomsnittet på 30.8 °C / ### class_avg_f### F.
(+) Handledsstöden och pekplattan är kallare än hudtemperaturen med maximalt 29.2 °C / 84.6 F och är därför svala att ta på.
(±) Medeltemperaturen för handledsstödsområdet på liknande enheter var 28.2 °C / 82.8 F (-1 °C / -1.8 F).
Acer Swift 3 SF313-52-52AS ljudanalys
(±) | högtalarljudstyrkan är genomsnittlig men bra (77.1 dB)
Bas 100 - 315 Hz
(-) | nästan ingen bas - i genomsnitt 26.7% lägre än medianen
(±) | linjäriteten för basen är genomsnittlig (7.8% delta till föregående frekvens)
Mellan 400 - 2000 Hz
(±) | reducerade mids - i genomsnitt 6.1% lägre än median
(±) | linjäriteten för mids är genomsnittlig (10.8% delta till föregående frekvens)
Högsta 2 - 16 kHz
(±) | högre toppar - i genomsnitt 11% högre än medianen
(+) | toppar är linjära (3.9% delta till föregående frekvens)
Totalt 100 - 16 000 Hz
(-) | det totala ljudet är inte linjärt (32.2% skillnad mot median)
Jämfört med samma klass
» 94% av alla testade enheter i den här klassen var bättre, 2% liknande, 4% sämre
» Den bästa hade ett delta på 5%, genomsnittet var 18%, sämst var 53%
Jämfört med alla testade enheter
» 91% av alla testade enheter var bättre, 2% liknande, 7% sämre
» Den bästa hade ett delta på 4%, genomsnittet var 24%, sämst var 134%
Apple MacBook 12 (Early 2016) 1.1 GHz ljudanalys
(+) | högtalare kan spela relativt högt (83.6 dB)
Bas 100 - 315 Hz
(±) | reducerad bas - i genomsnitt 11.3% lägre än medianen
(±) | linjäriteten för basen är genomsnittlig (14.2% delta till föregående frekvens)
Mellan 400 - 2000 Hz
(+) | balanserad mellan - endast 2.4% från medianen
(+) | mids är linjära (5.5% delta till föregående frekvens)
Högsta 2 - 16 kHz
(+) | balanserade toppar - endast 2% från medianen
(+) | toppar är linjära (4.5% delta till föregående frekvens)
Totalt 100 - 16 000 Hz
(+) | det totala ljudet är linjärt (10.2% skillnad mot median)
Jämfört med samma klass
» 7% av alla testade enheter i den här klassen var bättre, 2% liknande, 91% sämre
» Den bästa hade ett delta på 5%, genomsnittet var 18%, sämst var 53%
Jämfört med alla testade enheter
» 5% av alla testade enheter var bättre, 1% liknande, 94% sämre
» Den bästa hade ett delta på 4%, genomsnittet var 24%, sämst var 134%
| Av/Standby | |
| Låg belastning | |
| Hög belastning |
|
Förklaring:
min: | |
| Battery Runtime - WiFi Websurfing | |
| Genomsnitt av klass Subnotebook (7.25 - 26.4, n=62, senaste 2 åren) | |
| Acer Swift 3 SF313-52-52AS | |
| Lenovo IdeaPad S540-13API | |
| Acer Swift 3 SF313-52-71Y7 | |
| Microsoft Surface Laptop 3 13 Core i5-1035G7 | |
| HP ProBook 430 G7-8VU53EA | |
För
Emot
Omdöme - Bra laptop från Acer som bara har några mindre svagheter
Läs den fullständiga versionen av den här recensionen på engelska här.
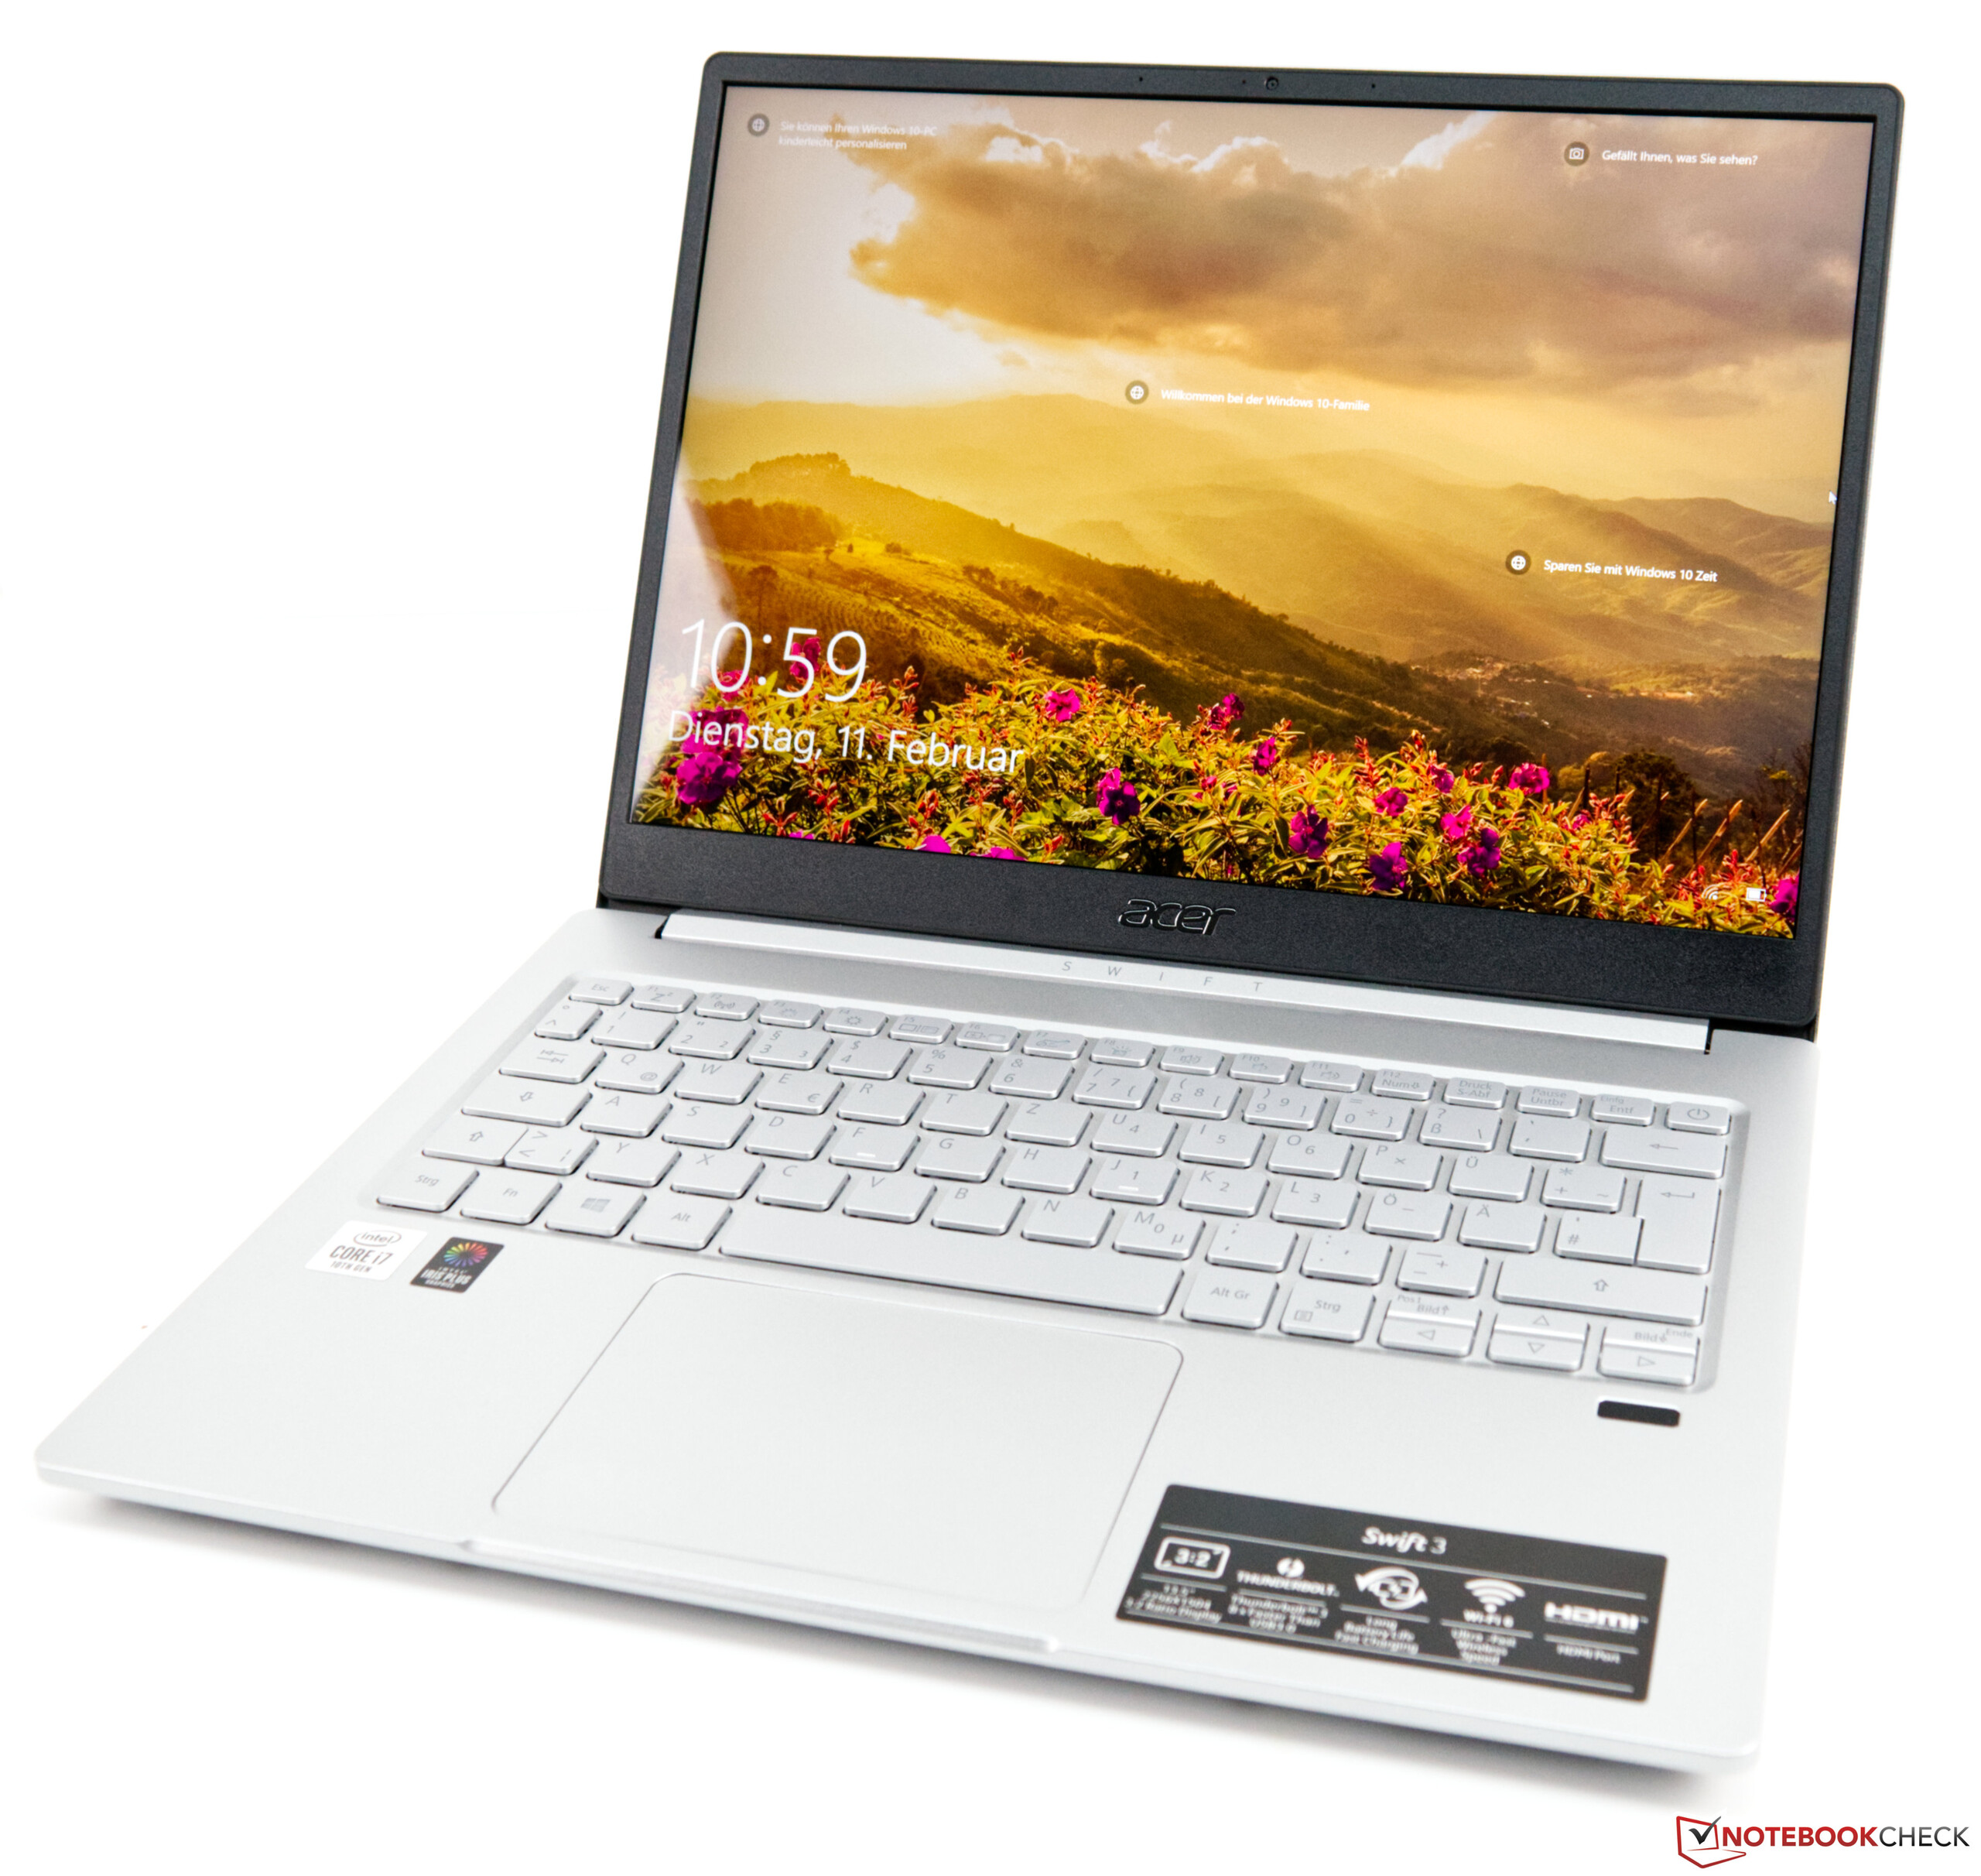
Efter testet lämnade Acer Swift 3 SF313 med Intel Core i5 ungefär samma intryck som den fullt konfigurerade Acer Swift 3 SF313 vi recenserat tidigare. Den har hög prestanda och både skärmen och höljets hantverksmässiga kvalitet övertygar. Vi gillade dessutom verkligen den ökade WLAN-prestandan, för på den starkare modellen hamnade den långt efter hårdvarans kapacitet. Batteritiden förtjänar också att nämnas, då den har ökat med ungefär en halvtimme på Core i5-modellen.
Den som köper Acer Swift 3 SF313-52-52AS får leva med en aning lägre prestanda men får i gengäld ett lägre pris och längre batteritid.
Men känslan av att det borde funnits mer på insidan kvarstår. Skärmen i 3:2-format tilltalar definitivt en del köpare med sin höga upplösning, men den hade haft lika bra specifikationer med en matt yta. CPU-prestandan håller sig dessutom en bit under förväntningarna, men kan tillsammans med de övriga komponenterna garantera smidig drift. Överväger du ett köp och inte är beroende av Core i7-prestanda får du med Acer Swift 3 SF313-52-52AS en bra laptop till ett betydligt lägre pris
Acer Swift 3 SF313-52-52AS
- 06/01/2020 v7 (old)
Mike Wobker
Price comparison
