 Deutsch
 English
 Español
 Français
 Italiano
 Nederlands
 Polski
 Português
 Русский
 Türkçe
 Svenska
 Chinese
 Magyar
Test: HP Elite x2 1013 G3 (i5-8350U, SSD, 3k) 2-i-1 (Sammanfattning)
| |||||||||||||||||||||||||
Distribution av ljusstyrkan: 85 %
Mitt på batteriet: 456 cd/m²
Kontrast: 942:1 (Svärta: 0.48 cd/m²)
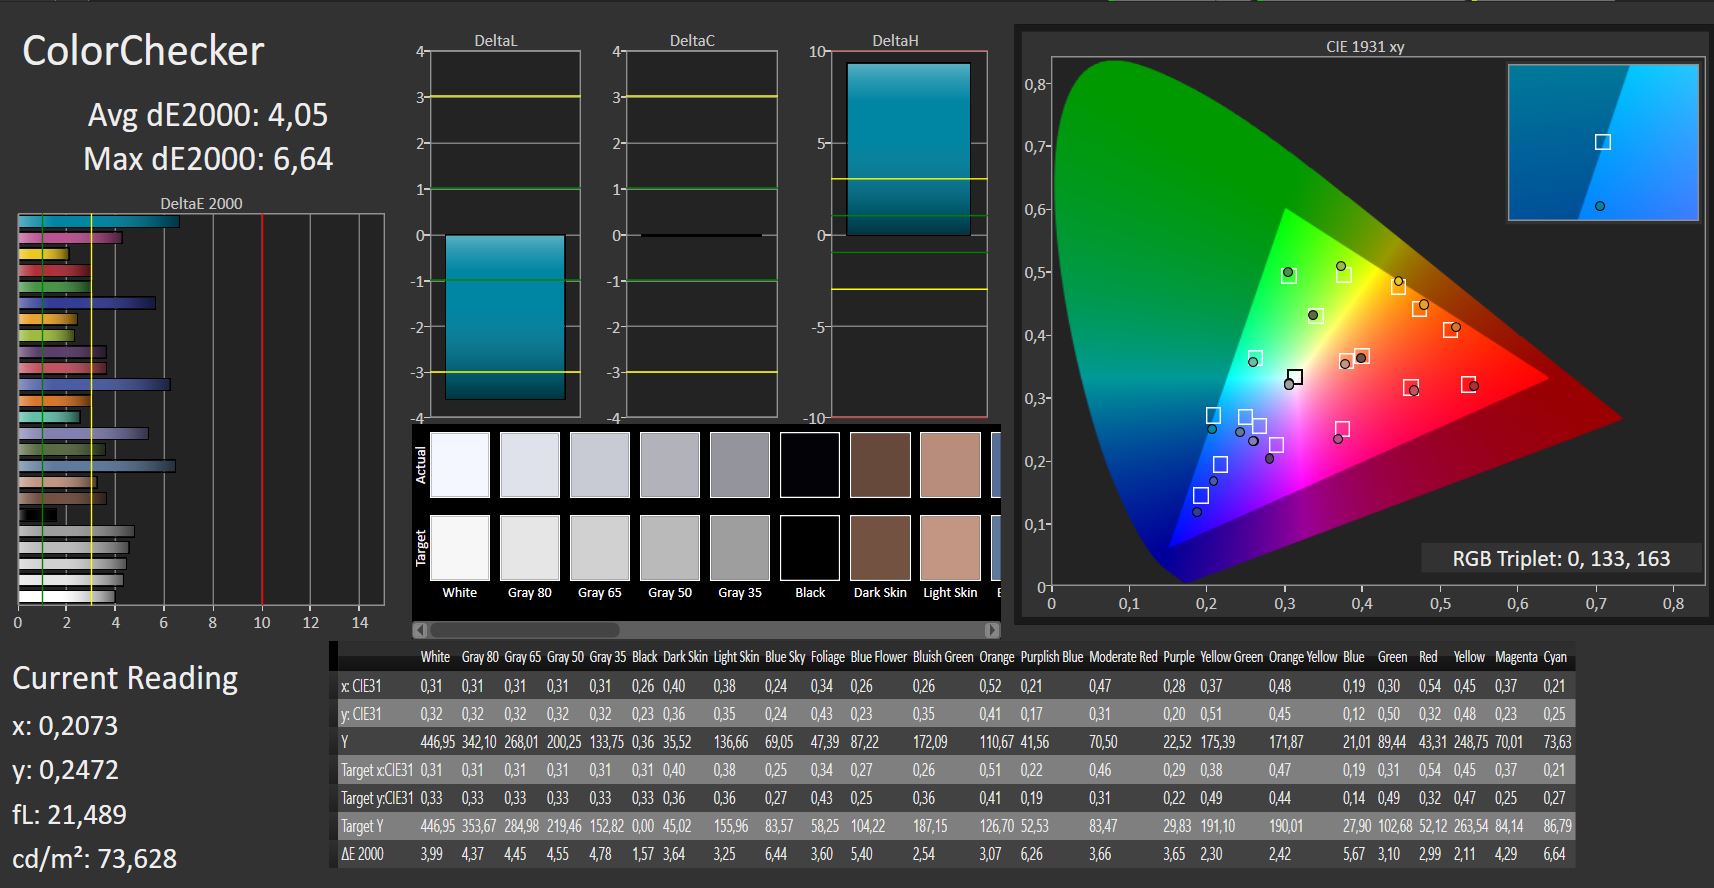
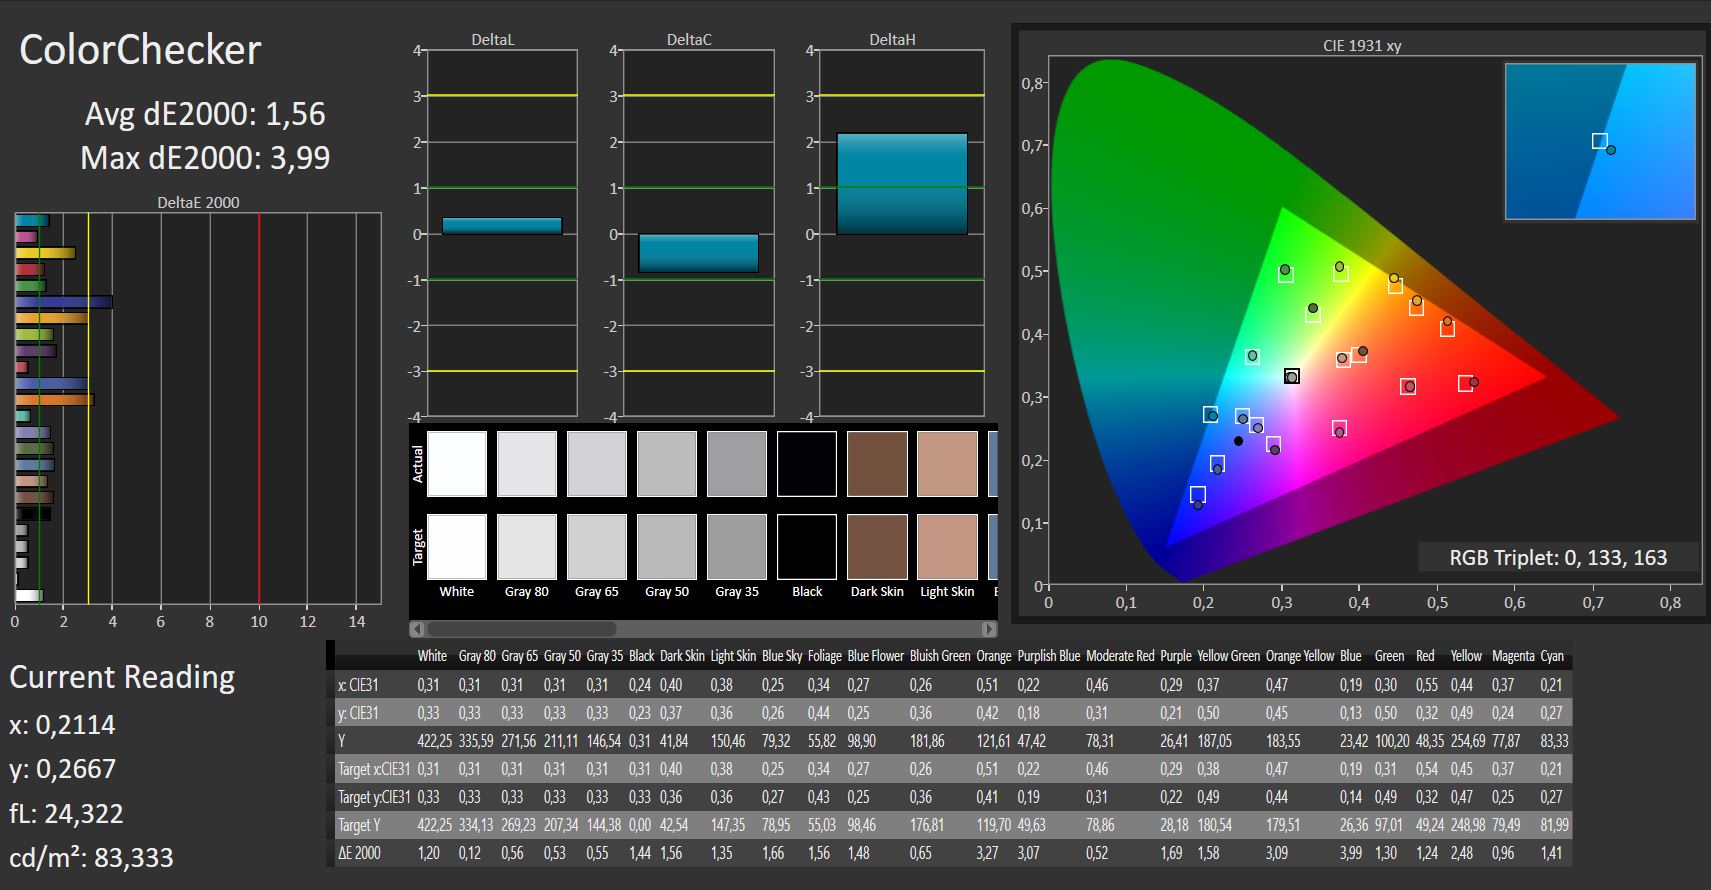
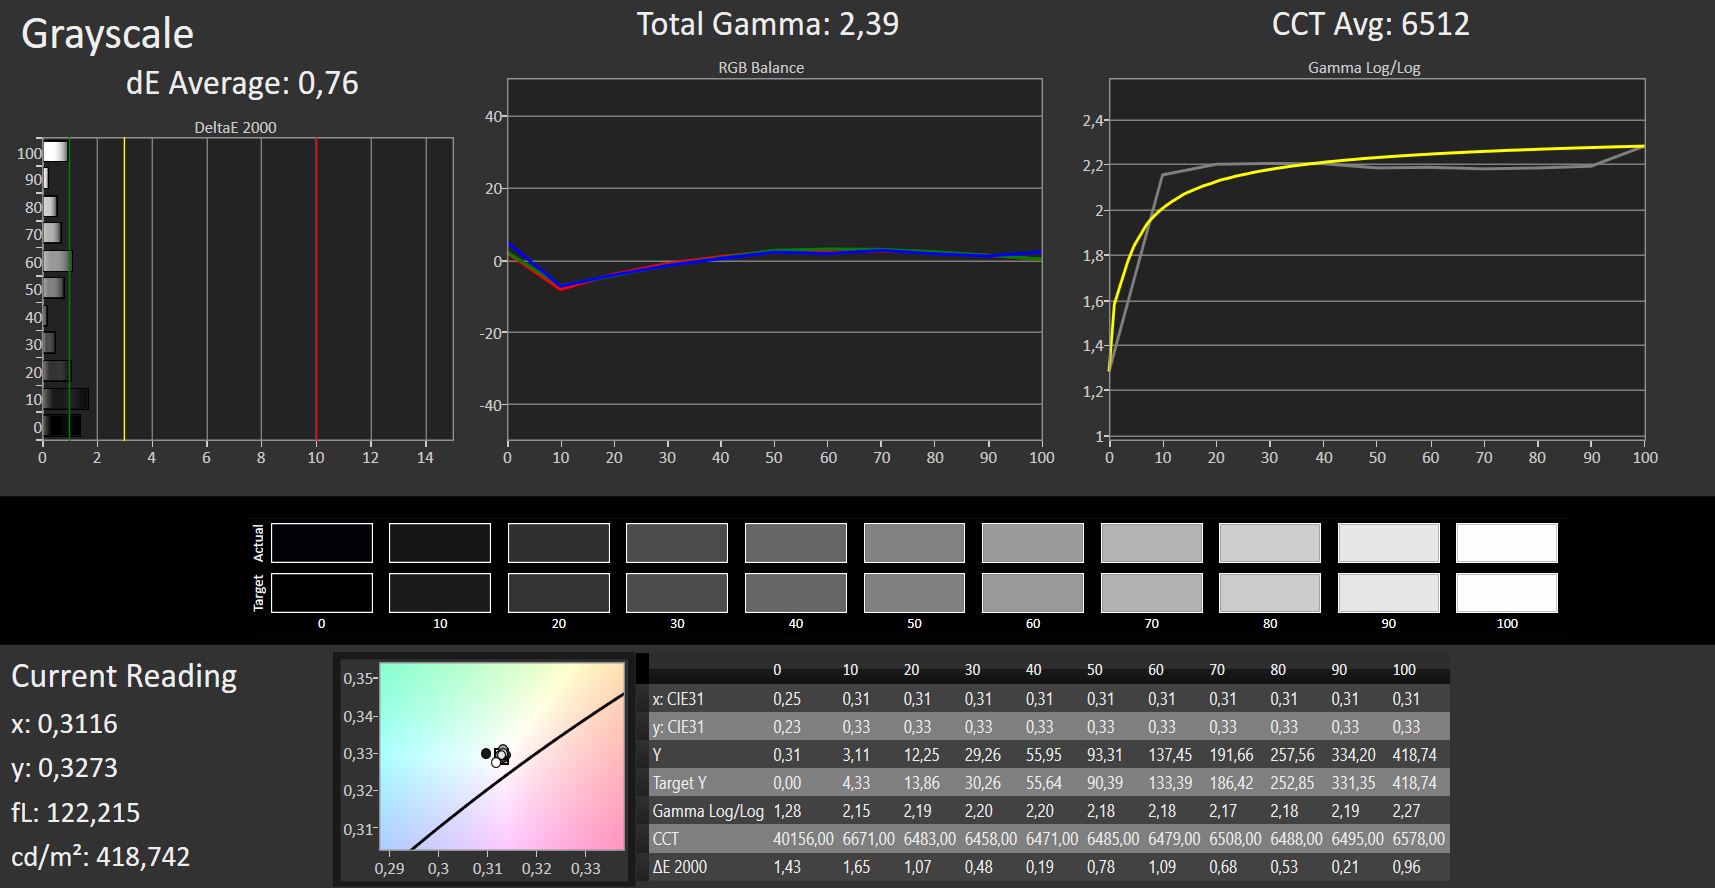
ΔE Color 4.05 | 0.5-29.43 Ø5, calibrated: 1.56
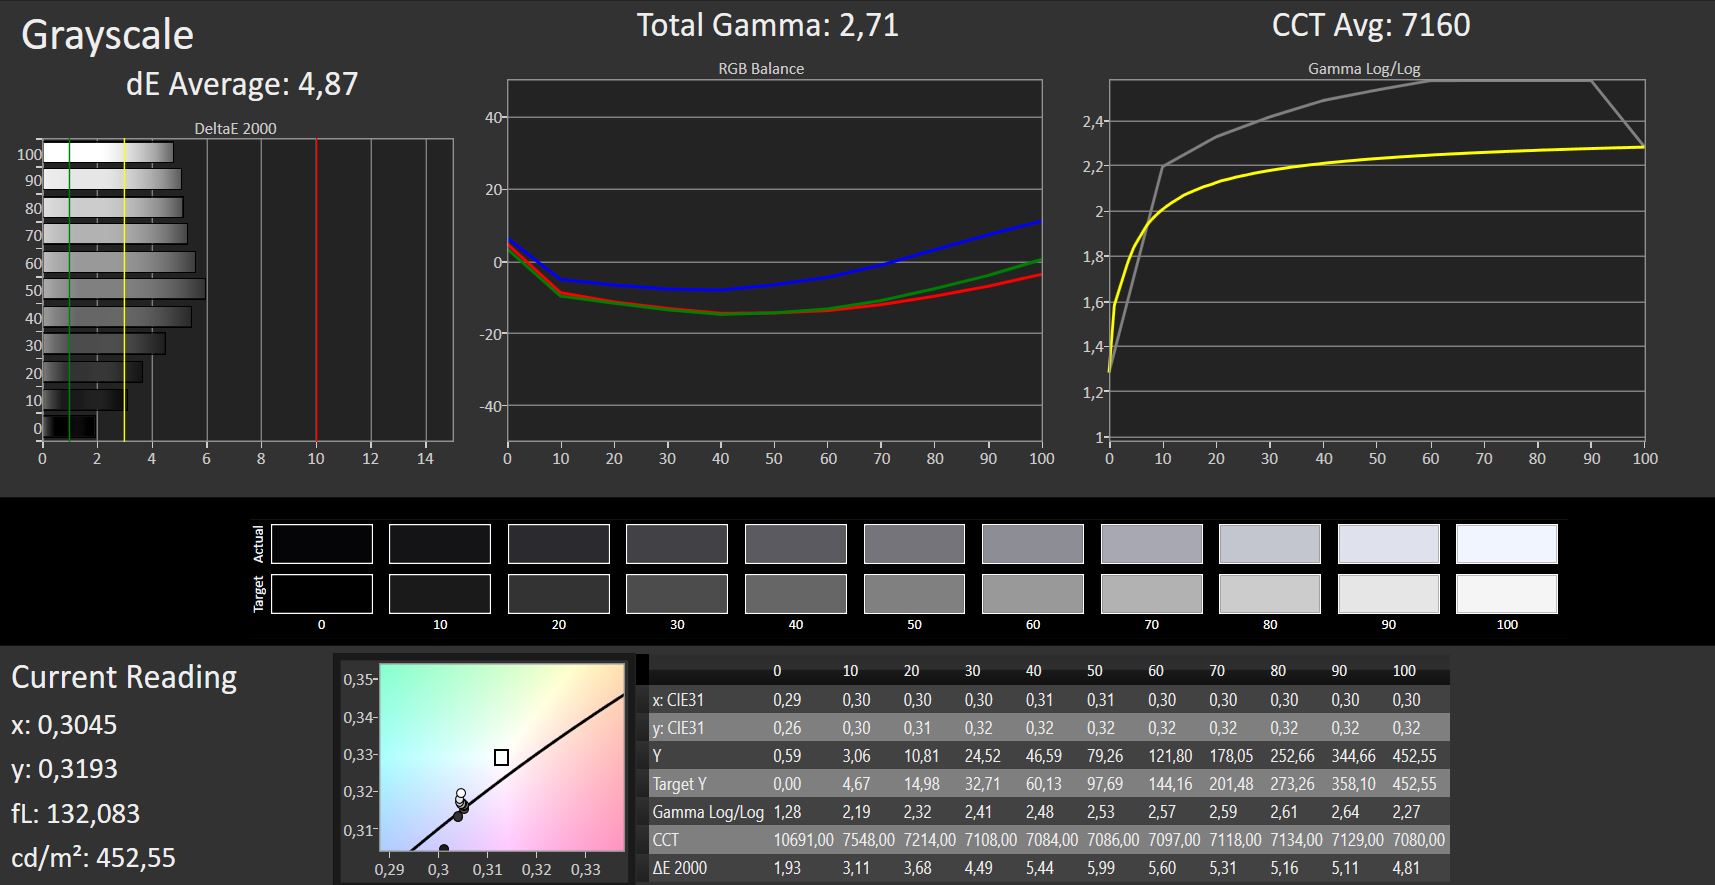
ΔE Greyscale 4.87 | 0.57-98 Ø5.3
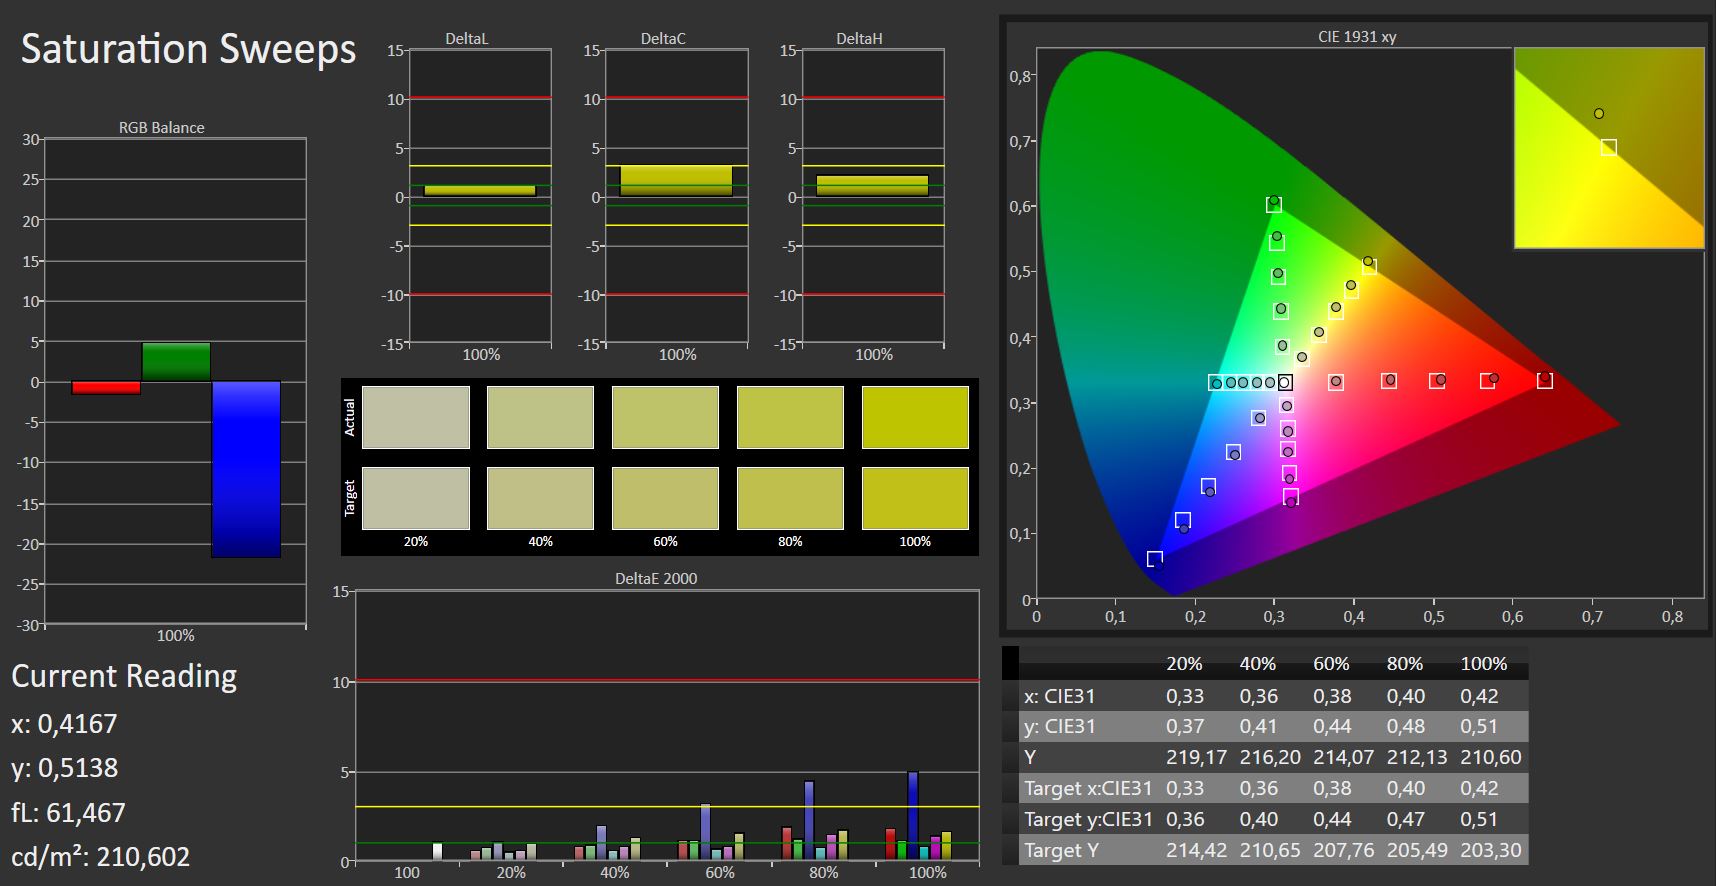
97% sRGB (Argyll 1.6.3 3D)
62% AdobeRGB 1998 (Argyll 1.6.3 3D)
68.2% AdobeRGB 1998 (Argyll 2.2.0 3D)
96.7% sRGB (Argyll 2.2.0 3D)
67.5% Display P3 (Argyll 2.2.0 3D)
Gamma: 2.71
| HP Elite x2 1013 G3-2TT14EA IPS, 3000x2000, 13.00 | HP Elite x2 1012 G2-1LV76EA IPS, 2716x1824, 12.30 | Lenovo Miix 520-12IKB 20M3000LGE IPS, 1920x1200, 12.20 | Dell Latitude 12 5285 2-in-1 IPS, 1920x1280, 12.30 | Asus Transformer 4 Pro (i7-7500U, HD620) IPS, 2160x1440, 12.60 | Microsoft Surface Pro (2017) i7 IPS, 2736x1824, 12.30 | Microsoft Surface Pro (2017) i5 IPS, 2736x1824, 12.30 | |
|---|---|---|---|---|---|---|---|
| Display | 0% | -3% | -5% | -2% | -1% | 1% | |
| Display P3 Coverage | 67.5 | 66.7 -1% | 66.1 -2% | 62.8 -7% | 69.6 3% | 66.6 -1% | 67.6 0% |
| sRGB Coverage | 96.7 | 98 1% | 91.6 -5% | 94 -3% | 90 -7% | 96.5 0% | 99 2% |
| AdobeRGB 1998 Coverage | 68.2 | 68.7 1% | 66.7 -2% | 64.7 -5% | 65.9 -3% | 67.8 -1% | 69.1 1% |
| Response Times | 10% | 18% | -4% | 3% | 13% | -1% | |
| Response Time Grey 50% / Grey 80% * | 47 ? | 45.6 ? 3% | 36 ? 23% | 42.4 ? 10% | 41 ? 13% | 37 ? 21% | 42 ? 11% |
| Response Time Black / White * | 26 ? | 21.6 ? 17% | 23 ? 12% | 30.8 ? -18% | 28 ? -8% | 25 ? 4% | 29 ? -12% |
| PWM Frequency | 2119 ? | 200 ? | 210.1 ? | 22130 ? | 21000 | ||
| Screen | 16% | -19% | 5% | 1% | 5% | 15% | |
| Brightness middle | 452 | 443 -2% | 384 -15% | 523.2 16% | 262 -42% | 482 7% | 417 -8% |
| Brightness | 412 | 446 8% | 355 -14% | 522 27% | 254 -38% | 466 13% | 401 -3% |
| Brightness Distribution | 85 | 88 4% | 80 -6% | 88 4% | 89 5% | 92 8% | 88 4% |
| Black Level * | 0.48 | 0.41 15% | 0.56 -17% | 0.42 12% | 0.26 46% | 0.395 18% | 0.29 40% |
| Contrast | 942 | 1080 15% | 686 -27% | 1246 32% | 1008 7% | 1220 30% | 1438 53% |
| Colorchecker dE 2000 * | 4.05 | 2.6 36% | 4.58 -13% | 4 1% | 3.34 18% | 4 1% | 3.63 10% |
| Colorchecker dE 2000 max. * | 6.64 | 4 40% | 11.63 -75% | 8.6 -30% | 7.12 -7% | 7.2 -8% | 6.74 -2% |
| Colorchecker dE 2000 calibrated * | 1.56 | ||||||
| Greyscale dE 2000 * | 4.87 | 3 38% | 5.63 -16% | 5.5 -13% | 3.28 33% | 5.7 -17% | 2.18 55% |
| Gamma | 2.71 81% | 2.38 92% | 2.45 90% | 2.16 102% | 2.47 89% | 2.28 96% | 3.09 71% |
| CCT | 7160 91% | 6780 96% | 7571 86% | 7546 86% | 7180 91% | 7950 82% | 6767 96% |
| Color Space (Percent of AdobeRGB 1998) | 62 | 62.6 1% | 60 -3% | 64.86 5% | 59 -5% | 62 0% | 63 2% |
| Color Space (Percent of sRGB) | 97 | 98 1% | 92 -5% | 93.97 -3% | 90 -7% | 96 -1% | 99 2% |
| Total Average (Program / Settings) | 9% /
12% | -1% /
-11% | -1% /
2% | 1% /
1% | 6% /
5% | 5% /
10% |
* ... smaller is better
Screen Flickering / PWM (Pulse-Width Modulation)
| Screen flickering / PWM not detected | 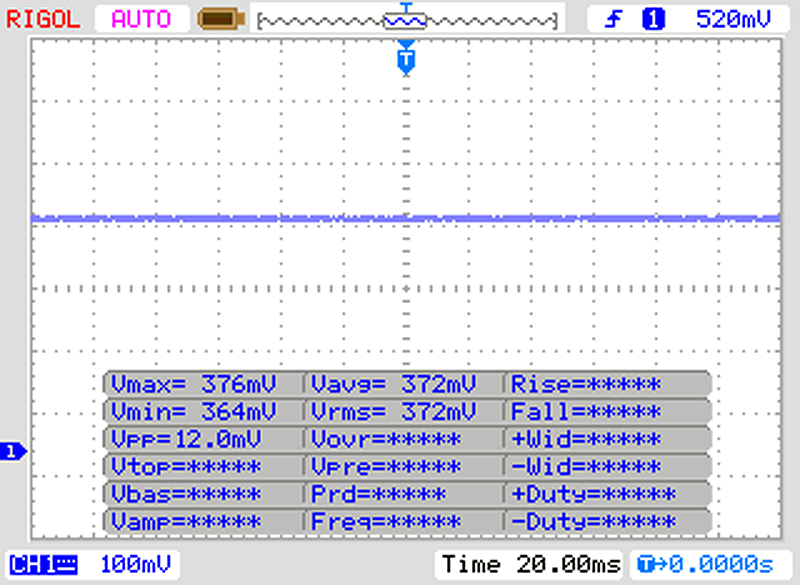 | ||
In comparison: 53 % of all tested devices do not use PWM to dim the display. If PWM was detected, an average of 17903 (minimum: 5 - maximum: 3846000) Hz was measured. | |||
Display Response Times
| ↔ Response Time Black to White | ||
|---|---|---|
| 26 ms ... rise ↗ and fall ↘ combined | ↗ 14 ms rise | 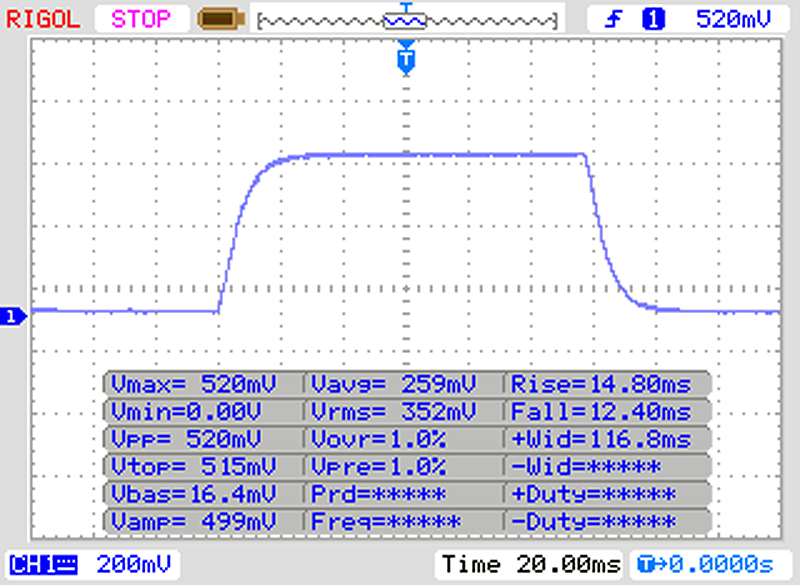 |
| ↘ 12 ms fall | ||
| The screen shows relatively slow response rates in our tests and may be too slow for gamers. In comparison, all tested devices range from 0.1 (minimum) to 240 (maximum) ms. » 57 % of all devices are better. This means that the measured response time is worse than the average of all tested devices (21.5 ms). | ||
| ↔ Response Time 50% Grey to 80% Grey | ||
| 47 ms ... rise ↗ and fall ↘ combined | ↗ 23 ms rise | 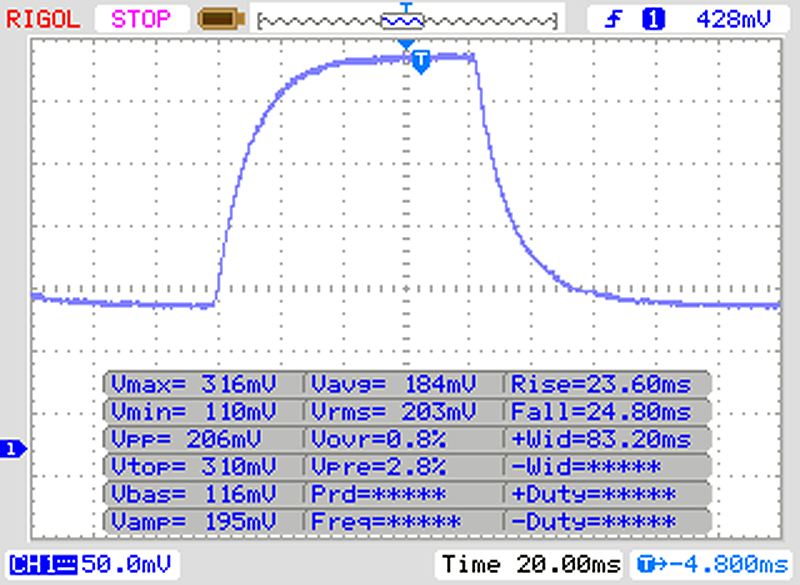 |
| ↘ 24 ms fall | ||
| The screen shows slow response rates in our tests and will be unsatisfactory for gamers. In comparison, all tested devices range from 0.2 (minimum) to 636 (maximum) ms. » 78 % of all devices are better. This means that the measured response time is worse than the average of all tested devices (33.7 ms). | ||
| Geekbench 3 | |
| 32 Bit Multi-Core Score | |
| Lenovo Miix 520-12IKB 20M3000LGE | |
| HP Elite x2 1013 G3-2TT14EA | |
| Average Intel Core i5-8350U () | |
| 32 Bit Single-Core Score | |
| Lenovo Miix 520-12IKB 20M3000LGE | |
| HP Elite x2 1013 G3-2TT14EA | |
| Average Intel Core i5-8350U () | |
| Geekbench 4.0 | |
| 64 Bit Multi-Core Score | |
| Lenovo Miix 520-12IKB 20M3000LGE | |
| Average Intel Core i5-8350U (12679 - 12920, n=2) | |
| HP Elite x2 1013 G3-2TT14EA | |
| 64 Bit Single-Core Score | |
| Lenovo Miix 520-12IKB 20M3000LGE | |
| Average Intel Core i5-8350U (4160 - 4260, n=2) | |
| HP Elite x2 1013 G3-2TT14EA | |
| Mozilla Kraken 1.1 - Total | |
| HP Elite x2 1013 G3-2TT14EA (Edge 42) | |
| HP Elite x2 1012 G2-1LV76EA (Edge 40.15063.0.0) | |
| Average Intel Core i5-8350U (1017 - 1289, n=5) | |
| Asus Transformer 4 Pro (i7-7500U, HD620) | |
| Microsoft Surface Pro (2017) i7 (Edge 40) | |
| Average of class Convertible (472 - 3989, n=66, last 2 years) | |
| Octane V2 - Total Score | |
| Average of class Convertible (70338 - 92146, n=14, last 2 years) | |
| Microsoft Surface Pro (2017) i7 (Edge 40) | |
| Microsoft Surface Pro (2017) i5 | |
| Average Intel Core i5-8350U (28223 - 38722, n=5) | |
| Asus Transformer 4 Pro (i7-7500U, HD620) | |
| HP Elite x2 1013 G3-2TT14EA (Edge 42) | |
| HP Elite x2 1012 G2-1LV76EA (Edge 40.15063.0.0) | |
| JetStream 1.1 - Total Score | |
| Average of class Convertible (338 - 443, n=4, last 2 years) | |
| Lenovo Miix 520-12IKB 20M3000LGE (Edge 41) | |
| Microsoft Surface Pro (2017) i7 (Edge 40) | |
| HP Elite x2 1013 G3-2TT14EA (Edge 42) | |
| Microsoft Surface Pro (2017) i5 | |
| HP Elite x2 1012 G2-1LV76EA (Edge 40.15063.0.0) | |
| Average Intel Core i5-8350U (173 - 232, n=5) | |
| Asus Transformer 4 Pro (i7-7500U, HD620) | |
| Fujitsu Stylistic Q738 | |
| Huawei Matebook E | |
* ... smaller is better
| PCMark 7 Score | 5676 poäng | |
| PCMark 8 Home Score Accelerated v2 | 3413 poäng | |
| PCMark 8 Creative Score Accelerated v2 | 4669 poäng | |
| PCMark 8 Work Score Accelerated v2 | 4200 poäng | |
| PCMark 10 Score | 3559 poäng | |
Hjälp | ||

| HP Elite x2 1013 G3-2TT14EA Samsung PM961 MZVLW256HEHP | HP Elite x2 1012 G2-1LV76EA Samsung PM961 MZVLW256HEHP | Lenovo Miix 520-12IKB 20M3000LGE Samsung SSD PM961 1TB M.2 PCIe 3.0 x4 NVMe (MZVLW1T0) | Dell Latitude 12 5285 2-in-1 Samsung PM961 MZVLW256HEHP | Asus Transformer 4 Pro (i7-7500U, HD620) SK Hynix HFS256G39TND-N210A | Microsoft Surface Pro (2017) i7 Samsung PM971 KUS040202M | Microsoft Surface Pro (2017) i5 Samsung PM971 KUS030202M | Average Samsung PM961 MZVLW256HEHP | |
|---|---|---|---|---|---|---|---|---|
| CrystalDiskMark 3.0 | 30% | 14% | -9% | -45% | 4% | -15% | 14% | |
| Read Seq | 1786 | 1875 5% | 883 -51% | 1294 -28% | 475.3 -73% | 1308 -27% | 723 -60% | 1627 ? -9% |
| Write Seq | 1209 | 1261 4% | 932 -23% | 865 -28% | 260.9 -78% | 961 -21% | 853 -29% | 1136 ? -6% |
| Read 512 | 717 | 1235 72% | 586 -18% | 406 -43% | 289.3 -60% | 227.5 -68% | 225 -69% | 887 ? 24% |
| Write 512 | 798 | 844 6% | 627 -21% | 589 -26% | 260.7 -67% | 792 -1% | 445 -44% | 781 ? -2% |
| Read 4k | 49.66 | 56.9 15% | 54.8 10% | 31.75 -36% | 30.06 -39% | 53.6 8% | 46 -7% | 53 ? 7% |
| Write 4k | 104.2 | 145.4 40% | 139.3 34% | 72.2 -31% | 73.5 -29% | 136.3 31% | 125 20% | 126.7 ? 22% |
| Read 4k QD32 | 286 | 398.3 39% | 607 112% | 493.3 72% | 296.8 4% | 485.6 70% | 423 48% | 419 ? 47% |
| Write 4k QD32 | 298.4 | 472.5 58% | 498.5 67% | 434.5 46% | 239.8 -20% | 421.5 41% | 373 25% | 384 ? 29% |
| 3DMark 06 Standard Score | 10622 poäng | |
| 3DMark 11 Performance | 1851 poäng | |
| 3DMark Ice Storm Standard Score | 56649 poäng | |
| 3DMark Cloud Gate Standard Score | 7437 poäng | |
| 3DMark Fire Strike Score | 1026 poäng | |
| 3DMark Time Spy Score | 384 poäng | |
Hjälp | ||
| 3DMark 11 - 1280x720 Performance GPU | |
| Average of class Convertible (471 - 40768, n=66, last 2 years) | |
| Microsoft Surface Pro (2017) i7 | |
| Average Intel UHD Graphics 620 (1144 - 3432, n=244) | |
| Lenovo Miix 520-12IKB 20M3000LGE (Cool Mode Off) | |
| Lenovo Miix 520-12IKB 20M3000LGE (Cool Mode On) | |
| HP Elite x2 1013 G3-2TT14EA | |
| Dell Latitude 12 5285 2-in-1 | |
| HP Elite x2 1012 G2-1LV76EA | |
| Asus Transformer 4 Pro (i7-7500U, HD620) | |
| Huawei Matebook E | |
| Fujitsu Stylistic Q738 | |
| låg | med. | hög | ultra | |
| Tomb Raider (2013) | 91.5 | 45 | 28.6 | 12.8 |
| BioShock Infinite (2013) | 60.6 | 31.1 | 26.8 | 8.7 |
| Rise of the Tomb Raider (2016) | 17.2 | 11.4 | 6 | 3.1 |
| BioShock Infinite - 1280x720 Very Low Preset | |
| Lenovo Miix 520-12IKB 20M3000LGE | |
| Average Intel UHD Graphics 620 (18.3 - 90.2, n=187) | |
| HP Elite x2 1013 G3-2TT14EA | |
| Dell Latitude 12 5285 2-in-1 | |
| HP Elite x2 1012 G2-1LV76EA | |
| Fujitsu Stylistic Q738 | |
| Microsoft Surface Pro (2017) i5 | |
| Huawei Matebook E | |
| Asus Transformer 4 Pro (i7-7500U, HD620) | |
| Tomb Raider - 1024x768 Low Preset | |
| HP Elite x2 1013 G3-2TT14EA | |
| Dell Latitude 12 5285 2-in-1 | |
| Average Intel UHD Graphics 620 (24.3 - 114.4, n=18) | |
Ljudnivå
| Låg belastning |
| 30.3 / 30.3 / 31.2 dB(A) |
| Hög belastning |
| 32.8 / 32.9 dB(A) |
 | ||
30 dB tyst 40 dB(A) hörbar 50 dB(A) högt ljud |
||
min: | ||
| HP Elite x2 1013 G3-2TT14EA i5-8350U, UHD Graphics 620 | HP Elite x2 1012 G2-1LV76EA i5-7200U, HD Graphics 620 | Lenovo Miix 520-12IKB 20M3000LGE i5-8550U, UHD Graphics 620 | Dell Latitude 12 5285 2-in-1 i7-7600U, HD Graphics 620 | Asus Transformer 4 Pro (i7-7500U, HD620) i7-7500U, HD Graphics 620 | Microsoft Surface Pro (2017) i7 i7-7660U, Iris Plus Graphics 640 | Average Intel UHD Graphics 620 | Average of class Convertible | |
|---|---|---|---|---|---|---|---|---|
| Noise | 4% | -1% | 6% | 1% | 1% | 1% | 9% | |
| off / environment * | 30.3 | 29.5 3% | 30.2 -0% | 28.2 7% | 30.2 -0% | 29.6 2% | 29 ? 4% | 24 ? 21% |
| Idle Minimum * | 30.3 | 29.5 3% | 30.2 -0% | 28.2 7% | 30.2 -0% | 29.6 2% | 29.1 ? 4% | 24.3 ? 20% |
| Idle Average * | 30.3 | 29.5 3% | 30.2 -0% | 28.2 7% | 30.2 -0% | 29.6 2% | 29.1 ? 4% | 24.5 ? 19% |
| Idle Maximum * | 31.2 | 29.5 5% | 30.2 3% | 28.2 10% | 29.6 5% | 29.7 ? 5% | 25.4 ? 19% | |
| Load Average * | 32.8 | 30.6 7% | 33.4 -2% | 30.4 7% | 30.8 6% | 33.4 -2% | 33.5 ? -2% | 34.6 ? -5% |
| Load Maximum * | 32.9 | 32.5 1% | 34.2 -4% | 34 -3% | 32.9 -0% | 34.1 -4% | 36.1 ? -10% | 40.3 ? -22% |
| Witcher 3 ultra * | 33.4 |
* ... smaller is better
(-) The maximum temperature on the upper side is 49.4 °C / 121 F, compared to the average of 35.3 °C / 96 F, ranging from 19.6 to 55.7 °C for the class Convertible.
(-) The bottom heats up to a maximum of 47.1 °C / 117 F, compared to the average of 36.7 °C / 98 F
(±) In idle usage, the average temperature for the upper side is 32.2 °C / 90 F, compared to the device average of 30.2 °C / 86 F.
(-) The palmrests and touchpad can get very hot to the touch with a maximum of 41 °C / 105.8 F.
(-) The average temperature of the palmrest area of similar devices was 28.1 °C / 82.6 F (-12.9 °C / -23.2 F).
| HP Elite x2 1013 G3-2TT14EA i5-8350U, UHD Graphics 620 | HP Elite x2 1012 G2-1LV76EA i5-7200U, HD Graphics 620 | Lenovo Miix 520-12IKB 20M3000LGE i5-8550U, UHD Graphics 620 | Dell Latitude 12 5285 2-in-1 i7-7600U, HD Graphics 620 | Asus Transformer 4 Pro (i7-7500U, HD620) i7-7500U, HD Graphics 620 | Microsoft Surface Pro (2017) i7 i7-7660U, Iris Plus Graphics 640 | Microsoft Surface Pro (2017) i5 i5-7300U, HD Graphics 620 | Average Intel UHD Graphics 620 | Average of class Convertible | |
|---|---|---|---|---|---|---|---|---|---|
| Heat | 15% | 5% | 12% | 16% | 13% | 8% | 16% | 14% | |
| Maximum Upper Side * | 49.4 | 42.3 14% | 43.7 12% | 38.2 23% | 40.5 18% | 42 15% | 39.2 21% | 41.1 ? 17% | 40.6 ? 18% |
| Maximum Bottom * | 47.1 | 44.5 6% | 44.5 6% | 48.6 -3% | 37 21% | 42 11% | 40.3 14% | 44.3 ? 6% | 43.2 ? 8% |
| Idle Upper Side * | 38 | 29.5 22% | 38 -0% | 29.6 22% | 31.1 18% | 31 18% | 37 3% | 26.8 ? 29% | 28.4 ? 25% |
| Idle Bottom * | 30.8 | 25.2 18% | 30.8 -0% | 28.8 6% | 28.2 8% | 28 9% | 32.3 -5% | 27.7 ? 10% | 29.3 ? 5% |
* ... smaller is better
HP Elite x2 1013 G3-2TT14EA audio analysis
(±) | speaker loudness is average but good (74.4 dB)
Bass 100 - 315 Hz
(-) | nearly no bass - on average 15.1% lower than median
(±) | linearity of bass is average (10.9% delta to prev. frequency)
Mids 400 - 2000 Hz
(±) | higher mids - on average 7.9% higher than median
(±) | linearity of mids is average (11.3% delta to prev. frequency)
Highs 2 - 16 kHz
(±) | higher highs - on average 5.2% higher than median
(+) | highs are linear (6.8% delta to prev. frequency)
Overall 100 - 16.000 Hz
(±) | linearity of overall sound is average (20.8% difference to median)
Compared to same class
» 50% of all tested devices in this class were better, 11% similar, 39% worse
» The best had a delta of 6%, average was 21%, worst was 57%
Compared to all devices tested
» 51% of all tested devices were better, 8% similar, 41% worse
» The best had a delta of 4%, average was 25%, worst was 134%
Apple MacBook 12 (Early 2016) 1.1 GHz audio analysis
(+) | speakers can play relatively loud (83.6 dB)
Bass 100 - 315 Hz
(±) | reduced bass - on average 11.3% lower than median
(±) | linearity of bass is average (14.2% delta to prev. frequency)
Mids 400 - 2000 Hz
(+) | balanced mids - only 2.4% away from median
(+) | mids are linear (5.5% delta to prev. frequency)
Highs 2 - 16 kHz
(+) | balanced highs - only 2% away from median
(+) | highs are linear (4.5% delta to prev. frequency)
Overall 100 - 16.000 Hz
(+) | overall sound is linear (10.2% difference to median)
Compared to same class
» 5% of all tested devices in this class were better, 2% similar, 93% worse
» The best had a delta of 5%, average was 19%, worst was 53%
Compared to all devices tested
» 3% of all tested devices were better, 1% similar, 96% worse
» The best had a delta of 4%, average was 25%, worst was 134%
| Av/Standby | |
| Låg belastning | |
| Hög belastning |
|
| HP Elite x2 1013 G3-2TT14EA i5-8350U, UHD Graphics 620 | HP Elite x2 1012 G2-1LV76EA i5-7200U, HD Graphics 620 | Lenovo Miix 520-12IKB 20M3000LGE i5-8550U, UHD Graphics 620 | Dell Latitude 12 5285 2-in-1 i7-7600U, HD Graphics 620 | Asus Transformer 4 Pro (i7-7500U, HD620) i7-7500U, HD Graphics 620 | Microsoft Surface Pro (2017) i7 i7-7660U, Iris Plus Graphics 640 | Microsoft Surface Pro (2017) i5 i5-7300U, HD Graphics 620 | Average Intel UHD Graphics 620 | Average of class Convertible | |
|---|---|---|---|---|---|---|---|---|---|
| Power Consumption | -6% | 14% | 19% | 34% | -7% | 22% | 5% | -26% | |
| Idle Minimum * | 4.9 | 4.1 16% | 3.9 20% | 2.85 42% | 3.4 31% | 4.2 14% | 3.6 27% | 3.81 ? 22% | 5.44 ? -11% |
| Idle Average * | 8.9 | 9.2 -3% | 8.2 8% | 6.76 24% | 5.7 36% | 10.1 -13% | 8.1 9% | 6.94 ? 22% | 8.27 ? 7% |
| Idle Maximum * | 11 | 11.1 -1% | 8.4 24% | 6.91 37% | 7.4 33% | 14 -27% | 8.7 21% | 8.75 ? 20% | 10.8 ? 2% |
| Load Average * | 32 | 33.8 -6% | 25.2 21% | 32.88 -3% | 15 53% | 37.4 -17% | 25.5 20% | 35 ? -9% | 46.7 ? -46% |
| Load Maximum * | 36 | 49.2 -37% | 37 -3% | 37.41 -4% | 29.7 17% | 34 6% | 23.5 35% | 47.5 ? -32% | 65.4 ? -82% |
| Witcher 3 ultra * | 38.1 |
* ... smaller is better
| HP Elite x2 1013 G3-2TT14EA i5-8350U, UHD Graphics 620, 50 Wh | HP Elite x2 1012 G2-1LV76EA i5-7200U, HD Graphics 620, 47 Wh | Lenovo Miix 520-12IKB 20M3000LGE i5-8550U, UHD Graphics 620, 38 Wh | Dell Latitude 12 5285 2-in-1 i7-7600U, HD Graphics 620, 42 Wh | Asus Transformer 4 Pro (i7-7500U, HD620) i7-7500U, HD Graphics 620, 39 Wh | Microsoft Surface Pro (2017) i7 i7-7660U, Iris Plus Graphics 640, 45 Wh | Microsoft Surface Pro (2017) i5 i5-7300U, HD Graphics 620, 45 Wh | Average of class Convertible | |
|---|---|---|---|---|---|---|---|---|
| Battery Runtime | -3% | -27% | 7% | -15% | 16% | 40% | 38% | |
| Reader / Idle | 781 | 833 7% | 1075 38% | 842 8% | 1054 35% | 1112 ? 42% | ||
| H.264 | 389 | 377 -3% | 614 58% | 769 ? 98% | ||||
| WiFi v1.3 | 459 | 378 -18% | 334 -27% | 486 6% | 280 -39% | 489 7% | 744 62% | 567 ? 24% |
| Load | 137 | 138 1% | 105 -23% | 118 -14% | 112 -18% | 168 23% | 121.7 ? -11% | |
| Witcher 3 ultra | 115 | 90 ? |
För
Emot
Läs den fullständiga versionen av den här recensionen på engelska här.
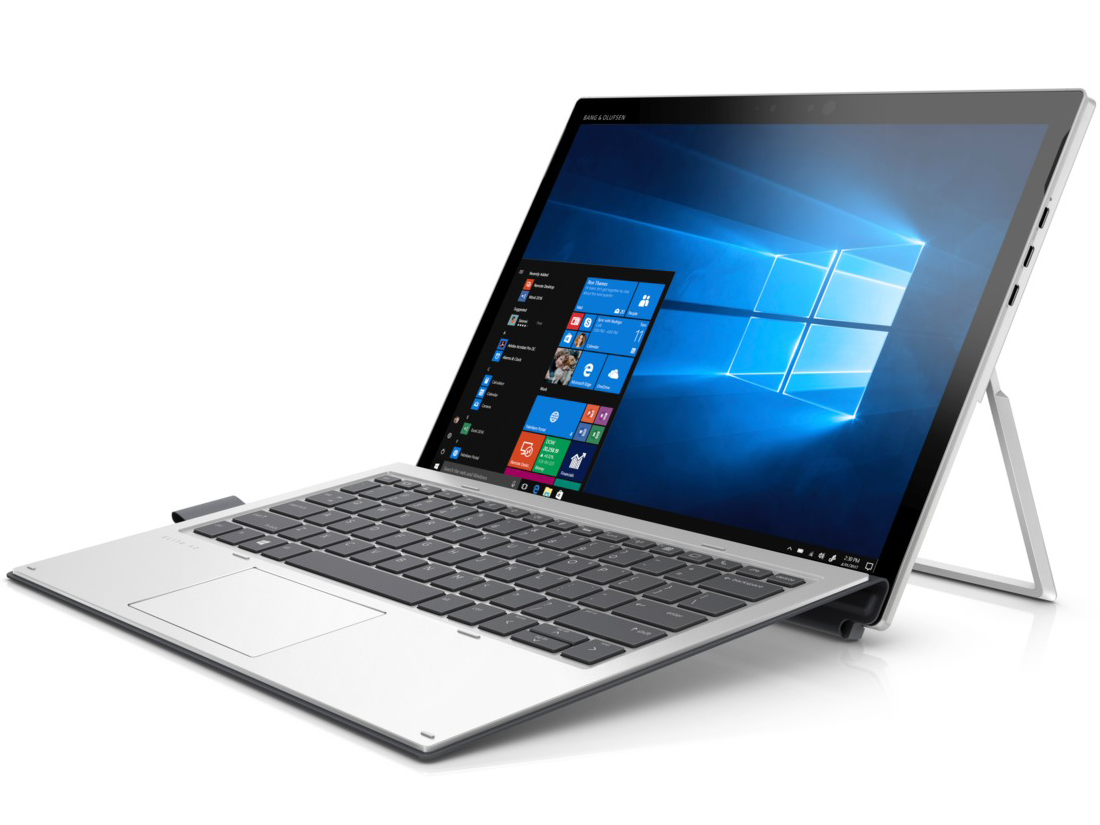
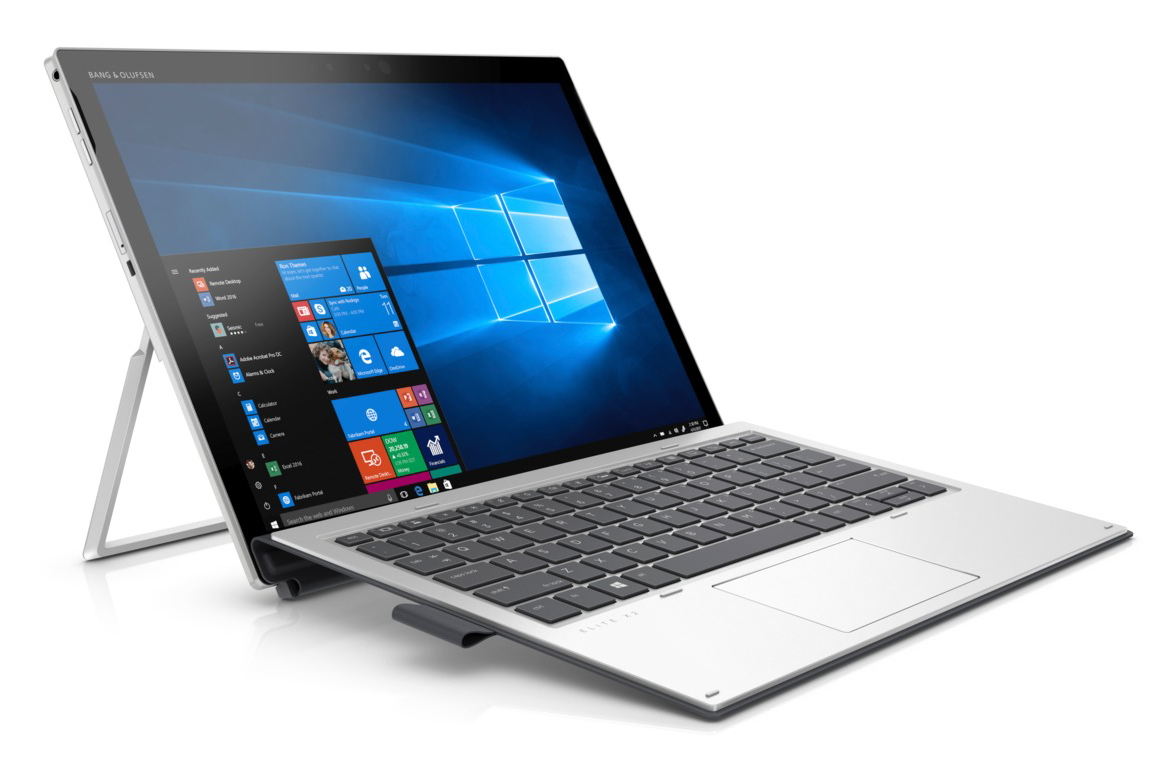
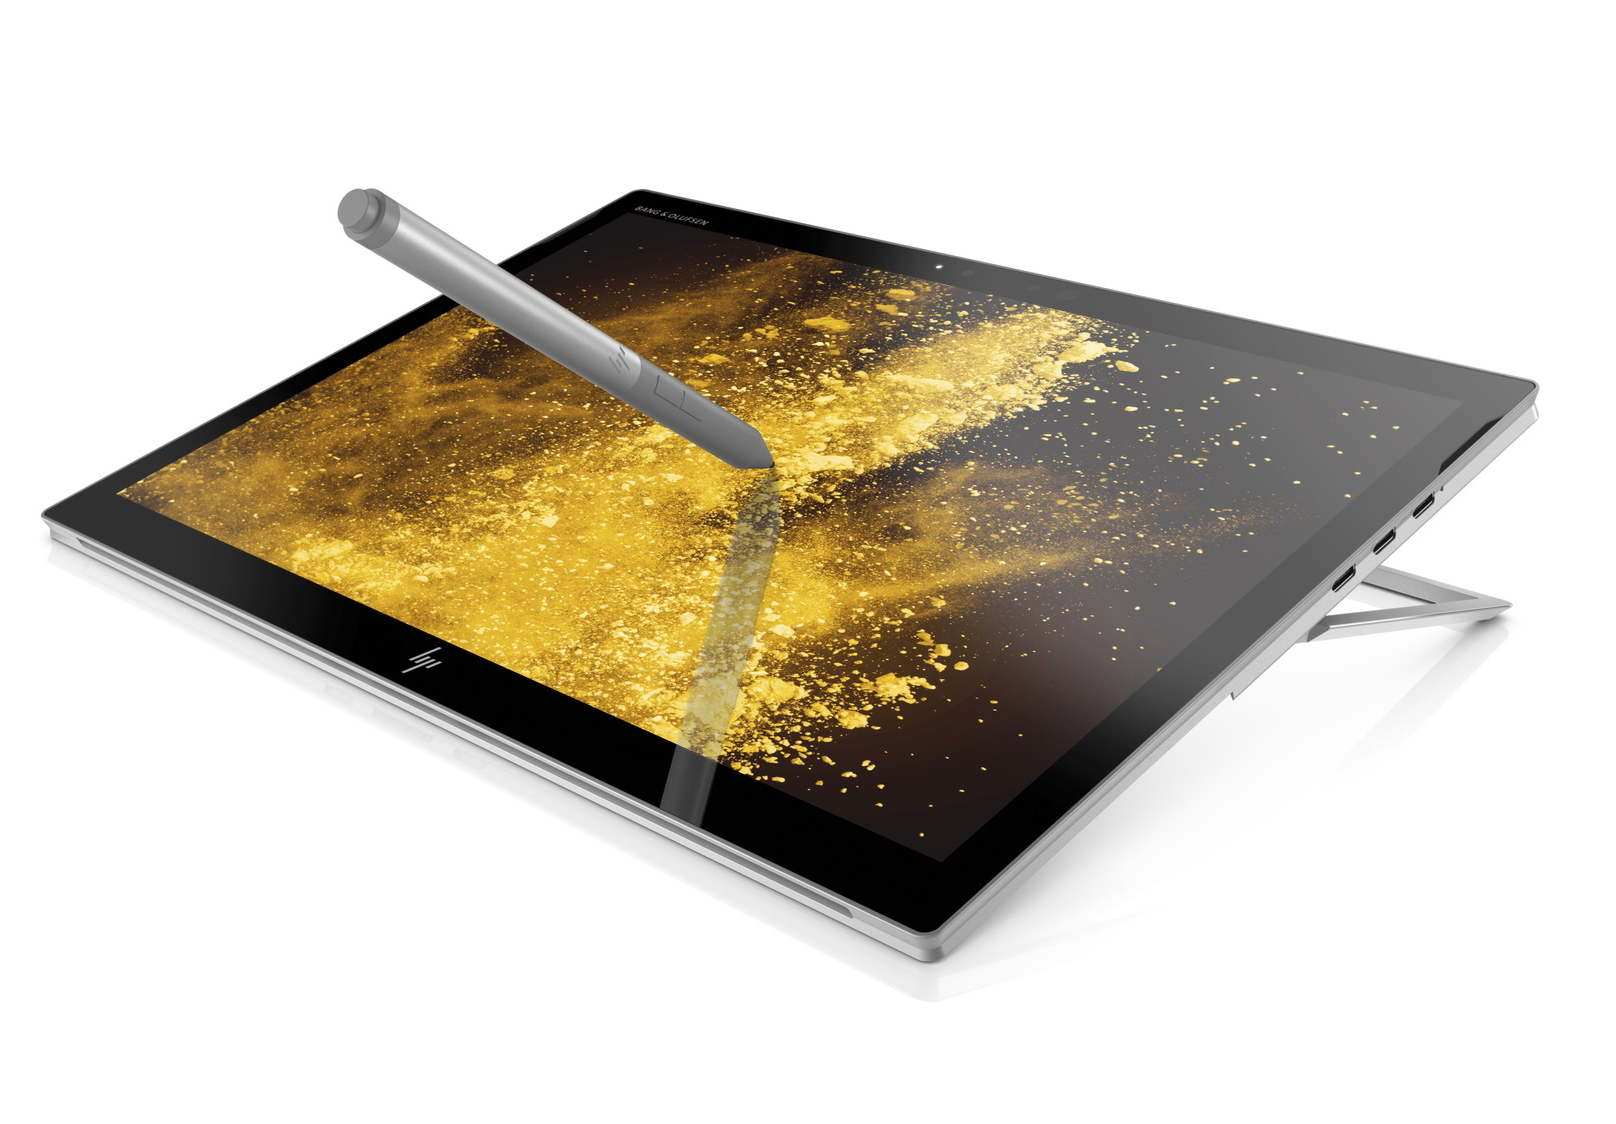
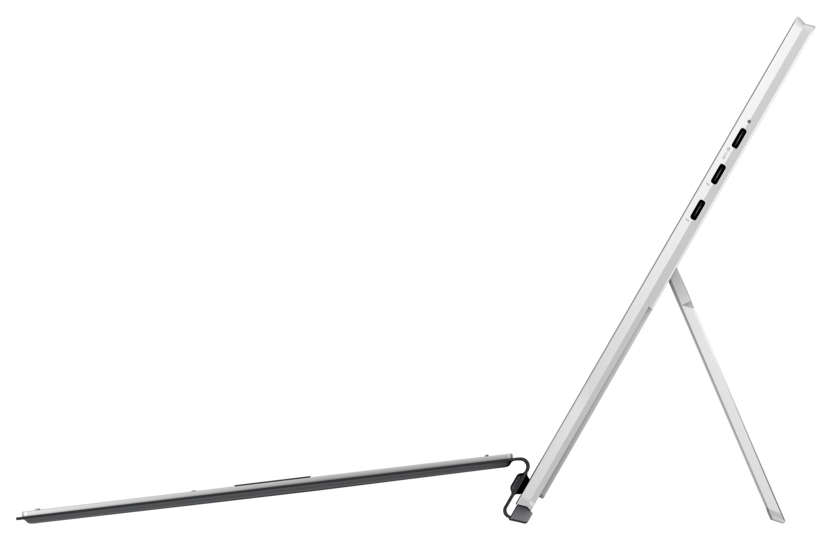
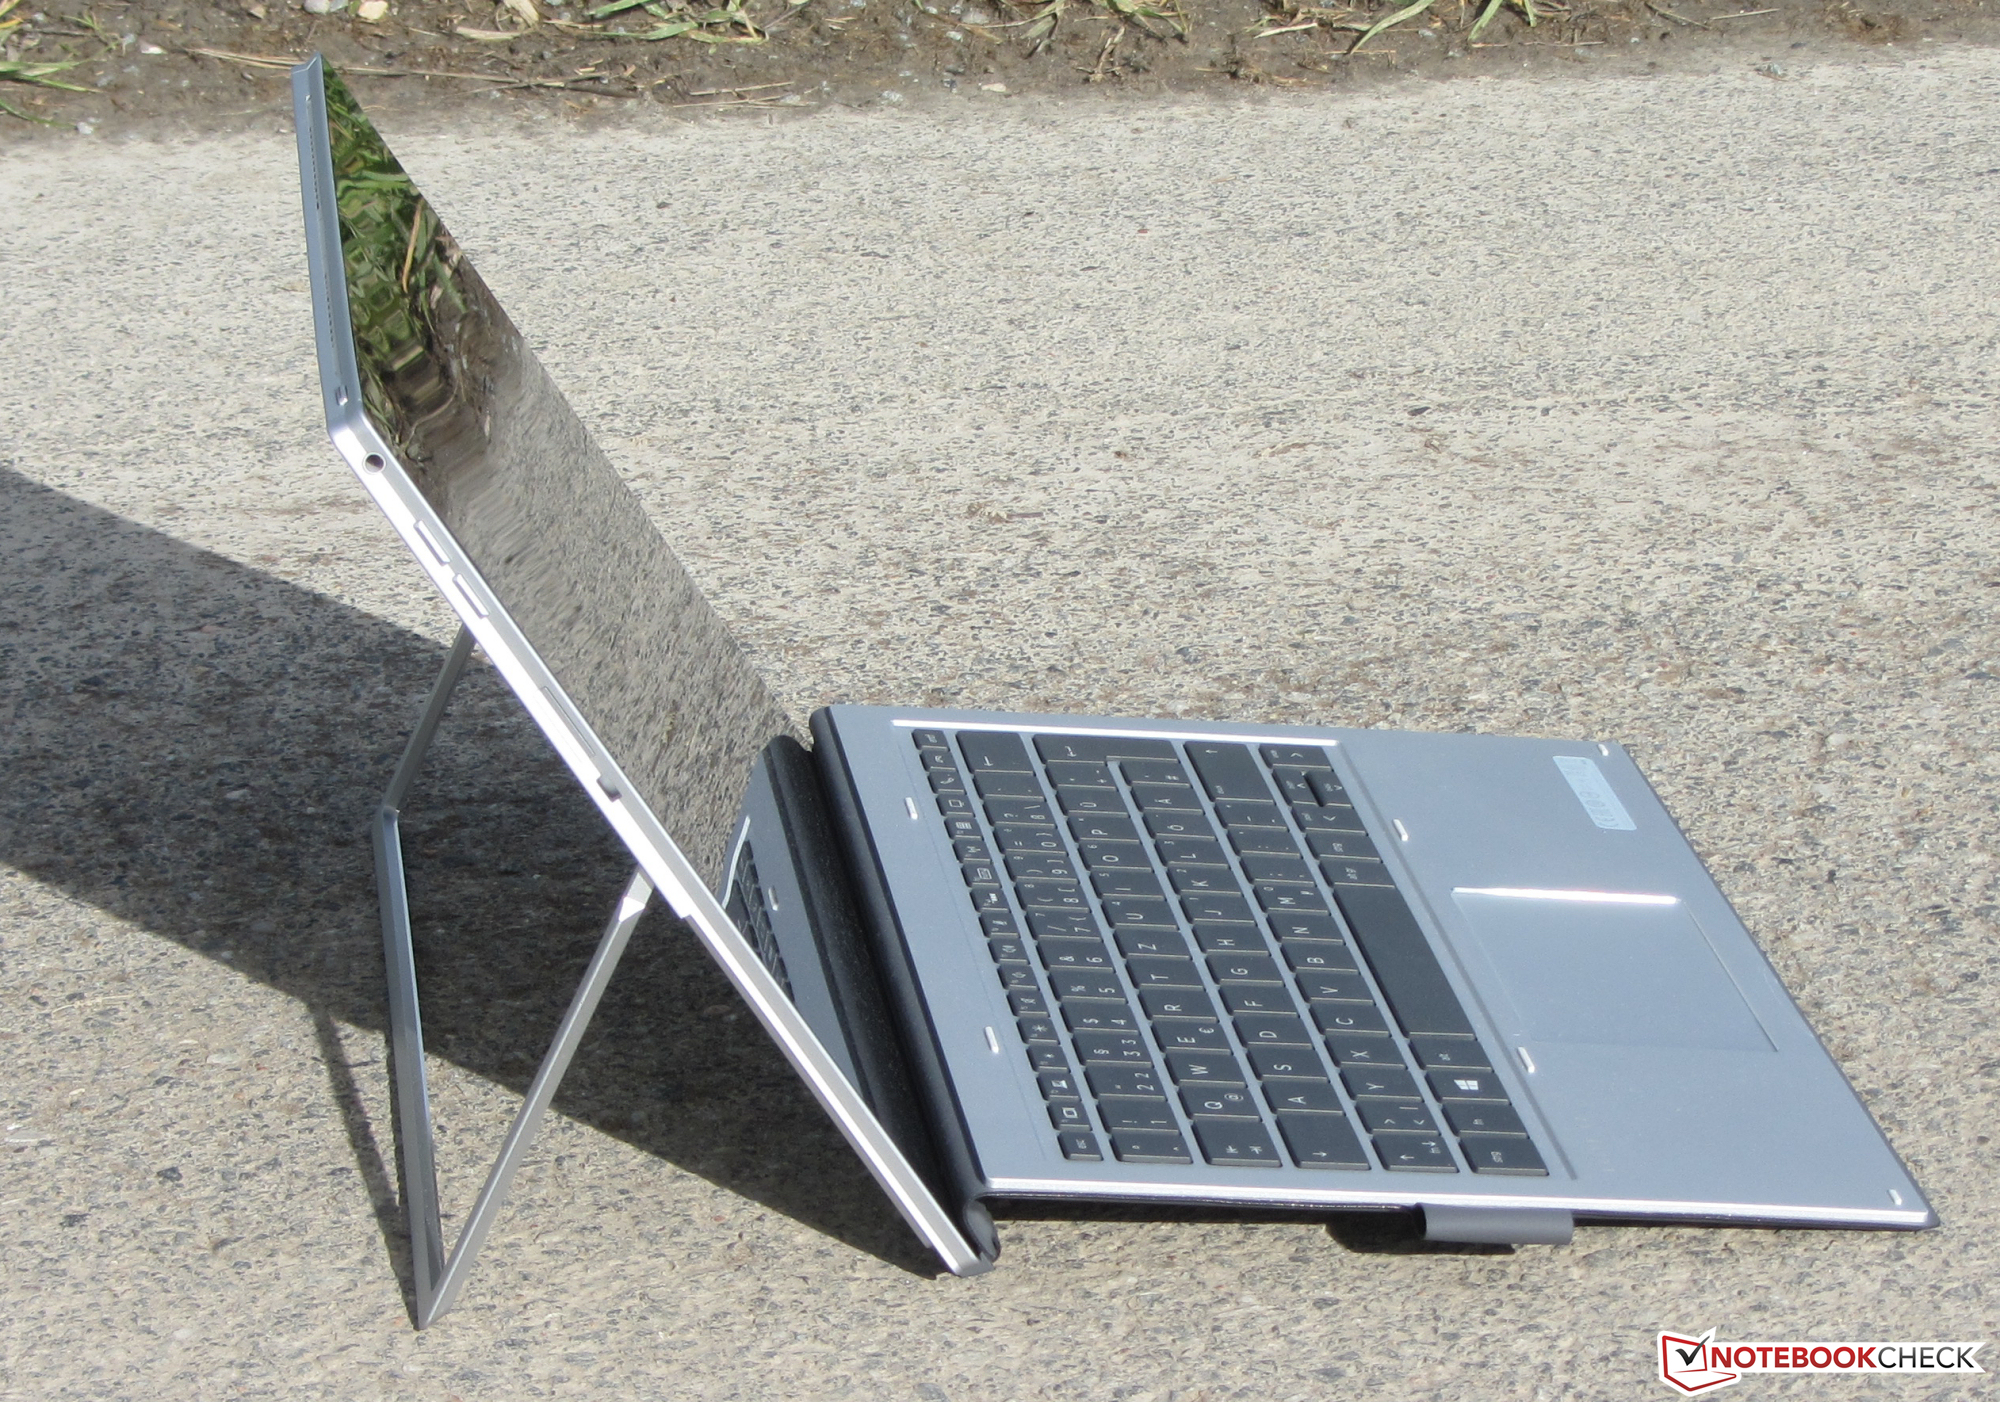
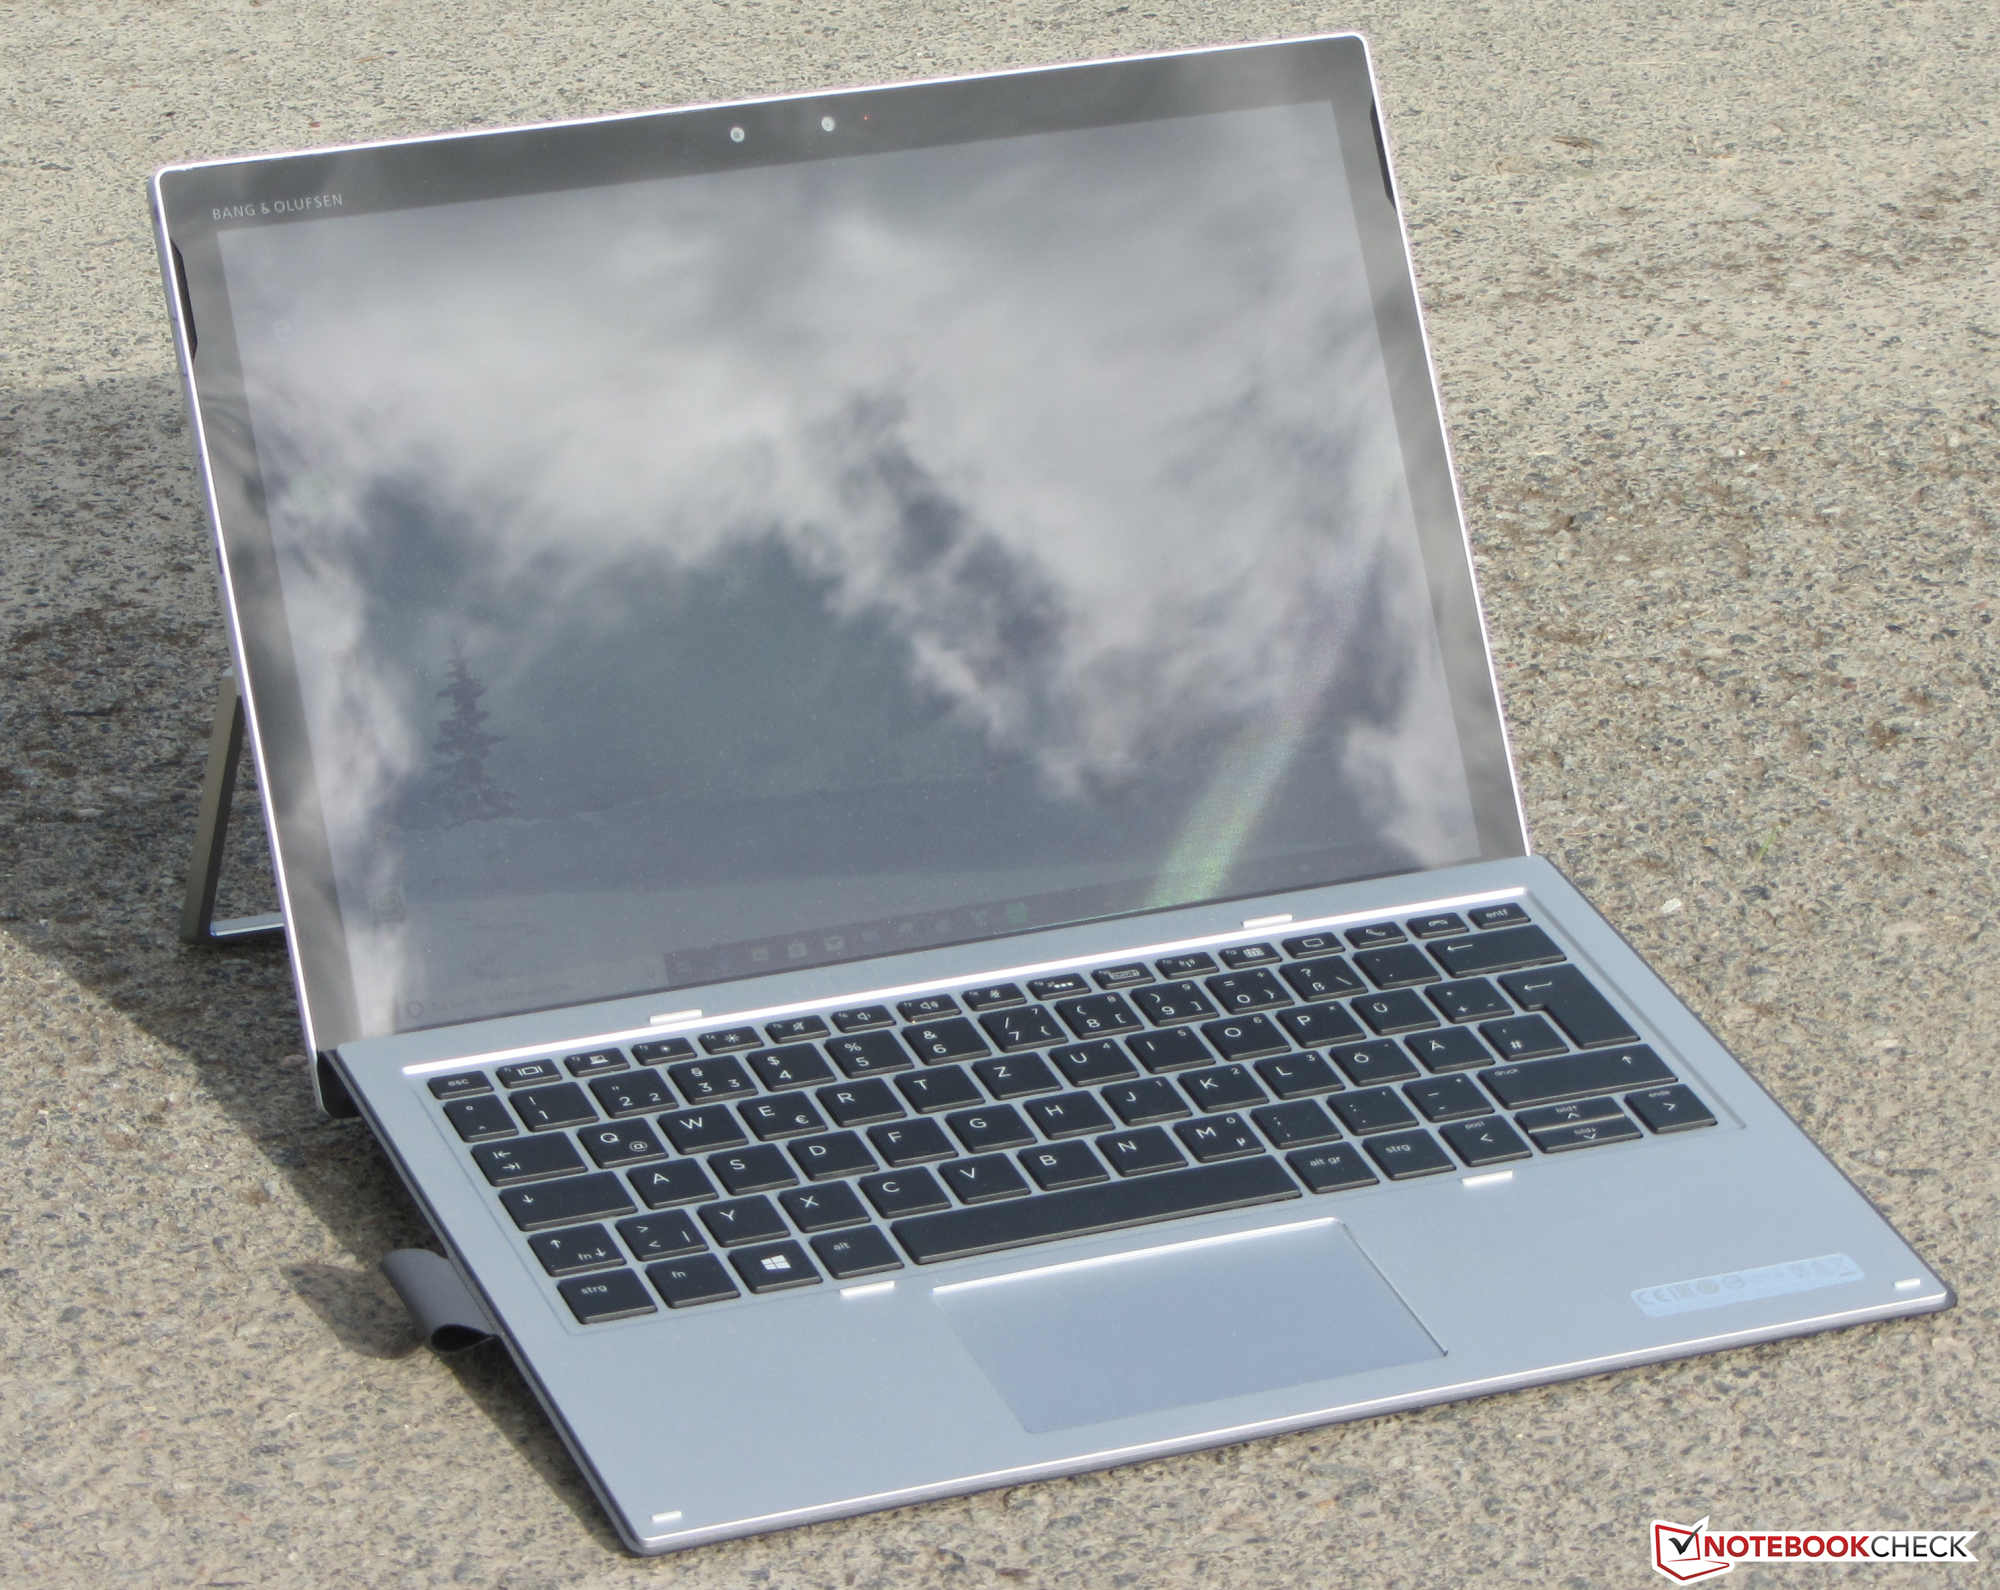
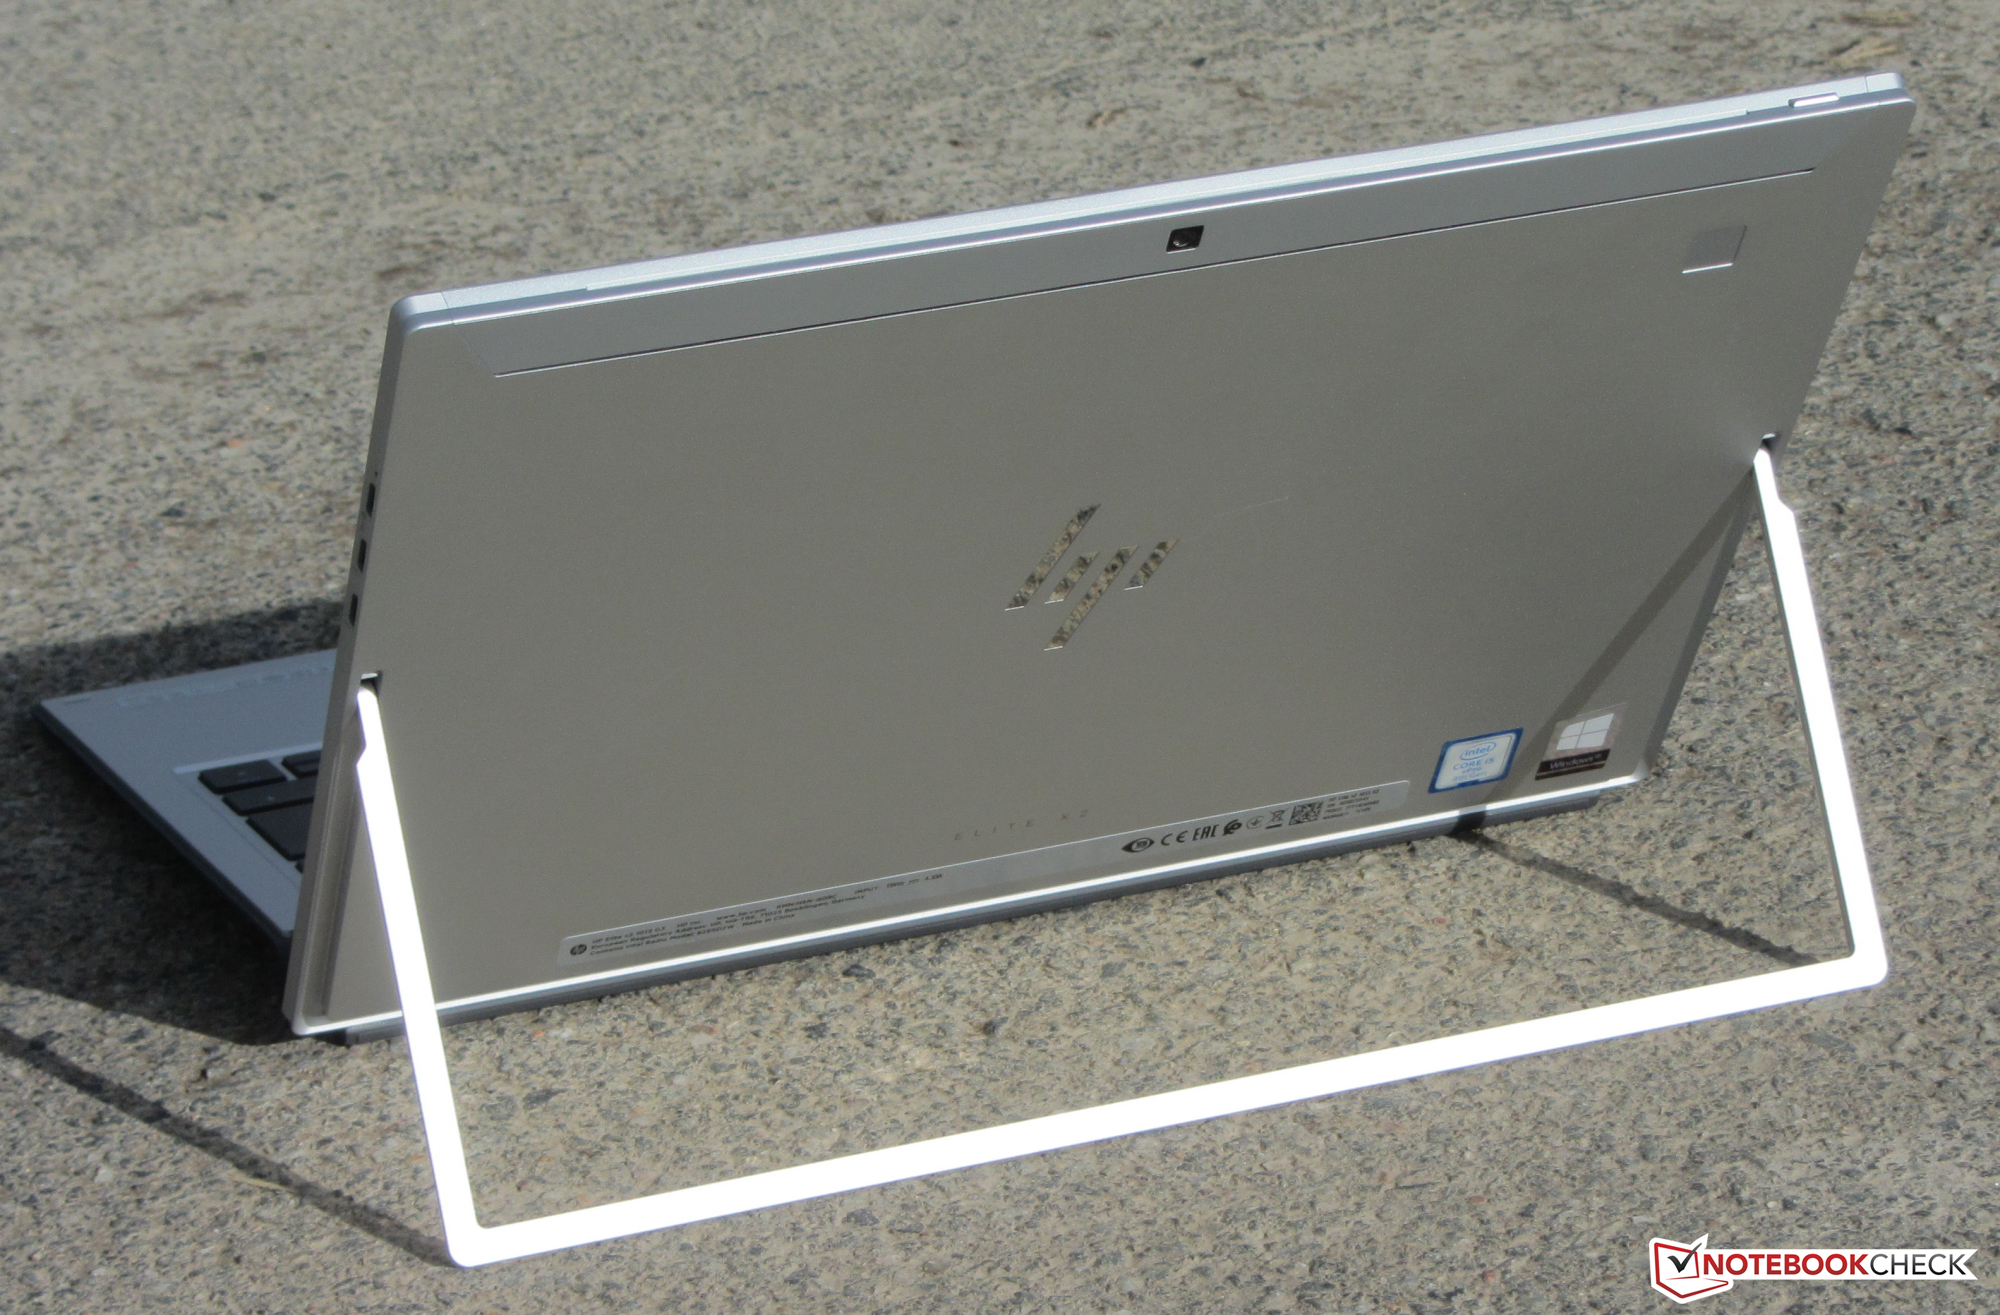
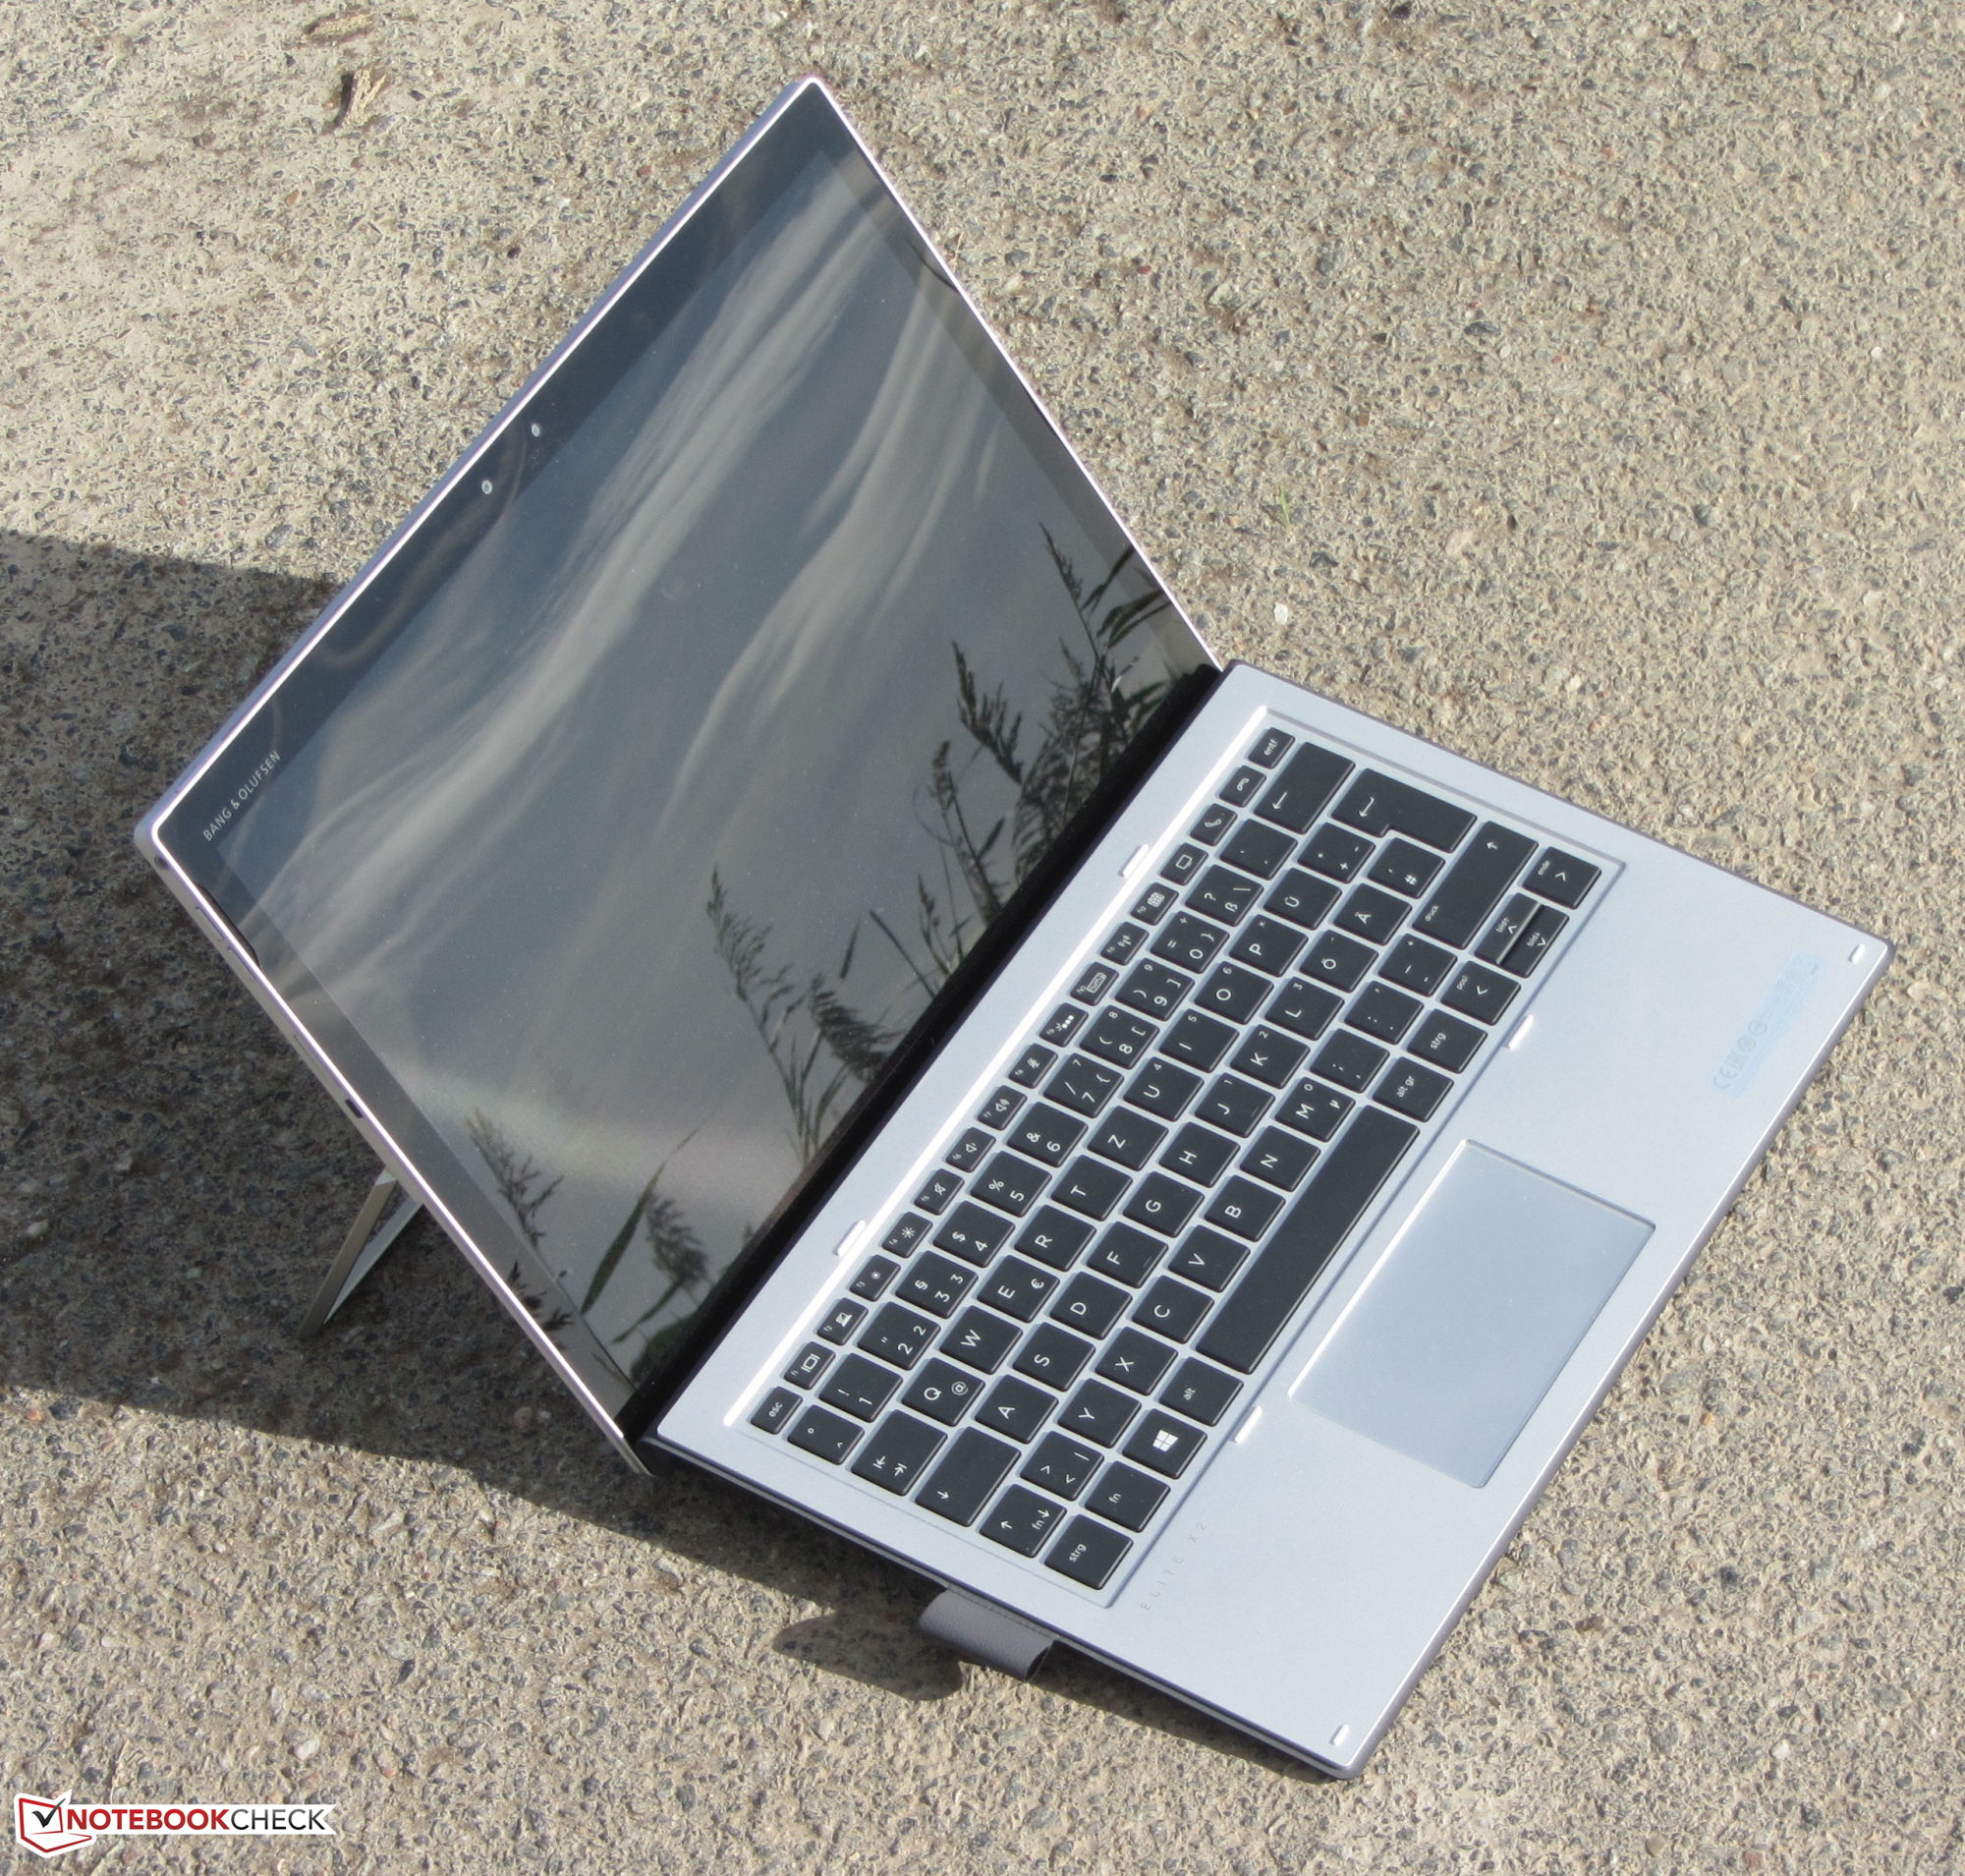
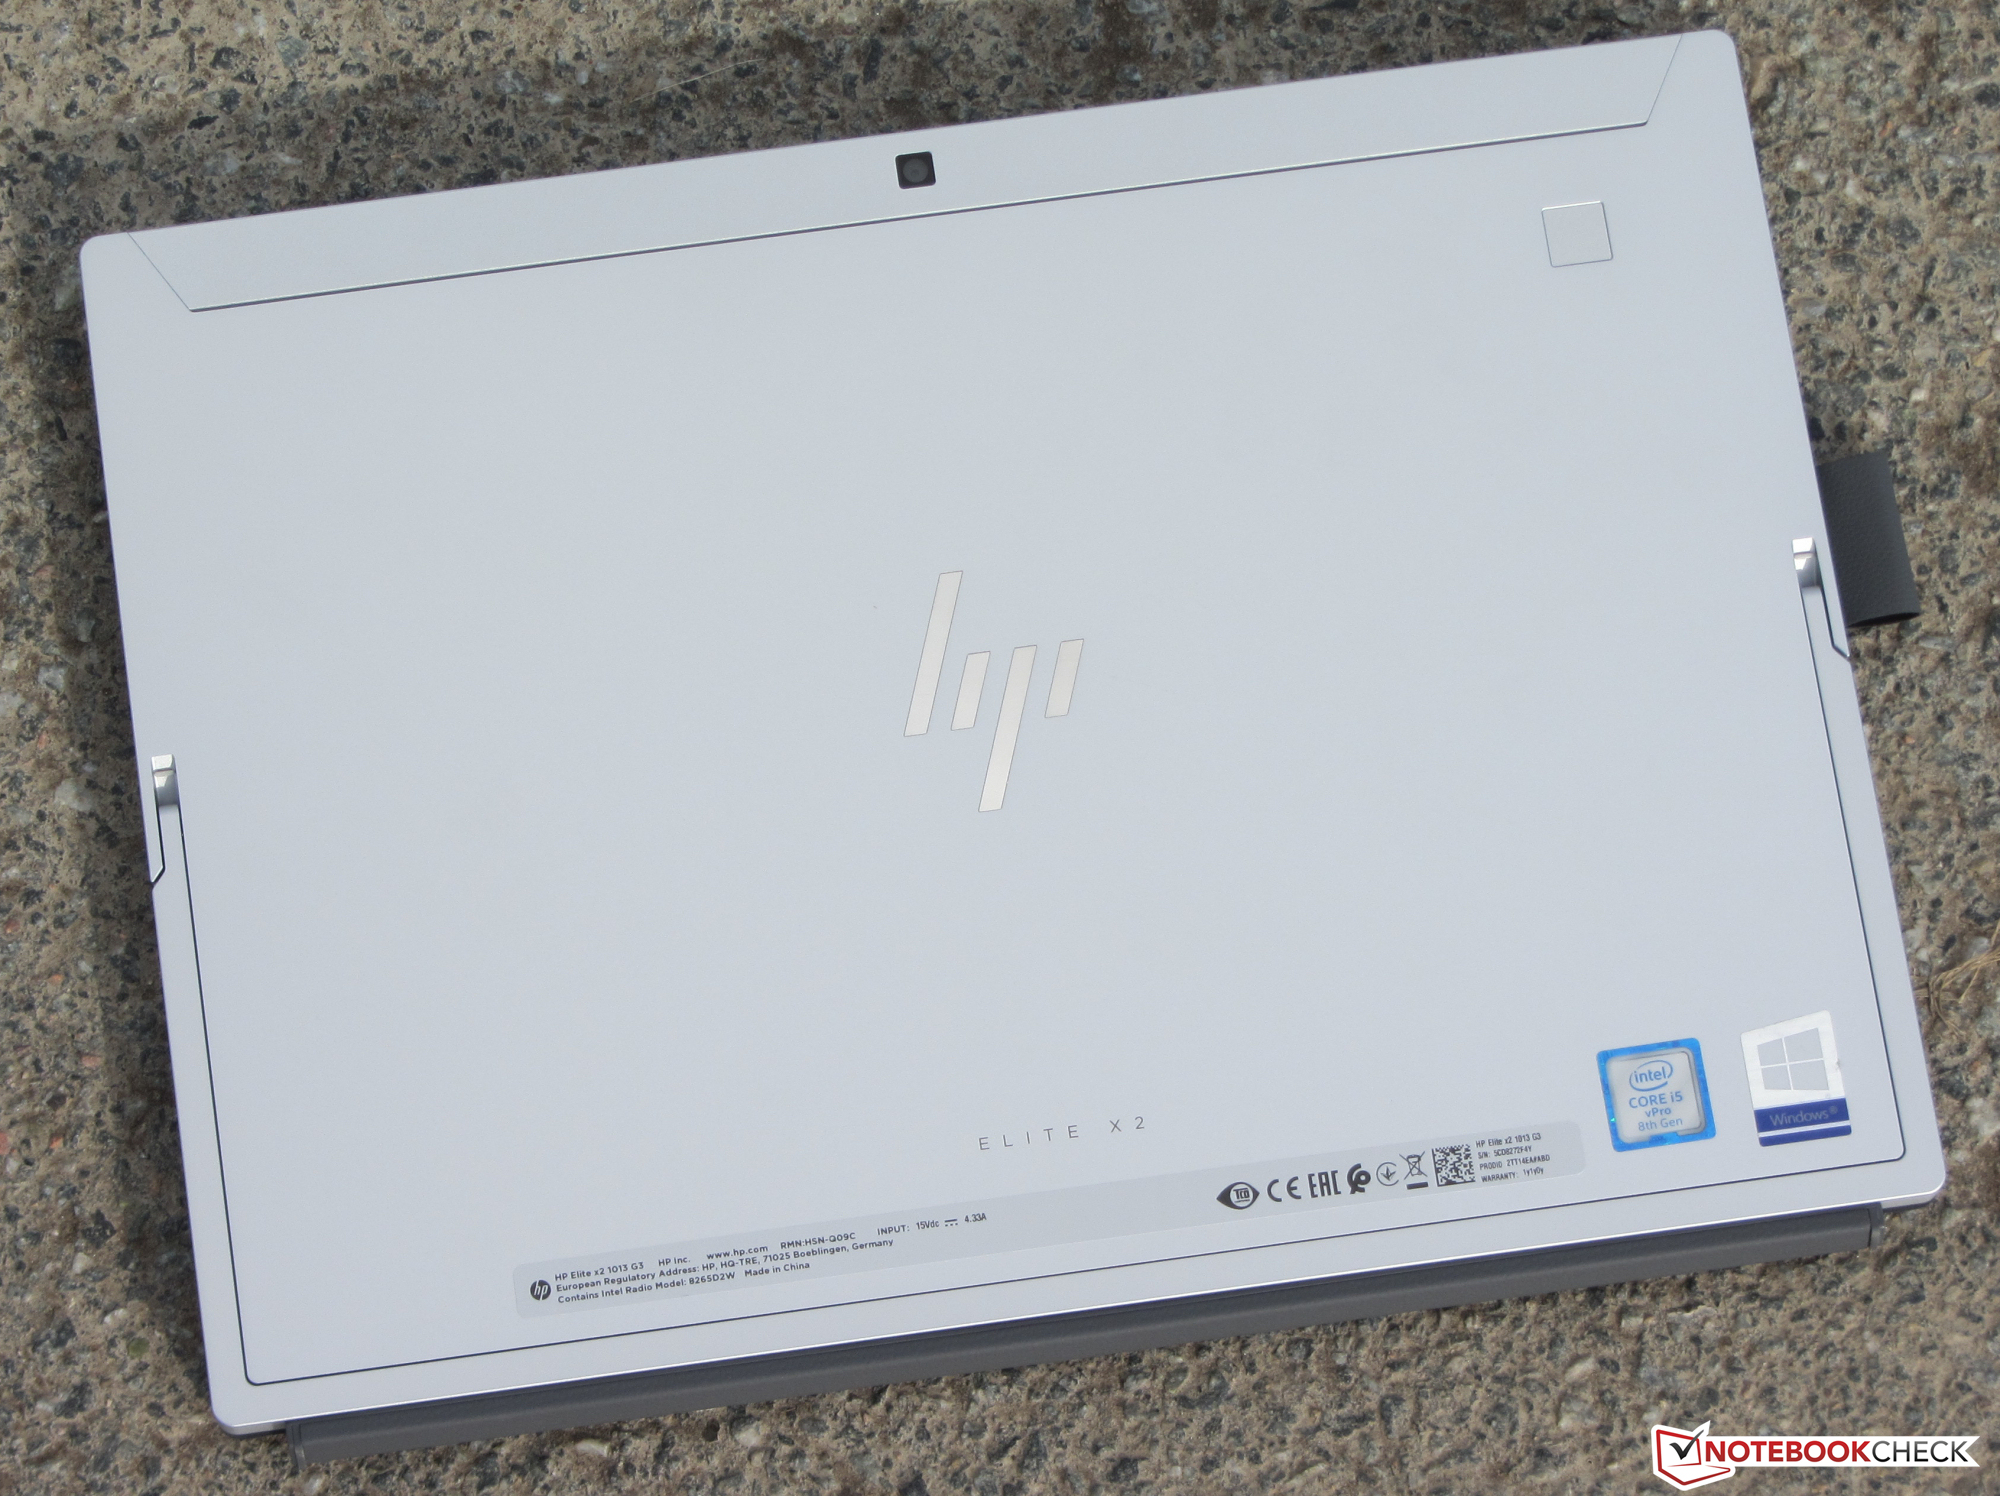
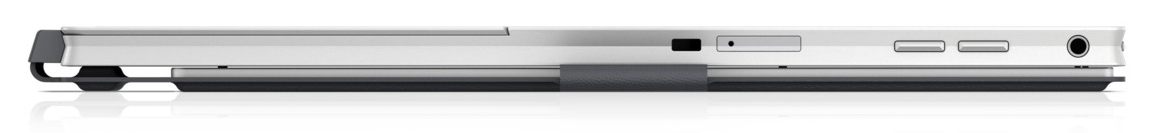
HP:s Elite x2 1013 G3 är en 2-i-1 enhet på 13 tum i huvudsak riktad åt företagskunder. Den efterföljer Elite x2 1012 G2. Med tanke på att 1013 G3 är helt omgjord så har dessa två inte mycket gemensamt. Subjektivt känns den nya enheten smidigare och tunnare än sin föregångare.
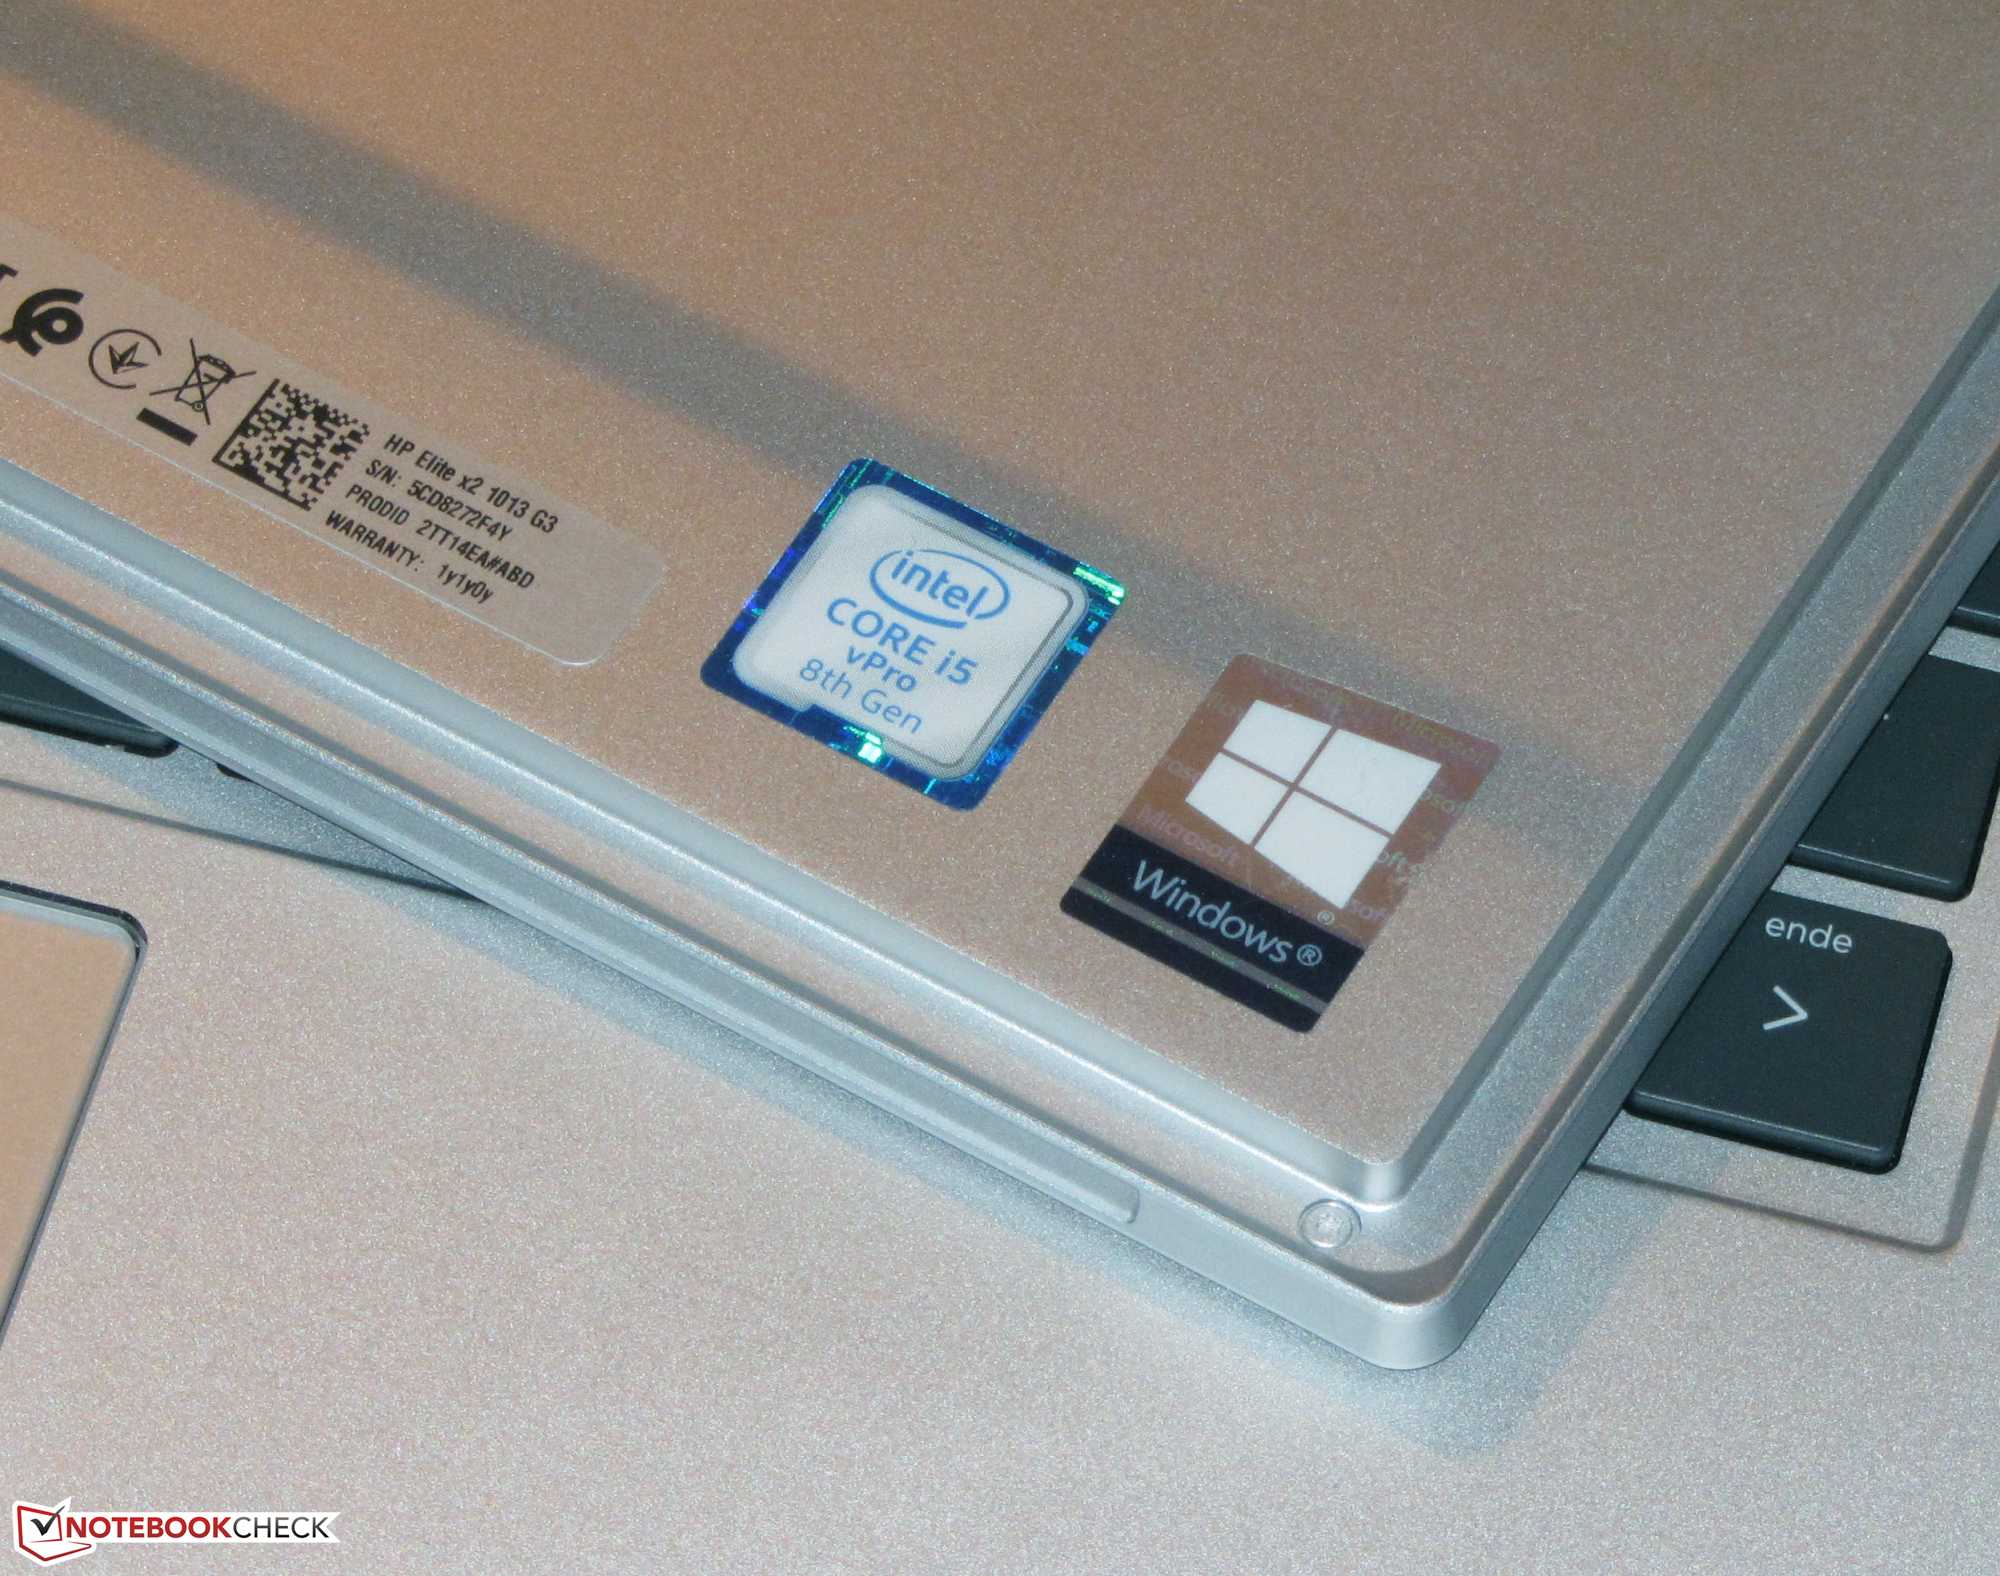
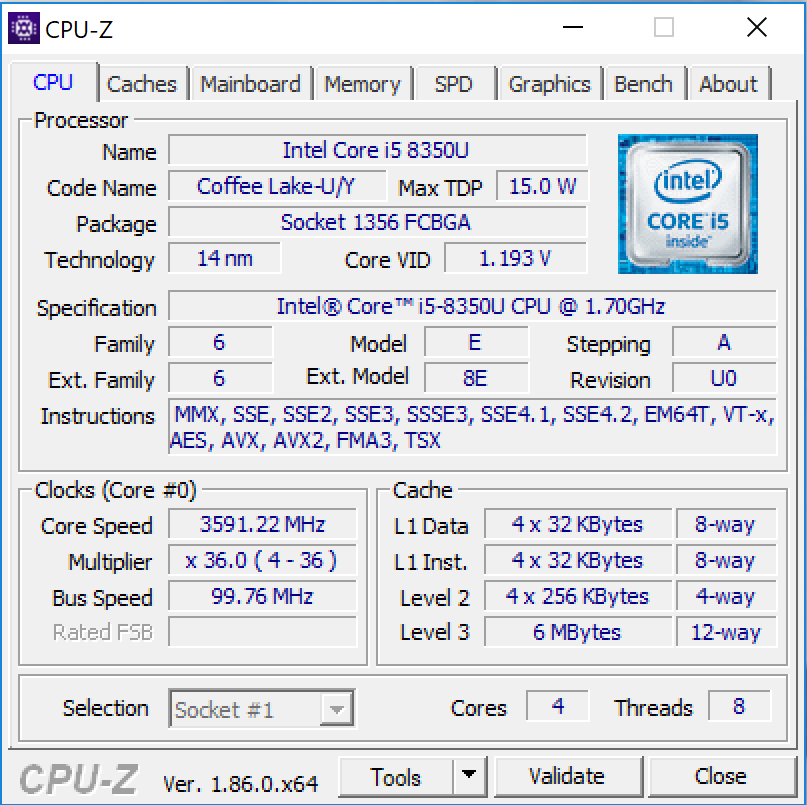
Den drivs av en Core i5-8350U CPU som har mer än tillräckligt med prestanda för vardagligt kontors- och internetarbete. Enheten höll sig väldigt tyst oavsett belastning och var dessutom ganska sval vid vardagsanvändning. Den är riktigt snabb tack vare en NVMe SSD. SSD-enheten kan bytas ut.
HP:s Elite x2 1013 G3 är en välgjord 2-i-1 enhet. Vi hittade bara ett fåtal saker att kritisera. Vi hade bland annat förväntat oss ett LTE-modem med tanke på enhetens höga pris på nästan 20.000 kronor.
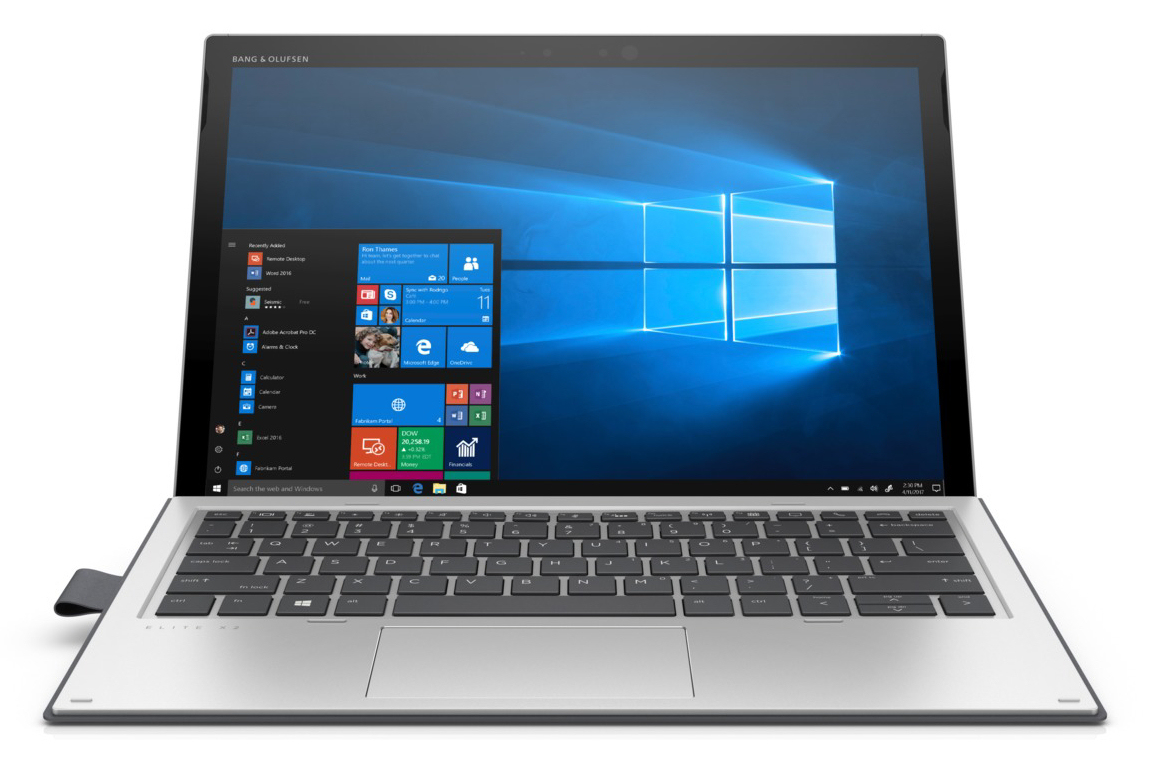
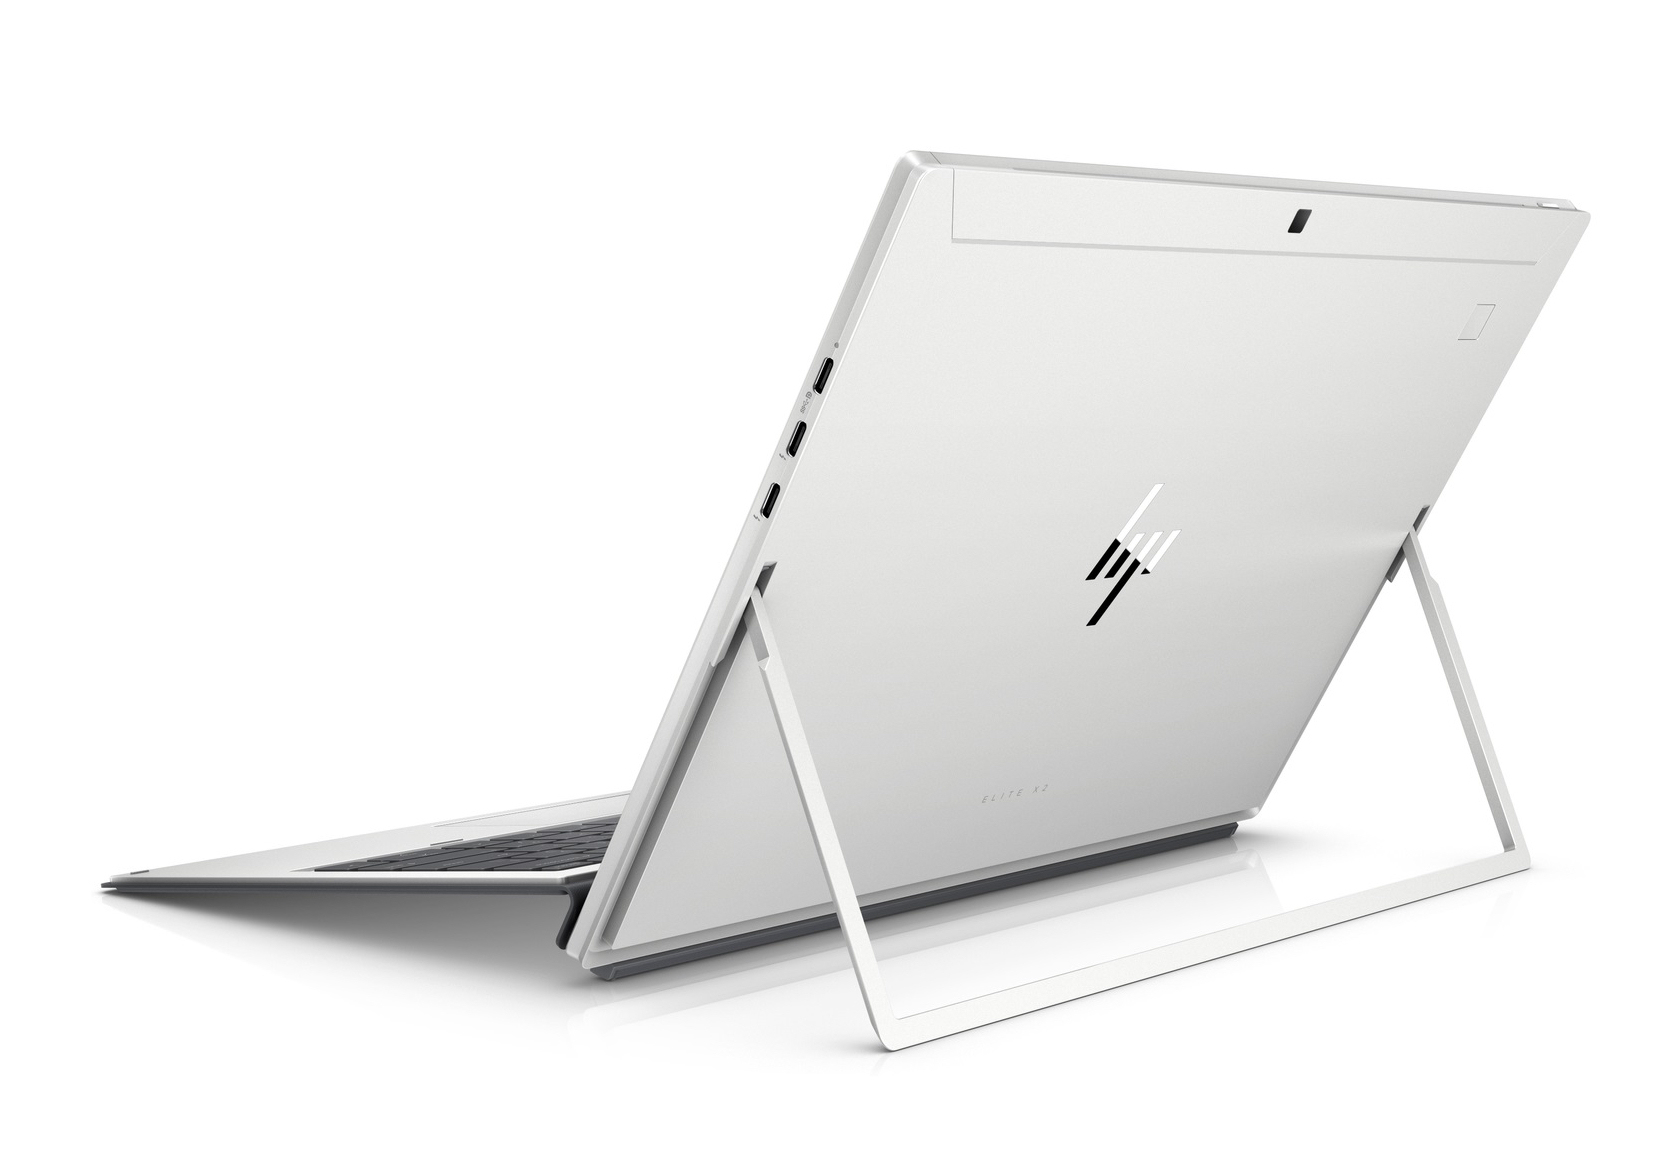
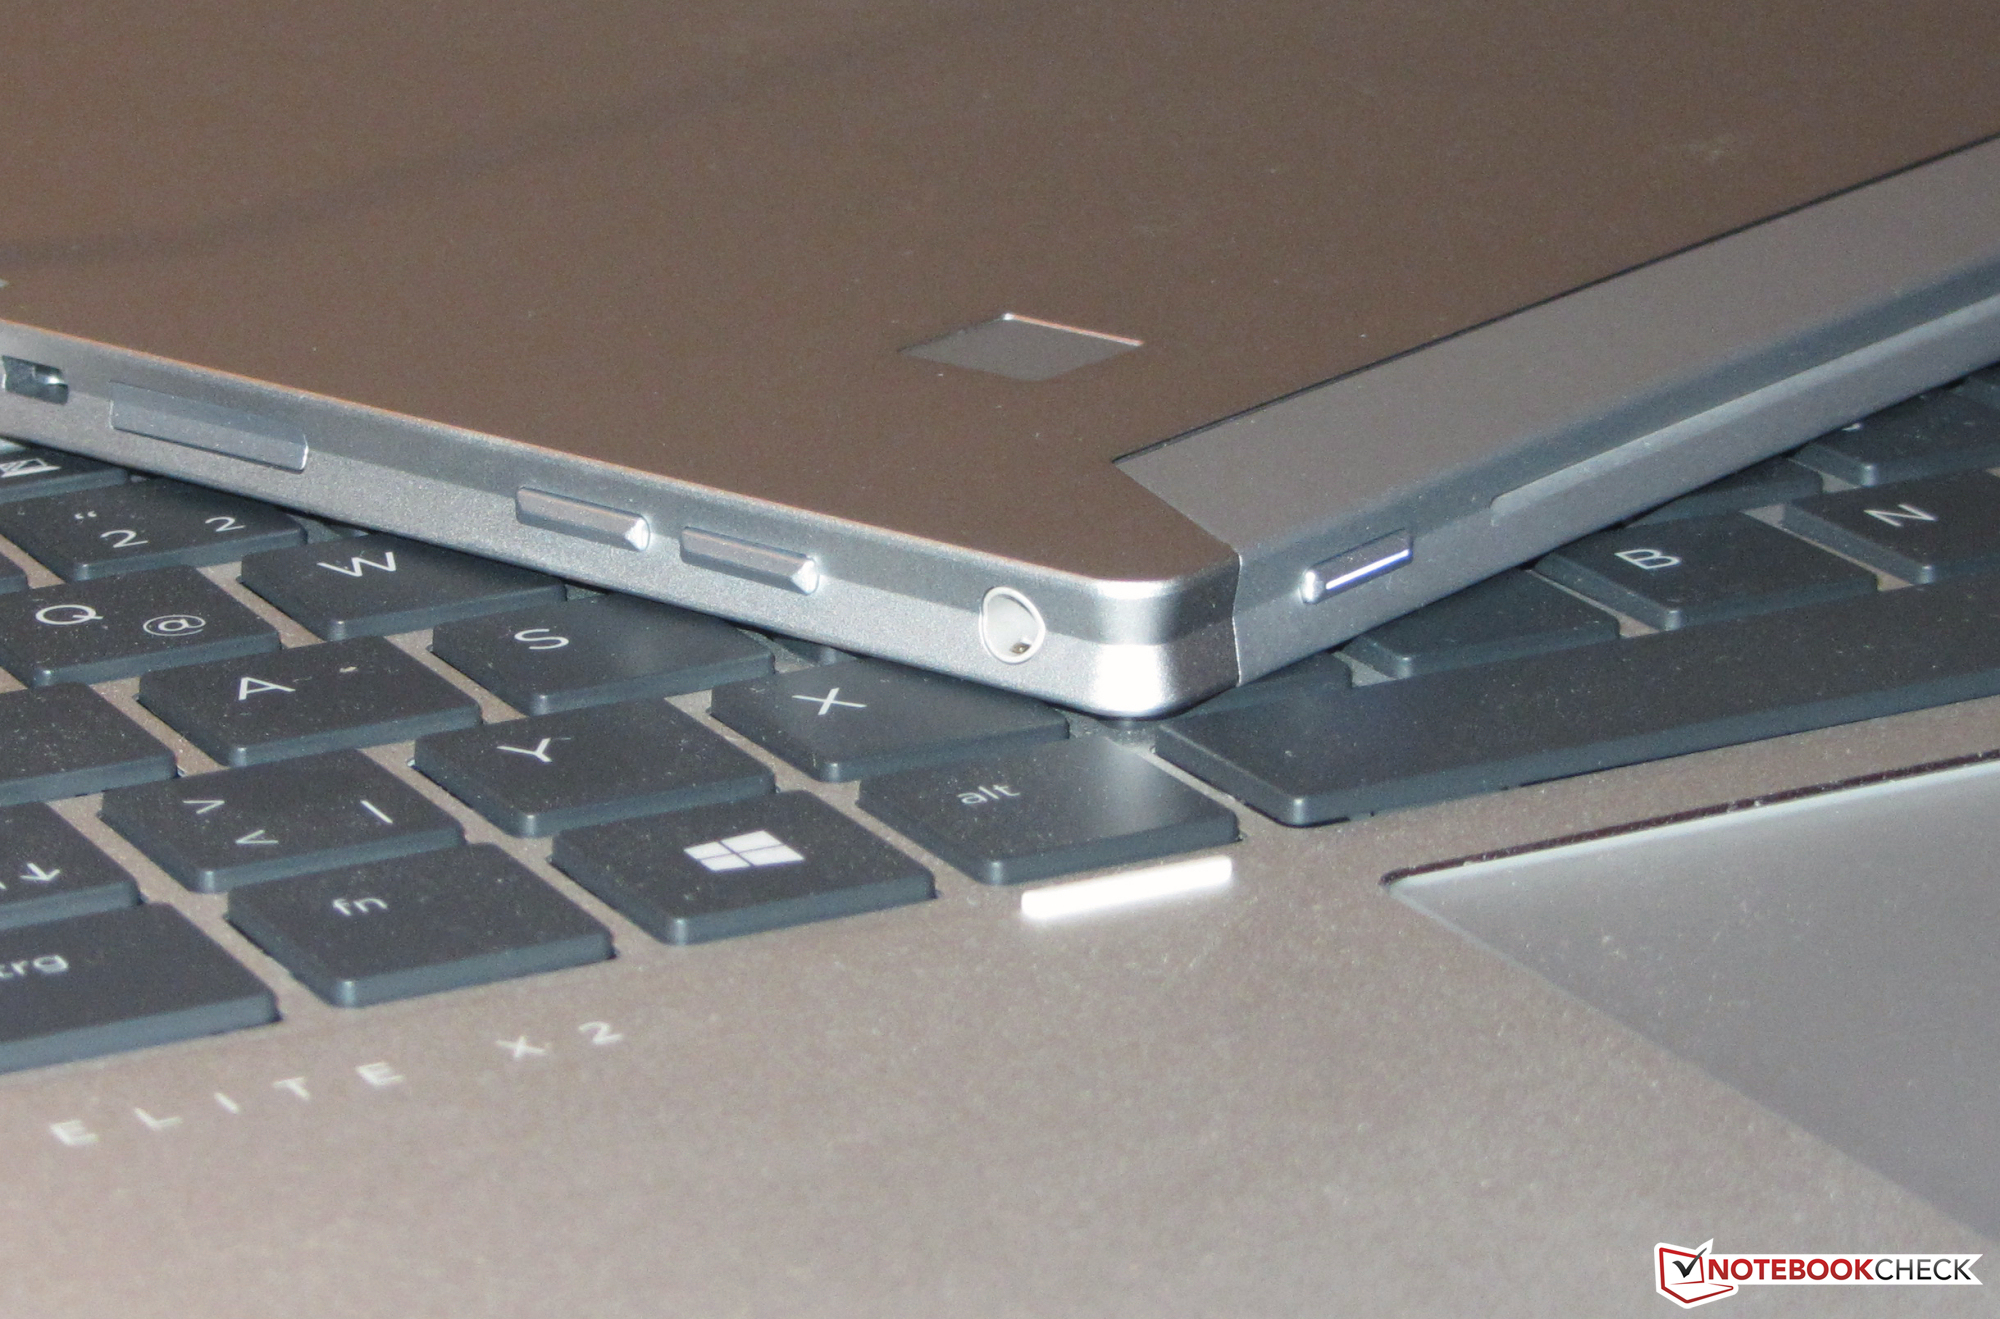
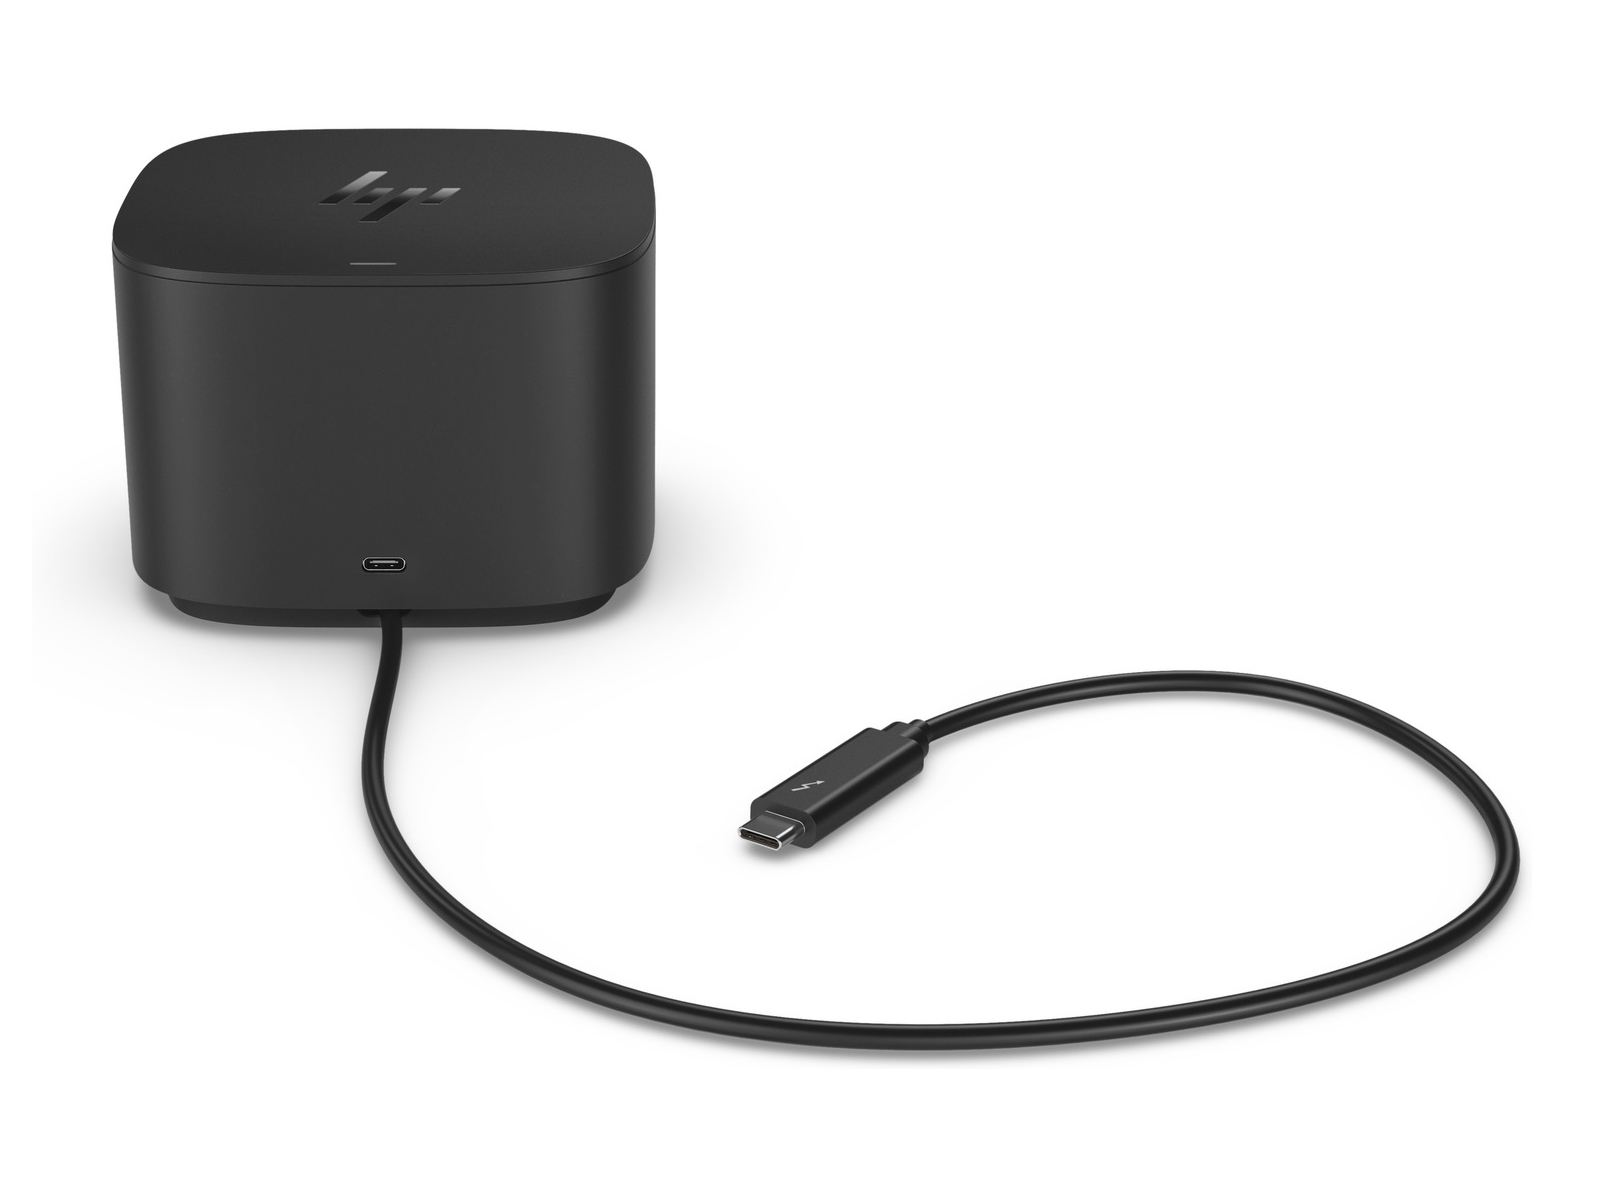
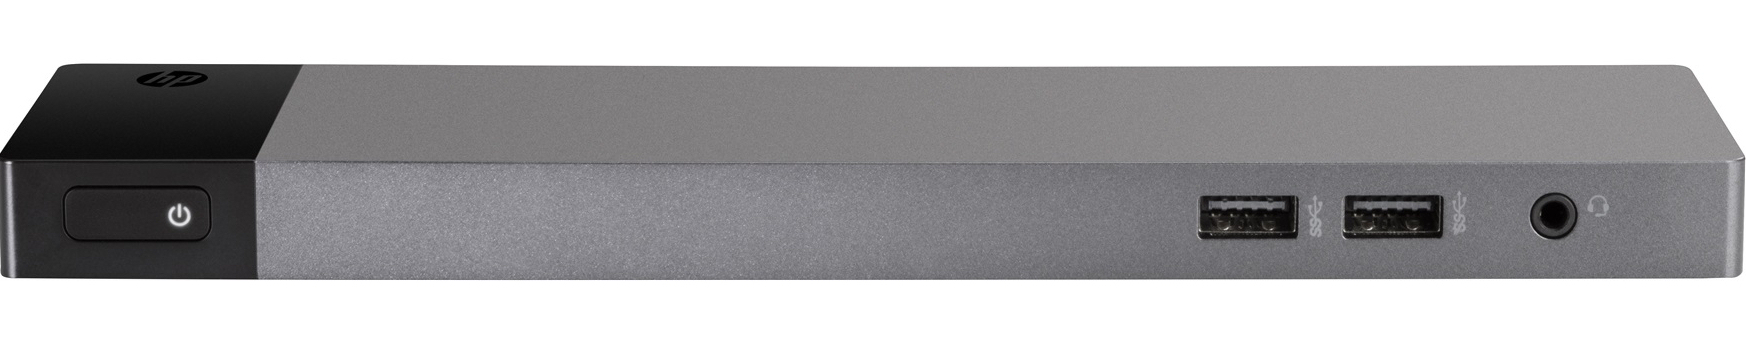
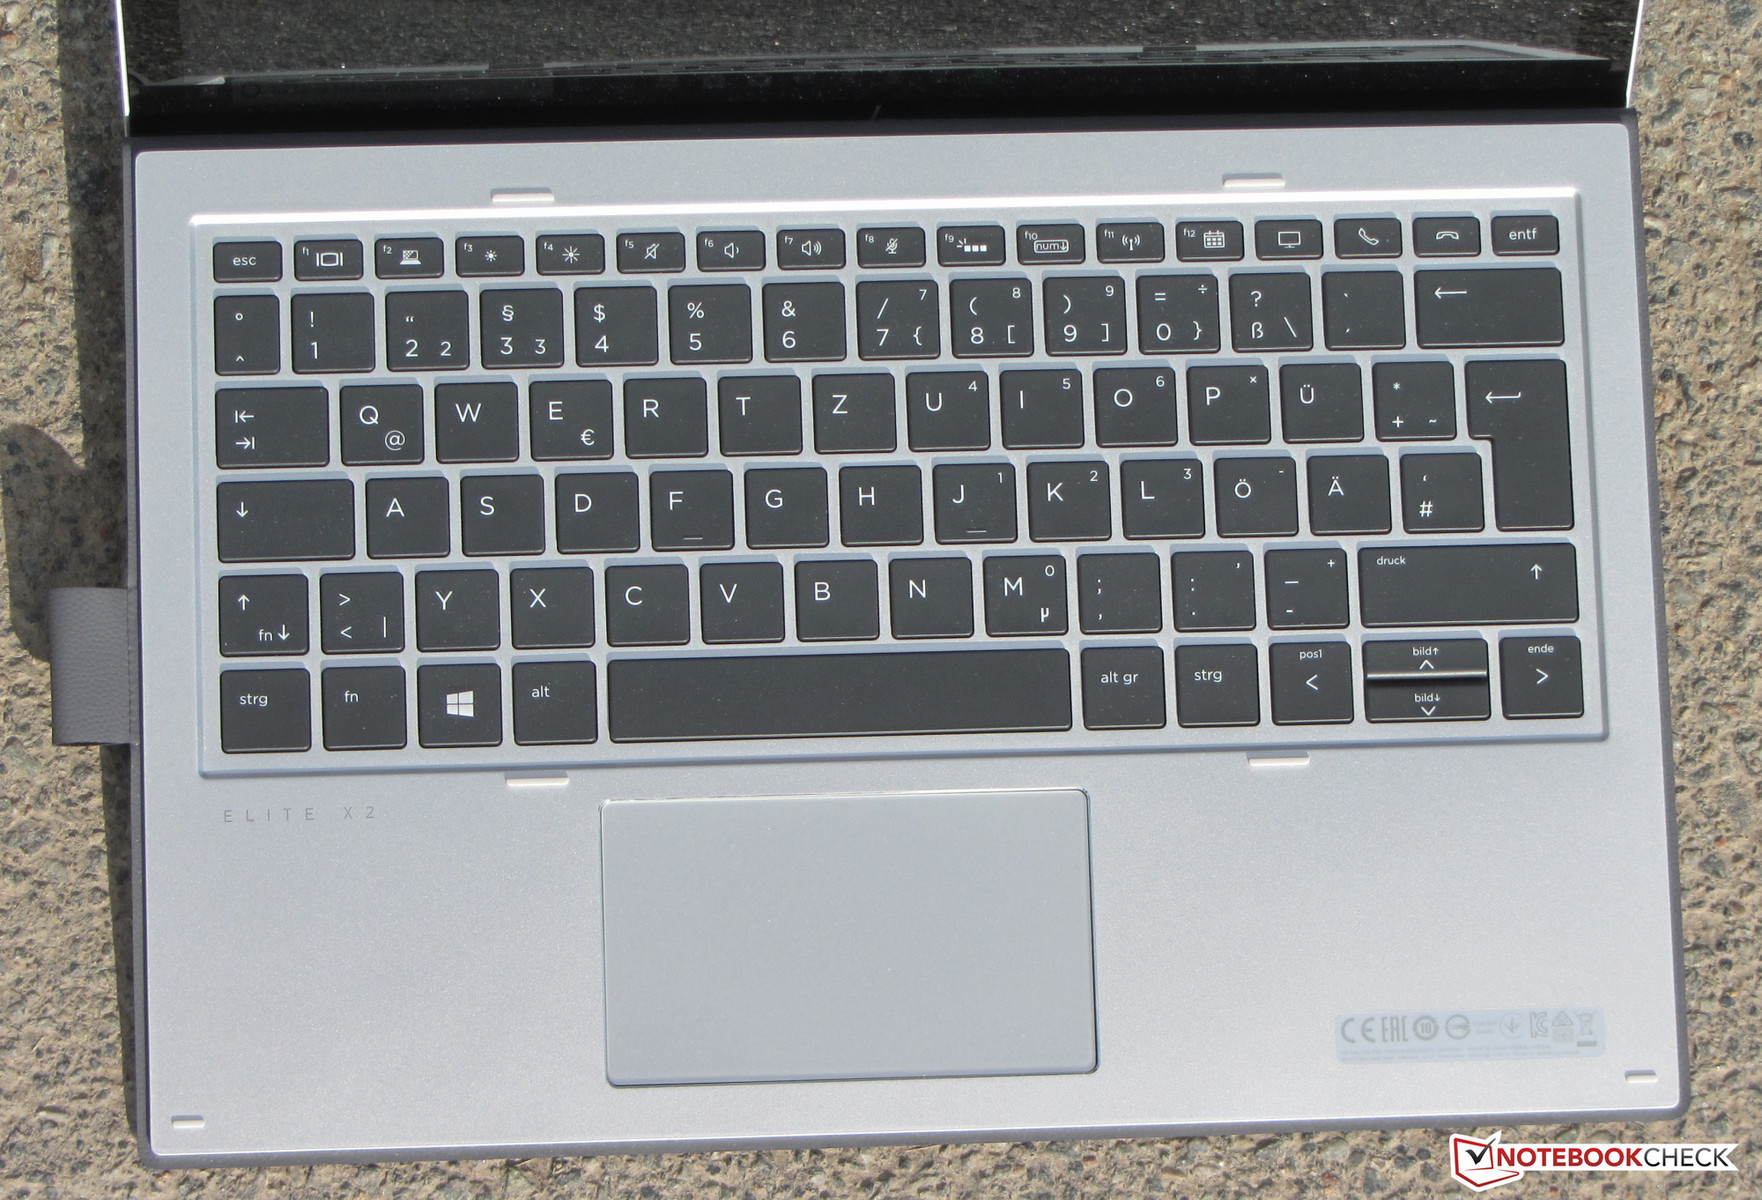
Den inkluderade tangentbordsdockan gjorde ett riktigt bra jobb. Tangentbordet gjorde det möjligt att skriva snabbt och smidigt och det lämpade sig både för kortare och längre skrivsessioner. Dessutom var det bakgrundsbelyst. Batteritiden var skaplig. Surface Pro (2017) hade mer att ge på den punkten.
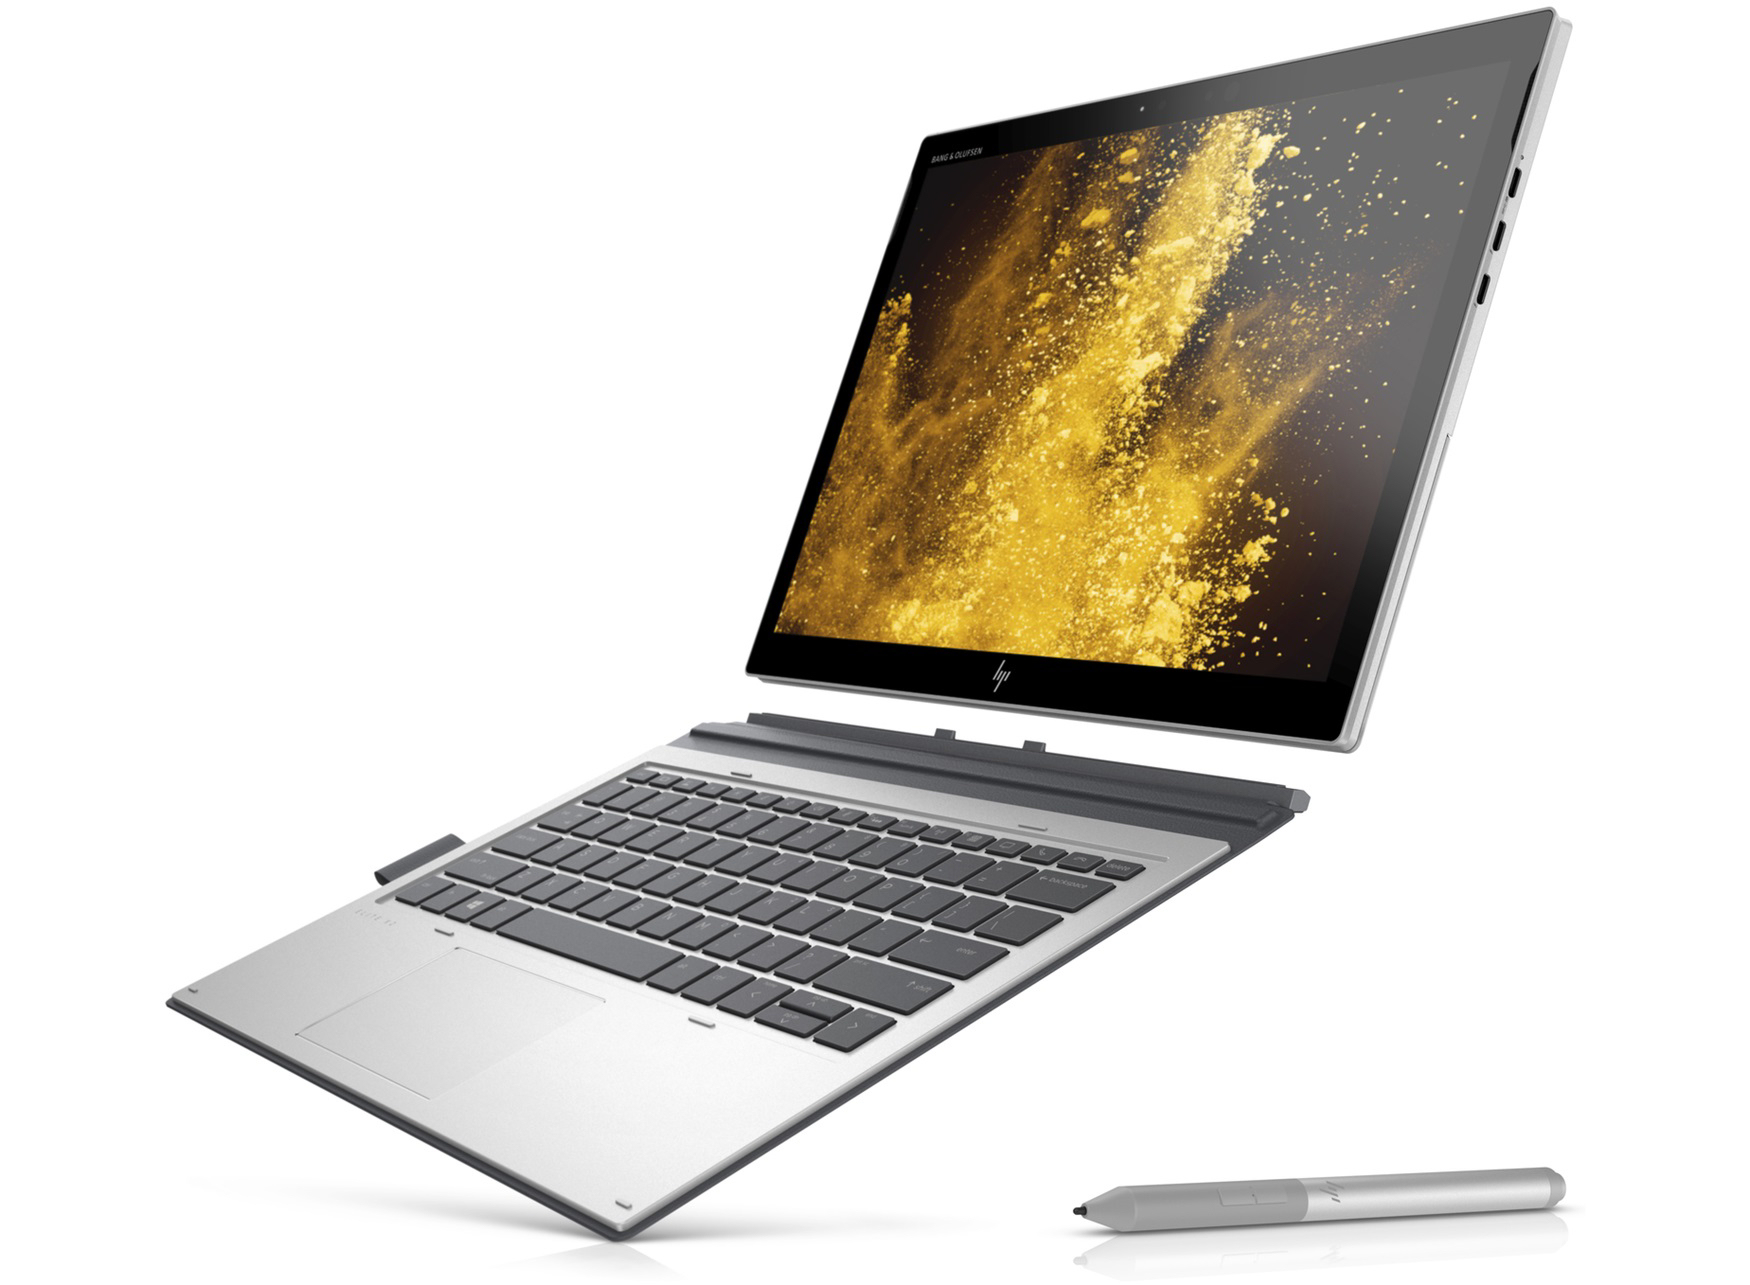
3:2-skärmen på 13 tum var riktigt ljusstark och hade hög kontrast och breda betraktningsvinklar. Den tryckkänsliga skärmen har stöd för både fingerinmatning samt stylusinmatning. Vår recensionsenhet saknade ett LTE-modem men var WWAN-redo. Med andra ord: det går att sätta i ett LTE-modem i efterhand.
HP Elite x2 1013 G3-2TT14EA
-
10/17/2019 v7
Sascha Mölck
Pricecompare
