Test: Asus Transformer 4 Pro (i7-7500U, HD620) Omvandlingsbar Laptop (Sammanfattning)


| SD Card Reader | |
| average JPG Copy Test (av. of 3 runs) | |
| Acer TravelMate P648-G2-M-73T0 (Toshiba Exceria Pro SDXC 64 GB UHS-II) | |
| Microsoft Surface Pro (2017) i7 (Toshiba Exceria Pro M401 64 GB) | |
| Asus Transformer 4 Pro (i7-7500U, HD620) (Toshiba Exceria Pro M401 64 GB) | |
| Porsche Design BOOK ONE (Toshiba Exceria Pro M501) | |
| maximum AS SSD Seq Read Test (1GB) | |
| Acer TravelMate P648-G2-M-73T0 (Toshiba Exceria Pro SDXC 64 GB UHS-II) | |
| Microsoft Surface Pro (2017) i7 (Toshiba Exceria Pro M401 64 GB) | |
| Asus Transformer 4 Pro (i7-7500U, HD620) (Toshiba Exceria Pro M401 64 GB) | |
| Porsche Design BOOK ONE (Toshiba Exceria Pro M501) | |
| |||||||||||||||||||||||||
Distribution av ljusstyrkan: 89 %
Mitt på batteriet: 262 cd/m²
Kontrast: 1008:1 (Svärta: 0.26 cd/m²)
ΔE ColorChecker Calman: 3.34 | ∀{0.5-29.43 Ø4.71}
ΔE Greyscale Calman: 3.28 | ∀{0.09-98 Ø4.96}
90% sRGB (Argyll 1.6.3 3D)
59% AdobeRGB 1998 (Argyll 1.6.3 3D)
65.9% AdobeRGB 1998 (Argyll 3D)
90% sRGB (Argyll 3D)
69.6% Display P3 (Argyll 3D)
Gamma: 2.47
CCT: 7180 K
| Asus Transformer 4 Pro (i7-7500U, HD620) BOE06EC, , 2160x1440, 12.6" | Acer Switch 5 SW512-52-5819 WST KL.1200w.004, , 2160x1440, 12" | Lenovo Ideapad Miix 720-12IKB AUO B120YAN01 / AUO106F, , 2880x1920, 12" | Asus Transformer 3 Pro T303UA-GN050T BOE BOE06AC (NV126A1M-N51), , 2880x1920, 12.6" | Microsoft Surface Pro (2017) i7 LG Display LP123WQ112604, , 2736x1824, 12.3" | |
|---|---|---|---|---|---|
| Display | -9% | -2% | 17% | 2% | |
| Display P3 Coverage (%) | 69.6 | 58.8 -16% | 65.2 -6% | 81.8 18% | 66.6 -4% |
| sRGB Coverage (%) | 90 | 87.5 -3% | 91 1% | 98.3 9% | 96.5 7% |
| AdobeRGB 1998 Coverage (%) | 65.9 | 60.6 -8% | 66.1 0% | 82.2 25% | 67.8 3% |
| Response Times | 9% | 2% | 12% | 11% | |
| Response Time Grey 50% / Grey 80% * (ms) | 41 ? | 37 ? 10% | 45 ? -10% | 30 ? 27% | 37 ? 10% |
| Response Time Black / White * (ms) | 28 ? | 26 ? 7% | 24 ? 14% | 29 ? -4% | 25 ? 11% |
| PWM Frequency (Hz) | 200 ? | 22130 ? | |||
| Screen | -26% | -7% | -2% | 6% | |
| Brightness middle (cd/m²) | 262 | 369 41% | 406 55% | 316 21% | 482 84% |
| Brightness (cd/m²) | 254 | 331 30% | 396 56% | 307 21% | 466 83% |
| Brightness Distribution (%) | 89 | 75 -16% | 88 -1% | 91 2% | 92 3% |
| Black Level * (cd/m²) | 0.26 | 0.46 -77% | 0.3 -15% | 0.29 -12% | 0.395 -52% |
| Contrast (:1) | 1008 | 802 -20% | 1353 34% | 1090 8% | 1220 21% |
| Colorchecker dE 2000 * | 3.34 | 5.52 -65% | 5.28 -58% | 3.91 -17% | 4 -20% |
| Colorchecker dE 2000 max. * | 7.12 | 9.29 -30% | 9.83 -38% | 7.9 -11% | 7.2 -1% |
| Greyscale dE 2000 * | 3.28 | 6.95 -112% | 6.71 -105% | 5.37 -64% | 5.7 -74% |
| Gamma | 2.47 89% | 2.58 85% | 2.29 96% | 2.36 93% | 2.28 96% |
| CCT | 7180 91% | 7009 93% | 6532 100% | 7812 83% | 7950 82% |
| Color Space (Percent of AdobeRGB 1998) (%) | 59 | 56 -5% | 59 0% | 72 22% | 62 5% |
| Color Space (Percent of sRGB) (%) | 90 | 88 -2% | 91 1% | 98 9% | 96 7% |
| Totalt genomsnitt (program/inställningar) | -9% /
-18% | -2% /
-5% | 9% /
4% | 6% /
6% |
* ... mindre är bättre
Visa svarstider
| ↔ Svarstid svart till vitt | ||
|---|---|---|
| 28 ms ... stiga ↗ och falla ↘ kombinerat | ↗ 16 ms stiga | 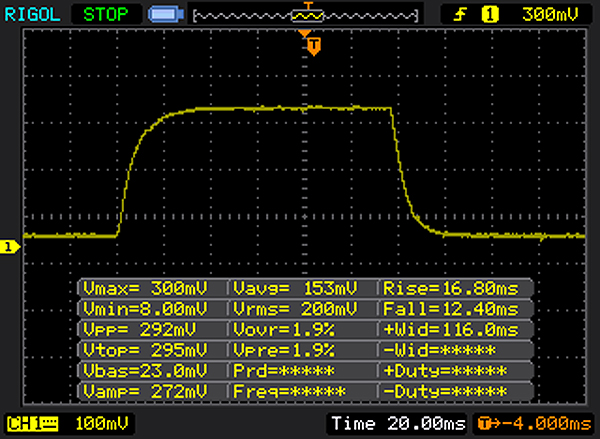 |
| ↘ 12 ms hösten | ||
| Skärmen visar relativt långsamma svarsfrekvenser i våra tester och kan vara för långsam för spelare. I jämförelse sträcker sig alla testade enheter från 0.1 (minst) till 240 (maximalt) ms. » 71 % av alla enheter är bättre. Detta innebär att den uppmätta svarstiden är sämre än genomsnittet av alla testade enheter (19.8 ms). | ||
| ↔ Svarstid 50 % grått till 80 % grått | ||
| 41 ms ... stiga ↗ och falla ↘ kombinerat | ↗ 22 ms stiga | 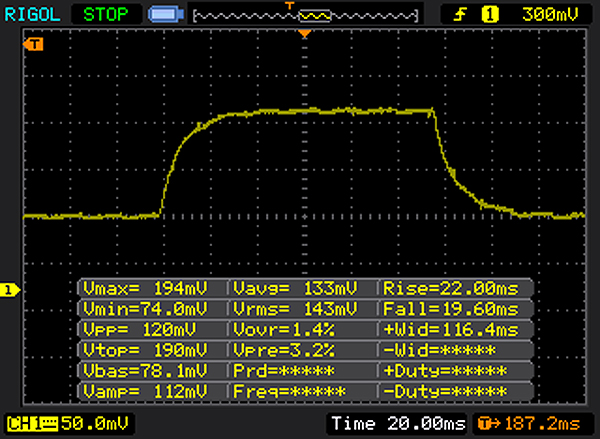 |
| ↘ 19 ms hösten | ||
| Skärmen visar långsamma svarsfrekvenser i våra tester och kommer att vara otillfredsställande för spelare. I jämförelse sträcker sig alla testade enheter från 0.165 (minst) till 636 (maximalt) ms. » 65 % av alla enheter är bättre. Detta innebär att den uppmätta svarstiden är sämre än genomsnittet av alla testade enheter (31 ms). | ||
Skärmflimmer / PWM (Puls-Width Modulation)
| Skärmflimmer / PWM upptäcktes inte | ||
Som jämförelse: 52 % av alla testade enheter använder inte PWM för att dämpa skärmen. Om PWM upptäcktes mättes ett medelvärde av 7757 (minst: 5 - maximum: 343500) Hz. | ||
| PCMark 8 Home Score Accelerated v2 | 2591 poäng | |
| PCMark 8 Work Score Accelerated v2 | 4034 poäng | |
Hjälp | ||
| Asus Transformer 4 Pro (i7-7500U, HD620) SK Hynix HFS256G39TND-N210A | Acer Switch 5 SW512-52-5819 Intel SSD 600p SSDPEKKW512G7 | Lenovo Ideapad Miix 720-12IKB Samsung SSD PM961 1TB M.2 PCIe 3.0 x4 NVMe (MZVLW1T0) | Asus Transformer 3 Pro T303UA-GN050T SK Hynix Canvas SC300 512GB M.2 (HFS512G39MND) | Microsoft Surface Pro (2017) i7 Samsung PM971 KUS040202M | Acer TravelMate P648-G2-M-73T0 SK Hynix HFS256G39TND-N210A | |
|---|---|---|---|---|---|---|
| CrystalDiskMark 3.0 | 89% | 256% | 3% | 116% | 20% | |
| Read Seq (MB/s) | 475.3 | 1066 124% | 2408 407% | 398.9 -16% | 1308 175% | 518 9% |
| Write Seq (MB/s) | 260.9 | 593 127% | 1702 552% | 402 54% | 961 268% | 267.2 2% |
| Read 512 (MB/s) | 289.3 | 653 126% | 1301 350% | 303.1 5% | 227.5 -21% | 562 94% |
| Write 512 (MB/s) | 260.7 | 535 105% | 1288 394% | 320.3 23% | 792 204% | 263.5 1% |
| Read 4k (MB/s) | 30.06 | 35.92 19% | 53.6 78% | 26.11 -13% | 53.6 78% | 32.88 9% |
| Write 4k (MB/s) | 73.5 | 128.3 75% | 162.2 121% | 57.7 -21% | 136.3 85% | 85.6 16% |
| Read 4k QD32 (MB/s) | 296.8 | 460.6 55% | 504 70% | 245.8 -17% | 485.6 64% | 351.3 18% |
| Write 4k QD32 (MB/s) | 239.8 | 425.4 77% | 420.8 75% | 253.8 6% | 421.5 76% | 265.2 11% |

| 3DMark 11 Performance | 1552 poäng | |
| 3DMark Cloud Gate Standard Score | 5878 poäng | |
| 3DMark Fire Strike Score | 316 poäng | |
Hjälp | ||
| Rise of the Tomb Raider - 1024x768 Lowest Preset | |
| Microsoft Surface Pro (2017) i7 | |
| Asus Transformer 3 Pro T303UA-GN050T | |
| Acer Switch 5 SW512-52-5819 | |
| Acer TravelMate P648-G2-M-73T0 | |
| Lenovo Ideapad Miix 720-12IKB | |
| Asus Transformer 4 Pro (i7-7500U, HD620) | |
| låg | med. | hög | ultra | |
|---|---|---|---|---|
| BioShock Infinite (2013) | 24.55 | 11.32 | 9.98 | |
| Thief (2014) | 10.6 | 6.1 | ||
| Rise of the Tomb Raider (2016) | 6.86 |
Ljudnivå
| Låg belastning |
| 30.2 / 30.2 / dB(A) |
| Hög belastning |
| 30.8 / 32.9 dB(A) |
 | ||
30 dB tyst 40 dB(A) hörbar 50 dB(A) högt ljud |
||
min: | ||
(±) Den maximala temperaturen på ovansidan är 40.5 °C / 105 F, jämfört med genomsnittet av 35.4 °C / 96 F , allt från 19.6 till 60 °C för klassen Convertible.
(+) Botten värms upp till maximalt 37 °C / 99 F, jämfört med genomsnittet av 36.9 °C / 98 F
(+) Vid tomgångsbruk är medeltemperaturen för ovansidan 29 °C / 84 F, jämfört med enhetsgenomsnittet på 30.3 °C / ### class_avg_f### F.
(+) Handledsstöden och pekplattan når maximal hudtemperatur (33 °C / 91.4 F) och är därför inte varma.
(-) Medeltemperaturen för handledsstödsområdet på liknande enheter var 28 °C / 82.4 F (-5 °C / -9 F).
Asus Transformer 4 Pro (i7-7500U, HD620) ljudanalys
(-) | inte särskilt höga högtalare (68.3 dB)
Bas 100 - 315 Hz
(-) | nästan ingen bas - i genomsnitt 17.8% lägre än medianen
(±) | linjäriteten för basen är genomsnittlig (10.3% delta till föregående frekvens)
Mellan 400 - 2000 Hz
(+) | balanserad mellan - endast 1.8% från medianen
(±) | linjäriteten för mids är genomsnittlig (8.1% delta till föregående frekvens)
Högsta 2 - 16 kHz
(±) | högre toppar - i genomsnitt 7.7% högre än medianen
(±) | linjäriteten för toppar är genomsnittlig (8.5% delta till föregående frekvens)
Totalt 100 - 16 000 Hz
(±) | linjäriteten för det totala ljudet är genomsnittlig (24.8% skillnad mot median)
Jämfört med samma klass
» 75% av alla testade enheter i den här klassen var bättre, 6% liknande, 18% sämre
» Den bästa hade ett delta på 6%, genomsnittet var 20%, sämst var 57%
Jämfört med alla testade enheter
» 76% av alla testade enheter var bättre, 5% liknande, 19% sämre
» Den bästa hade ett delta på 4%, genomsnittet var 23%, sämst var 134%
Apple MacBook 12 (Early 2016) 1.1 GHz ljudanalys
(+) | högtalare kan spela relativt högt (83.6 dB)
Bas 100 - 315 Hz
(±) | reducerad bas - i genomsnitt 11.3% lägre än medianen
(±) | linjäriteten för basen är genomsnittlig (14.2% delta till föregående frekvens)
Mellan 400 - 2000 Hz
(+) | balanserad mellan - endast 2.4% från medianen
(+) | mids är linjära (5.5% delta till föregående frekvens)
Högsta 2 - 16 kHz
(+) | balanserade toppar - endast 2% från medianen
(+) | toppar är linjära (4.5% delta till föregående frekvens)
Totalt 100 - 16 000 Hz
(+) | det totala ljudet är linjärt (10.2% skillnad mot median)
Jämfört med samma klass
» 7% av alla testade enheter i den här klassen var bättre, 2% liknande, 90% sämre
» Den bästa hade ett delta på 5%, genomsnittet var 18%, sämst var 53%
Jämfört med alla testade enheter
» 5% av alla testade enheter var bättre, 1% liknande, 94% sämre
» Den bästa hade ett delta på 4%, genomsnittet var 23%, sämst var 134%
| Av/Standby | |
| Låg belastning | |
| Hög belastning |
|
Förklaring:
min: | |
| Asus Transformer 4 Pro (i7-7500U, HD620) i7-7500U, HD Graphics 620, SK Hynix HFS256G39TND-N210A, IPS, 2160x1440, 12.6" | Acer Switch 5 SW512-52-5819 i7-7500U, HD Graphics 620, Intel SSD 600p SSDPEKKW512G7, IPS, 2160x1440, 12" | Lenovo Ideapad Miix 720-12IKB i7-7500U, HD Graphics 620, Samsung SSD PM961 1TB M.2 PCIe 3.0 x4 NVMe (MZVLW1T0), IPS, 2880x1920, 12" | Asus Transformer 3 Pro T303UA-GN050T 6500U, HD Graphics 520, SK Hynix Canvas SC300 512GB M.2 (HFS512G39MND), IPS, 2880x1920, 12.6" | Microsoft Surface Pro (2017) i7 i7-7660U, Iris Plus Graphics 640, Samsung PM971 KUS040202M, IPS, 2736x1824, 12.3" | Acer TravelMate P648-G2-M-73T0 i7-7500U, HD Graphics 620, SK Hynix HFS256G39TND-N210A, IPS, 1920x1080, 14" | |
|---|---|---|---|---|---|---|
| Power Consumption | -27% | -27% | -66% | -71% | -53% | |
| Idle Minimum * (Watt) | 3.4 | 3.86 -14% | 3.5 -3% | 6.7 -97% | 4.2 -24% | 4.8 -41% |
| Idle Average * (Watt) | 5.7 | 6.4 -12% | 7.2 -26% | 10.3 -81% | 10.1 -77% | 7.9 -39% |
| Idle Maximum * (Watt) | 7.4 | 7.17 3% | 7.9 -7% | 13.5 -82% | 14 -89% | 10.7 -45% |
| Load Average * (Watt) | 15 | 30.5 -103% | 29.6 -97% | 26 -73% | 37.4 -149% | 35 -133% |
| Load Maximum * (Watt) | 29.7 | 32.4 -9% | 30.8 -4% | 28.8 3% | 34 -14% | 31.6 -6% |
| Witcher 3 ultra * (Watt) | 38.1 |
* ... mindre är bättre
| Asus Transformer 4 Pro (i7-7500U, HD620) i7-7500U, HD Graphics 620, 39 Wh | Acer Switch 5 SW512-52-5819 i7-7500U, HD Graphics 620, Wh | Lenovo Ideapad Miix 720-12IKB i7-7500U, HD Graphics 620, 41 Wh | Asus Transformer 3 Pro T303UA-GN050T 6500U, HD Graphics 520, 39 Wh | Microsoft Surface Pro (2017) i7 i7-7660U, Iris Plus Graphics 640, 45 Wh | Acer TravelMate P648-G2-M-73T0 i7-7500U, HD Graphics 620, 54 Wh | |
|---|---|---|---|---|---|---|
| Batteridrifttid | -3% | 1% | -28% | 35% | 54% | |
| Reader / Idle (h) | 14 | 11.9 -15% | 11.9 -15% | 7.1 -49% | 18.1 29% | |
| WiFi v1.3 (h) | 4.7 | 5.9 26% | 5.8 23% | 3.7 -21% | 8.2 74% | 11.2 138% |
| Load (h) | 2 | 1.6 -20% | 1.9 -5% | 1.7 -15% | 1.9 -5% | 1.9 -5% |
| H.264 (h) | 3.4 | 10.2 | ||||
| Witcher 3 ultra (h) | 1.9 |
För
Emot
Asus Transformer 4 Pro är en bluff-uppgradering. I verkligheten är denna omvandlingsbara laptop sämre än sin föregångare på flera sätt. Skärmen med lägre upplösning, strypningen av dess CPU och likadan batterikapacitet lämnar få märkbara förbättringar gentemot Transformer 3 Pro. Den enda verkligt användbara förbättringen är det faktum att USB Typ-C porten inte längre tas upp av nätkabeln när enheten är i nätadapter-läge.
Förbättringarna hos Transformer 4 Pro kommer på bekostnad av några av den tidigare modellens fördelar. I viktiga områden är vårt intryck av enheten sämre än för sin föregångare. Intresserade köpare kan vilja överväga om en annan produkt hade passat bättre.
Den som köper Transformer 4 Pro får en omvandlingsbar laptop som faktiskt är en bra enhet, sett till sig själv. Jämförd med konkurrensen är det dock uppenbart var Asus har skurit ner. Enhetens processorprestanda och SSD-prestanda är båda långt under medel. Jämfört med den tidigare modellen, Transformer 3 Pro, ser saker ännu värre ut. Men undantag för längre batteritid erbjuder den nya modellen inget riktigt nytt som känns värt. För dess nuvarande pris är prestandan hos Transformer 4 Pro helt enkelt för svag. Andra tillverkare erbjuder enheter med mycket starkare prestanda på liknande prisnivåer.
Asus Transformer 4 Pro (i7-7500U, HD620)
- 11/27/2017 v6 (old)
Mike Wobker