Test: Dell Latitude 12 5285 2-in-1 (sammanfattning)
| SD Card Reader | |
| average JPG Copy Test (av. of 3 runs) | |
| Dell Latitude 12 5285 2-in-1 | |
| maximum AS SSD Seq Read Test (1GB) | |
| Dell Latitude 12 5285 2-in-1 | |
| Networking | |
| iperf3 transmit AX12 | |
| Asus Transformer 3 Pro T303UA-GN050T | |
| Microsoft Surface Pro 4, Core i5, 128GB (Klaus I211) | |
| Dell Latitude 12 5285 2-in-1 | |
| iperf3 receive AX12 | |
| Asus Transformer 3 Pro T303UA-GN050T | |
| Microsoft Surface Pro 4, Core i5, 128GB (Klaus I211) | |
| Dell Latitude 12 5285 2-in-1 | |
| |||||||||||||||||||||||||
Distribution av ljusstyrkan: 88 %
Mitt på batteriet: 523.2 cd/m²
Kontrast: 1246:1 (Svärta: 0.42 cd/m²)
ΔE ColorChecker Calman: 4 | ∀{0.5-29.43 Ø4.73}
ΔE Greyscale Calman: 5.5 | ∀{0.09-98 Ø4.97}
93.97% sRGB (Argyll 1.6.3 3D)
64.86% AdobeRGB 1998 (Argyll 1.6.3 3D)
64.7% AdobeRGB 1998 (Argyll 3D)
94% sRGB (Argyll 3D)
62.8% Display P3 (Argyll 3D)
Gamma: 2.16
CCT: 7546 K
| Dell Latitude 12 5285 2-in-1 BOE06DC, IPS, 12.3", 1920x1280 | Microsoft Surface Pro 4, Core i5, 128GB Samsung 123YL01-001 ID: SDC3853, IPS, 12.3", 2736x1824 | HP Elite x2 1012 G1 LG Philips, IPS, 12.1", 1920x1280 | Acer Aspire Switch Alpha 12 SA5-271-70EQ WST KL.1200W.002 WST2216, IPS, 12", 2160x1440 | Asus Transformer 3 Pro T303UA-GN050T BOE BOE06AC (NV126A1M-N51), IPS, 12.6", 2880x1920 | |
|---|---|---|---|---|---|
| Display | 4% | -18% | -12% | 21% | |
| Display P3 Coverage (%) | 62.8 | 65 4% | 53.8 -14% | 55.7 -11% | 81.8 30% |
| sRGB Coverage (%) | 94 | 96.5 3% | 73.7 -22% | 82.7 -12% | 98.3 5% |
| AdobeRGB 1998 Coverage (%) | 64.7 | 67 4% | 53.8 -17% | 56.9 -12% | 82.2 27% |
| Response Times | -5% | 24% | 30% | 18% | |
| Response Time Grey 50% / Grey 80% * (ms) | 42.4 ? | 46 ? -8% | 33.2 ? 22% | 21 ? 50% | 30 ? 29% |
| Response Time Black / White * (ms) | 30.8 ? | 31.2 ? -1% | 22.8 ? 26% | 28 ? 9% | 29 ? 6% |
| PWM Frequency (Hz) | 210.1 ? | 50 ? | 50 ? | 200 ? | |
| Screen | 1% | -24% | -33% | -3% | |
| Brightness middle (cd/m²) | 523.2 | 413 -21% | 322 -38% | 391 -25% | 316 -40% |
| Brightness (cd/m²) | 522 | 396 -24% | 319 -39% | 367 -30% | 307 -41% |
| Brightness Distribution (%) | 88 | 87 -1% | 97 10% | 87 -1% | 91 3% |
| Black Level * (cd/m²) | 0.42 | 0.36 14% | 0.42 -0% | 0.56 -33% | 0.29 31% |
| Contrast (:1) | 1246 | 1147 -8% | 767 -38% | 698 -44% | 1090 -13% |
| Colorchecker dE 2000 * | 4 | 3.09 23% | 6.02 -51% | 6.96 -74% | 3.91 2% |
| Colorchecker dE 2000 max. * | 8.6 | 10.06 -17% | 13.43 -56% | 7.9 8% | |
| Greyscale dE 2000 * | 5.5 | 3.92 29% | 6.29 -14% | 7.44 -35% | 5.37 2% |
| Gamma | 2.16 102% | 2.3 96% | 2.4 92% | 2.41 91% | 2.36 93% |
| CCT | 7546 86% | 7333 89% | 7712 84% | 8126 80% | 7812 83% |
| Color Space (Percent of AdobeRGB 1998) (%) | 64.86 | 61 -6% | 47.8 -26% | 53 -18% | 72 11% |
| Color Space (Percent of sRGB) (%) | 93.97 | 97 3% | 73.2 -22% | 83 -12% | 98 4% |
| Totalt genomsnitt (program/inställningar) | 0% /
1% | -6% /
-16% | -5% /
-20% | 12% /
4% |
* ... mindre är bättre
Visa svarstider
| ↔ Svarstid svart till vitt | ||
|---|---|---|
| 30.8 ms ... stiga ↗ och falla ↘ kombinerat | ↗ 18 ms stiga | 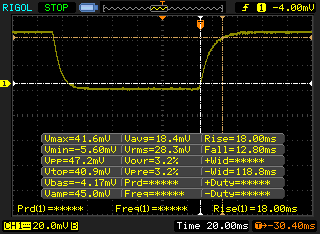 |
| ↘ 12.8 ms hösten | ||
| Skärmen visar långsamma svarsfrekvenser i våra tester och kommer att vara otillfredsställande för spelare. I jämförelse sträcker sig alla testade enheter från 0.1 (minst) till 240 (maximalt) ms. » 83 % av alla enheter är bättre. Detta innebär att den uppmätta svarstiden är sämre än genomsnittet av alla testade enheter (19.9 ms). | ||
| ↔ Svarstid 50 % grått till 80 % grått | ||
| 42.4 ms ... stiga ↗ och falla ↘ kombinerat | ↗ 20.4 ms stiga | 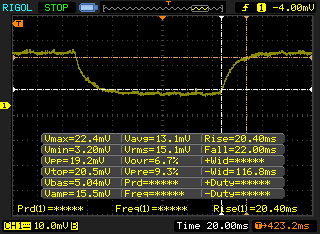 |
| ↘ 22 ms hösten | ||
| Skärmen visar långsamma svarsfrekvenser i våra tester och kommer att vara otillfredsställande för spelare. I jämförelse sträcker sig alla testade enheter från 0.165 (minst) till 636 (maximalt) ms. » 70 % av alla enheter är bättre. Detta innebär att den uppmätta svarstiden är sämre än genomsnittet av alla testade enheter (31.1 ms). | ||
Skärmflimmer / PWM (Puls-Width Modulation)
| Skärmflimmer / PWM upptäckt | 210.1 Hz | ≤ 99 % ljusstyrka inställning | 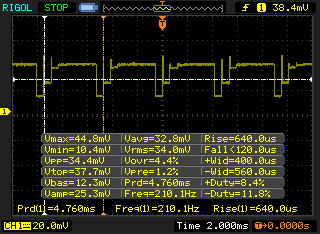 |
Displayens bakgrundsbelysning flimrar vid 210.1 Hz (i värsta fall, t.ex. med PWM) Flimrande upptäckt vid en ljusstyrkeinställning på 99 % och lägre. Det ska inte finnas något flimmer eller PWM över denna ljusstyrkeinställning. Frekvensen för 210.1 Hz är relativt låg, så känsliga användare kommer sannolikt att märka flimmer och uppleva ansträngda ögon vid den angivna ljusstyrkeinställningen och nedan. Som jämförelse: 52 % av alla testade enheter använder inte PWM för att dämpa skärmen. Om PWM upptäcktes mättes ett medelvärde av 7798 (minst: 5 - maximum: 343500) Hz. | |||
| Cinebench R10 | |
| Rendering Multiple CPUs 32Bit | |
| Dell Latitude 12 5285 2-in-1 | |
| Microsoft Surface Pro 4, Core i5, 128GB | |
| HP Elite x2 1012 G1 | |
| Asus Transformer 3 Pro T303UA-GN050T | |
| Rendering Single 32Bit | |
| Asus Transformer 3 Pro T303UA-GN050T | |
| Dell Latitude 12 5285 2-in-1 | |
| Microsoft Surface Pro 4, Core i5, 128GB | |
| HP Elite x2 1012 G1 | |
| wPrime 2.10 - 1024m | |
| Dell Latitude 12 5285 2-in-1 | |
* ... mindre är bättre
| PCMark 8 Home Score Accelerated v2 | 4741 poäng | |
| PCMark 8 Creative Score Accelerated v2 | 4602 poäng | |
| PCMark 8 Work Score Accelerated v2 | 3510 poäng | |
Hjälp | ||
| Dell Latitude 12 5285 2-in-1 Samsung PM961 MZVLW256HEHP | Microsoft Surface Pro 4, Core i5, 128GB Samsung MZFLV128 NVMe | HP Elite x2 1012 G1 Liteon L8H-256V2G | Acer Aspire Switch Alpha 12 SA5-271-70EQ Lite-On CV1-8B512 M.2 512 GB | Asus Transformer 3 Pro T303UA-GN050T SK Hynix Canvas SC300 512GB M.2 (HFS512G39MND) | Microsoft Surface Pro 4 Core i7 Samsung MZFLV256 NVMe | |
|---|---|---|---|---|---|---|
| CrystalDiskMark 3.0 | -37% | -32% | -29% | -41% | -16% | |
| Read Seq (MB/s) | 1294 | 666 -49% | 501 -61% | 496.6 -62% | 398.9 -69% | 834 -36% |
| Write Seq (MB/s) | 865 | 154.2 -82% | 297.2 -66% | 415.3 -52% | 402 -54% | 304 -65% |
| Read 512 (MB/s) | 406 | 266.3 -34% | 351.7 -13% | 335.9 -17% | 303.1 -25% | 396.7 -2% |
| Write 512 (MB/s) | 589 | 154.2 -74% | 295.7 -50% | 384 -35% | 320.3 -46% | 304.3 -48% |
| Read 4k (MB/s) | 31.75 | 28.51 -10% | 28.31 -11% | 32.38 2% | 26.11 -18% | 40.75 28% |
| Write 4k (MB/s) | 72.2 | 101.5 41% | 90.3 25% | 81.8 13% | 57.7 -20% | 106.3 47% |
| Read 4k QD32 (MB/s) | 493.3 | 368.3 -25% | 285 -42% | 296.3 -40% | 245.8 -50% | 393.1 -20% |
| Write 4k QD32 (MB/s) | 434.5 | 153.6 -65% | 268.4 -38% | 260.3 -40% | 253.8 -42% | 292.3 -33% |

| 3DMark 11 Performance | 1744 poäng | |
| 3DMark Ice Storm Standard Score | 12587 poäng | |
| 3DMark Cloud Gate Standard Score | 6652 poäng | |
| 3DMark Fire Strike Score | 985 poäng | |
| 3DMark Fire Strike Extreme Score | 457 poäng | |
Hjälp | ||
| låg | med. | hög | ultra | |
|---|---|---|---|---|
| Tomb Raider (2013) | 88.6 | 45.5 | 29.7 | 13.6 |
| BioShock Infinite (2013) | 56.5 | 32.8 | 28.6 | 9 |
Ljudnivå
| Låg belastning |
| 28.2 / 28.2 / 28.2 dB(A) |
| Hög belastning |
| 30.4 / 34 dB(A) |
 | ||
30 dB tyst 40 dB(A) hörbar 50 dB(A) högt ljud |
||
min: | ||
| Dell Latitude 12 5285 2-in-1 HD Graphics 620, i7-7600U, Samsung PM961 MZVLW256HEHP | Microsoft Surface Pro 4, Core i5, 128GB HD Graphics 520, 6300U, Samsung MZFLV128 NVMe | Asus Transformer 3 Pro T303UA-GN050T HD Graphics 520, 6500U, SK Hynix Canvas SC300 512GB M.2 (HFS512G39MND) | Microsoft Surface Pro 4 Core i7 Iris Graphics 540, 6650U, Samsung MZFLV256 NVMe | |
|---|---|---|---|---|
| Noise | -18% | -11% | -12% | |
| av / miljö * (dB) | 28.2 | 30.7 -9% | ||
| Idle Minimum * (dB) | 28.2 | 31.5 -12% | 30.7 -9% | 28.4 -1% |
| Idle Average * (dB) | 28.2 | 31.5 -12% | 30.7 -9% | 28.6 -1% |
| Idle Maximum * (dB) | 28.2 | 31.5 -12% | 30.7 -9% | 28.7 -2% |
| Load Average * (dB) | 30.4 | 40.5 -33% | 37 -22% | 40.8 -34% |
| Load Maximum * (dB) | 34 | 40.7 -20% | 37.1 -9% | 41.4 -22% |
* ... mindre är bättre
(+) Den maximala temperaturen på ovansidan är 38.2 °C / 101 F, jämfört med genomsnittet av 35.4 °C / 96 F , allt från 19.6 till 60 °C för klassen Convertible.
(-) Botten värms upp till maximalt 48.6 °C / 119 F, jämfört med genomsnittet av 36.9 °C / 98 F
(+) Vid tomgångsbruk är medeltemperaturen för ovansidan 28.4 °C / 83 F, jämfört med enhetsgenomsnittet på 30.3 °C / ### class_avg_f### F.
(+) Handledsstöden och pekplattan är kallare än hudtemperaturen med maximalt 31.2 °C / 88.2 F och är därför svala att ta på.
(-) Medeltemperaturen för handledsstödsområdet på liknande enheter var 28 °C / 82.4 F (-3.2 °C / -5.8 F).
Dell Latitude 12 5285 2-in-1 ljudanalys
(±) | högtalarljudstyrkan är genomsnittlig men bra (72.4 dB)
Bas 100 - 315 Hz
(-) | nästan ingen bas - i genomsnitt 16.3% lägre än medianen
(±) | linjäriteten för basen är genomsnittlig (11% delta till föregående frekvens)
Mellan 400 - 2000 Hz
(+) | balanserad mellan - endast 4.3% från medianen
(±) | linjäriteten för mids är genomsnittlig (11.3% delta till föregående frekvens)
Högsta 2 - 16 kHz
(+) | balanserade toppar - endast 2.6% från medianen
(±) | linjäriteten för toppar är genomsnittlig (8.2% delta till föregående frekvens)
Totalt 100 - 16 000 Hz
(±) | linjäriteten för det totala ljudet är genomsnittlig (23.5% skillnad mot median)
Jämfört med samma klass
» 71% av alla testade enheter i den här klassen var bättre, 5% liknande, 24% sämre
» Den bästa hade ett delta på 6%, genomsnittet var 20%, sämst var 57%
Jämfört med alla testade enheter
» 70% av alla testade enheter var bättre, 6% liknande, 24% sämre
» Den bästa hade ett delta på 4%, genomsnittet var 24%, sämst var 134%
Apple MacBook 12 (Early 2016) 1.1 GHz ljudanalys
(+) | högtalare kan spela relativt högt (83.6 dB)
Bas 100 - 315 Hz
(±) | reducerad bas - i genomsnitt 11.3% lägre än medianen
(±) | linjäriteten för basen är genomsnittlig (14.2% delta till föregående frekvens)
Mellan 400 - 2000 Hz
(+) | balanserad mellan - endast 2.4% från medianen
(+) | mids är linjära (5.5% delta till föregående frekvens)
Högsta 2 - 16 kHz
(+) | balanserade toppar - endast 2% från medianen
(+) | toppar är linjära (4.5% delta till föregående frekvens)
Totalt 100 - 16 000 Hz
(+) | det totala ljudet är linjärt (10.2% skillnad mot median)
Jämfört med samma klass
» 7% av alla testade enheter i den här klassen var bättre, 2% liknande, 91% sämre
» Den bästa hade ett delta på 5%, genomsnittet var 18%, sämst var 53%
Jämfört med alla testade enheter
» 5% av alla testade enheter var bättre, 1% liknande, 94% sämre
» Den bästa hade ett delta på 4%, genomsnittet var 24%, sämst var 134%
| Av/Standby | |
| Låg belastning | |
| Hög belastning |
|
Förklaring:
min: | |
| Dell Latitude 12 5285 2-in-1 i7-7600U, HD Graphics 620, Samsung PM961 MZVLW256HEHP, IPS, 1920x1280, 12.3" | Microsoft Surface Pro 4, Core i5, 128GB 6300U, HD Graphics 520, Samsung MZFLV128 NVMe, IPS, 2736x1824, 12.3" | HP Elite x2 1012 G1 6Y54, HD Graphics 515, Liteon L8H-256V2G, IPS, 1920x1280, 12.1" | Acer Aspire Switch Alpha 12 SA5-271-70EQ 6500U, HD Graphics 520, Lite-On CV1-8B512 M.2 512 GB, IPS, 2160x1440, 12" | Asus Transformer 3 Pro T303UA-GN050T 6500U, HD Graphics 520, SK Hynix Canvas SC300 512GB M.2 (HFS512G39MND), IPS, 2880x1920, 12.6" | Microsoft Surface Pro 4 Core i7 6650U, Iris Graphics 540, Samsung MZFLV256 NVMe, IPS, 2736x1824, 12.3" | |
|---|---|---|---|---|---|---|
| Power Consumption | -11% | -0% | -44% | -48% | ||
| Idle Minimum * (Watt) | 2.85 | 4.4 -54% | 3.7 -30% | 5.5 -93% | 6.7 -135% | |
| Idle Average * (Watt) | 6.76 | 9 -33% | 6.8 -1% | 9.8 -45% | 10.3 -52% | |
| Idle Maximum * (Watt) | 6.91 | 10.7 -55% | 7.6 -10% | 11.9 -72% | 13.5 -95% | |
| Load Average * (Watt) | 32.88 | 19.6 40% | 22.5 32% | 36.1 -10% | 26 21% | |
| Load Maximum * (Watt) | 37.41 | 19.9 47% | 34.5 8% | 36.7 2% | 28.8 23% |
* ... mindre är bättre
| Dell Latitude 12 5285 2-in-1 i7-7600U, HD Graphics 620, 42 Wh | Microsoft Surface Pro 4, Core i5, 128GB 6300U, HD Graphics 520, 38 Wh | HP Elite x2 1012 G1 6Y54, HD Graphics 515, 37 Wh | Acer Aspire Switch Alpha 12 SA5-271-70EQ 6500U, HD Graphics 520, 37 Wh | Asus Transformer 3 Pro T303UA-GN050T 6500U, HD Graphics 520, 39 Wh | Microsoft Surface Pro 4 Core i7 6650U, Iris Graphics 540, 38 Wh | |
|---|---|---|---|---|---|---|
| Batteridrifttid | -7% | -6% | -25% | -40% | -36% | |
| Reader / Idle (h) | 17.9 | 15 -16% | 12.2 -32% | 10.7 -40% | 7.1 -60% | 10.9 -39% |
| WiFi v1.3 (h) | 8.1 | 7.1 -12% | 7.4 -9% | 4.9 -40% | 3.7 -54% | 4.9 -40% |
| Load (h) | 1.8 | 1.9 6% | 2.2 22% | 1.9 6% | 1.7 -6% | 1.3 -28% |
För
Emot
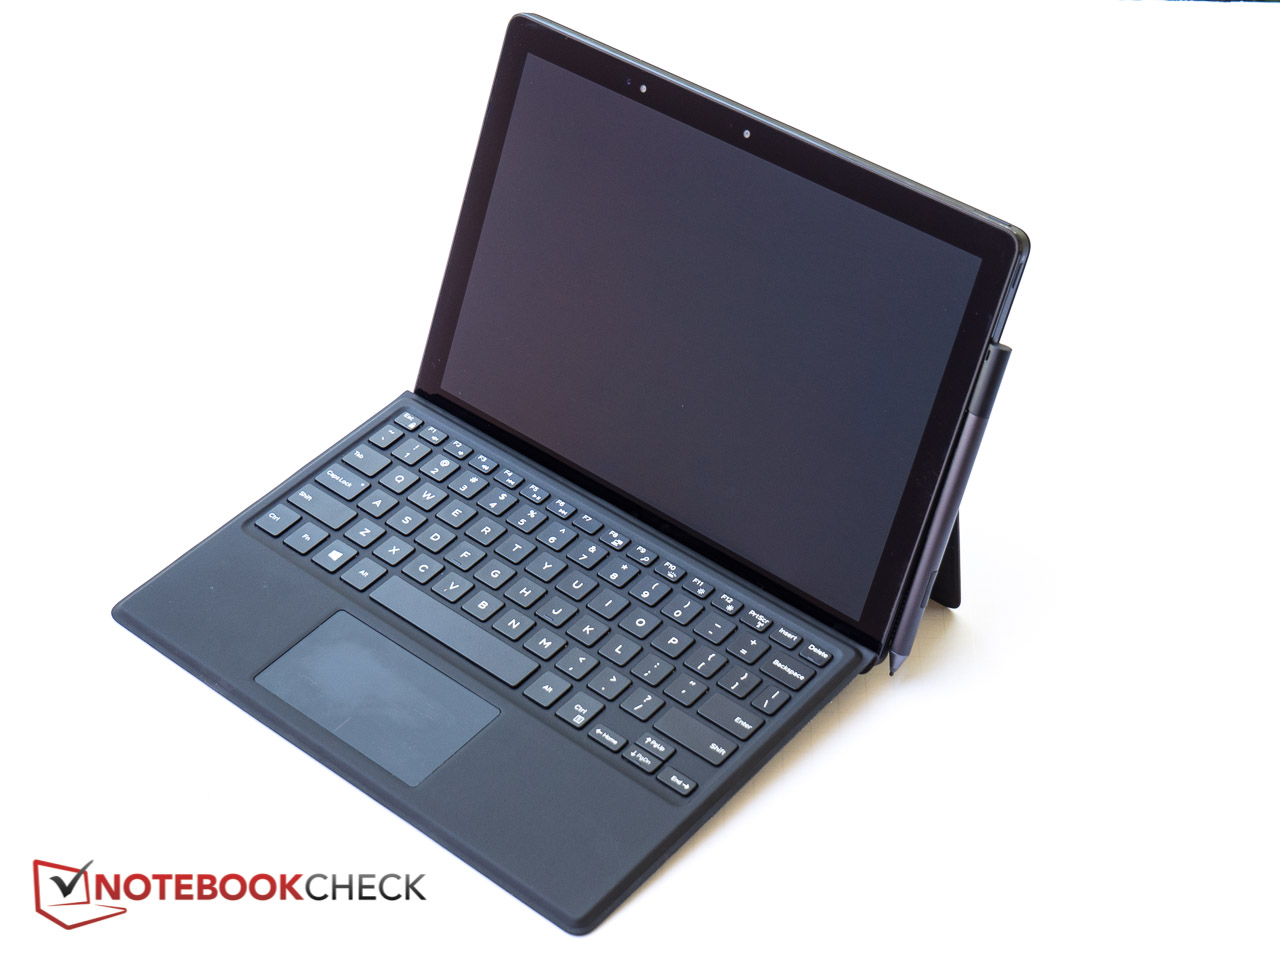
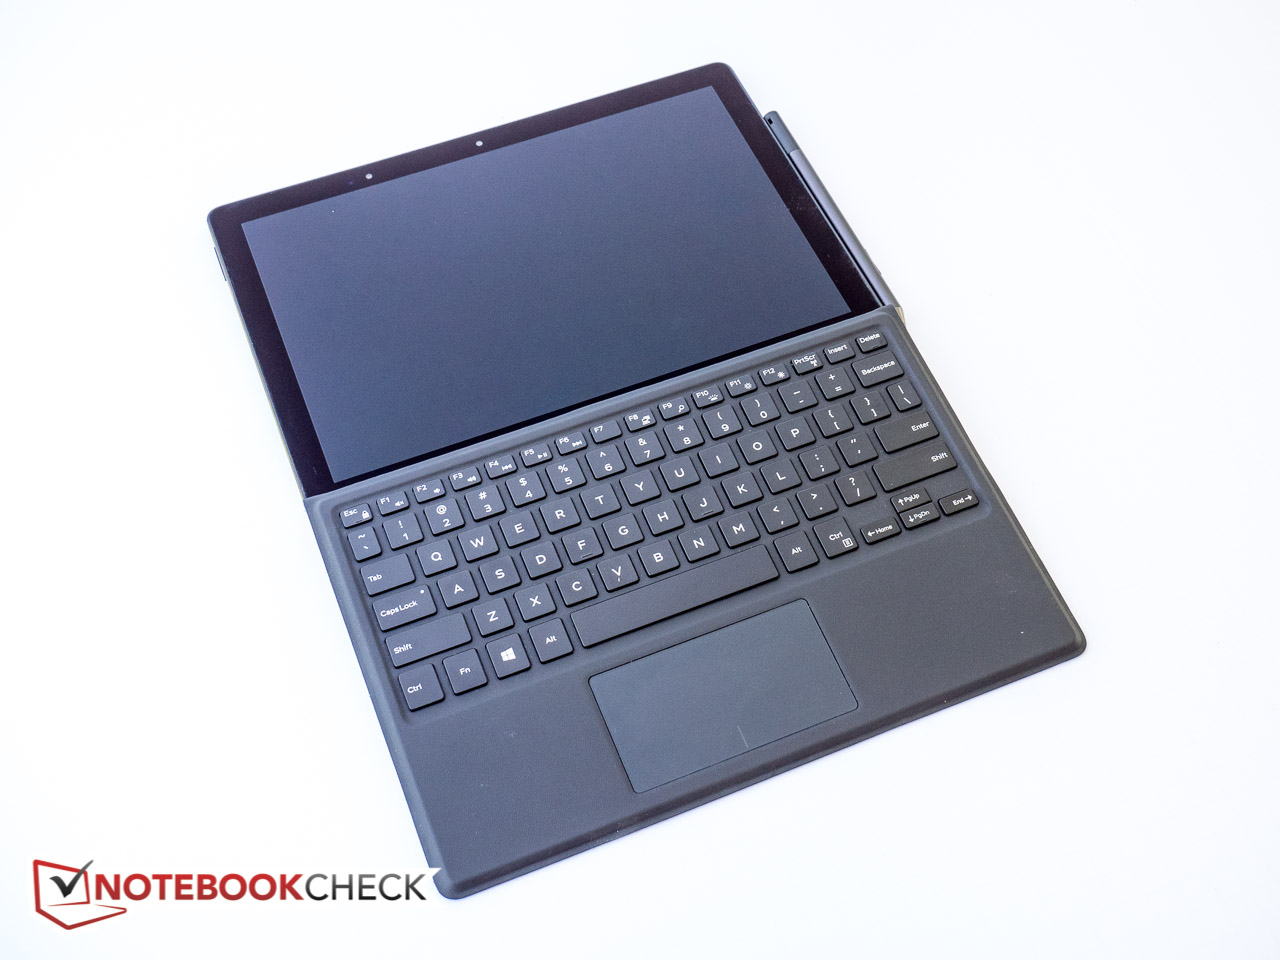
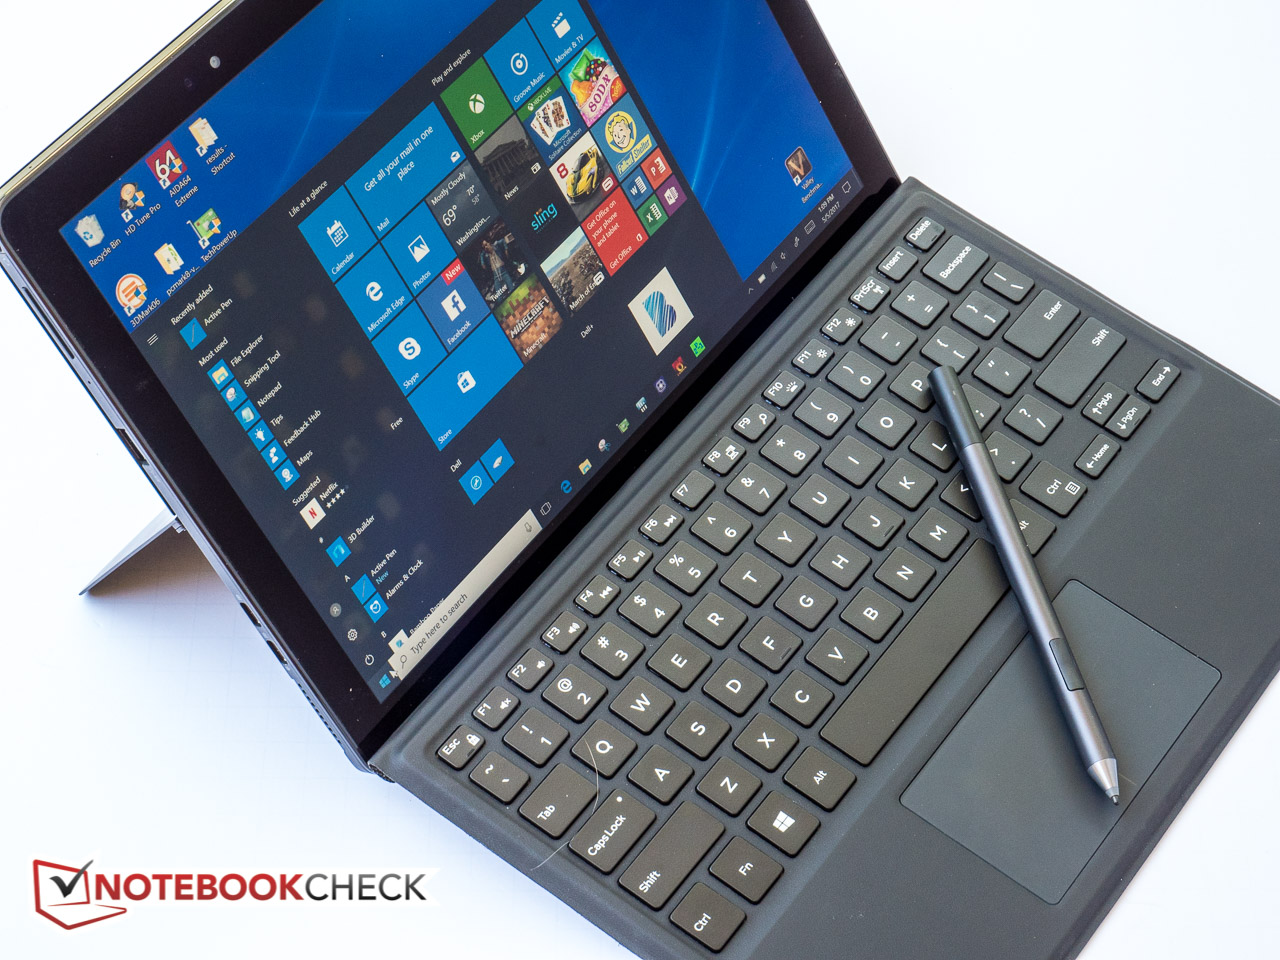
Dells Latitude 12 5285 är en bra 2-i-1-dator för företagsanvändare. Den kombinerar god ergonomi, anständig prestanda och bra uthållighet i ett elegant och tilltalande paket. Visst påminner den mycket om Microsofts Surface Pro 4, men vi förväntar oss inte att Dell ska frångå ett framgångsrikt koncept bara för att bryta normen.
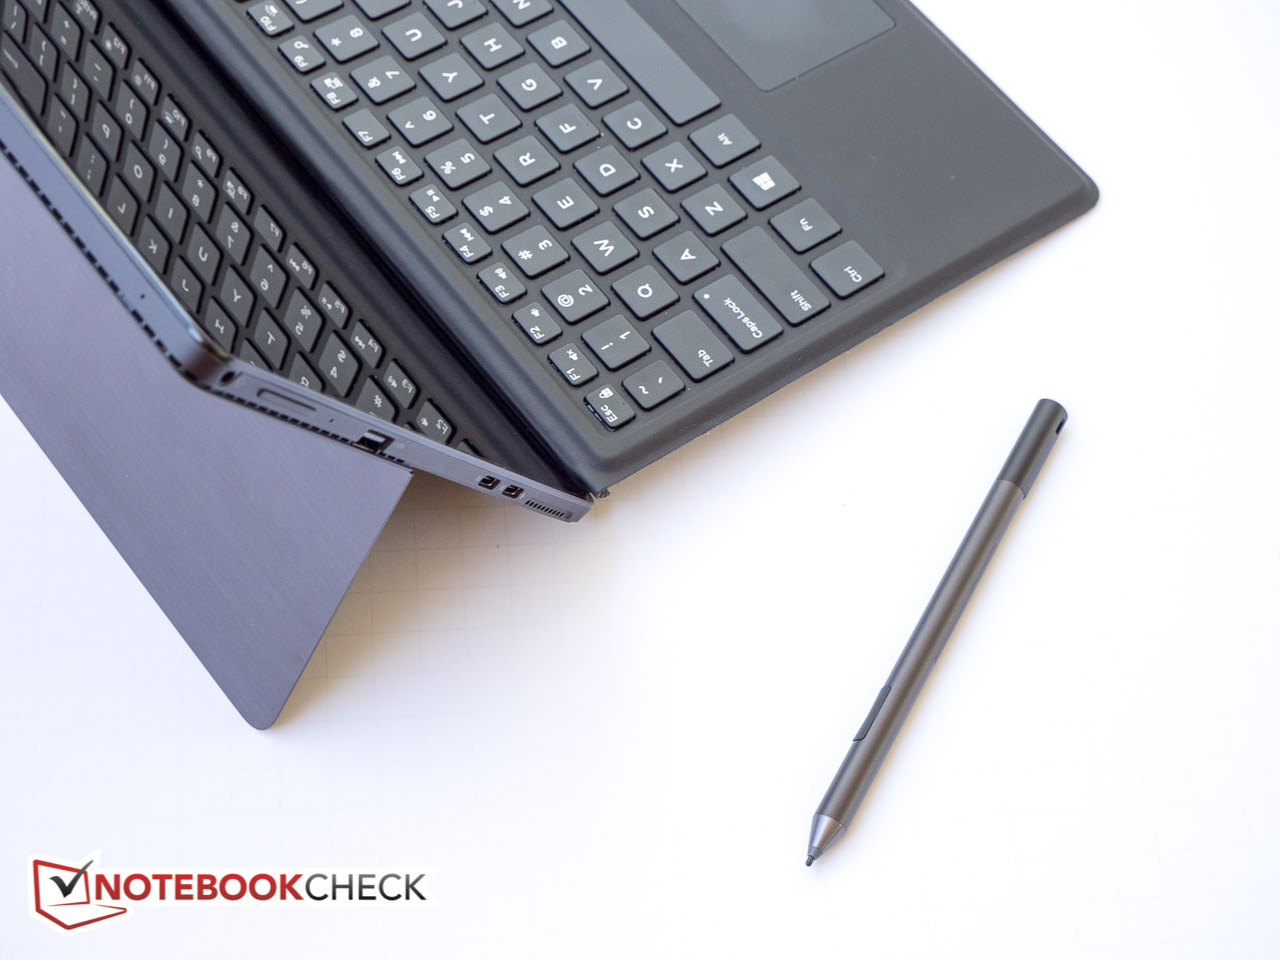
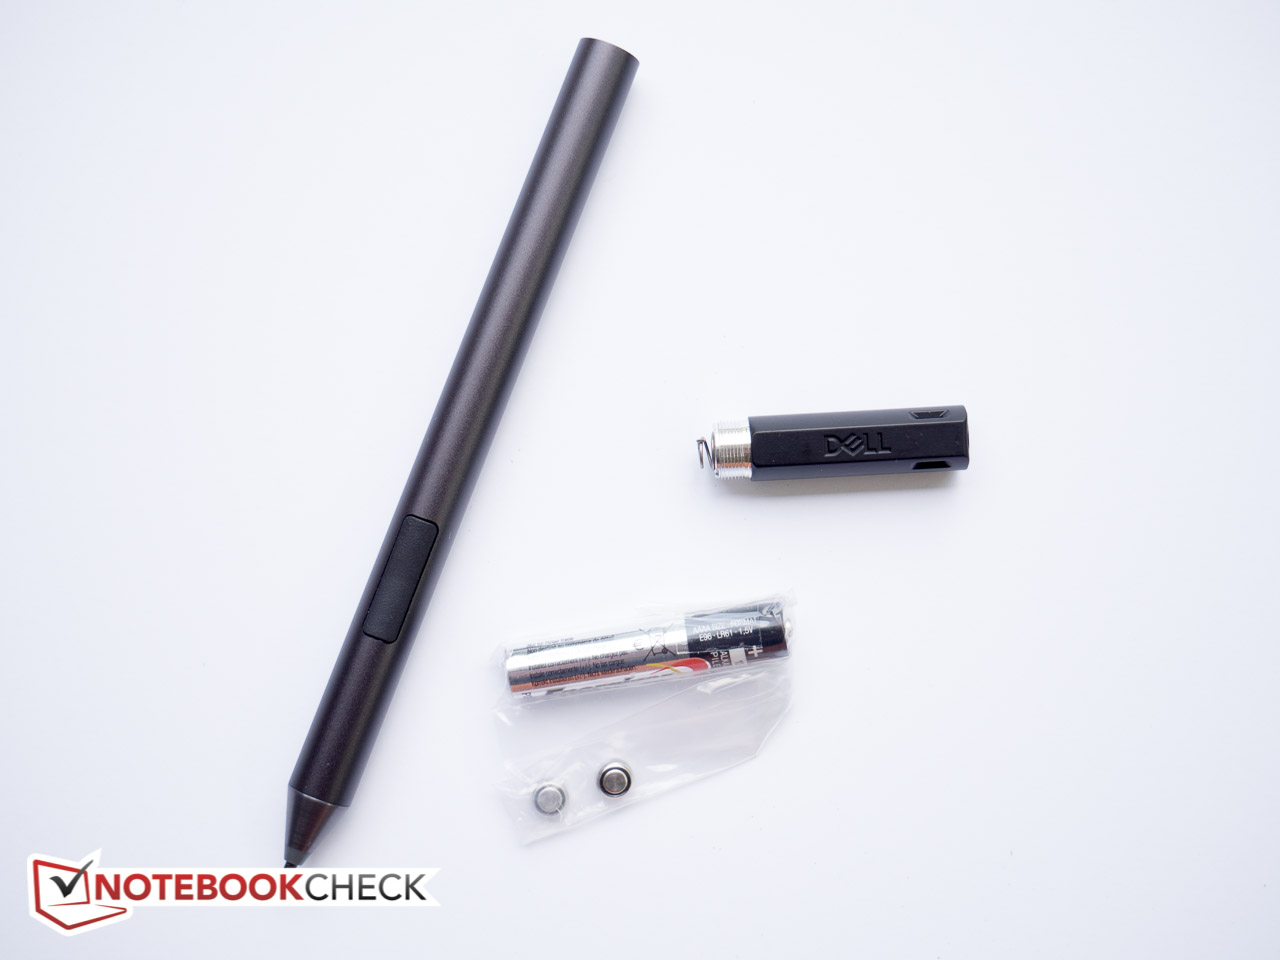
Det inkluderade tangentbordet Travel Keyboard känns bra och har även tvåstegs bakgrundsbelysning. Active Stylus fungerar mycket bra som en extra inmatningsenhet och kan erbjuda extra funktionalitet som snabbstart av Microsoft OneNote och andra program.
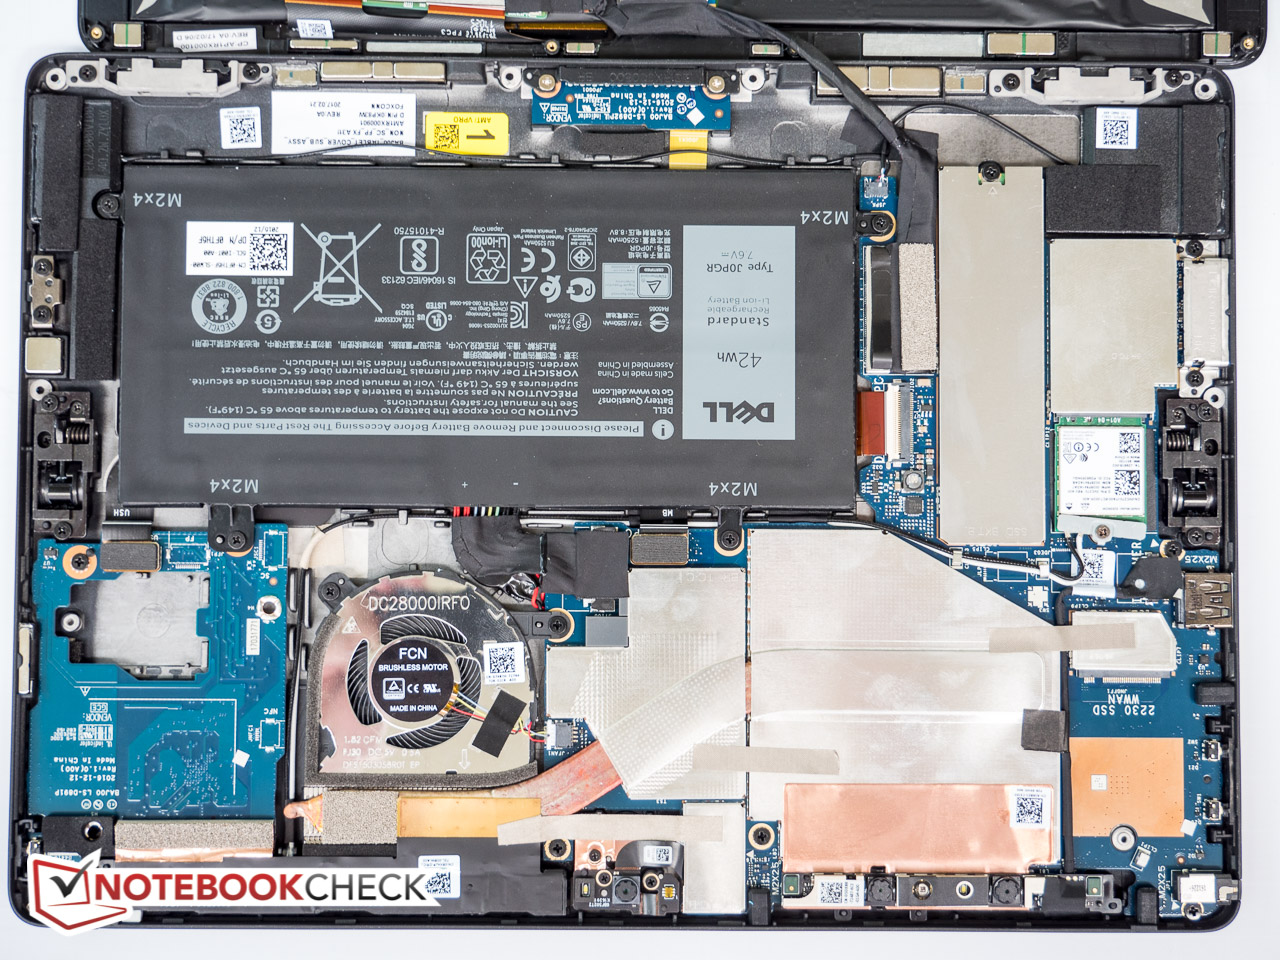
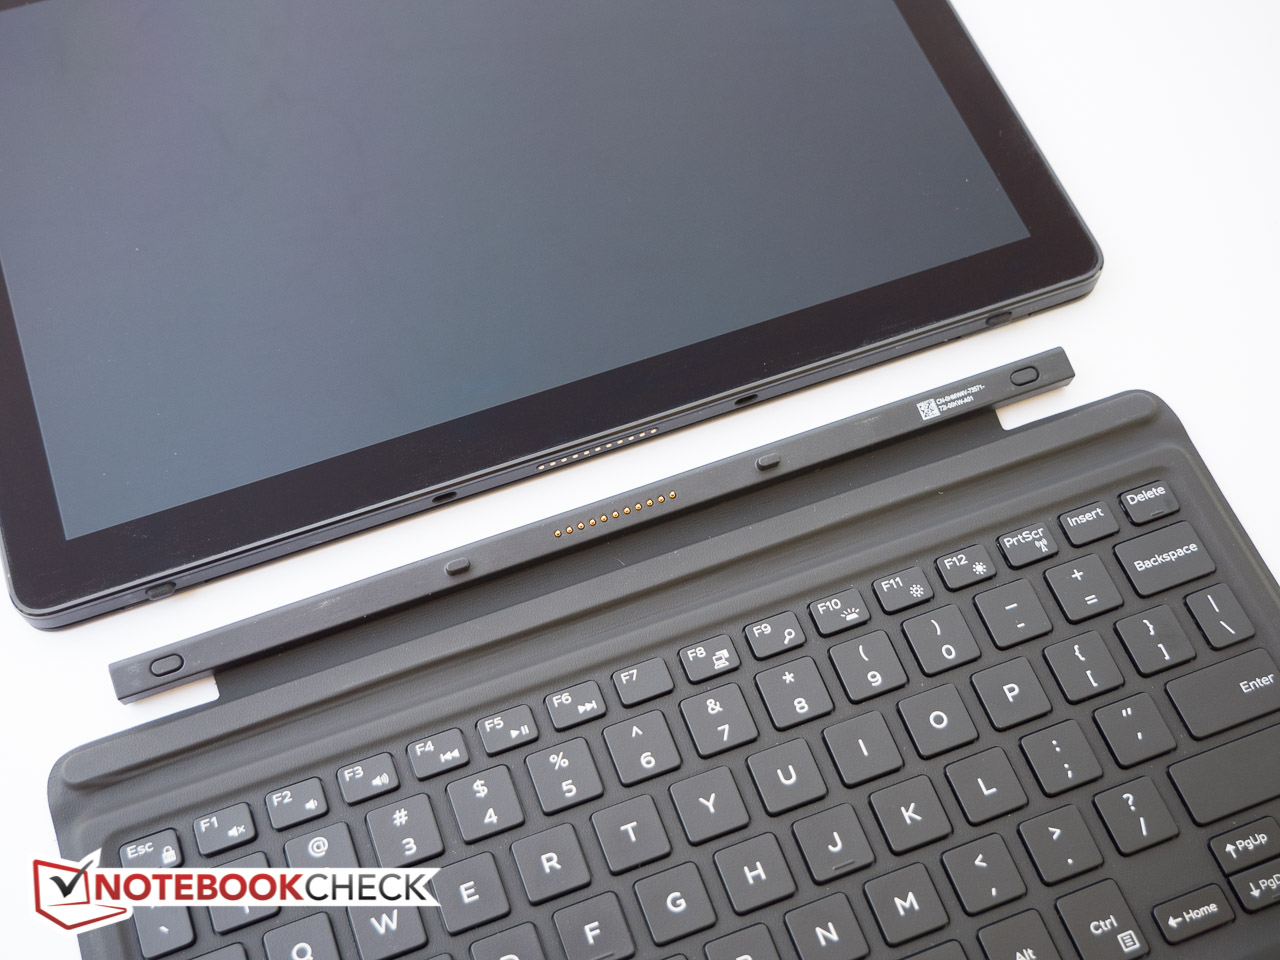
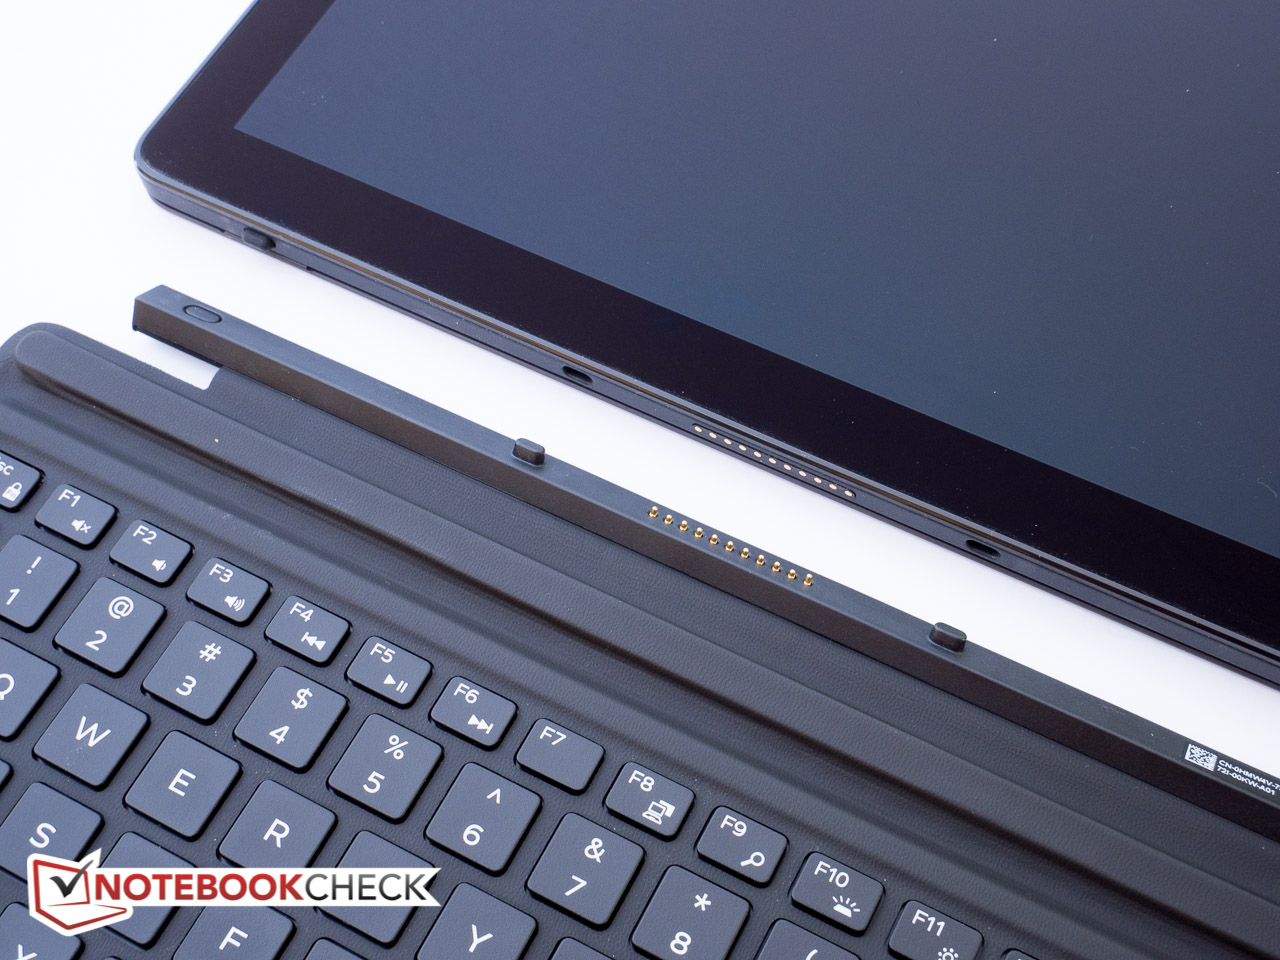
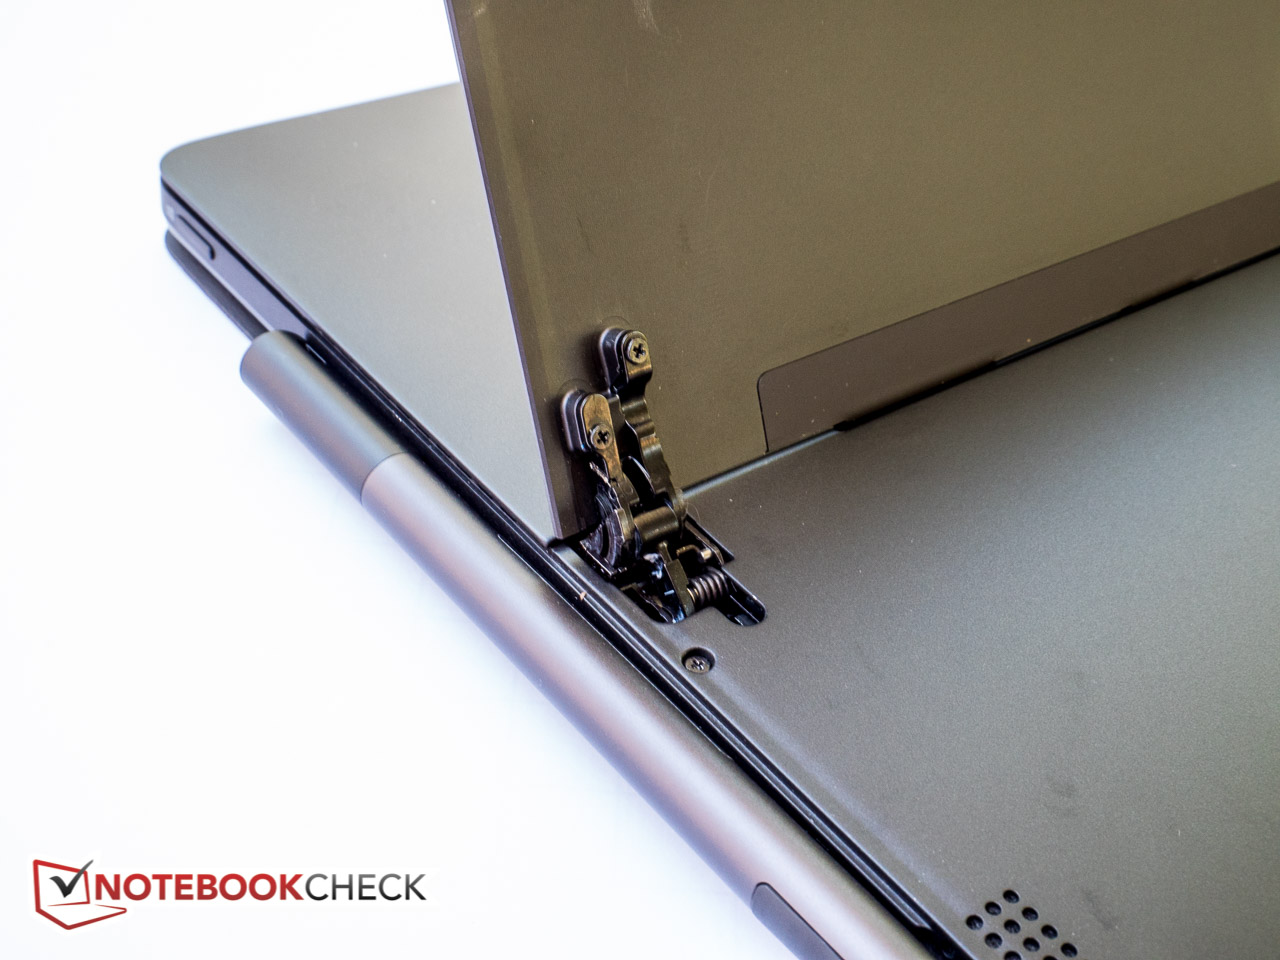
Dellmaskinen skiljer sig från konkurrensen på några punkter: För det första är skärmupplösningen lägre – vilket inte är något vi ser som en väsentlig nackdel med tanke på Latitudes företagsfokus. Skärmen är även extremt ljusstark. Dessutom är 2-i-1-hårdvaran ganska lätt att komma åt och underhålla, vilket alltid har varit en akilleshäl för formfaktorn.
Saker som vi uppskattar desto mindre är att Latitude 12 5285 blir mycket varm under belastning och att den väger något mer än konkurrenterna. En Thunderbolt 3-port hade heller inte skadat. Datorn råkar också vara riktigt dyr, vilket kan göra alternativ som Asus Transformer 3 Pro eller den vattenkylda Acer Aspire Switch Alpha 12 mer tilltalande – trots deras mycket kortare batteritid. Microsoft Surface Pro 4 är fortfarande ett bra val också, särskilt versionen med Core i5 och 256 GB SSD, som för närvarande säljs för ett konkurrenskraftigt pris.
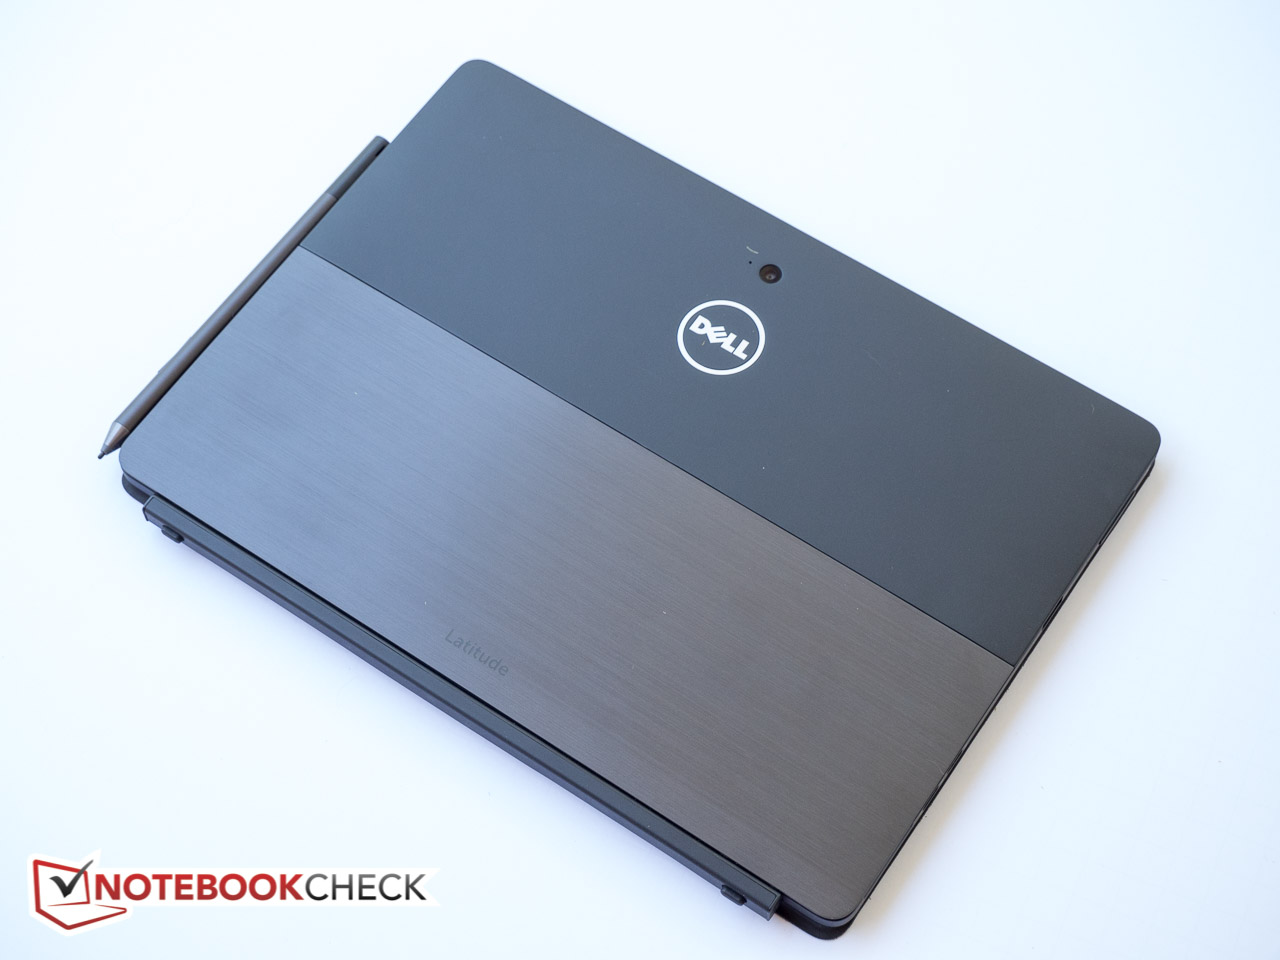
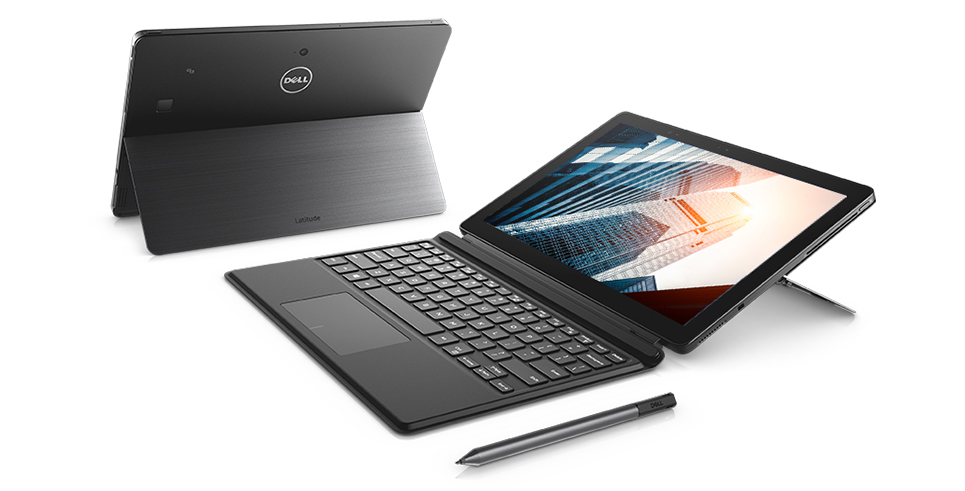
Dell Latitude 12 5285 2-in-1
- 05/06/2017 v6 (old)
Bernhard Pechlaner
Price comparison
