Test: Panasonic Toughbook CF-XZ6 Omvandlingsbar (Sammanfattning)

| SD Card Reader | |
| average JPG Copy Test (av. of 3 runs) | |
| Microsoft Surface Book 2 (Toshiba Exceria Pro SDXC 64 GB UHS-II) | |
| Panasonic Toughbook CF-XZ6 (Toshiba Exceria Pro SDXC 64 GB UHS-II) | |
| HP Elite x2 1012 G2-1LV76EA (Toshiba Exceria Pro M501) | |
| Lenovo ThinkPad X1 Tablet Gen 2 (Toshiba Exceria Pro SDXC 64 GB UHS-II) | |
| Microsoft Surface Pro (2017) i7 (Toshiba Exceria Pro M401 64 GB) | |
| Dell Latitude 7285 (Toshiba Exceria Pro M501) | |
| maximum AS SSD Seq Read Test (1GB) | |
| Panasonic Toughbook CF-XZ6 (Toshiba Exceria Pro SDXC 64 GB UHS-II) | |
| Microsoft Surface Book 2 (Toshiba Exceria Pro SDXC 64 GB UHS-II) | |
| Lenovo ThinkPad X1 Tablet Gen 2 (Toshiba Exceria Pro SDXC 64 GB UHS-II) | |
| HP Elite x2 1012 G2-1LV76EA (Toshiba Exceria Pro M501) | |
| Microsoft Surface Pro (2017) i7 (Toshiba Exceria Pro M401 64 GB) | |
| Dell Latitude 7285 (Toshiba Exceria Pro M501) | |
| Networking | |
| iperf3 transmit AX12 | |
| Panasonic Toughbook CF-XZ6 | |
| Dell Latitude 7285 | |
| Microsoft Surface Book 2 | |
| Lenovo ThinkPad X1 Tablet Gen 2 | |
| HP Elite x2 1012 G2-1LV76EA | |
| iperf3 receive AX12 | |
| Dell Latitude 7285 | |
| Lenovo ThinkPad X1 Tablet Gen 2 | |
| HP Elite x2 1012 G2-1LV76EA | |
| Microsoft Surface Book 2 | |
| Panasonic Toughbook CF-XZ6 | |
Skärmflimmer / PWM (Puls-Width Modulation)
| Skärmflimmer / PWM upptäckt | 694 Hz | ≤ 90 % ljusstyrka inställning | 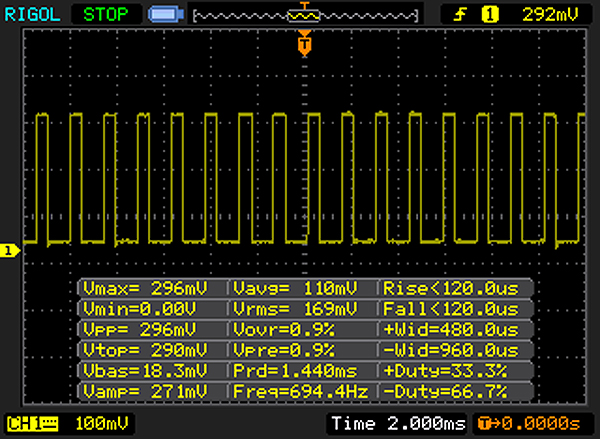 |
Displayens bakgrundsbelysning flimrar vid 694 Hz (i värsta fall, t.ex. med PWM) Flimrande upptäckt vid en ljusstyrkeinställning på 90 % och lägre. Det ska inte finnas något flimmer eller PWM över denna ljusstyrkeinställning. Frekvensen för 694 Hz är ganska hög, så de flesta användare som är känsliga för PWM bör inte märka något flimmer. Som jämförelse: 52 % av alla testade enheter använder inte PWM för att dämpa skärmen. Om PWM upptäcktes mättes ett medelvärde av 7748 (minst: 5 - maximum: 343500) Hz. | |||
| |||||||||||||||||||||||||
Distribution av ljusstyrkan: 82 %
Mitt på batteriet: 565 cd/m²
Kontrast: 1413:1 (Svärta: 0.4 cd/m²)
ΔE ColorChecker Calman: 5.06 | ∀{0.5-29.43 Ø4.71}
ΔE Greyscale Calman: 6.4 | ∀{0.09-98 Ø4.96}
70% sRGB (Argyll 1.6.3 3D)
44% AdobeRGB 1998 (Argyll 1.6.3 3D)
48.01% AdobeRGB 1998 (Argyll 3D)
70% sRGB (Argyll 3D)
46.47% Display P3 (Argyll 3D)
Gamma: 2.25
CCT: 5794 K
| Panasonic Toughbook CF-XZ6 Semi-Matte Beschichtung, , 2160x1440, 12" | Microsoft Surface Book 2 Panasonic MEI96A2 , , 3000x2000, 13.5" | Dell Latitude 7285 SHP1482 (LQ123Z1), , 2880x1920, 12.3" | Microsoft Surface Pro (2017) i7 LG Display LP123WQ112604, , 2736x1824, 12.3" | Lenovo ThinkPad X1 Tablet Gen 2 LSN120QL01L01, , 2160x1440, 12" | HP Elite x2 1012 G2-1LV76EA Samsung SDC4A49, , 2716x1824, 12.3" | |
|---|---|---|---|---|---|---|
| Display | 43% | 52% | 41% | 42% | ||
| Display P3 Coverage (%) | 46.47 | 67.9 46% | 73.3 58% | 66.6 43% | 66.7 44% | |
| sRGB Coverage (%) | 70 | 95.7 37% | 99.8 43% | 96.5 38% | 98 40% | |
| AdobeRGB 1998 Coverage (%) | 48.01 | 69.4 45% | 74.1 54% | 67.8 41% | 68.7 43% | |
| Response Times | -18% | -7% | 11% | 26% | 6% | |
| Response Time Grey 50% / Grey 80% * (ms) | 39 ? | 52.8 ? -35% | 44 ? -13% | 37 ? 5% | 28.4 ? 27% | 45.6 ? -17% |
| Response Time Black / White * (ms) | 30 ? | 30 ? -0% | 30.4 ? -1% | 25 ? 17% | 22.8 ? 24% | 21.6 ? 28% |
| PWM Frequency (Hz) | 694 ? | 922 ? | 22130 ? | 221.2 ? | 2119 ? | |
| Screen | 30% | 18% | 9% | -3% | 18% | |
| Brightness middle (cd/m²) | 565 | 385 -32% | 531 -6% | 482 -15% | 388.1 -31% | 443 -22% |
| Brightness (cd/m²) | 538 | 372 -31% | 490 -9% | 466 -13% | 344 -36% | 446 -17% |
| Brightness Distribution (%) | 82 | 89 9% | 86 5% | 92 12% | 78 -5% | 88 7% |
| Black Level * (cd/m²) | 0.4 | 0.21 48% | 0.37 7% | 0.395 1% | 0.39 2% | 0.41 -2% |
| Contrast (:1) | 1413 | 1833 30% | 1435 2% | 1220 -14% | 995 -30% | 1080 -24% |
| Colorchecker dE 2000 * | 5.06 | 1.6 68% | 3.5 31% | 4 21% | 4.6 9% | 2.6 49% |
| Colorchecker dE 2000 max. * | 8.1 | 4.5 44% | 6.2 23% | 7.2 11% | 9.1 -12% | 4 51% |
| Greyscale dE 2000 * | 6.4 | 1.5 77% | 4.7 27% | 5.7 11% | 6.1 5% | 3 53% |
| Gamma | 2.25 98% | 2.22 99% | 2.04 108% | 2.28 96% | 2.07 106% | 2.38 92% |
| CCT | 5794 112% | 6502 100% | 6581 99% | 7950 82% | 7104 91% | 6780 96% |
| Color Space (Percent of AdobeRGB 1998) (%) | 44 | 64 45% | 67.6 54% | 62 41% | 59 34% | 62.6 42% |
| Color Space (Percent of sRGB) (%) | 70 | 95.9 37% | 99.8 43% | 96 37% | 91 30% | 98 40% |
| Totalt genomsnitt (program/inställningar) | 18% /
26% | 21% /
21% | 20% /
16% | 12% /
1% | 22% /
21% |
* ... mindre är bättre
Visa svarstider
| ↔ Svarstid svart till vitt | ||
|---|---|---|
| 30 ms ... stiga ↗ och falla ↘ kombinerat | ↗ 18 ms stiga | 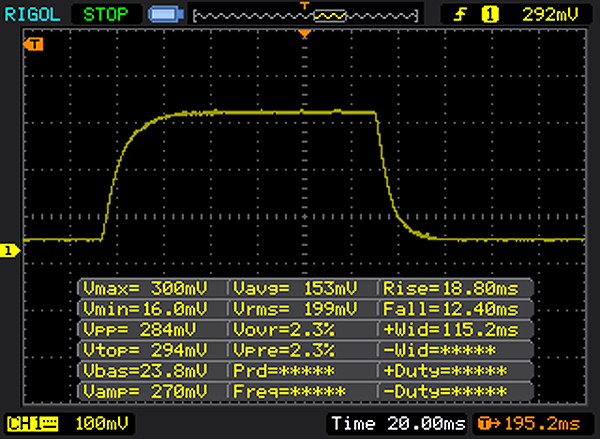 |
| ↘ 12 ms hösten | ||
| Skärmen visar långsamma svarsfrekvenser i våra tester och kommer att vara otillfredsställande för spelare. I jämförelse sträcker sig alla testade enheter från 0.1 (minst) till 240 (maximalt) ms. » 80 % av alla enheter är bättre. Detta innebär att den uppmätta svarstiden är sämre än genomsnittet av alla testade enheter (19.8 ms). | ||
| ↔ Svarstid 50 % grått till 80 % grått | ||
| 39 ms ... stiga ↗ och falla ↘ kombinerat | ↗ 21 ms stiga | 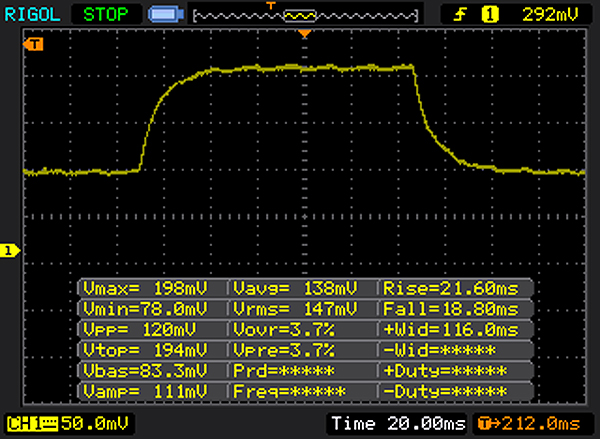 |
| ↘ 18 ms hösten | ||
| Skärmen visar långsamma svarsfrekvenser i våra tester och kommer att vara otillfredsställande för spelare. I jämförelse sträcker sig alla testade enheter från 0.165 (minst) till 636 (maximalt) ms. » 59 % av alla enheter är bättre. Detta innebär att den uppmätta svarstiden är sämre än genomsnittet av alla testade enheter (30.9 ms). | ||
| Cinebench R15 | |
| CPU Single 64Bit | |
| Microsoft Surface Book 2 | |
| Microsoft Surface Pro (2017) i7 | |
| Panasonic Toughbook CF-XZ6 | |
| Dell Latitude 7285 | |
| HP Elite x2 1012 G2-1LV76EA | |
| Lenovo ThinkPad X1 Tablet Gen 2 | |
| CPU Multi 64Bit | |
| Microsoft Surface Book 2 | |
| Microsoft Surface Pro (2017) i7 | |
| Panasonic Toughbook CF-XZ6 | |
| HP Elite x2 1012 G2-1LV76EA | |
| Dell Latitude 7285 | |
| Lenovo ThinkPad X1 Tablet Gen 2 | |
| PCMark 8 | |
| Home Score Accelerated v2 | |
| Microsoft Surface Pro (2017) i7 | |
| Microsoft Surface Book 2 | |
| Panasonic Toughbook CF-XZ6 | |
| HP Elite x2 1012 G2-1LV76EA | |
| Lenovo ThinkPad X1 Tablet Gen 2 | |
| Dell Latitude 7285 | |
| Work Score Accelerated v2 | |
| Microsoft Surface Book 2 | |
| Panasonic Toughbook CF-XZ6 | |
| Microsoft Surface Pro (2017) i7 | |
| Lenovo ThinkPad X1 Tablet Gen 2 | |
| HP Elite x2 1012 G2-1LV76EA | |
| Dell Latitude 7285 | |
| PCMark 8 Home Score Accelerated v2 | 3386 poäng | |
| PCMark 8 Work Score Accelerated v2 | 4503 poäng | |
| PCMark 10 Score | 3226 poäng | |
Hjälp | ||
| Panasonic Toughbook CF-XZ6 Samsung SSD PM871a MZNLN256HMHQ | Microsoft Surface Book 2 Samsung PM961 MZVLW256HEHP | Dell Latitude 7285 Toshiba KBG20ZMS256G | Microsoft Surface Pro (2017) i7 Samsung PM971 KUS040202M | Lenovo ThinkPad X1 Tablet Gen 2 Samsung PM961 MZVLW256HEHP | HP Elite x2 1012 G2-1LV76EA Samsung PM961 MZVLW256HEHP | |
|---|---|---|---|---|---|---|
| CrystalDiskMark 3.0 | 46% | 38% | 73% | 90% | 129% | |
| Read Seq (MB/s) | 499.9 | 1370 174% | 1017 103% | 1308 162% | 1739 248% | 1875 275% |
| Write Seq (MB/s) | 404.2 | 341.2 -16% | 587 45% | 961 138% | 1259 211% | 1261 212% |
| Read 512 (MB/s) | 423.5 | 654 54% | 756 79% | 227.5 -46% | 698 65% | 1235 192% |
| Write 512 (MB/s) | 355.6 | 337.9 -5% | 487.9 37% | 792 123% | 869 144% | 844 137% |
| Read 4k (MB/s) | 35.75 | 43.64 22% | 45.26 27% | 53.6 50% | 52.3 46% | 56.9 59% |
| Write 4k (MB/s) | 93 | 148.5 60% | 99.1 7% | 136.3 47% | 120 29% | 145.4 56% |
| Read 4k QD32 (MB/s) | 307 | 465.5 52% | 357.7 17% | 485.6 58% | 247.9 -19% | 398.3 30% |
| Write 4k QD32 (MB/s) | 273.9 | 337.1 23% | 253 -8% | 421.5 54% | 259 -5% | 472.5 73% |

| 3DMark 11 - 1280x720 Performance GPU | |
| Microsoft Surface Book 2 | |
| Microsoft Surface Pro (2017) i7 | |
| HP Elite x2 1012 G2-1LV76EA | |
| Panasonic Toughbook CF-XZ6 | |
| Dell Latitude 7285 | |
| Lenovo ThinkPad X1 Tablet Gen 2 | |
| 3DMark | |
| 1280x720 Cloud Gate Standard Graphics | |
| Microsoft Surface Book 2 | |
| Microsoft Surface Pro (2017) i7 | |
| HP Elite x2 1012 G2-1LV76EA | |
| Dell Latitude 7285 | |
| Panasonic Toughbook CF-XZ6 | |
| Lenovo ThinkPad X1 Tablet Gen 2 | |
| 1920x1080 Fire Strike Graphics | |
| Microsoft Surface Book 2 | |
| Microsoft Surface Pro (2017) i7 | |
| HP Elite x2 1012 G2-1LV76EA | |
| Dell Latitude 7285 | |
| Panasonic Toughbook CF-XZ6 | |
| Lenovo ThinkPad X1 Tablet Gen 2 | |
| 3DMark 11 Performance | 1552 poäng | |
| 3DMark Cloud Gate Standard Score | 5469 poäng | |
| 3DMark Fire Strike Score | 734 poäng | |
Hjälp | ||
| låg | med. | hög | ultra | |
|---|---|---|---|---|
| BioShock Infinite (2013) | 43.31 | 24.5 | ||
| Rise of the Tomb Raider (2016) | 16.08 | |||
| Civilization 6 (2016) | 17.28 |
Ljudnivå
| Låg belastning |
| 30.5 / 30.5 / 30.5 dB(A) |
| Hög belastning |
| 31.9 / 32.6 dB(A) |
 | ||
30 dB tyst 40 dB(A) hörbar 50 dB(A) högt ljud |
||
min: | ||
(+) Den maximala temperaturen på ovansidan är 37.6 °C / 100 F, jämfört med genomsnittet av 35.4 °C / 96 F , allt från 19.6 till 60 °C för klassen Convertible.
(+) Botten värms upp till maximalt 38.2 °C / 101 F, jämfört med genomsnittet av 36.9 °C / 98 F
(+) Vid tomgångsbruk är medeltemperaturen för ovansidan 30.3 °C / 87 F, jämfört med enhetsgenomsnittet på 30.3 °C / ### class_avg_f### F.
(+) Handledsstöden och pekplattan når maximal hudtemperatur (34.7 °C / 94.5 F) och är därför inte varma.
(-) Medeltemperaturen för handledsstödsområdet på liknande enheter var 28 °C / 82.4 F (-6.7 °C / -12.1 F).
Panasonic Toughbook CF-XZ6 ljudanalys
(-) | inte särskilt höga högtalare (63.1 dB)
Bas 100 - 315 Hz
(-) | nästan ingen bas - i genomsnitt 24.6% lägre än medianen
(+) | basen är linjär (3.3% delta till föregående frekvens)
Mellan 400 - 2000 Hz
(±) | reducerade mids - i genomsnitt 10.4% lägre än median
(-) | mids är inte linjära (16.2% delta till föregående frekvens)
Högsta 2 - 16 kHz
(±) | högre toppar - i genomsnitt 7.4% högre än medianen
(±) | linjäriteten för toppar är genomsnittlig (9.1% delta till föregående frekvens)
Totalt 100 - 16 000 Hz
(-) | det totala ljudet är inte linjärt (43.6% skillnad mot median)
Jämfört med samma klass
» 98% av alla testade enheter i den här klassen var bättre, 1% liknande, 1% sämre
» Den bästa hade ett delta på 6%, genomsnittet var 20%, sämst var 57%
Jämfört med alla testade enheter
» 96% av alla testade enheter var bättre, 0% liknande, 4% sämre
» Den bästa hade ett delta på 4%, genomsnittet var 23%, sämst var 134%
Microsoft Surface Book 2 ljudanalys
(±) | högtalarljudstyrkan är genomsnittlig men bra (74.2 dB)
Bas 100 - 315 Hz
(±) | reducerad bas - i genomsnitt 12.4% lägre än medianen
(±) | linjäriteten för basen är genomsnittlig (12.3% delta till föregående frekvens)
Mellan 400 - 2000 Hz
(+) | balanserad mellan - endast 1.9% från medianen
(+) | mids är linjära (3.6% delta till föregående frekvens)
Högsta 2 - 16 kHz
(+) | balanserade toppar - endast 4.8% från medianen
(±) | linjäriteten för toppar är genomsnittlig (9.3% delta till föregående frekvens)
Totalt 100 - 16 000 Hz
(±) | linjäriteten för det totala ljudet är genomsnittlig (18.2% skillnad mot median)
Jämfört med samma klass
» 40% av alla testade enheter i den här klassen var bättre, 7% liknande, 53% sämre
» Den bästa hade ett delta på 6%, genomsnittet var 20%, sämst var 57%
Jämfört med alla testade enheter
» 39% av alla testade enheter var bättre, 8% liknande, 53% sämre
» Den bästa hade ett delta på 4%, genomsnittet var 23%, sämst var 134%
| Av/Standby | |
| Låg belastning | |
| Hög belastning |
|
Förklaring:
min: | |
| Panasonic Toughbook CF-XZ6 i5-7300U, HD Graphics 620, Samsung SSD PM871a MZNLN256HMHQ, IPS LED, 2160x1440, 12" | Microsoft Surface Book 2 i7-8650U, GeForce GTX 1050 Mobile, Samsung PM961 MZVLW256HEHP, IPS, 3000x2000, 13.5" | Dell Latitude 7285 i5-7Y57, HD Graphics 615, Toshiba KBG20ZMS256G, IPS LED, 2880x1920, 12.3" | Microsoft Surface Pro (2017) i7 i7-7660U, Iris Plus Graphics 640, Samsung PM971 KUS040202M, IPS, 2736x1824, 12.3" | Lenovo ThinkPad X1 Tablet Gen 2 i5-7Y54, HD Graphics 615, Samsung PM961 MZVLW256HEHP, IPS, 2160x1440, 12" | HP Elite x2 1012 G2-1LV76EA i5-7200U, HD Graphics 620, Samsung PM961 MZVLW256HEHP, IPS, 2716x1824, 12.3" | |
|---|---|---|---|---|---|---|
| Power Consumption | -169% | -61% | -70% | -13% | -67% | |
| Idle Minimum * (Watt) | 3.15 | 4.7 -49% | 6.6 -110% | 4.2 -33% | 5 -59% | 4.1 -30% |
| Idle Average * (Watt) | 6 | 10.6 -77% | 9.3 -55% | 10.1 -68% | 6.3 -5% | 9.2 -53% |
| Idle Maximum * (Watt) | 6.3 | 12.3 -95% | 10.2 -62% | 14 -122% | 7.8 -24% | 11.1 -76% |
| Load Average * (Watt) | 21 | 81 -286% | 25.1 -20% | 37.4 -78% | 19.5 7% | 33.8 -61% |
| Load Maximum * (Watt) | 23 | 100.3 -336% | 36.1 -57% | 34 -48% | 19.6 15% | 49.2 -114% |
| Witcher 3 ultra * (Watt) | 97 | 38.1 |
* ... mindre är bättre
| Panasonic Toughbook CF-XZ6 i5-7300U, HD Graphics 620, 76 Wh | Microsoft Surface Book 2 i7-8650U, GeForce GTX 1050 Mobile, 75 Wh | Dell Latitude 7285 i5-7Y57, HD Graphics 615, 54 Wh | Microsoft Surface Pro (2017) i7 i7-7660U, Iris Plus Graphics 640, 45 Wh | Lenovo ThinkPad X1 Tablet Gen 2 i5-7Y54, HD Graphics 615, 37 Wh | HP Elite x2 1012 G2-1LV76EA i5-7200U, HD Graphics 620, 47 Wh | |
|---|---|---|---|---|---|---|
| Batteridrifttid | 6% | -34% | -31% | -42% | -41% | |
| Reader / Idle (h) | 22.1 | 24.5 11% | 17.2 -22% | 11 -50% | 13.9 -37% | |
| H.264 (h) | 11.8 | 15.6 32% | 6.2 -47% | 10.2 -14% | 6.3 -47% | |
| WiFi v1.3 (h) | 14 | 11.1 -21% | 6.5 -54% | 8.2 -41% | 7.4 -47% | 6.3 -55% |
| Load (h) | 3.1 | 3.2 3% | 2.7 -13% | 1.9 -39% | 2.2 -29% | 2.3 -26% |
| Witcher 3 ultra (h) | 3.8 | 1.9 |
För
Emot
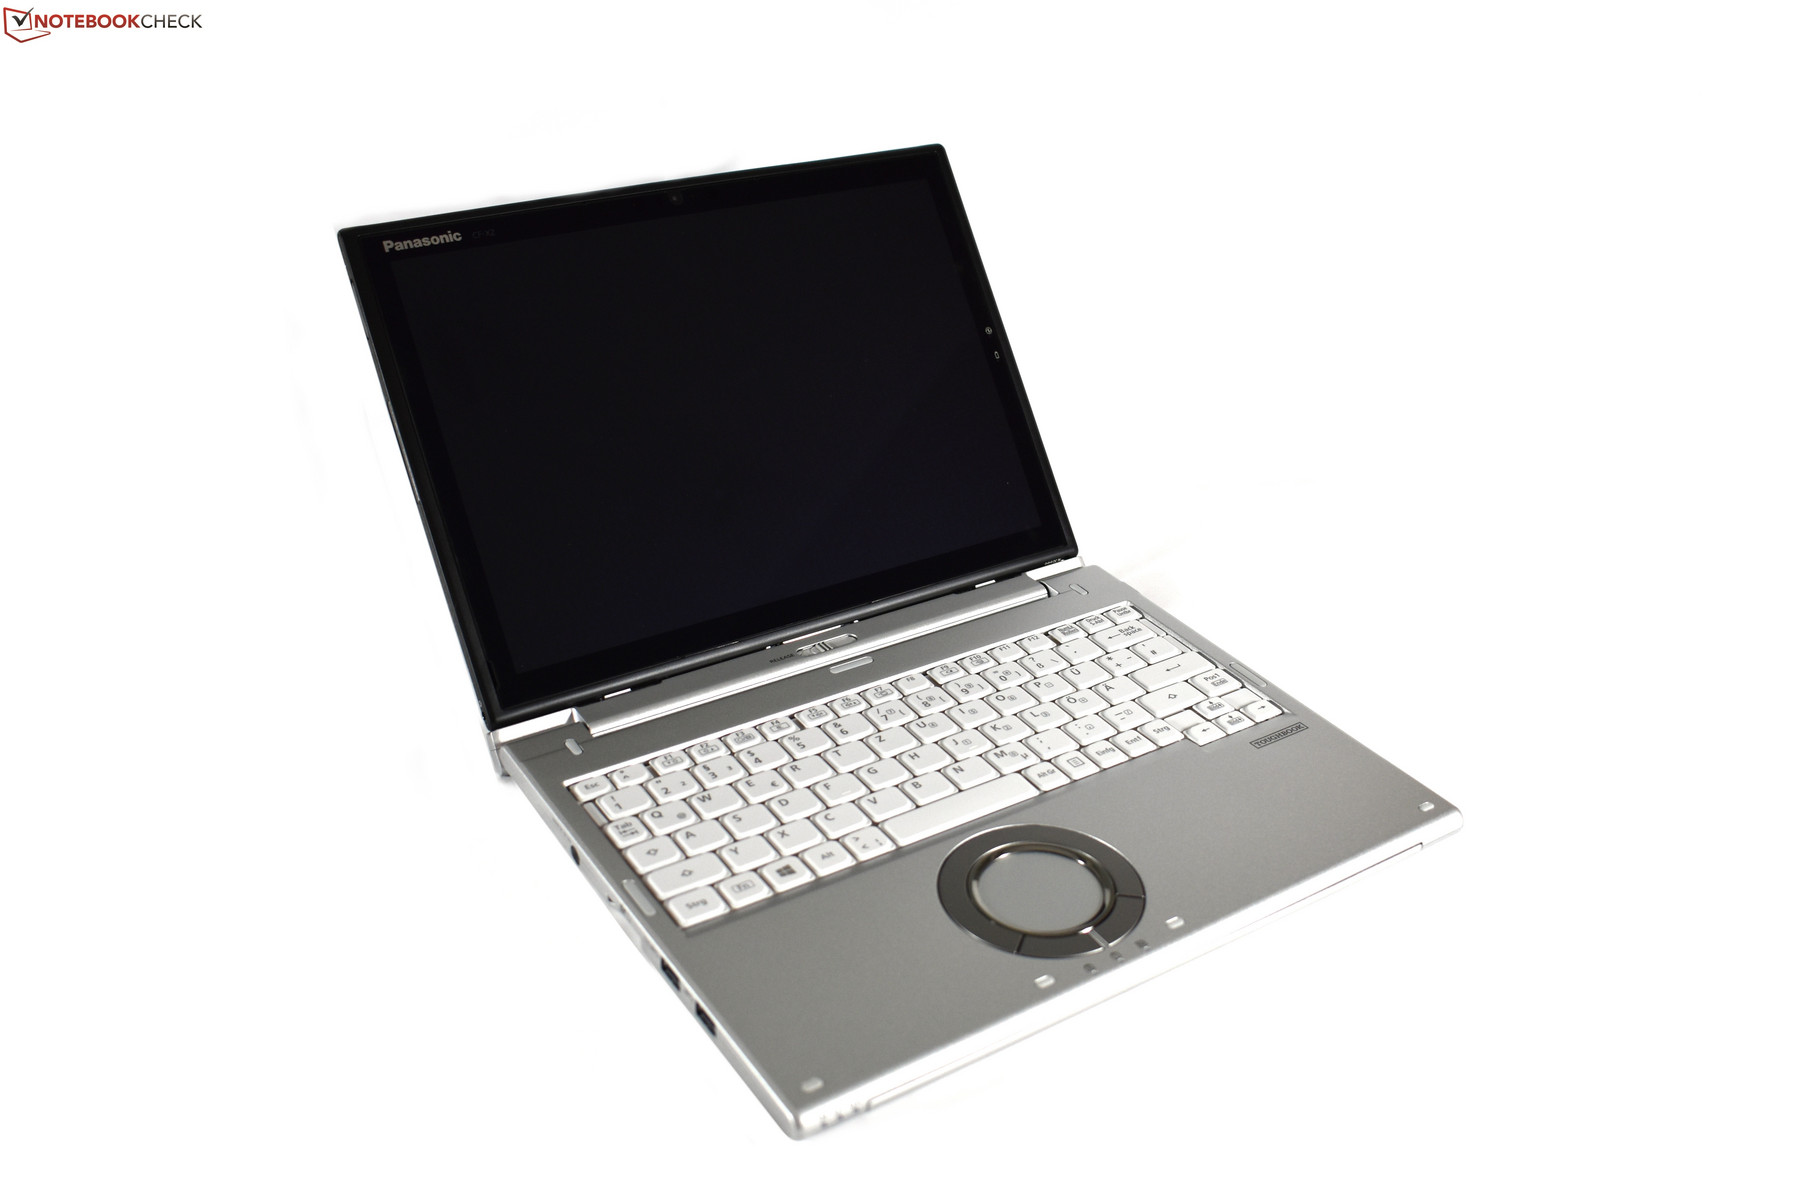
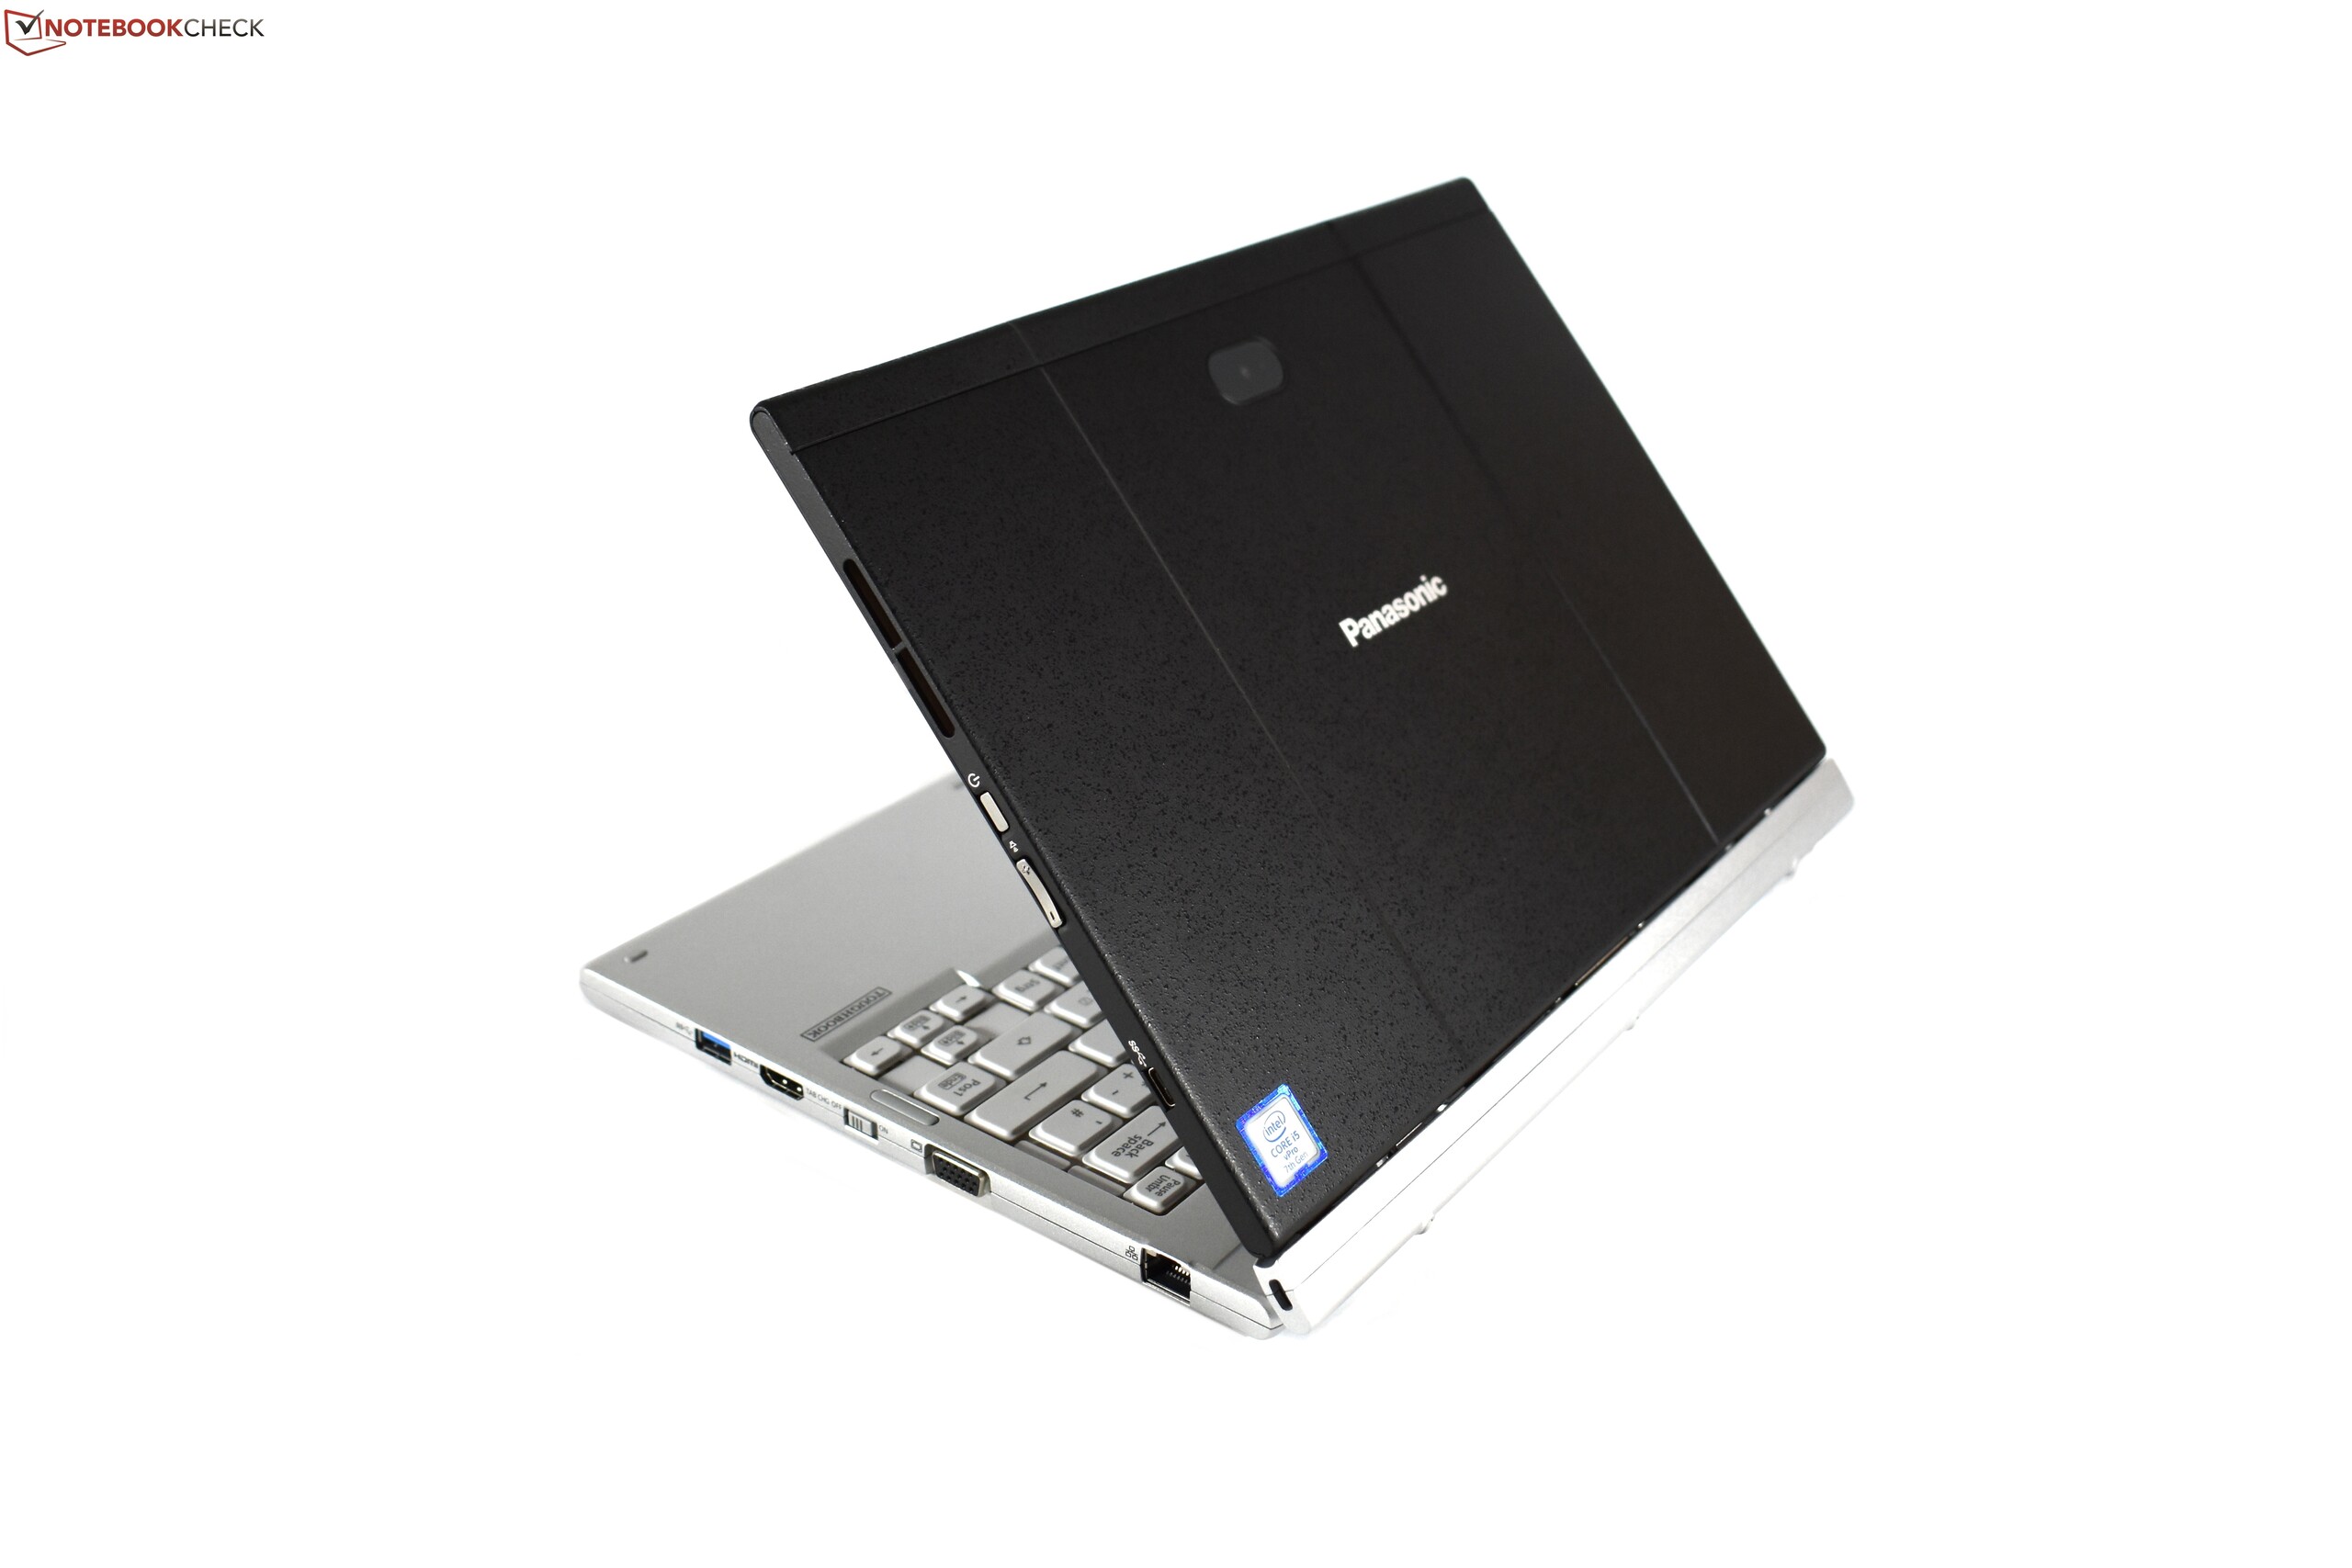
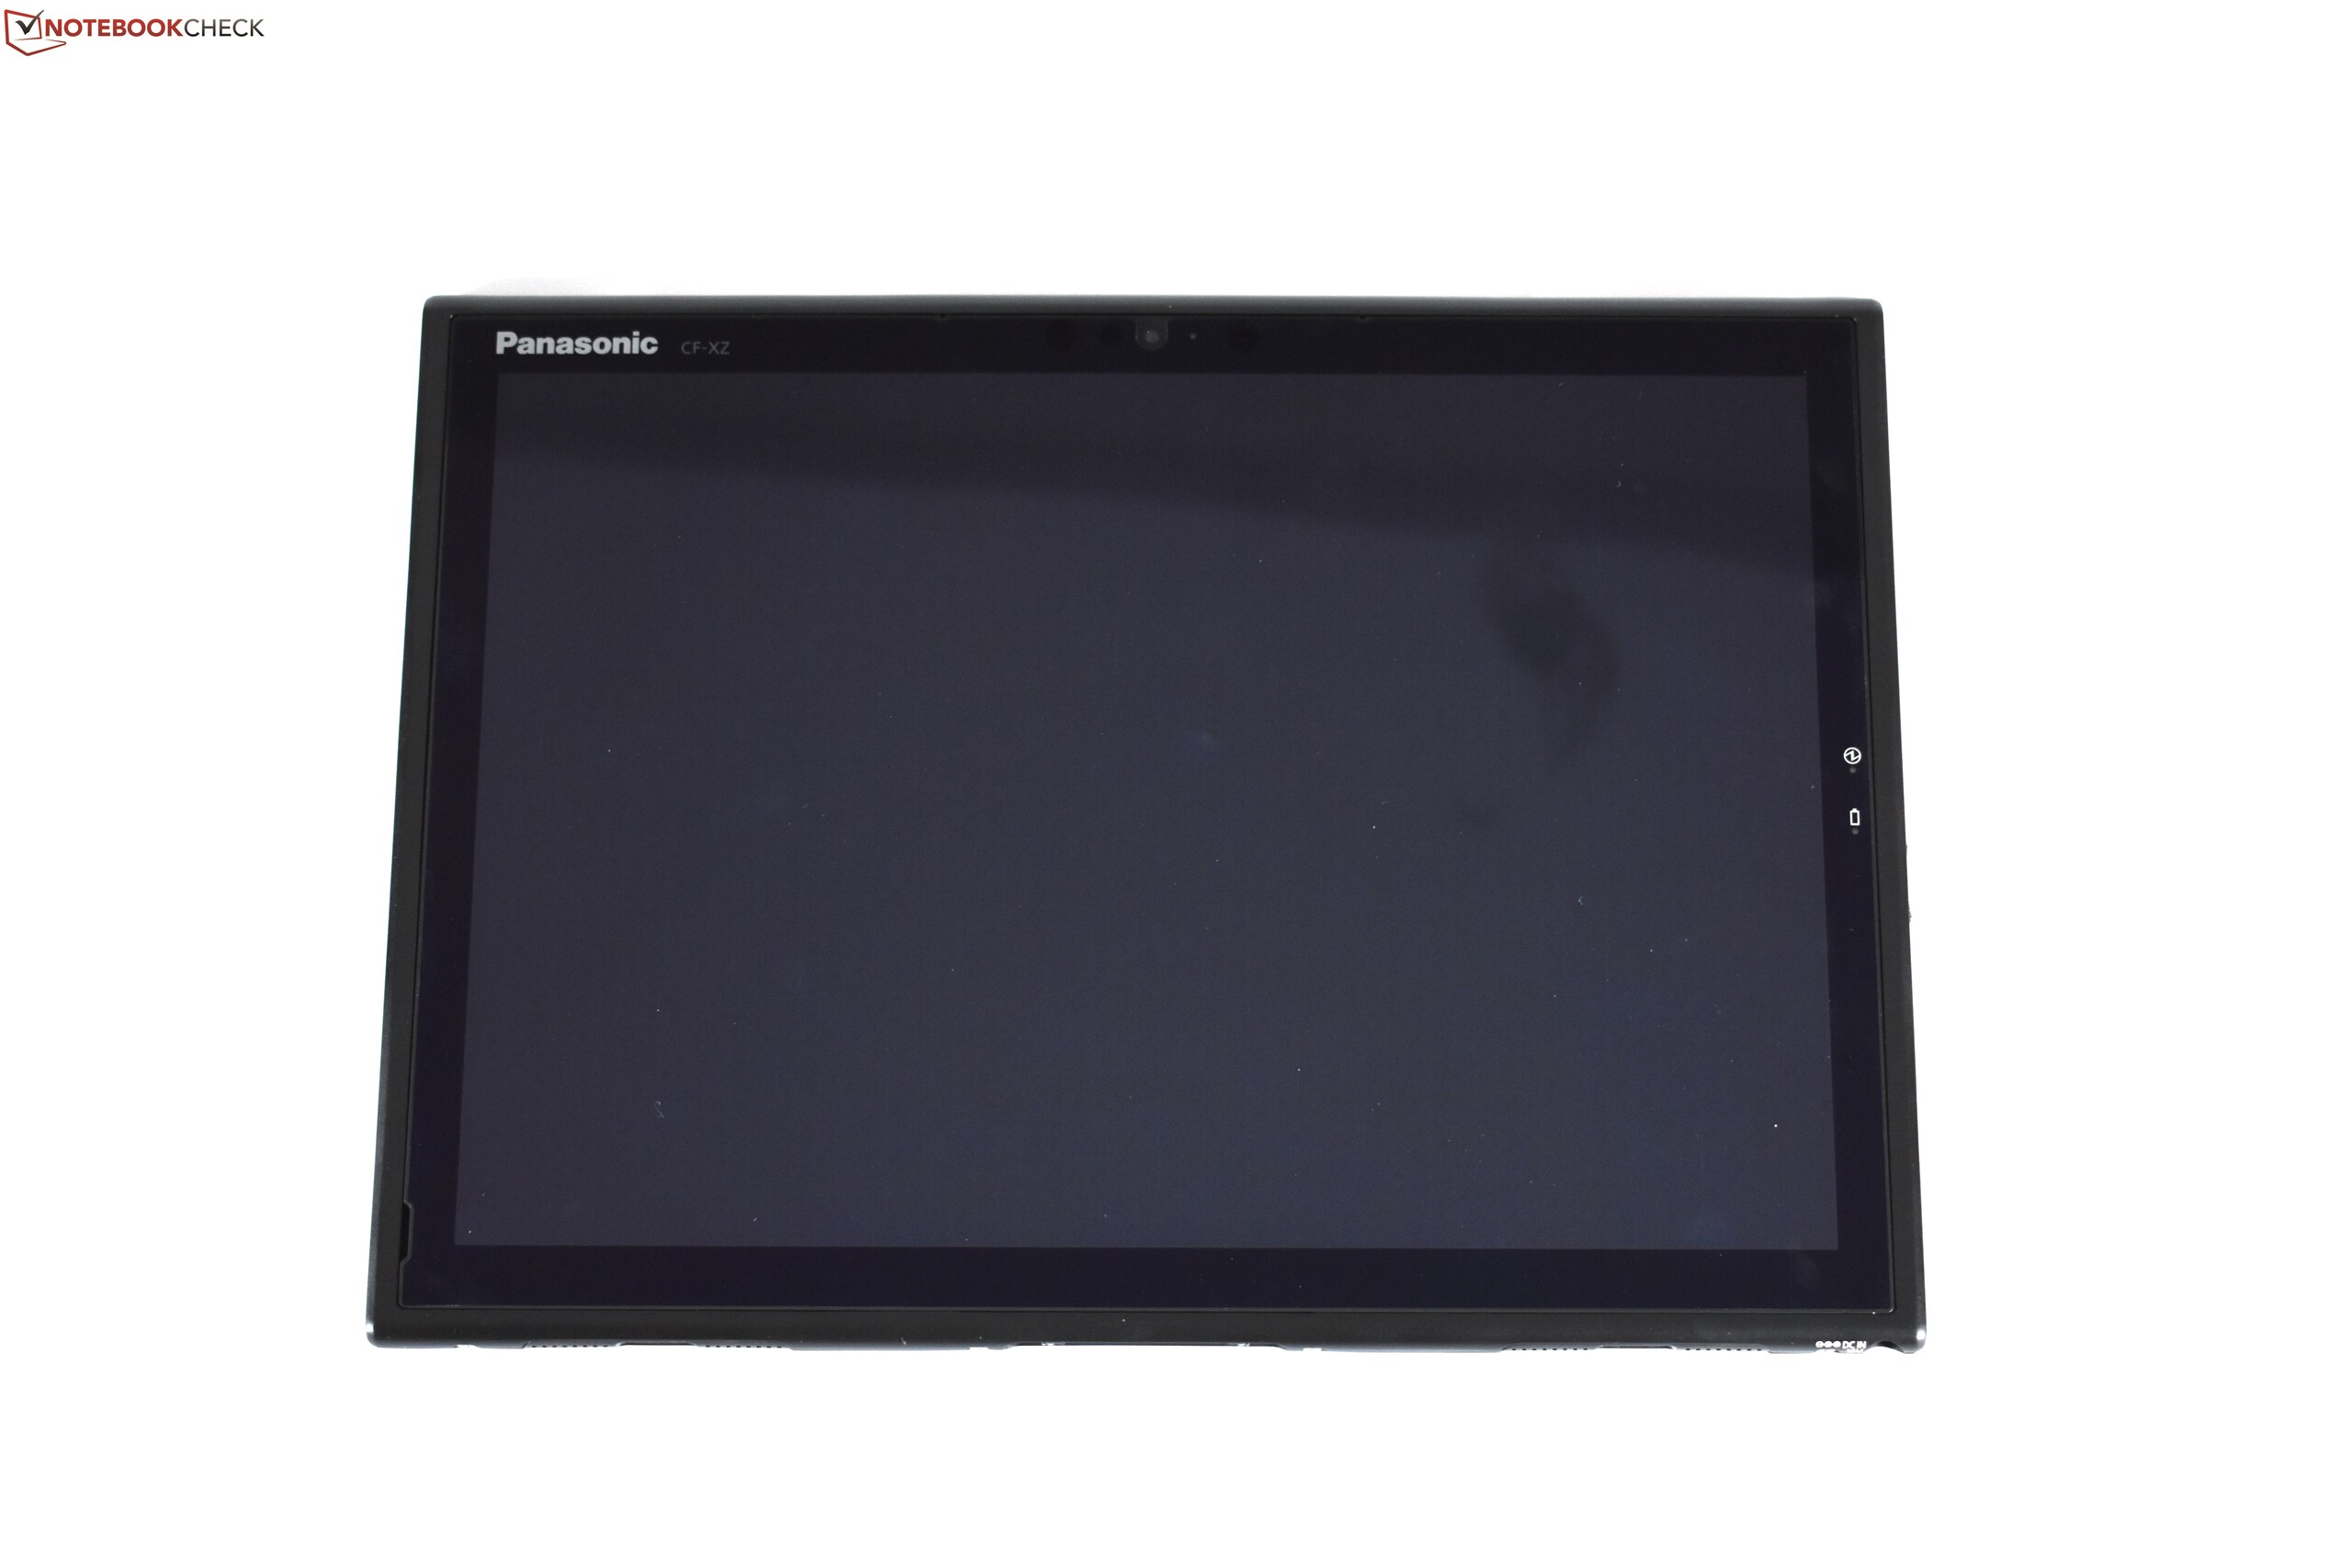
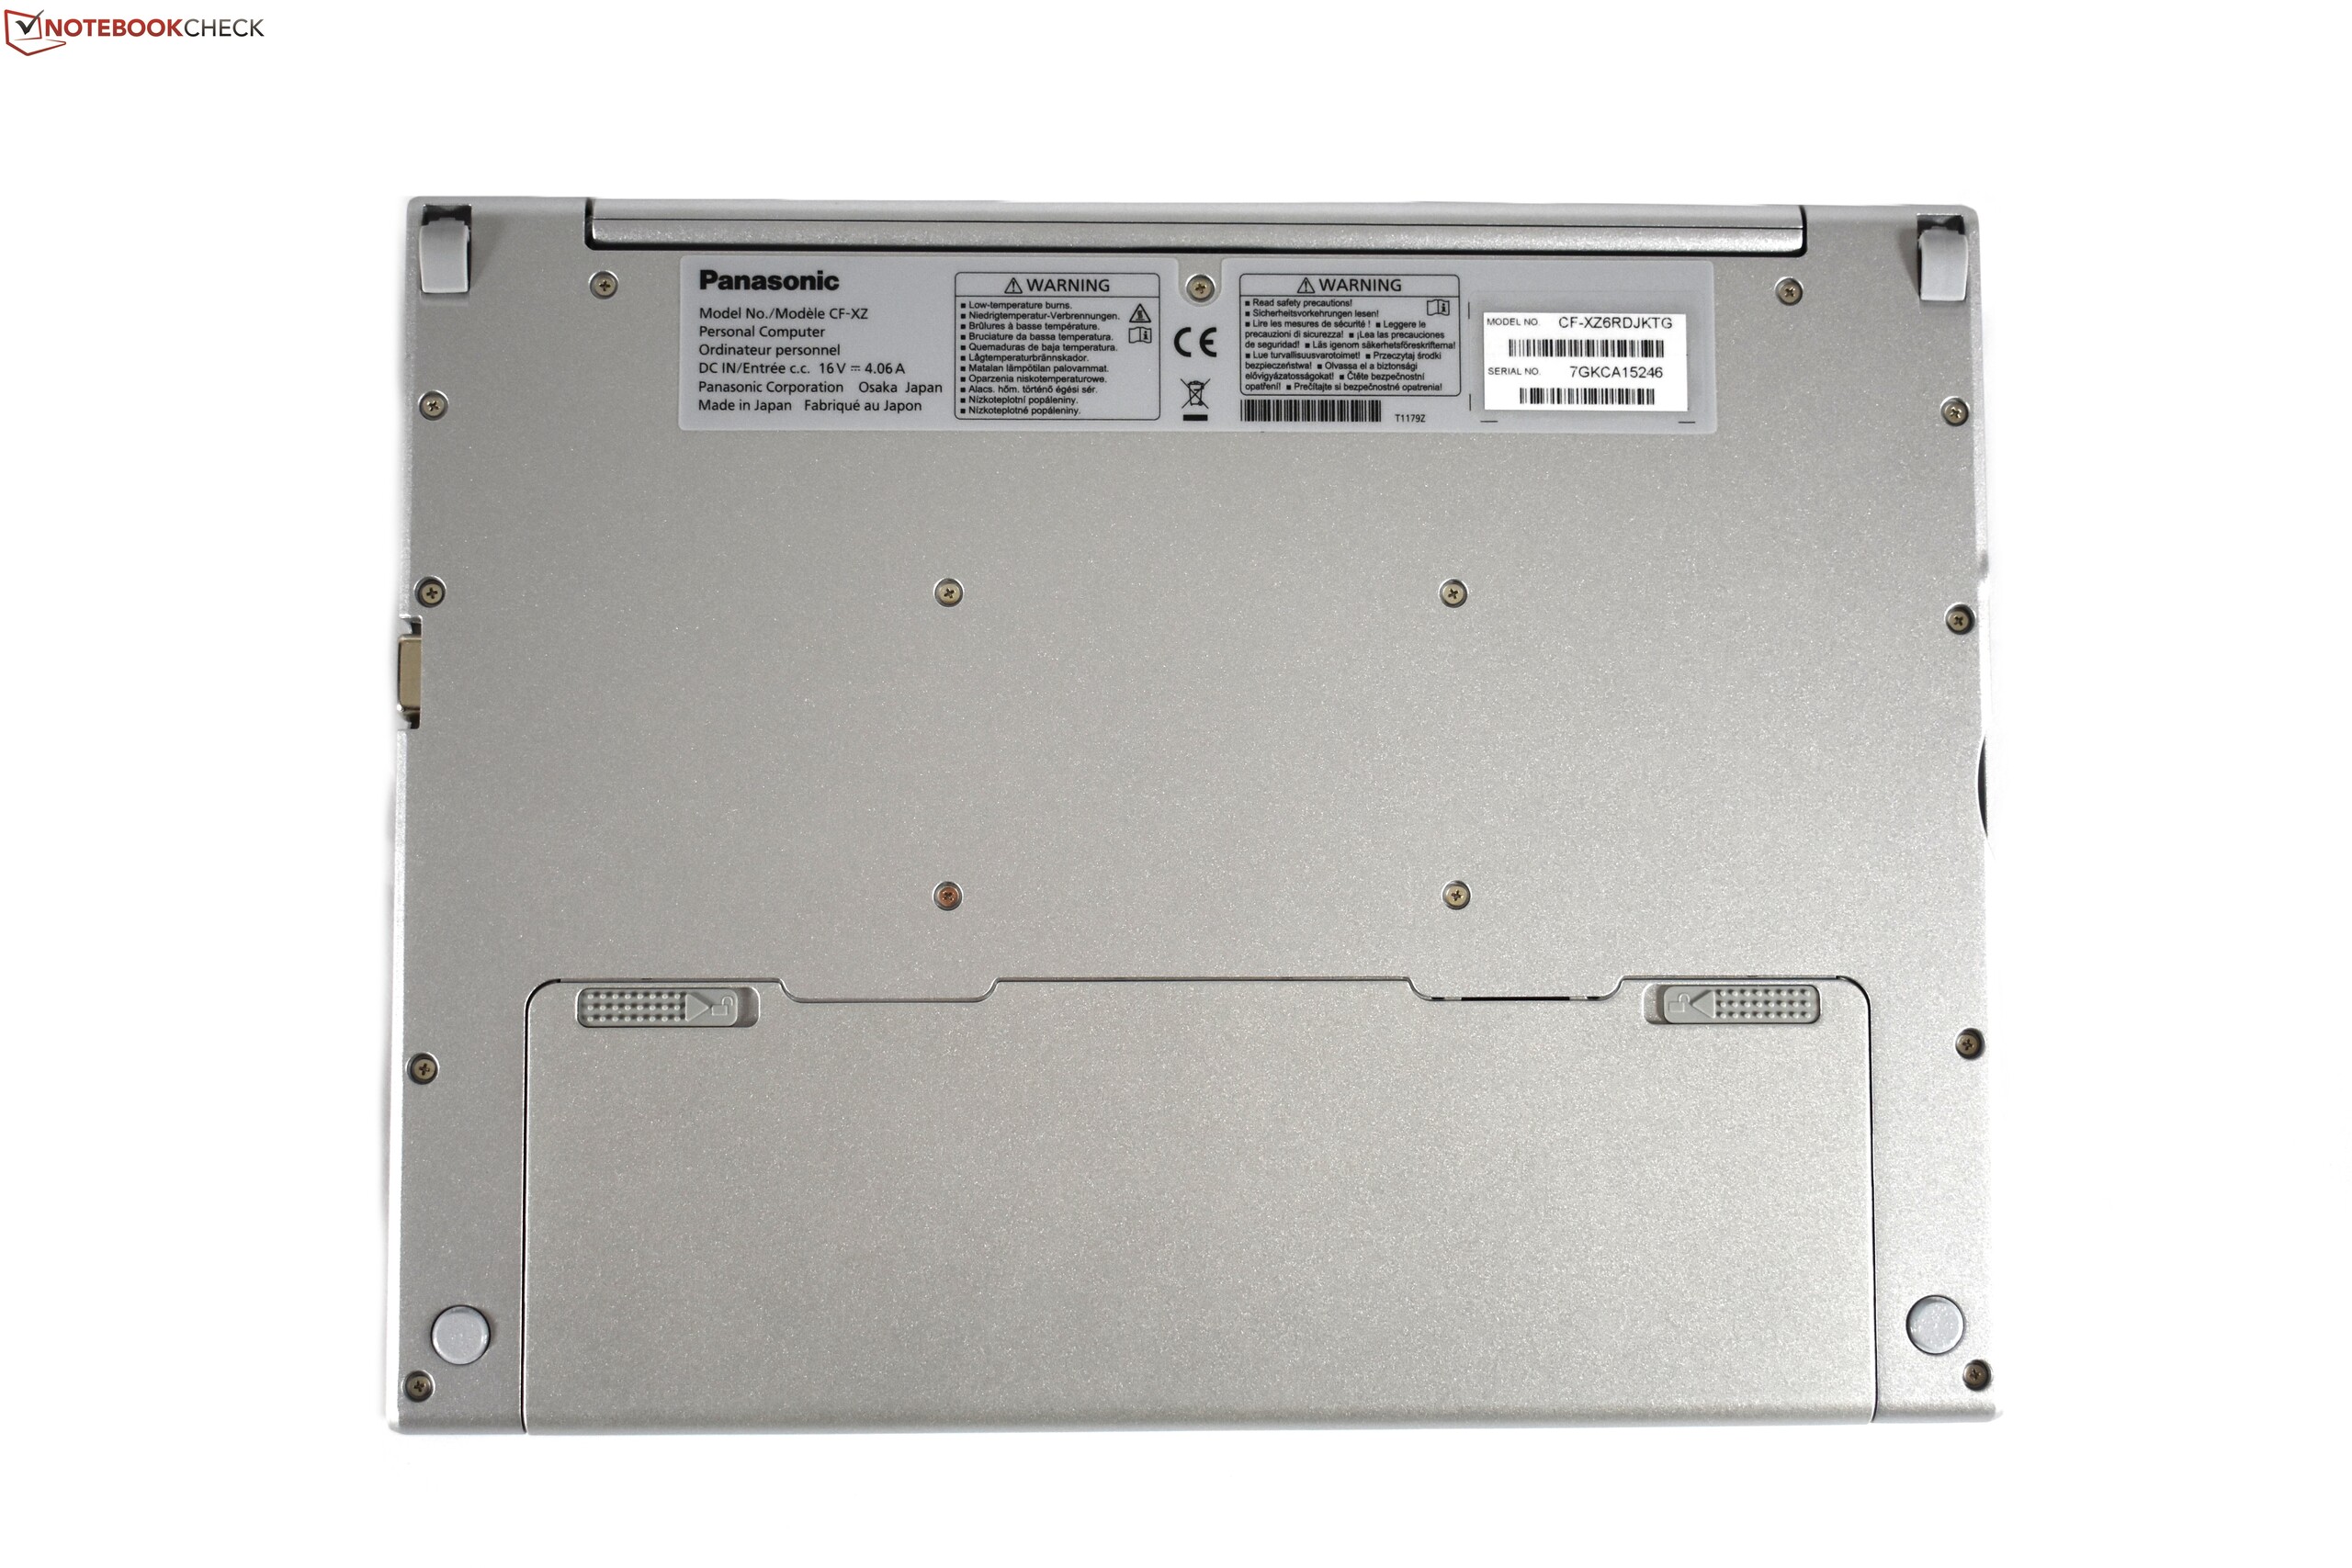
Panasonic Toughbook CF-XZ6 är en intressant löstagbar som har många utmärkta funktioner - men också en del stora svagheter och brister.
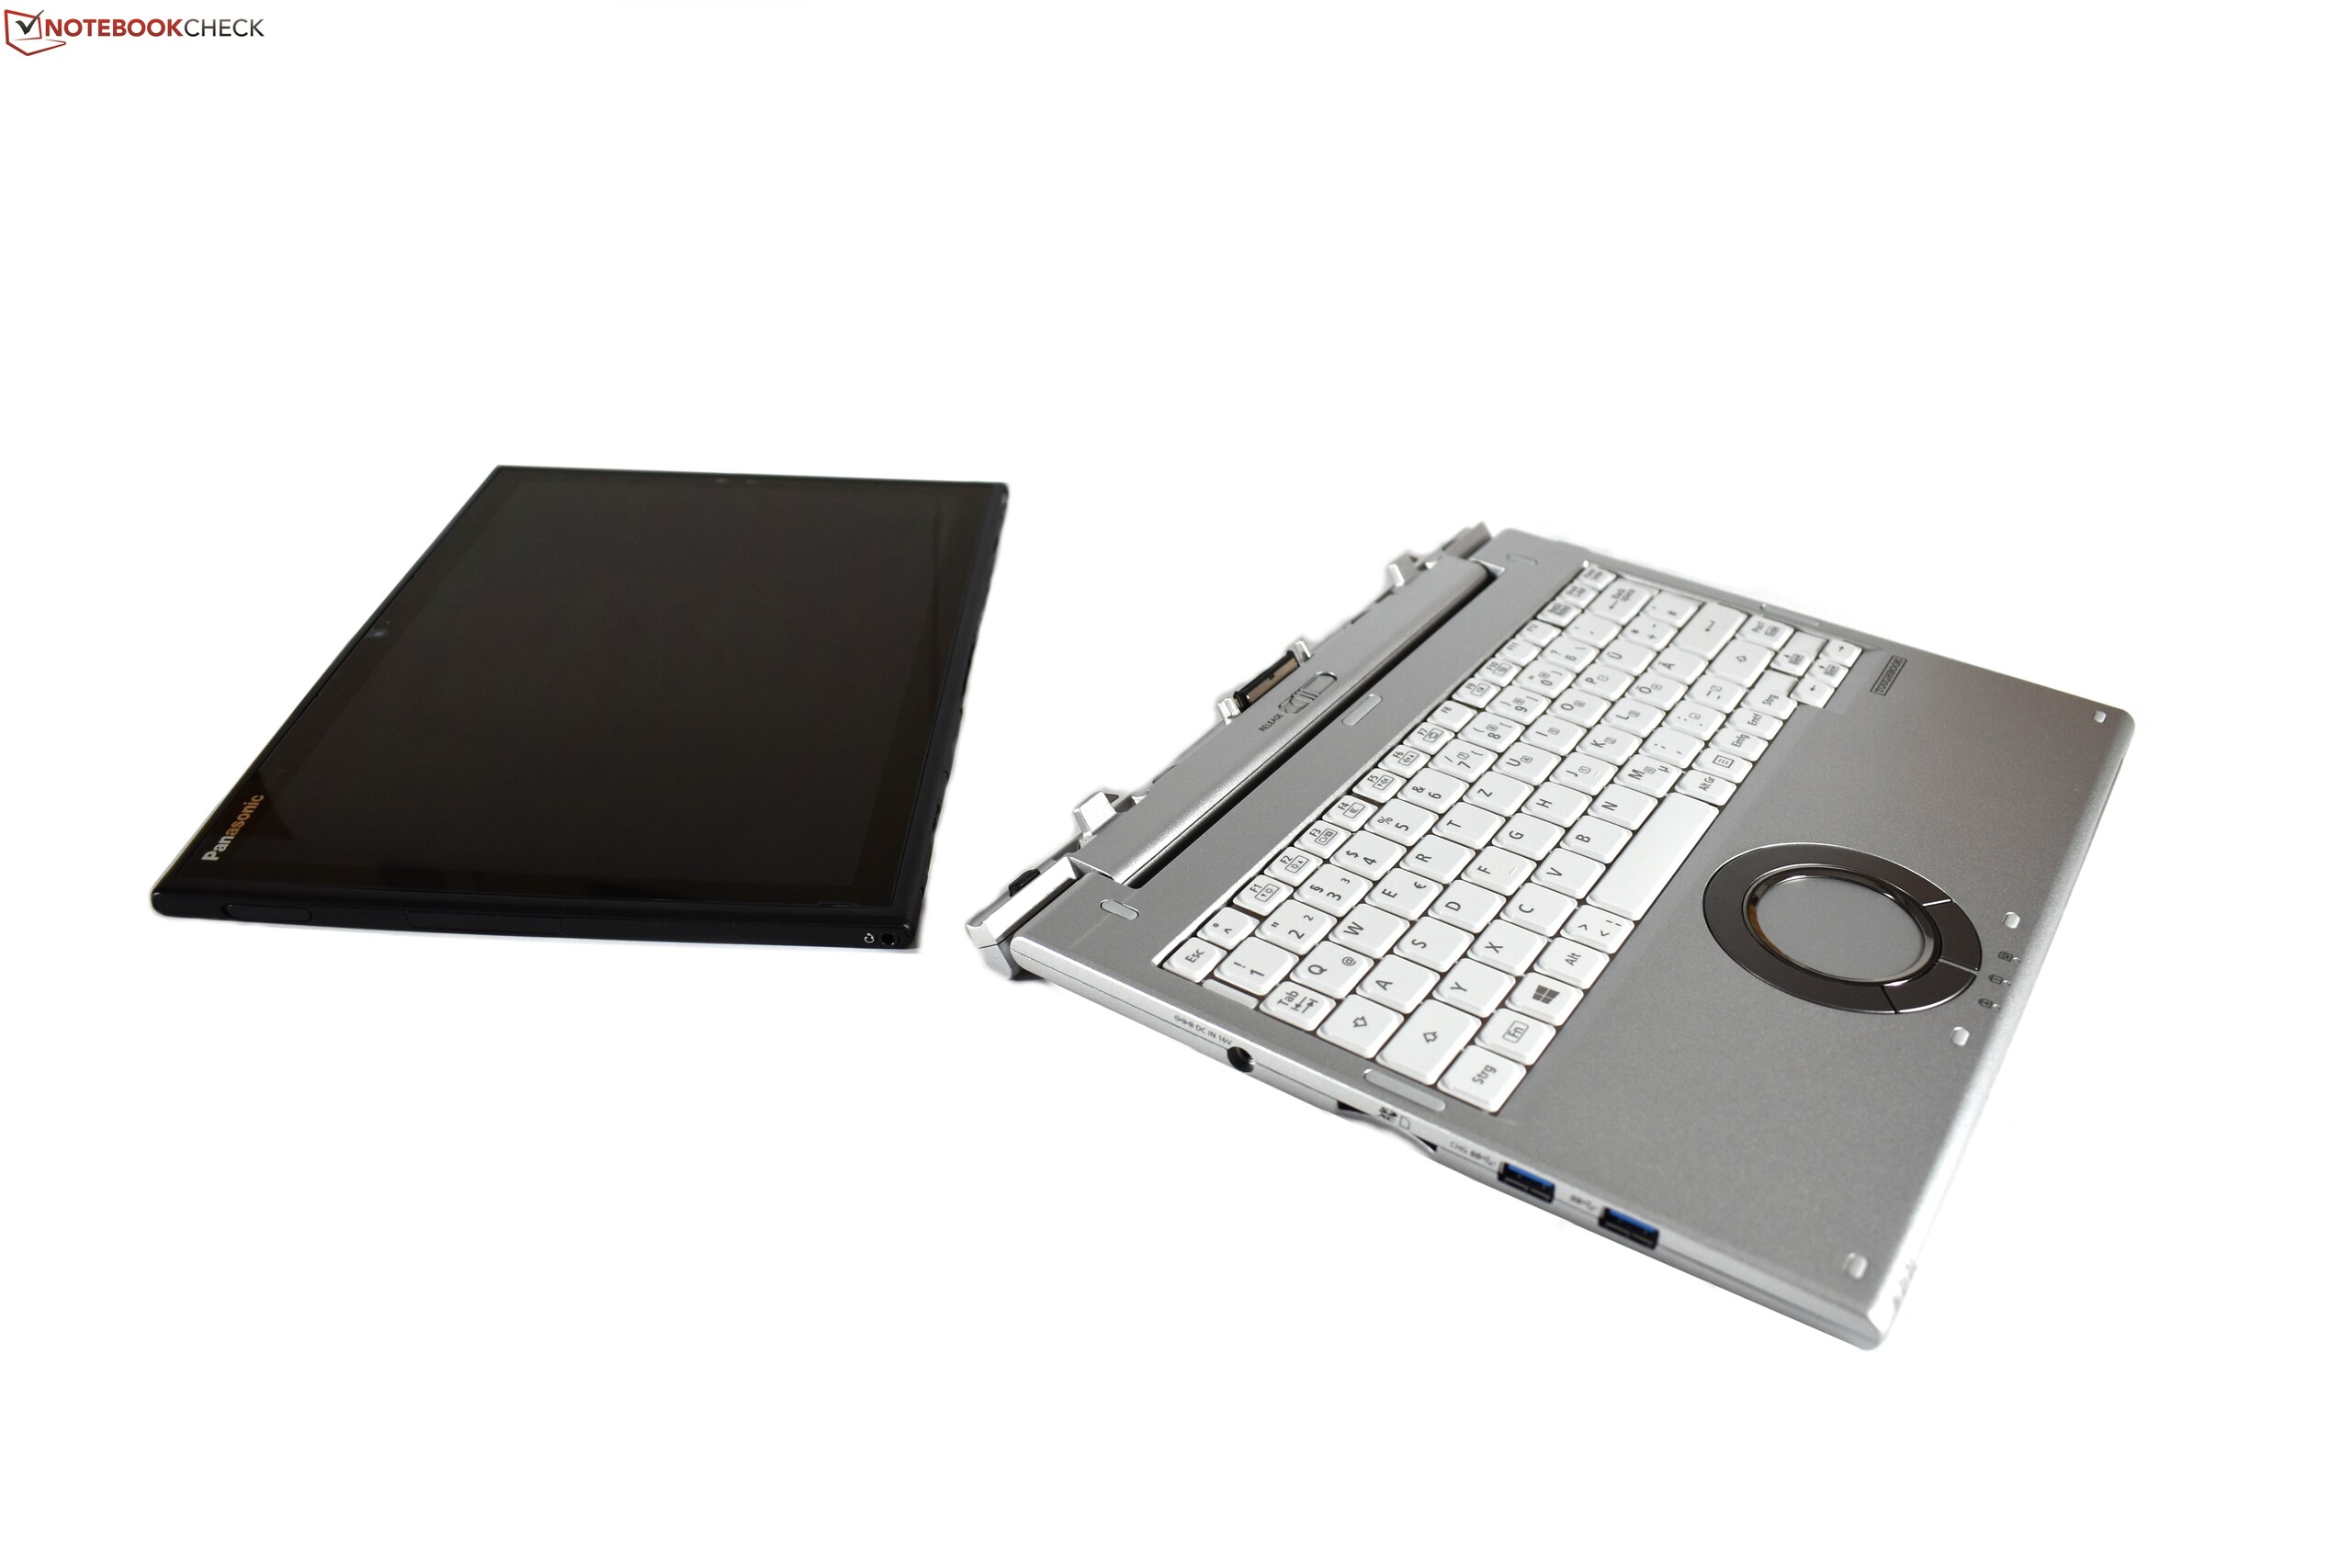
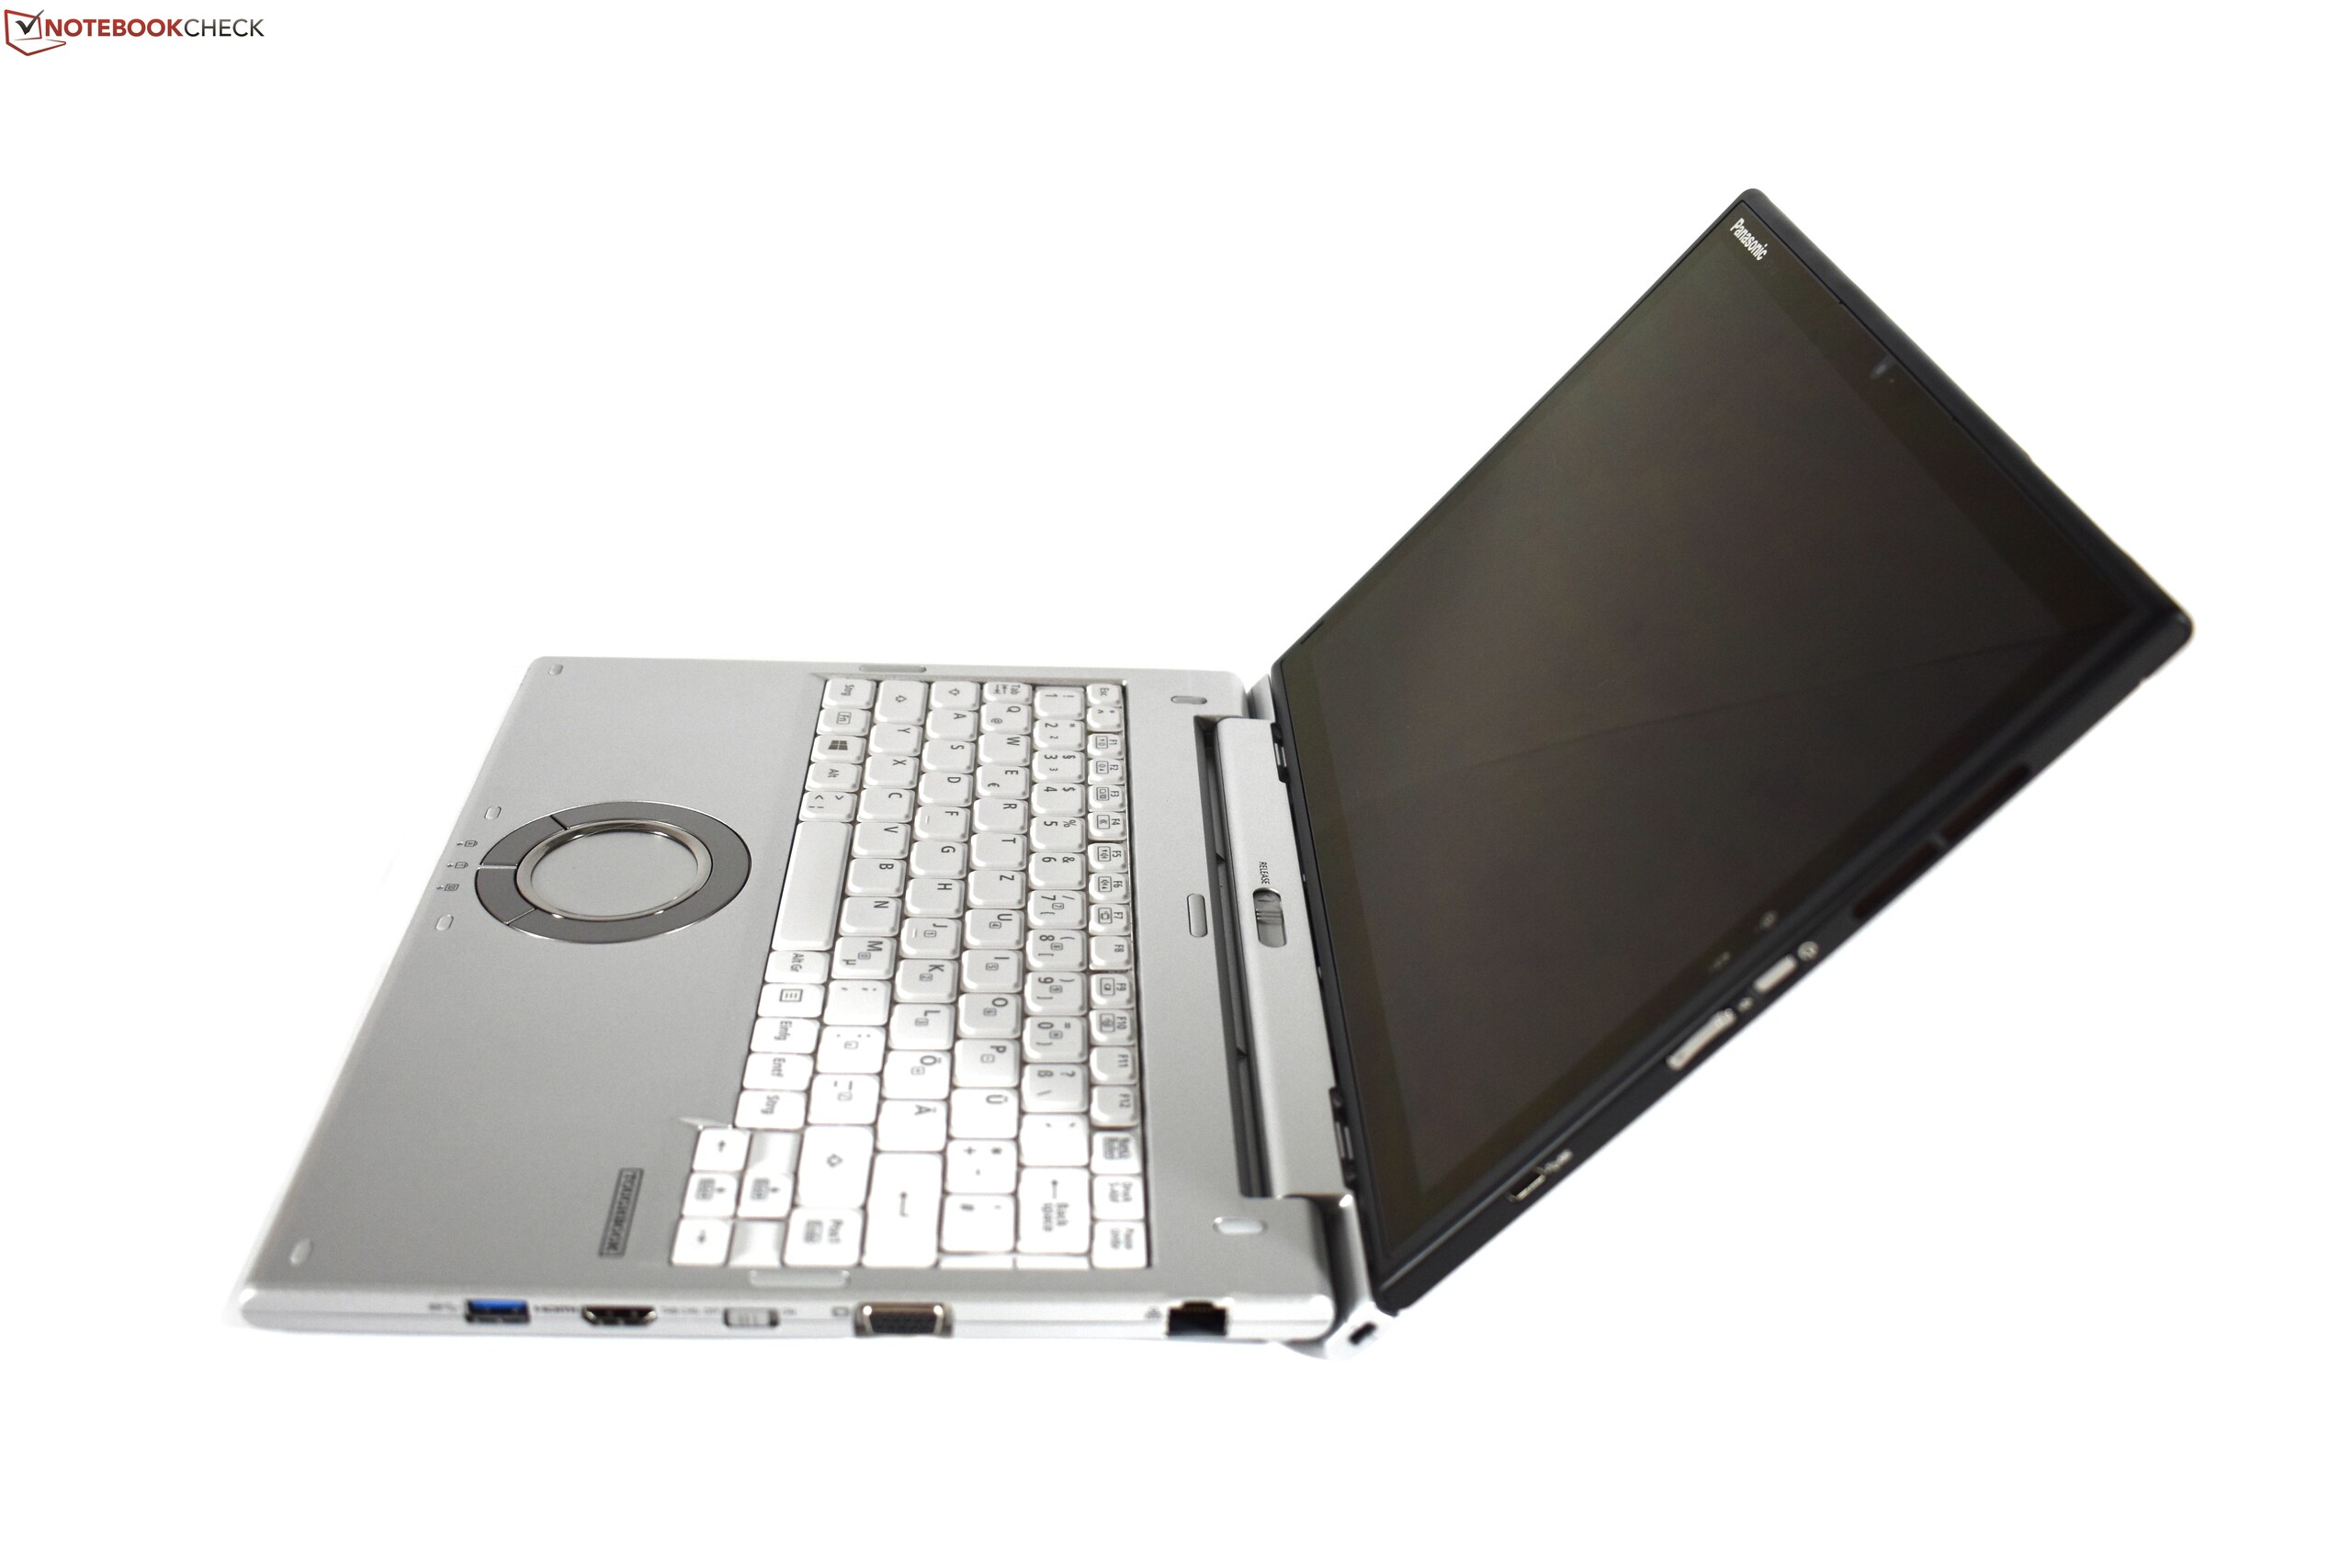
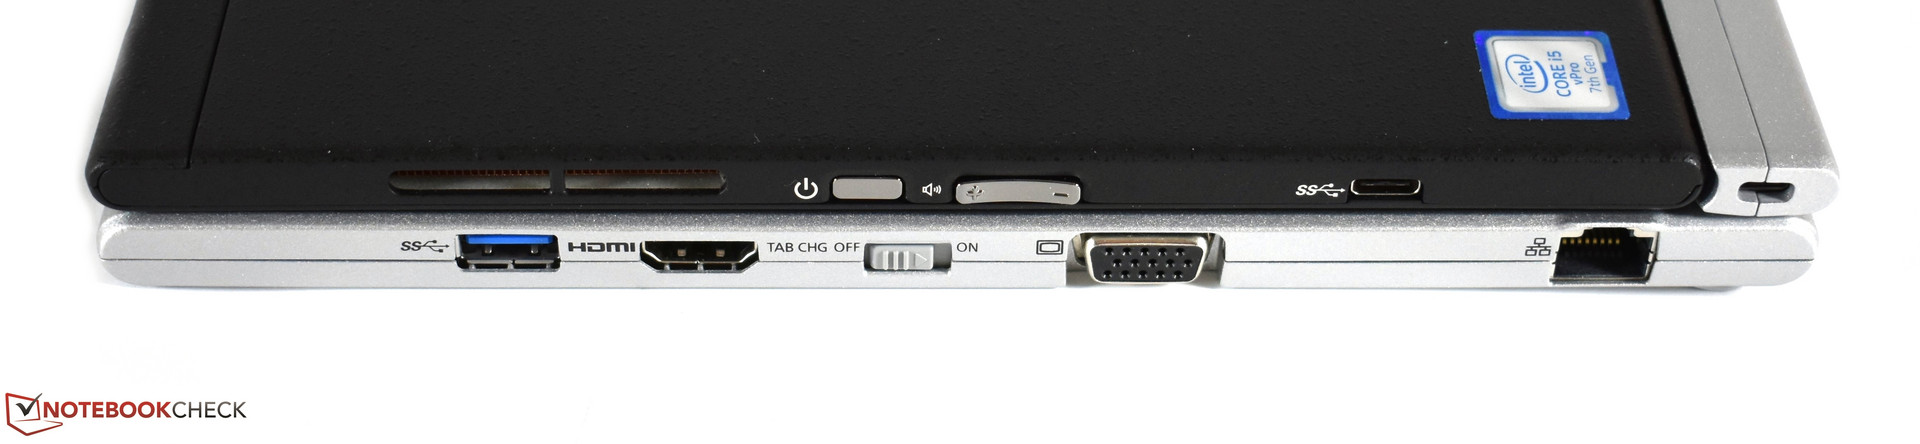
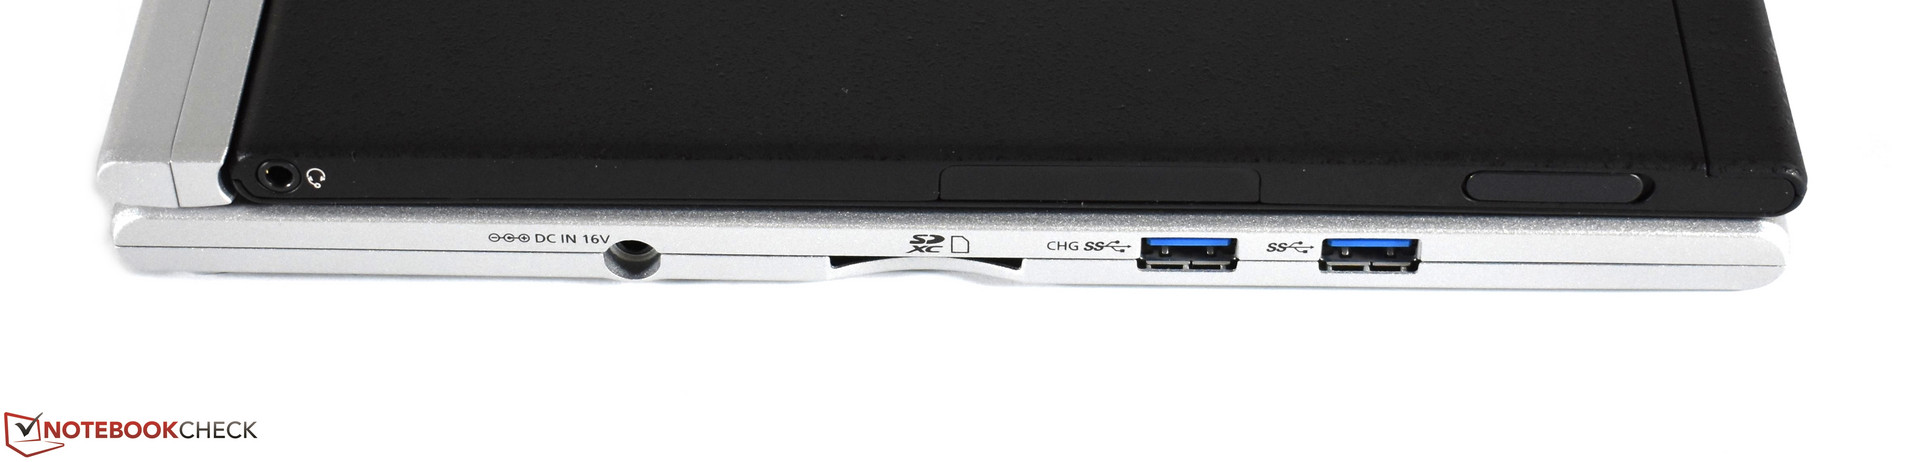
Om du tar en titt på batteritiden eller ljusstyrkan på den halv-matta skärmen, till exempel, så får du intrycket av att du tittar på en första klassens laptop. Ingen konkurrent kan hålla jämna steg med Toughbook i dessa avseenden. En annan fördel är dess flexibilitet: Toughbook är klart bäst i segmentet av löstagbara eller 2-i-1 surfplattor där. En VGA och Ethernet-port är fortfarande en nödvändighet för en affärslaptop och det utbytbara batteriet ger dig möjligheten att få ännu bättre batteritider. Och oavsett så har Toughbook ett jämförelsevis liten och lättviktigt metallhölje som känns väldigt robust. Den inkluderade WWAN-modulen håller dig ansluten på resande fot.
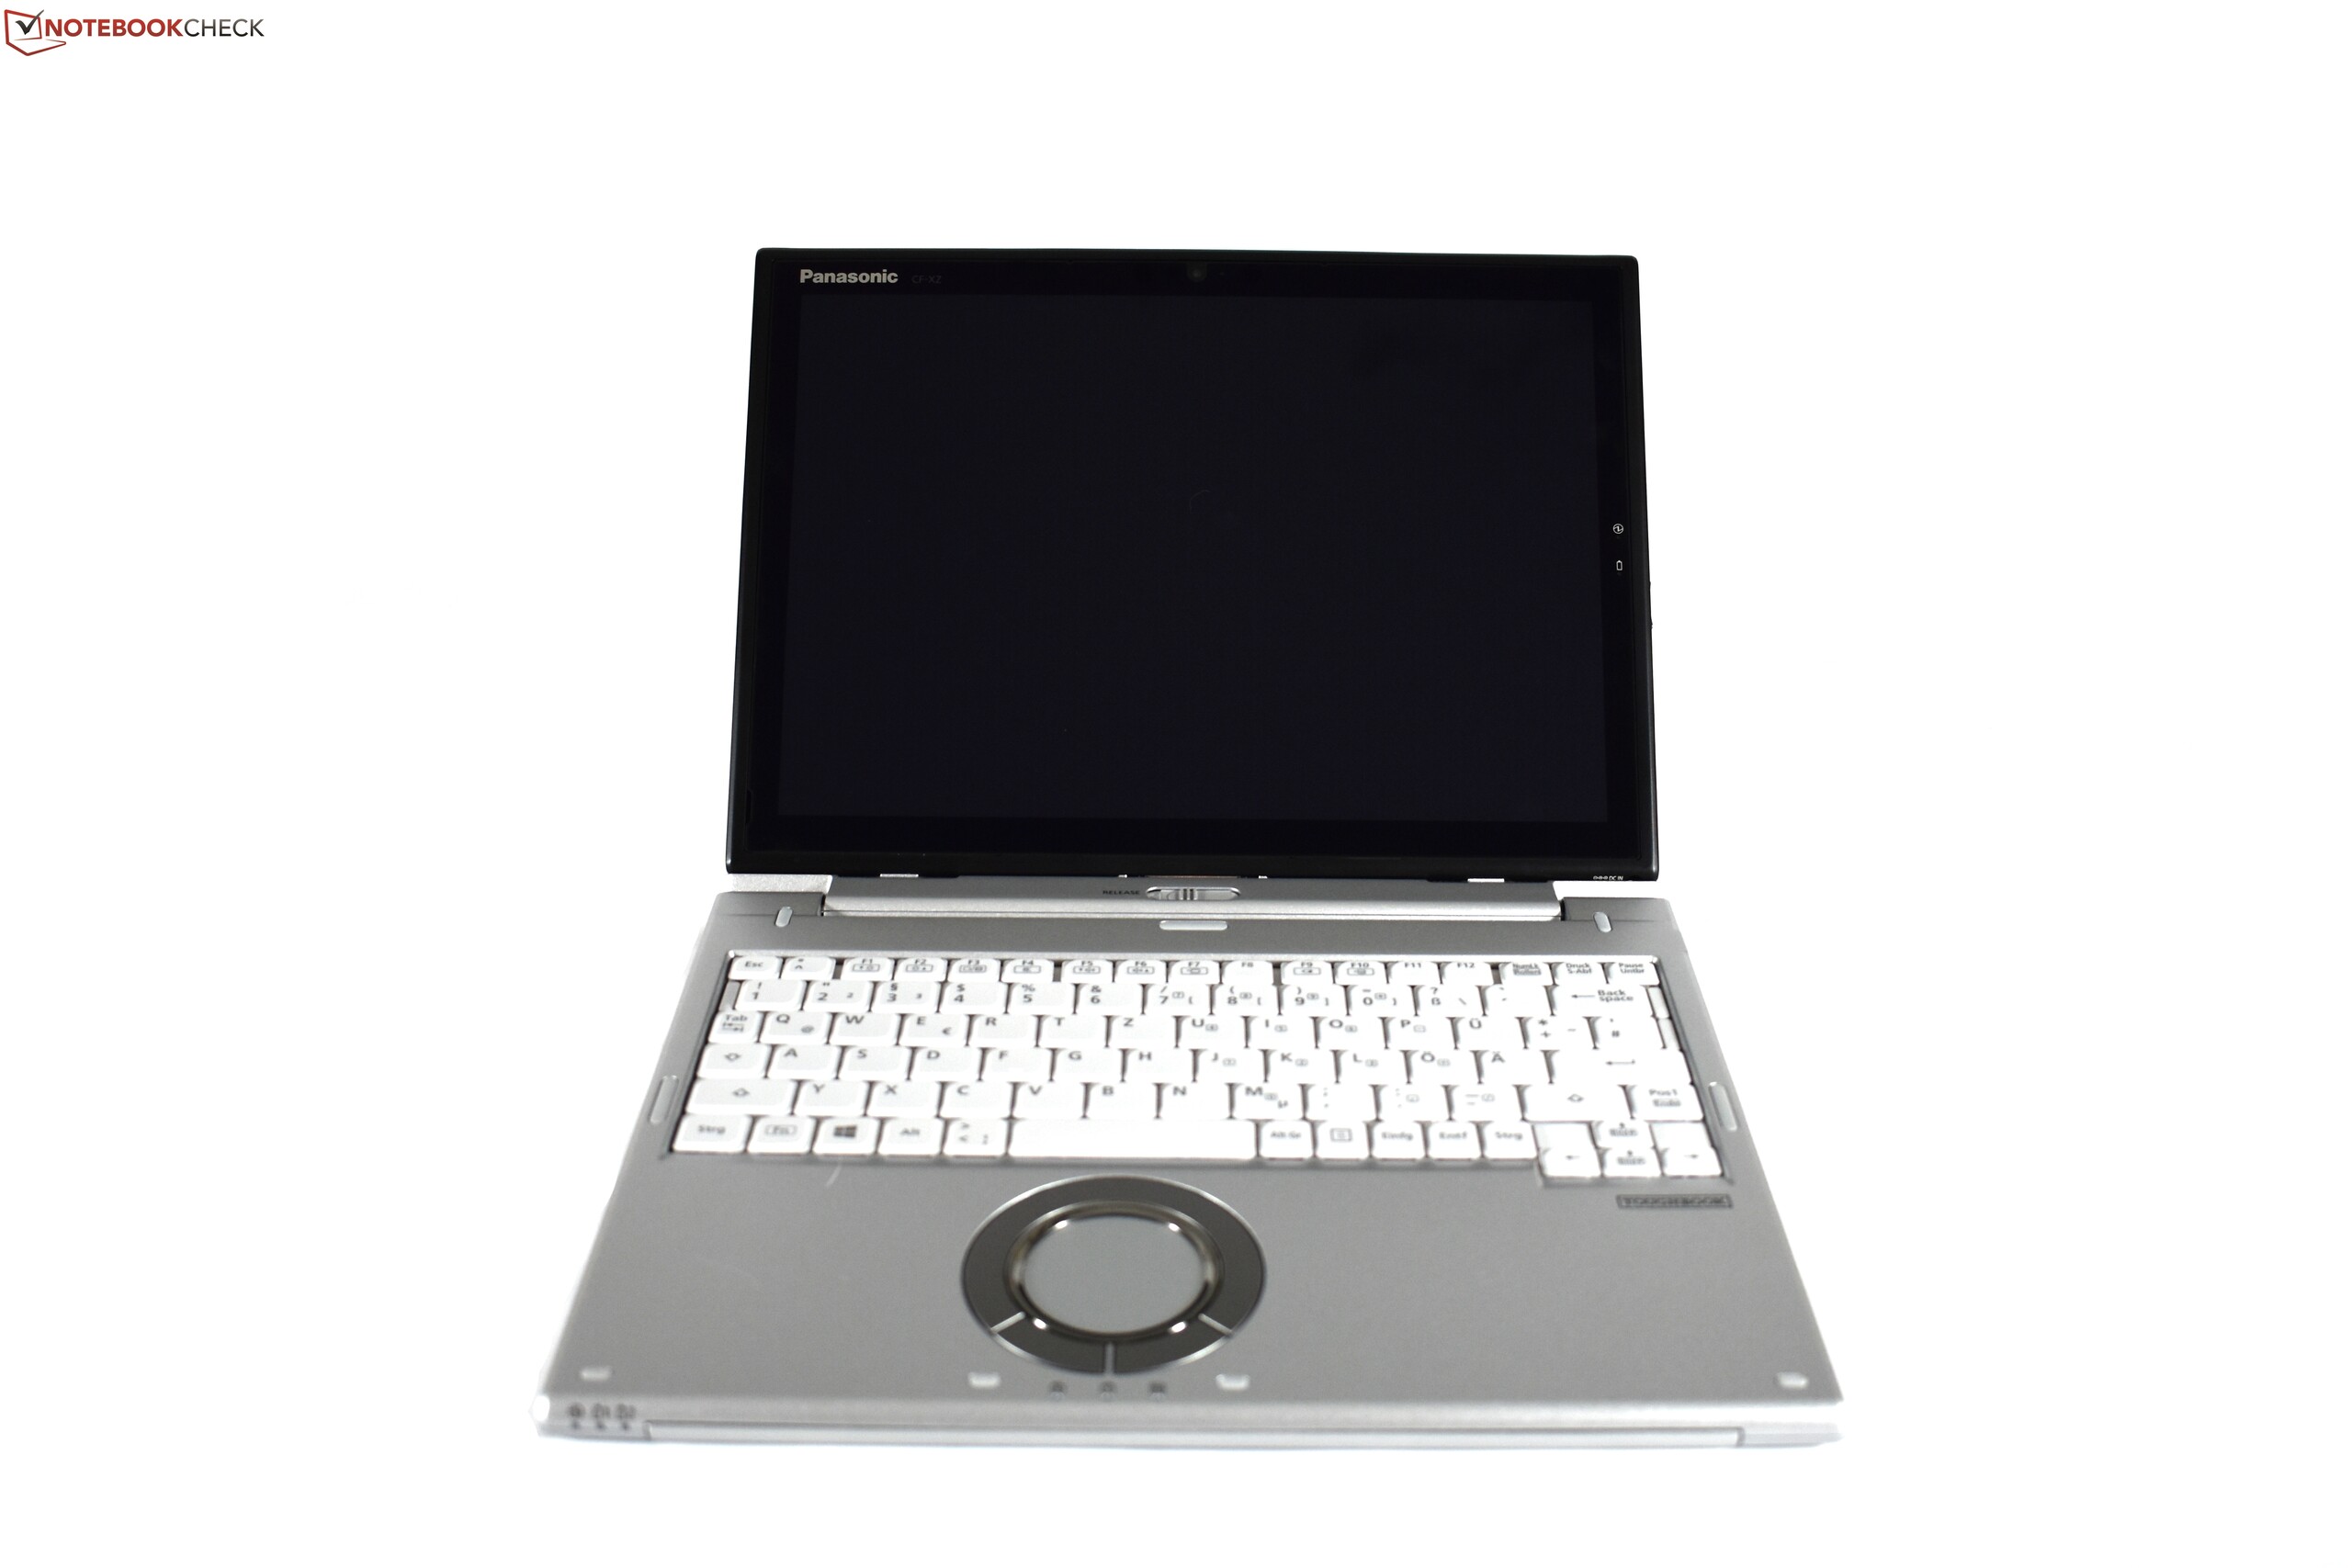
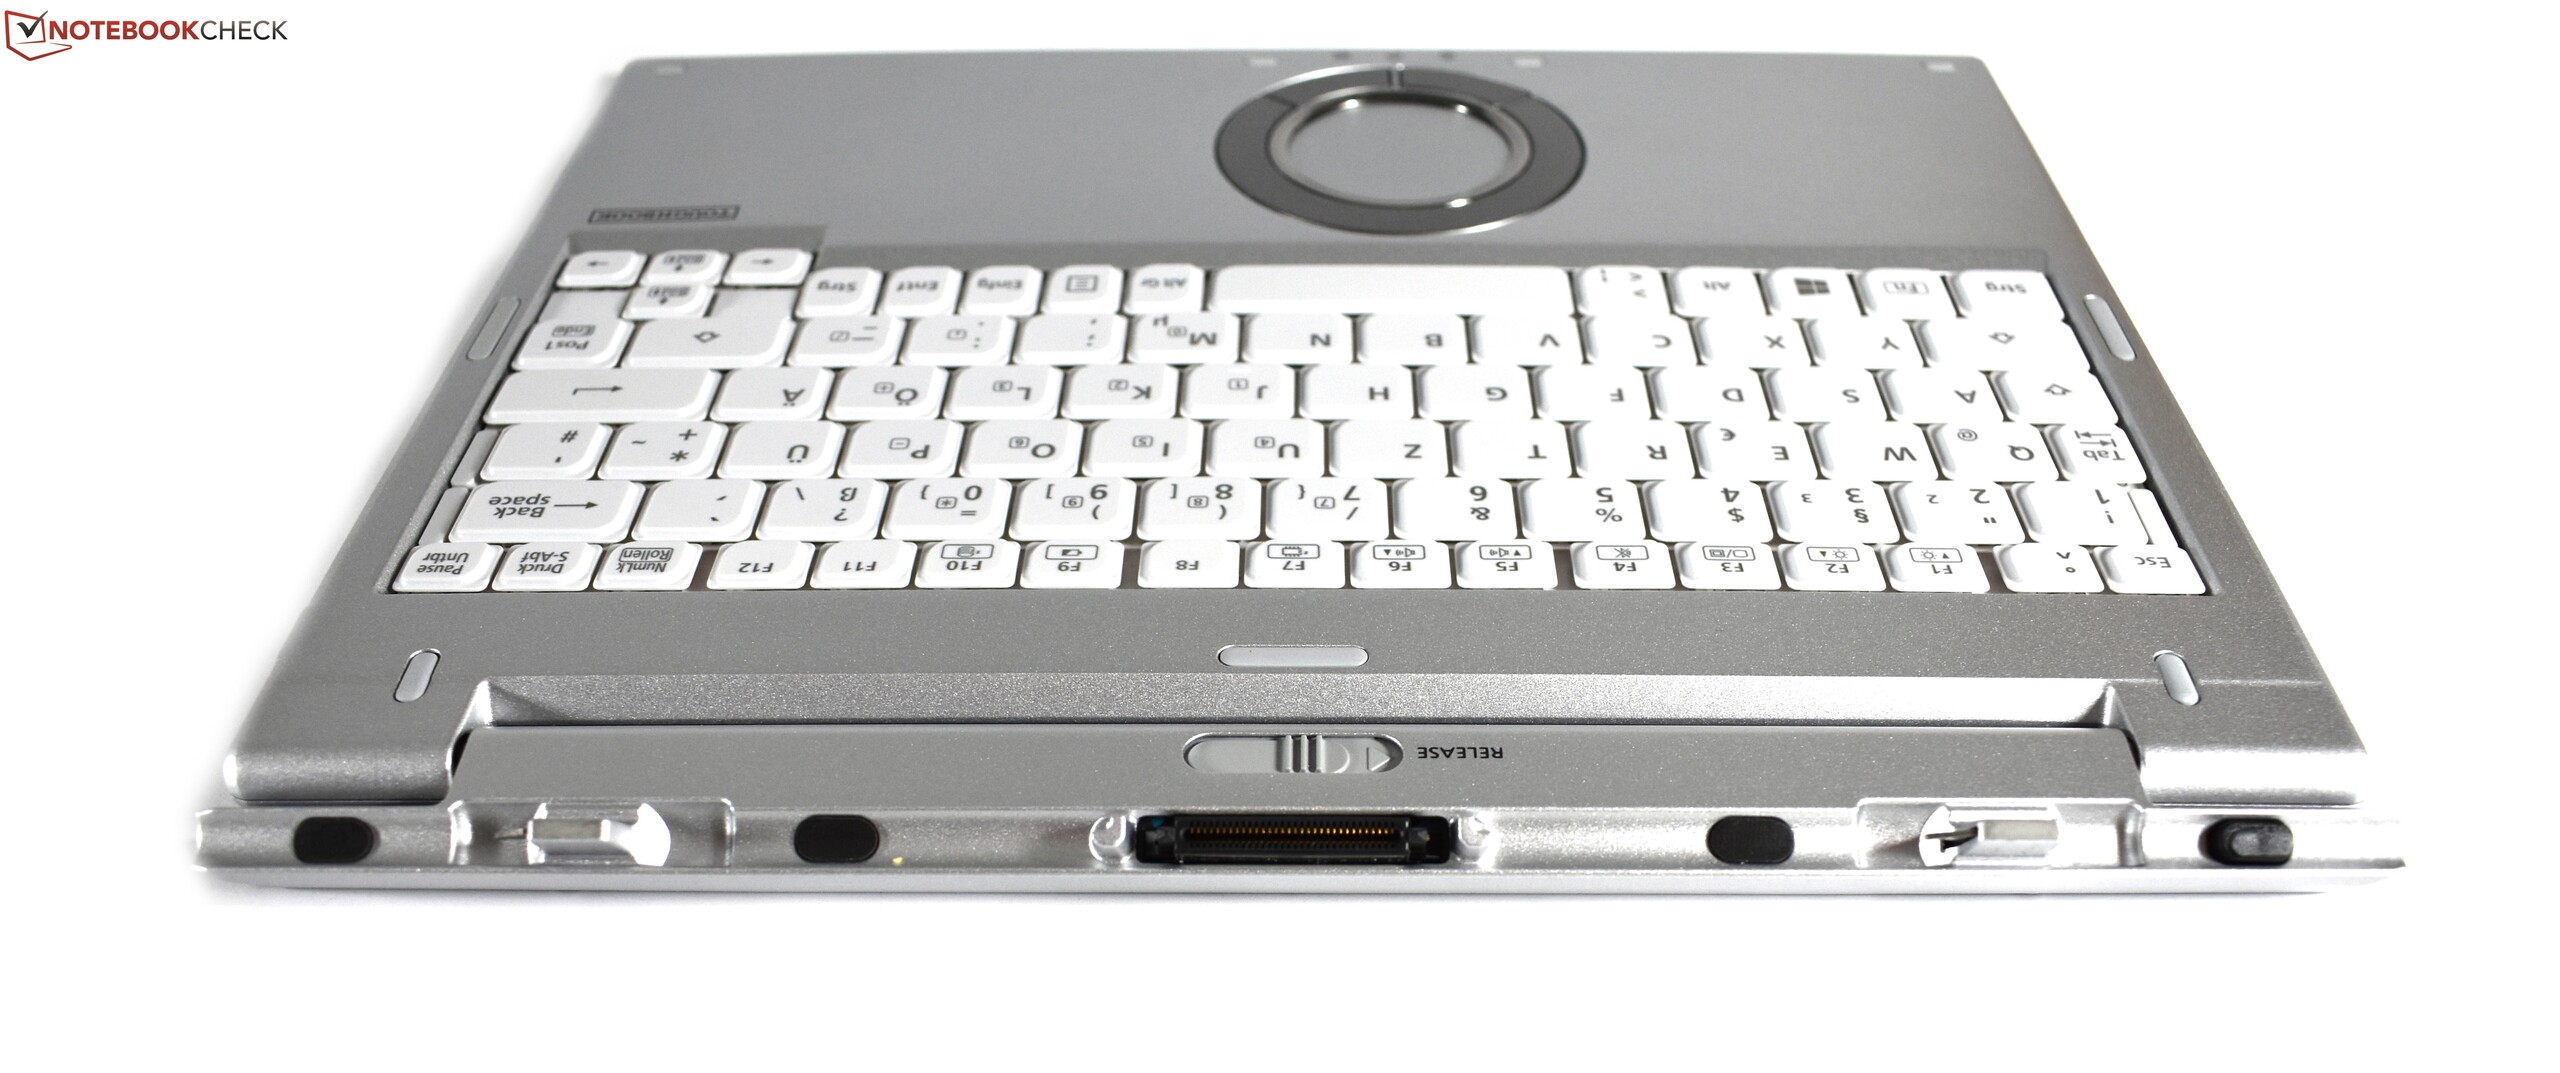
Men trots att allt detta låter bra: Svagheterna är inte så lätta att ignorera. Det börjar med skärmen, vars ljusstyrka minskar så mycket mot den vänstra kanten att det går att se med blotta ögat. Skärmen har också PWN-flimmer och färgrymdstäckningen är helt enkelt dålig för en laptop i den här priskategorin. Men det är inte bara den huvudsakliga utmatningsenheten som har problem. Dom två huvudsakliga inmatningsenheterna besviker också: Tangentbordet har en väldigt underlig layout, som resulterade i ett flertal skrivfel, och styrplattan verkar ha landat i fel decennium med sitt lilla tryckområde. Bara dom två punkterna gör den nästan omöjlig att använda som ett arbetsverktyg. Med tanke på allt detta kan vi nästan förlåta den dåliga kvaliteten på monohögtalaren, även om vi i vanliga fall hade förväntat oss mer av en enhet som kostar ~21 000 SEK. Detta är inte det enda område där Panasonic har försökt spara lite pengar. Den ganska lilla 256 GB SSD-enheten, till exempel, är endast en SATA-III flash-enhet. Sist men inte minst så måste vi nämna en del kvalitetsproblem. Hantverket på höljet, till exempel, är inte bra på en del områden och stundvis hörde vi spoltjut.
Inte för den stora massan: Kvaliteten på Panasonic Toughbook CF-XZ6 är för inkonsekvent för att verkligen tävla med löstagbara från andra stora tillverkare. Den kommer troligen förbli i sin nisch.
Vi ställde en fråga i inledningen: Nisch eller den breda marknaden? Svaret är tydligt för Toughbook - definitivt nisch. Den genomsnittlige användaren kommer inte vara nöjd med Toughbook, så vi kan inte ge den en allmän rekommendation.
Men om du är en användare som behöver dom speciella funktioner som Toughbook har, såsom ett utbytbart batteri, hög skärmljusstyrka eller klassiska portar i en löstagbar så kommer du troligen inte att hitta något bättre än Toughbook CF-XZ6, trots dess svagheter. Vi kan bara rekommendera denna enhet till en väldigt specifik grupp - och då bara med ett varningens ord. I vilket fall så borde du definitivt säkerställa att enhetens ljusfördelning är jämnare än på vår testenhet - ett sådant fel i en köpt enhet är utan tvekan en anledning att klaga.
Panasonic Toughbook CF-XZ6
- 01/11/2018 v6 (old)
Benjamin Herzig
Price comparison
