Test: Lenovo Yoga Book C930 (i5-7Y54, LTE, E-Ink) Omvandlingsbar (Sammanfattning)
| SD Card Reader - maximum AS SSD Seq Read Test (1GB) | |
| Genomsnitt av klass Convertible (28.9 - 254, n=22, senaste 2 åren) | |
| Lenovo ThinkPad X1 Tablet Gen 2 (Toshiba Exceria Pro SDXC 64 GB UHS-II) | |
| Microsoft Surface Pro (2017) m3 (Toshiba Exceria Pro M401 64 GB) | |
| Lenovo Yoga Book C930 YB-J912F (Toshiba Exceria Pro M501 microSDXC 64GB) | |
| Networking | |
| iperf3 transmit AX12 | |
| Microsoft Surface Pro (2017) m3 | |
| Lenovo Yoga Book C930 YB-J912F | |
| Huawei Matebook E | |
| Lenovo ThinkPad X1 Tablet Gen 2 | |
| iperf3 receive AX12 | |
| Lenovo ThinkPad X1 Tablet Gen 2 | |
| Microsoft Surface Pro (2017) m3 | |
| Lenovo Yoga Book C930 YB-J912F | |
| Huawei Matebook E | |
| |||||||||||||||||||||||||
Distribution av ljusstyrkan: 87 %
Mitt på batteriet: 351 cd/m²
Kontrast: 1526:1 (Svärta: 0.23 cd/m²)
ΔE ColorChecker Calman: 4.59 | ∀{0.5-29.43 Ø4.73}
calibrated: 3.26
ΔE Greyscale Calman: 5.2 | ∀{0.09-98 Ø4.97}
100% sRGB (Argyll 1.6.3 3D)
74% AdobeRGB 1998 (Argyll 1.6.3 3D)
83.2% AdobeRGB 1998 (Argyll 3D)
99.9% sRGB (Argyll 3D)
88.5% Display P3 (Argyll 3D)
Gamma: 2.41
CCT: 7712 K
| Lenovo Yoga Book C930 YB-J912F BOE 0765, , 2560x1660, 10.8" | Microsoft Surface Pro (2017) m3 LG Display LP123WQ112604, , 2736x1826, 12.3" | Huawei Matebook E Chi Mei CMN7801, , 2160x1440, 12" | Lenovo ThinkPad X1 Tablet Gen 2 LSN120QL01L01, , 2160x1440, 12" | Lenovo Yoga Book 2016 Windows 64GB LTE nicht auslesbar, Farbgamut: 70% lt. Hersteller, , 1920x1080, 10.1" | |
|---|---|---|---|---|---|
| Display | -13% | -3% | |||
| Display P3 Coverage (%) | 88.5 | 68.5 -23% | 84.9 -4% | ||
| sRGB Coverage (%) | 99.9 | 99.2 -1% | 99.8 0% | ||
| AdobeRGB 1998 Coverage (%) | 83.2 | 70.1 -16% | 79.9 -4% | ||
| Response Times | -1% | 30% | 25% | 8% | |
| Response Time Grey 50% / Grey 80% * (ms) | 43 ? | 42 ? 2% | 26 ? 40% | 28.4 ? 34% | 36 ? 16% |
| Response Time Black / White * (ms) | 27 ? | 28 ? -4% | 22 ? 19% | 22.8 ? 16% | 27 ? -0% |
| PWM Frequency (Hz) | 221.2 ? | ||||
| Screen | 10% | -2% | -14% | -2% | |
| Brightness middle (cd/m²) | 351 | 461 31% | 439 25% | 388.1 11% | 382 9% |
| Brightness (cd/m²) | 338 | 444 31% | 428 27% | 344 2% | 363 7% |
| Brightness Distribution (%) | 87 | 93 7% | 92 6% | 78 -10% | 83 -5% |
| Black Level * (cd/m²) | 0.23 | 0.34 -48% | 0.35 -52% | 0.39 -70% | 0.37 -61% |
| Contrast (:1) | 1526 | 1356 -11% | 1254 -18% | 995 -35% | 1032 -32% |
| Colorchecker dE 2000 * | 4.59 | 3.43 25% | 5.17 -13% | 4.6 -0% | 3.61 21% |
| Colorchecker dE 2000 max. * | 9.81 | 5.55 43% | 7.68 22% | 9.1 7% | 7.92 19% |
| Colorchecker dE 2000 calibrated * | 3.26 | ||||
| Greyscale dE 2000 * | 5.2 | 3.08 41% | 5.69 -9% | 6.1 -17% | 3.77 27% |
| Gamma | 2.41 91% | 3.03 73% | 2.42 91% | 2.07 106% | 2.43 91% |
| CCT | 7712 84% | 7014 93% | 7999 81% | 7104 91% | 6760 96% |
| Color Space (Percent of AdobeRGB 1998) (%) | 74 | 64 -14% | 71 -4% | 59 -20% | |
| Color Space (Percent of sRGB) (%) | 100 | 99 -1% | 100 0% | 91 -9% | |
| Totalt genomsnitt (program/inställningar) | -1% /
4% | 8% /
2% | 6% /
-8% | 3% /
0% |
* ... mindre är bättre
Visa svarstider
| ↔ Svarstid svart till vitt | ||
|---|---|---|
| 27 ms ... stiga ↗ och falla ↘ kombinerat | ↗ 13 ms stiga | 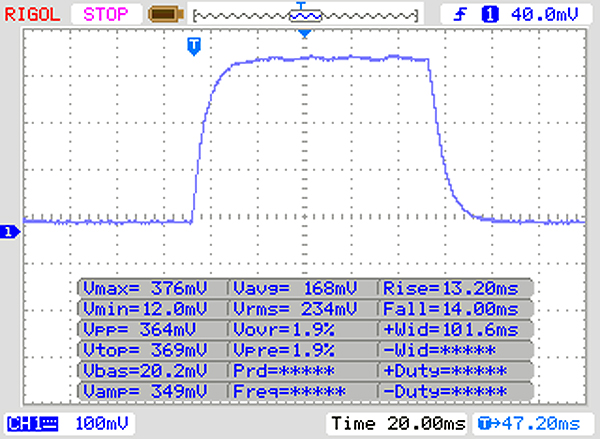 |
| ↘ 14 ms hösten | ||
| Skärmen visar relativt långsamma svarsfrekvenser i våra tester och kan vara för långsam för spelare. I jämförelse sträcker sig alla testade enheter från 0.1 (minst) till 240 (maximalt) ms. » 67 % av alla enheter är bättre. Detta innebär att den uppmätta svarstiden är sämre än genomsnittet av alla testade enheter (19.9 ms). | ||
| ↔ Svarstid 50 % grått till 80 % grått | ||
| 43 ms ... stiga ↗ och falla ↘ kombinerat | ↗ 23 ms stiga | 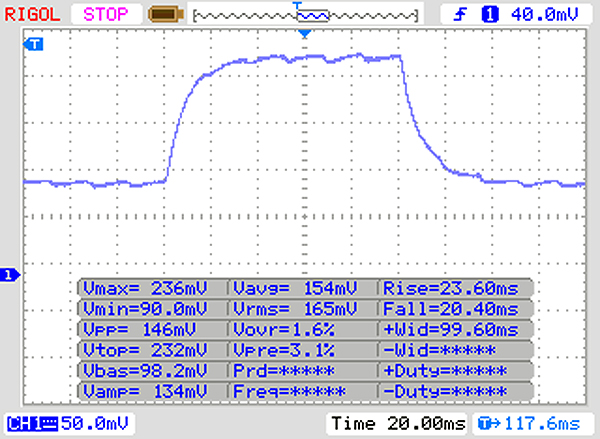 |
| ↘ 20 ms hösten | ||
| Skärmen visar långsamma svarsfrekvenser i våra tester och kommer att vara otillfredsställande för spelare. I jämförelse sträcker sig alla testade enheter från 0.165 (minst) till 636 (maximalt) ms. » 71 % av alla enheter är bättre. Detta innebär att den uppmätta svarstiden är sämre än genomsnittet av alla testade enheter (31.1 ms). | ||
Skärmflimmer / PWM (Puls-Width Modulation)
| Skärmflimmer / PWM upptäcktes inte | 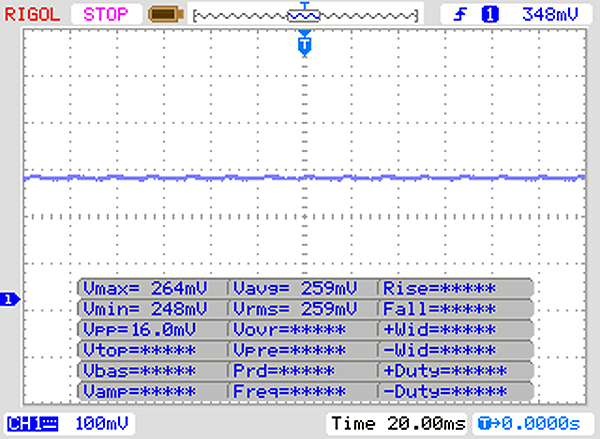 | ||
Som jämförelse: 52 % av alla testade enheter använder inte PWM för att dämpa skärmen. Om PWM upptäcktes mättes ett medelvärde av 7784 (minst: 5 - maximum: 343500) Hz. | |||
| Cinebench R15 | |
| CPU Single 64Bit | |
| Genomsnitt av klass Convertible (149.8 - 317, n=49, senaste 2 åren) | |
| Huawei Matebook E | |
| Lenovo Yoga Book C930 YB-J912F | |
| Genomsnitt Intel Core i5-7Y54 (111 - 124, n=7) | |
| Lenovo ThinkPad X1 Tablet Gen 2 | |
| Microsoft Surface Pro (2017) m3 | |
| Lenovo Yoga Book 2016 Windows 64GB LTE | |
| CPU Multi 64Bit | |
| Genomsnitt av klass Convertible (478 - 4940, n=49, senaste 2 åren) | |
| Huawei Matebook E | |
| Microsoft Surface Pro (2017) m3 | |
| Lenovo ThinkPad X1 Tablet Gen 2 | |
| Lenovo Yoga Book C930 YB-J912F | |
| Genomsnitt Intel Core i5-7Y54 (205 - 262, n=7) | |
| Lenovo Yoga Book 2016 Windows 64GB LTE | |
| Cinebench R11.5 | |
| CPU Single 64Bit | |
| Genomsnitt av klass Convertible (2.61 - 3.75, n=8, senaste 2 åren) | |
| Lenovo Yoga Book C930 YB-J912F | |
| Lenovo ThinkPad X1 Tablet Gen 2 | |
| Genomsnitt Intel Core i5-7Y54 (1.27 - 1.41, n=4) | |
| Microsoft Surface Pro (2017) m3 | |
| CPU Multi 64Bit | |
| Genomsnitt av klass Convertible (9.08 - 55.9, n=8, senaste 2 åren) | |
| Microsoft Surface Pro (2017) m3 | |
| Lenovo ThinkPad X1 Tablet Gen 2 | |
| Lenovo Yoga Book C930 YB-J912F | |
| Genomsnitt Intel Core i5-7Y54 (2.27 - 2.57, n=5) | |
| PCMark 8 | |
| Home Score Accelerated v2 | |
| Genomsnitt av klass Convertible (n=1senaste 2 åren) | |
| Lenovo ThinkPad X1 Tablet Gen 2 | |
| Huawei Matebook E | |
| Microsoft Surface Pro (2017) m3 | |
| Genomsnitt Intel Core i5-7Y54, Intel HD Graphics 615 (2232 - 3092, n=7) | |
| Lenovo Yoga Book C930 YB-J912F | |
| Lenovo Yoga Book 2016 Windows 64GB LTE | |
| Work Score Accelerated v2 | |
| Genomsnitt av klass Convertible (n=1senaste 2 åren) | |
| Lenovo ThinkPad X1 Tablet Gen 2 | |
| Genomsnitt Intel Core i5-7Y54, Intel HD Graphics 615 (3244 - 4288, n=3) | |
| Microsoft Surface Pro (2017) m3 | |
| Lenovo Yoga Book C930 YB-J912F | |
| Lenovo Yoga Book 2016 Windows 64GB LTE | |
| PCMark 8 Home Score Accelerated v2 | 2232 poäng | |
| PCMark 8 Work Score Accelerated v2 | 3244 poäng | |
| PCMark 10 Score | 2385 poäng | |
Hjälp | ||
| Lenovo Yoga Book C930 YB-J912F Toshiba KBG30ZMT256G | Microsoft Surface Pro (2017) m3 Samsung PM971 KUS020203M | Huawei Matebook E SanDisk SD8SN8U256G1027 | Lenovo ThinkPad X1 Tablet Gen 2 Samsung PM961 MZVLW256HEHP | Lenovo Yoga Book 2016 Windows 64GB LTE 64 GB eMMC Flash | Genomsnitt Toshiba KBG30ZMT256G | |
|---|---|---|---|---|---|---|
| CrystalDiskMark 3.0 | -18% | -24% | 36% | -88% | 8% | |
| Read Seq (MB/s) | 880 | 691 -21% | 506 -43% | 1739 98% | 120.5 -86% | 844 ? -4% |
| Write Seq (MB/s) | 759 | 670 -12% | 461 -39% | 1259 66% | 34.39 -95% | 679 ? -11% |
| Read 512 (MB/s) | 721 | 261.1 -64% | 341.9 -53% | 698 -3% | 102.6 -86% | 653 ? -9% |
| Write 512 (MB/s) | 665 | 241 -64% | 294.7 -56% | 869 31% | 26.58 -96% | 583 ? -12% |
| Read 4k (MB/s) | 44.39 | 40.11 -10% | 32.46 -27% | 52.3 18% | 13.34 -70% | 48.1 ? 8% |
| Write 4k (MB/s) | 90.8 | 98.8 9% | 65.3 -28% | 120 32% | 11.56 -87% | 94.4 ? 4% |
| Read 4k QD32 (MB/s) | 270.9 | 301.8 11% | 381.8 41% | 247.9 -8% | 33.6 -88% | 410 ? 51% |
| Write 4k QD32 (MB/s) | 165.6 | 172 4% | 184.4 11% | 259 56% | 13.79 -92% | 230 ? 39% |
| AS SSD | -5% | -39% | 106% | -93% | 1% | |
| Seq Read (MB/s) | 1241 | 1226 -1% | 489.8 -61% | 2130 72% | 128.4 -90% | 1279 ? 3% |
| Seq Write (MB/s) | 797 | 514 -36% | 202.1 -75% | 887 11% | 28.76 -96% | 766 ? -4% |
| 4K Read (MB/s) | 43.38 | 38.82 -11% | 30.43 -30% | 44.11 2% | 45.5 ? 5% | |
| 4K Write (MB/s) | 91.6 | 88.6 -3% | 60.5 -34% | 125.8 37% | 90.9 ? -1% | |
| 4K-64 Read (MB/s) | 582 | 891 53% | 359.7 -38% | 2208 279% | 613 ? 5% | |
| 4K-64 Write (MB/s) | 231.7 | 144.3 -38% | 149.6 -35% | 598 158% | 273 ? 18% | |
| Access Time Read * (ms) | 0.057 | 0.074 -30% | 0.107 -88% | 0.054 5% | 0.1095 ? -92% | |
| Access Time Write * (ms) | 0.176 | 0.04 77% | 0.075 57% | 0.028 84% | 0.202 ? -15% | |
| Score Read (Points) | 749 | 1053 41% | 439 -41% | 2465 229% | 786 ? 5% | |
| Score Write (Points) | 403 | 284 -30% | 230 -43% | 812 101% | 441 ? 9% | |
| Score Total (Points) | 1526 | 1847 21% | 890 -42% | 4470 193% | 1616 ? 6% | |
| Copy ISO MB/s (MB/s) | 448.1 | 173.2 -61% | 694 55% | 490 ? 9% | ||
| Copy Program MB/s (MB/s) | 94.3 | 83.8 -11% | 320.8 240% | 129.9 ? 38% | ||
| Copy Game MB/s (MB/s) | 254.5 | 140.7 -45% | 302.8 19% | 330 ? 30% | ||
| Totalt genomsnitt (program/inställningar) | -12% /
-10% | -32% /
-33% | 71% /
81% | -91% /
-89% | 5% /
4% |
* ... mindre är bättre

| 3DMark 11 - 1280x720 Performance GPU | |
| Genomsnitt av klass Convertible (1505 - 40732, n=49, senaste 2 åren) | |
| Lenovo Yoga Book C930 YB-J912F | |
| Huawei Matebook E | |
| Microsoft Surface Pro (2017) m3 | |
| Genomsnitt Intel HD Graphics 615 (1032 - 1384, n=14) | |
| Lenovo ThinkPad X1 Tablet Gen 2 | |
| Lenovo Yoga Book 2016 Windows 64GB LTE | |
| 3DMark | |
| 1280x720 Cloud Gate Standard Graphics | |
| Genomsnitt av klass Convertible (7885 - 57566, n=33, senaste 2 åren) | |
| Genomsnitt Intel HD Graphics 615 (5478 - 7839, n=13) | |
| Lenovo Yoga Book C930 YB-J912F | |
| Lenovo ThinkPad X1 Tablet Gen 2 | |
| Microsoft Surface Pro (2017) m3 | |
| Lenovo Yoga Book 2016 Windows 64GB LTE | |
| 1920x1080 Fire Strike Graphics | |
| Genomsnitt av klass Convertible (1185 - 27447, n=49, senaste 2 åren) | |
| Genomsnitt Intel HD Graphics 615 (647 - 965, n=11) | |
| Lenovo Yoga Book C930 YB-J912F | |
| Microsoft Surface Pro (2017) m3 | |
| Lenovo ThinkPad X1 Tablet Gen 2 | |
| 3DMark 11 Performance | 1367 poäng | |
| 3DMark Cloud Gate Standard Score | 4893 poäng | |
| 3DMark Fire Strike Score | 747 poäng | |
Hjälp | ||
| The Witcher 3 | |
| 1024x768 The Witcher 3 low | |
| Genomsnitt av klass Convertible (22 - 141.5, n=6, senaste 2 åren) | |
| Genomsnitt Intel HD Graphics 615 (n=1) | |
| 1366x768 The Witcher 3 medium | |
| Genomsnitt av klass Convertible (39 - 81.2, n=5, senaste 2 åren) | |
| 1920x1080 The Witcher 3 high | |
| Genomsnitt av klass Convertible (22 - 44.5, n=5, senaste 2 åren) | |
| 1920x1080 The Witcher 3 ultra | |
| Genomsnitt av klass Convertible (11 - 101, n=6, senaste 2 åren) | |
| låg | med. | hög | ultra | |
|---|---|---|---|---|
| The Elder Scrolls V: Skyrim (2011) | 35.1 | 18 | 7.9 | |
| Tomb Raider (2013) | 61.4 | 28.9 | 18.4 | |
| Rocket League (2017) | 26.4 |
| Lenovo Yoga Book C930 YB-J912F HD Graphics 615, i5-7Y54, Toshiba KBG30ZMT256G | Microsoft Surface Pro (2017) m3 HD Graphics 615, m3-7Y30, Samsung PM971 KUS020203M | Huawei Matebook E HD Graphics 615, i5-7Y54, SanDisk SD8SN8U256G1027 | Lenovo ThinkPad X1 Tablet Gen 2 HD Graphics 615, i5-7Y54, Samsung PM961 MZVLW256HEHP | Lenovo Yoga Book 2016 Windows 64GB LTE HD Graphics 400 (Braswell), Z8550, 64 GB eMMC Flash | |
|---|---|---|---|---|---|
| Heat | -9% | 11% | -10% | 10% | |
| Maximum Upper Side * (°C) | 42 | 40.5 4% | 36.3 14% | 47.2 -12% | 34 19% |
| Maximum Bottom * (°C) | 43.8 | 40.6 7% | 37.9 13% | 49.8 -14% | 40.2 8% |
| Idle Upper Side * (°C) | 27.7 | 37.8 -36% | 26.2 5% | 30.8 -11% | 25.7 7% |
| Idle Bottom * (°C) | 28.7 | 32 -11% | 25.6 11% | 29.2 -2% | 27.1 6% |
* ... mindre är bättre
(±) Den maximala temperaturen på ovansidan är 42 °C / 108 F, jämfört med genomsnittet av 35.4 °C / 96 F , allt från 19.6 till 60 °C för klassen Convertible.
(±) Botten värms upp till maximalt 43.8 °C / 111 F, jämfört med genomsnittet av 36.9 °C / 98 F
(+) Vid tomgångsbruk är medeltemperaturen för ovansidan 26.3 °C / 79 F, jämfört med enhetsgenomsnittet på 30.3 °C / ### class_avg_f### F.
(+) Handledsstöden och pekplattan når maximal hudtemperatur (33.4 °C / 92.1 F) och är därför inte varma.
(-) Medeltemperaturen för handledsstödsområdet på liknande enheter var 28 °C / 82.4 F (-5.4 °C / -9.7 F).
Lenovo Yoga Book C930 YB-J912F ljudanalys
(-) | inte särskilt höga högtalare (67.3 dB)
Bas 100 - 315 Hz
(±) | reducerad bas - i genomsnitt 11.4% lägre än medianen
(±) | linjäriteten för basen är genomsnittlig (8.1% delta till föregående frekvens)
Mellan 400 - 2000 Hz
(±) | högre mellan - i genomsnitt 5.2% högre än median
(+) | mids är linjära (3.8% delta till föregående frekvens)
Högsta 2 - 16 kHz
(+) | balanserade toppar - endast 4.6% från medianen
(±) | linjäriteten för toppar är genomsnittlig (8.3% delta till föregående frekvens)
Totalt 100 - 16 000 Hz
(±) | linjäriteten för det totala ljudet är genomsnittlig (20.9% skillnad mot median)
Jämfört med samma klass
» 55% av alla testade enheter i den här klassen var bättre, 10% liknande, 35% sämre
» Den bästa hade ett delta på 6%, genomsnittet var 20%, sämst var 57%
Jämfört med alla testade enheter
» 57% av alla testade enheter var bättre, 8% liknande, 36% sämre
» Den bästa hade ett delta på 4%, genomsnittet var 24%, sämst var 134%
Apple MacBook 12 (Early 2016) 1.1 GHz ljudanalys
(+) | högtalare kan spela relativt högt (83.6 dB)
Bas 100 - 315 Hz
(±) | reducerad bas - i genomsnitt 11.3% lägre än medianen
(±) | linjäriteten för basen är genomsnittlig (14.2% delta till föregående frekvens)
Mellan 400 - 2000 Hz
(+) | balanserad mellan - endast 2.4% från medianen
(+) | mids är linjära (5.5% delta till föregående frekvens)
Högsta 2 - 16 kHz
(+) | balanserade toppar - endast 2% från medianen
(+) | toppar är linjära (4.5% delta till föregående frekvens)
Totalt 100 - 16 000 Hz
(+) | det totala ljudet är linjärt (10.2% skillnad mot median)
Jämfört med samma klass
» 7% av alla testade enheter i den här klassen var bättre, 2% liknande, 91% sämre
» Den bästa hade ett delta på 5%, genomsnittet var 18%, sämst var 53%
Jämfört med alla testade enheter
» 5% av alla testade enheter var bättre, 1% liknande, 94% sämre
» Den bästa hade ett delta på 4%, genomsnittet var 24%, sämst var 134%
| Av/Standby | |
| Låg belastning | |
| Hög belastning |
|
Förklaring:
min: | |
| Lenovo Yoga Book C930 YB-J912F i5-7Y54, HD Graphics 615, Toshiba KBG30ZMT256G, IPS, 2560x1660, 10.8" | Lenovo Yoga Book 2016 Windows 64GB LTE Z8550, HD Graphics 400 (Braswell), 64 GB eMMC Flash, IPS , 1920x1080, 10.1" | Microsoft Surface Pro (2017) m3 m3-7Y30, HD Graphics 615, Samsung PM971 KUS020203M, IPS, 2736x1826, 12.3" | Huawei Matebook E i5-7Y54, HD Graphics 615, SanDisk SD8SN8U256G1027, IPS, 2160x1440, 12" | Lenovo ThinkPad X1 Tablet Gen 2 i5-7Y54, HD Graphics 615, Samsung PM961 MZVLW256HEHP, IPS, 2160x1440, 12" | Genomsnitt Intel HD Graphics 615 | Genomsnitt av klass Convertible | |
|---|---|---|---|---|---|---|---|
| Power Consumption | 44% | -2% | 1% | 9% | 7% | -48% | |
| Idle Minimum * (Watt) | 5.3 | 2 62% | 3.1 42% | 3.9 26% | 5 6% | 4.12 ? 22% | 4.24 ? 20% |
| Idle Average * (Watt) | 6.9 | 4.6 33% | 8.8 -28% | 8.8 -28% | 6.3 9% | 7.02 ? -2% | 7.03 ? -2% |
| Idle Maximum * (Watt) | 7.4 | 5.7 23% | 9.8 -32% | 8.9 -20% | 7.8 -5% | 7.89 ? -7% | 8.61 ? -16% |
| Load Average * (Watt) | 19.7 | 11.5 42% | 22.7 -15% | 20 -2% | 19.5 1% | 20 ? -2% | 43.9 ? -123% |
| Load Maximum * (Watt) | 30.5 | 11.5 62% | 23.6 23% | 21.8 29% | 19.6 36% | 23.8 ? 22% | 67.2 ? -120% |
* ... mindre är bättre
| Lenovo Yoga Book C930 YB-J912F i5-7Y54, HD Graphics 615, 36 Wh | Microsoft Surface Pro (2017) m3 m3-7Y30, HD Graphics 615, 45 Wh | Huawei Matebook E i5-7Y54, HD Graphics 615, 33.7 Wh | Lenovo ThinkPad X1 Tablet Gen 2 i5-7Y54, HD Graphics 615, 37 Wh | Lenovo Yoga Book 2016 Windows 64GB LTE Z8550, HD Graphics 400 (Braswell), 32 Wh | Genomsnitt av klass Convertible | |
|---|---|---|---|---|---|---|
| Batteridrifttid | 53% | 8% | -1% | 50% | 83% | |
| Reader / Idle (h) | 11.5 | 15.6 36% | 11 -4% | 19.2 67% | 27.7 ? 141% | |
| H.264 (h) | 6.6 | 11.1 68% | 15.3 ? 132% | |||
| WiFi v1.3 (h) | 6.3 | 11.4 81% | 6.8 8% | 7.4 17% | 8.3 32% | 12.1 ? 92% |
| Load (h) | 2.6 | 3.3 27% | 2.2 -15% | 1.779 ? -32% |
För
Emot
Läs den fullständiga versionen av den här recensionen på engelska här.
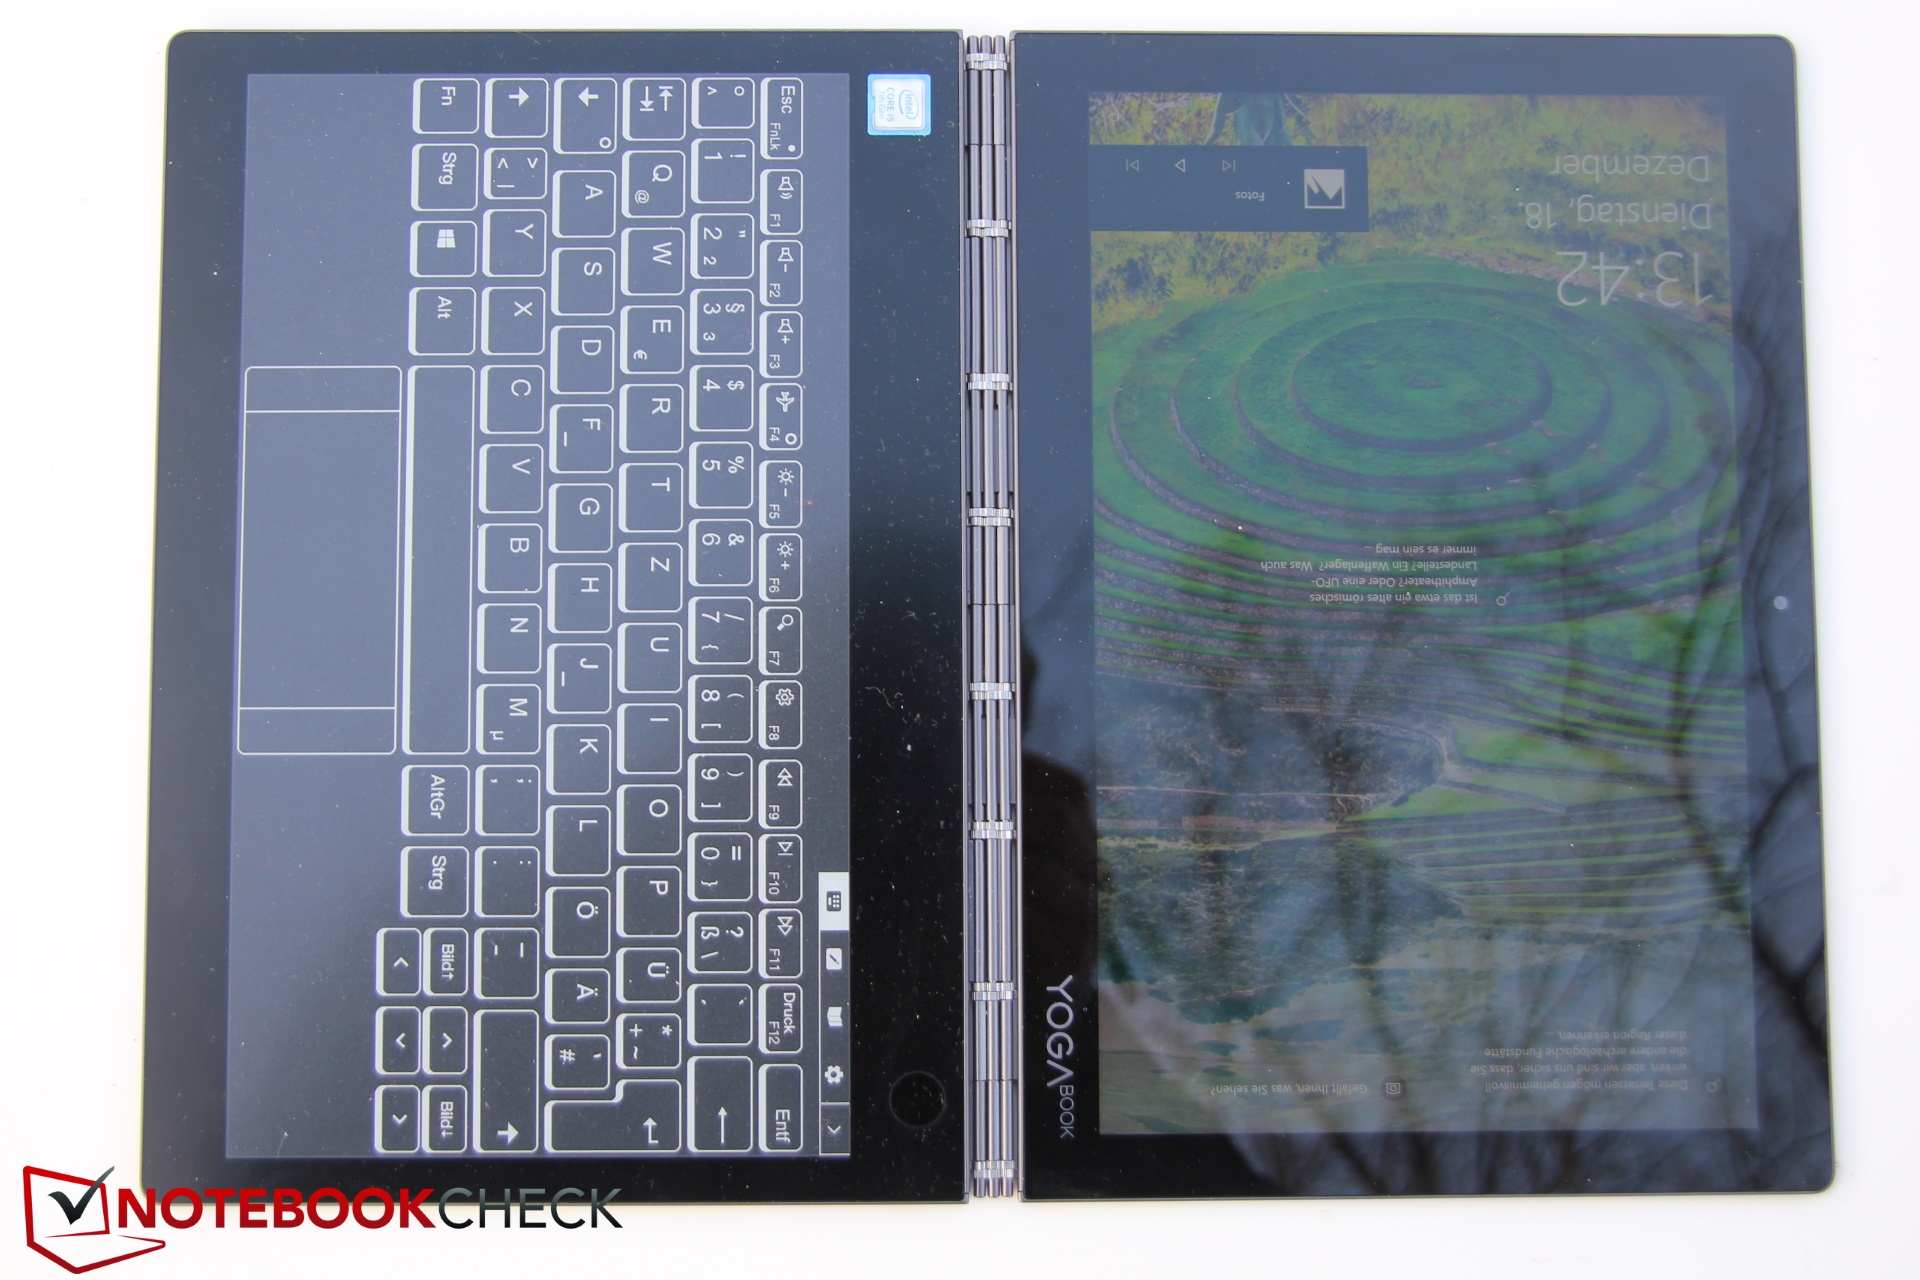
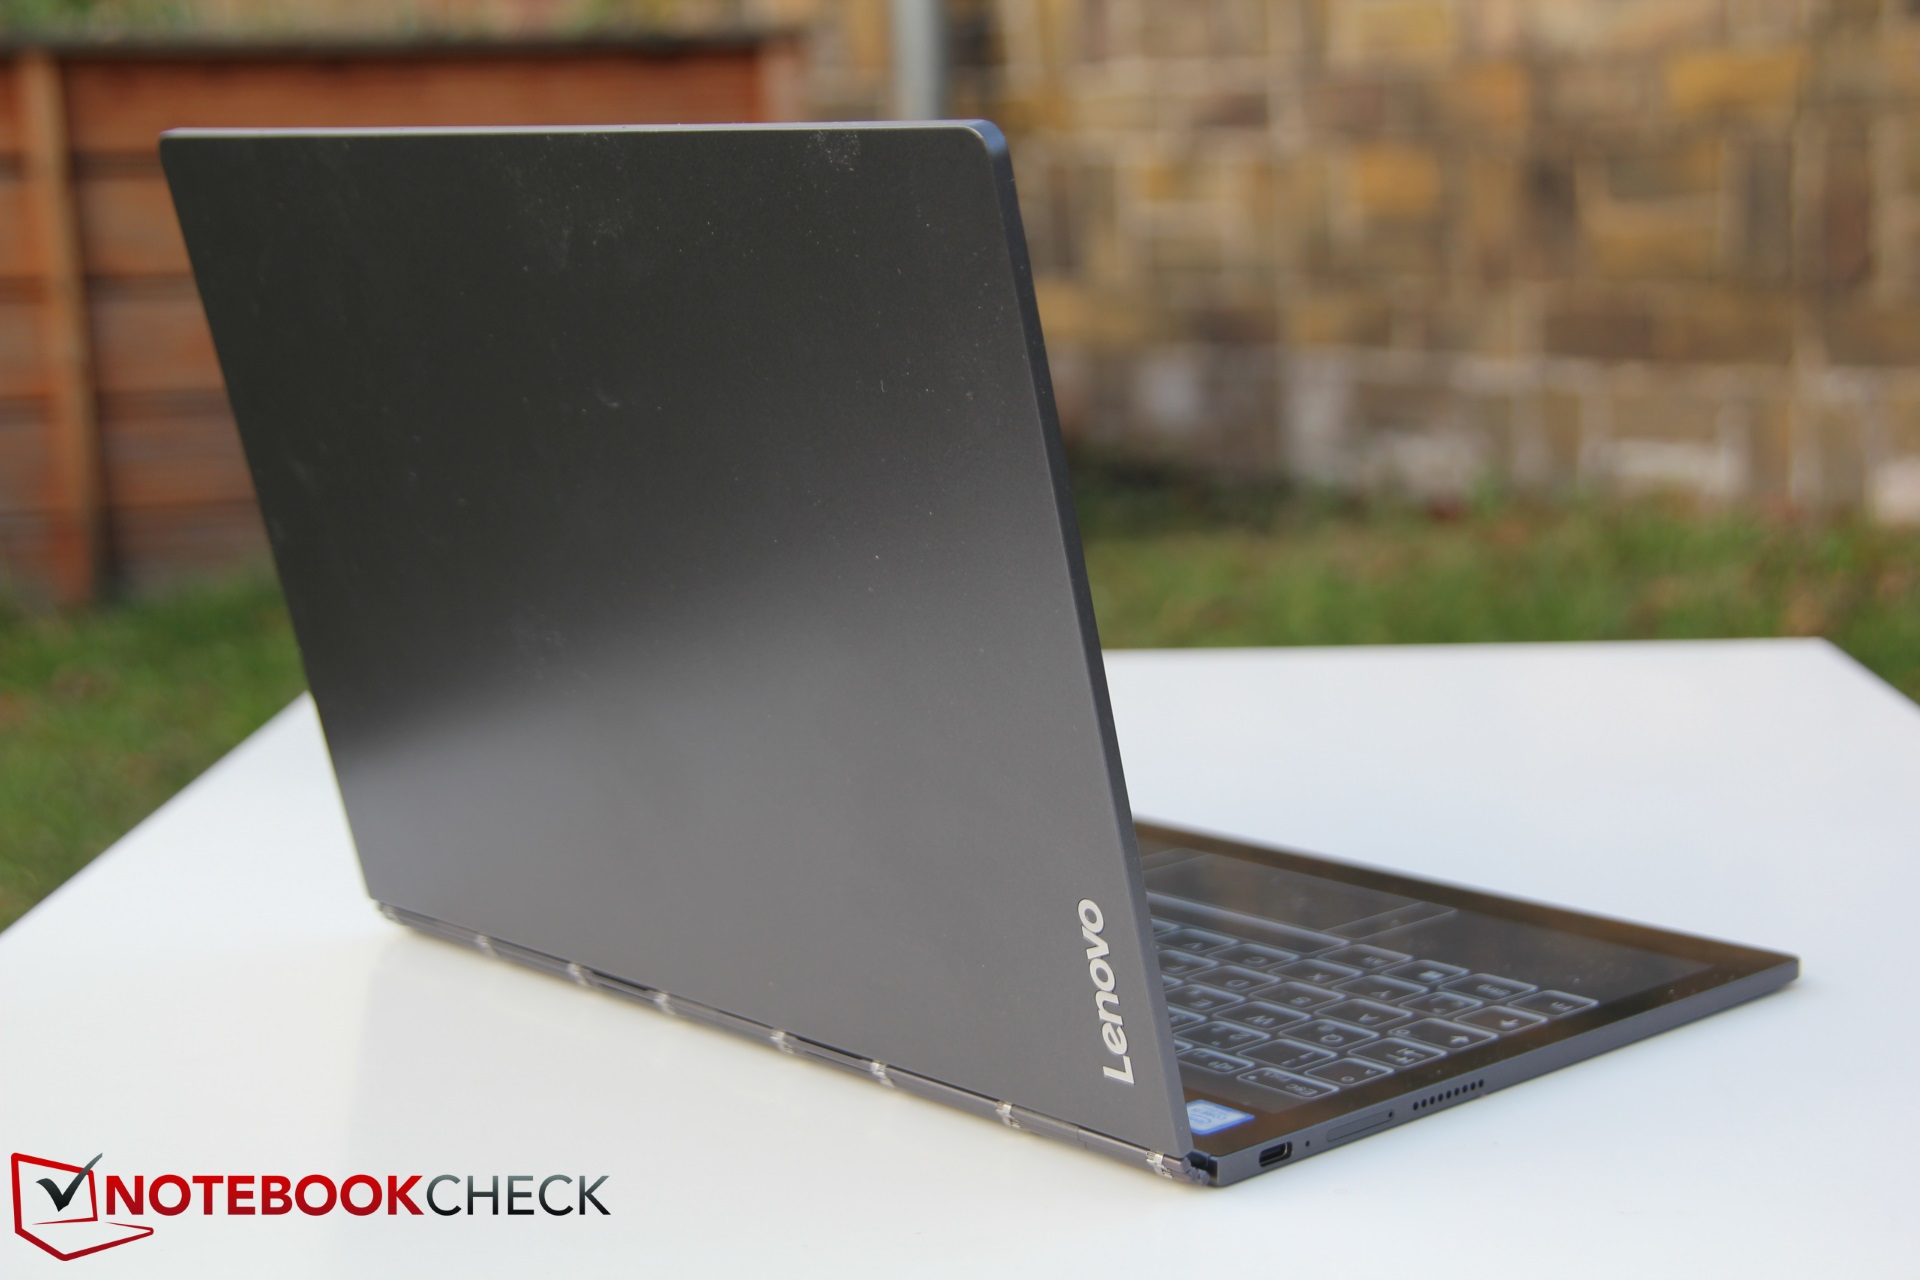
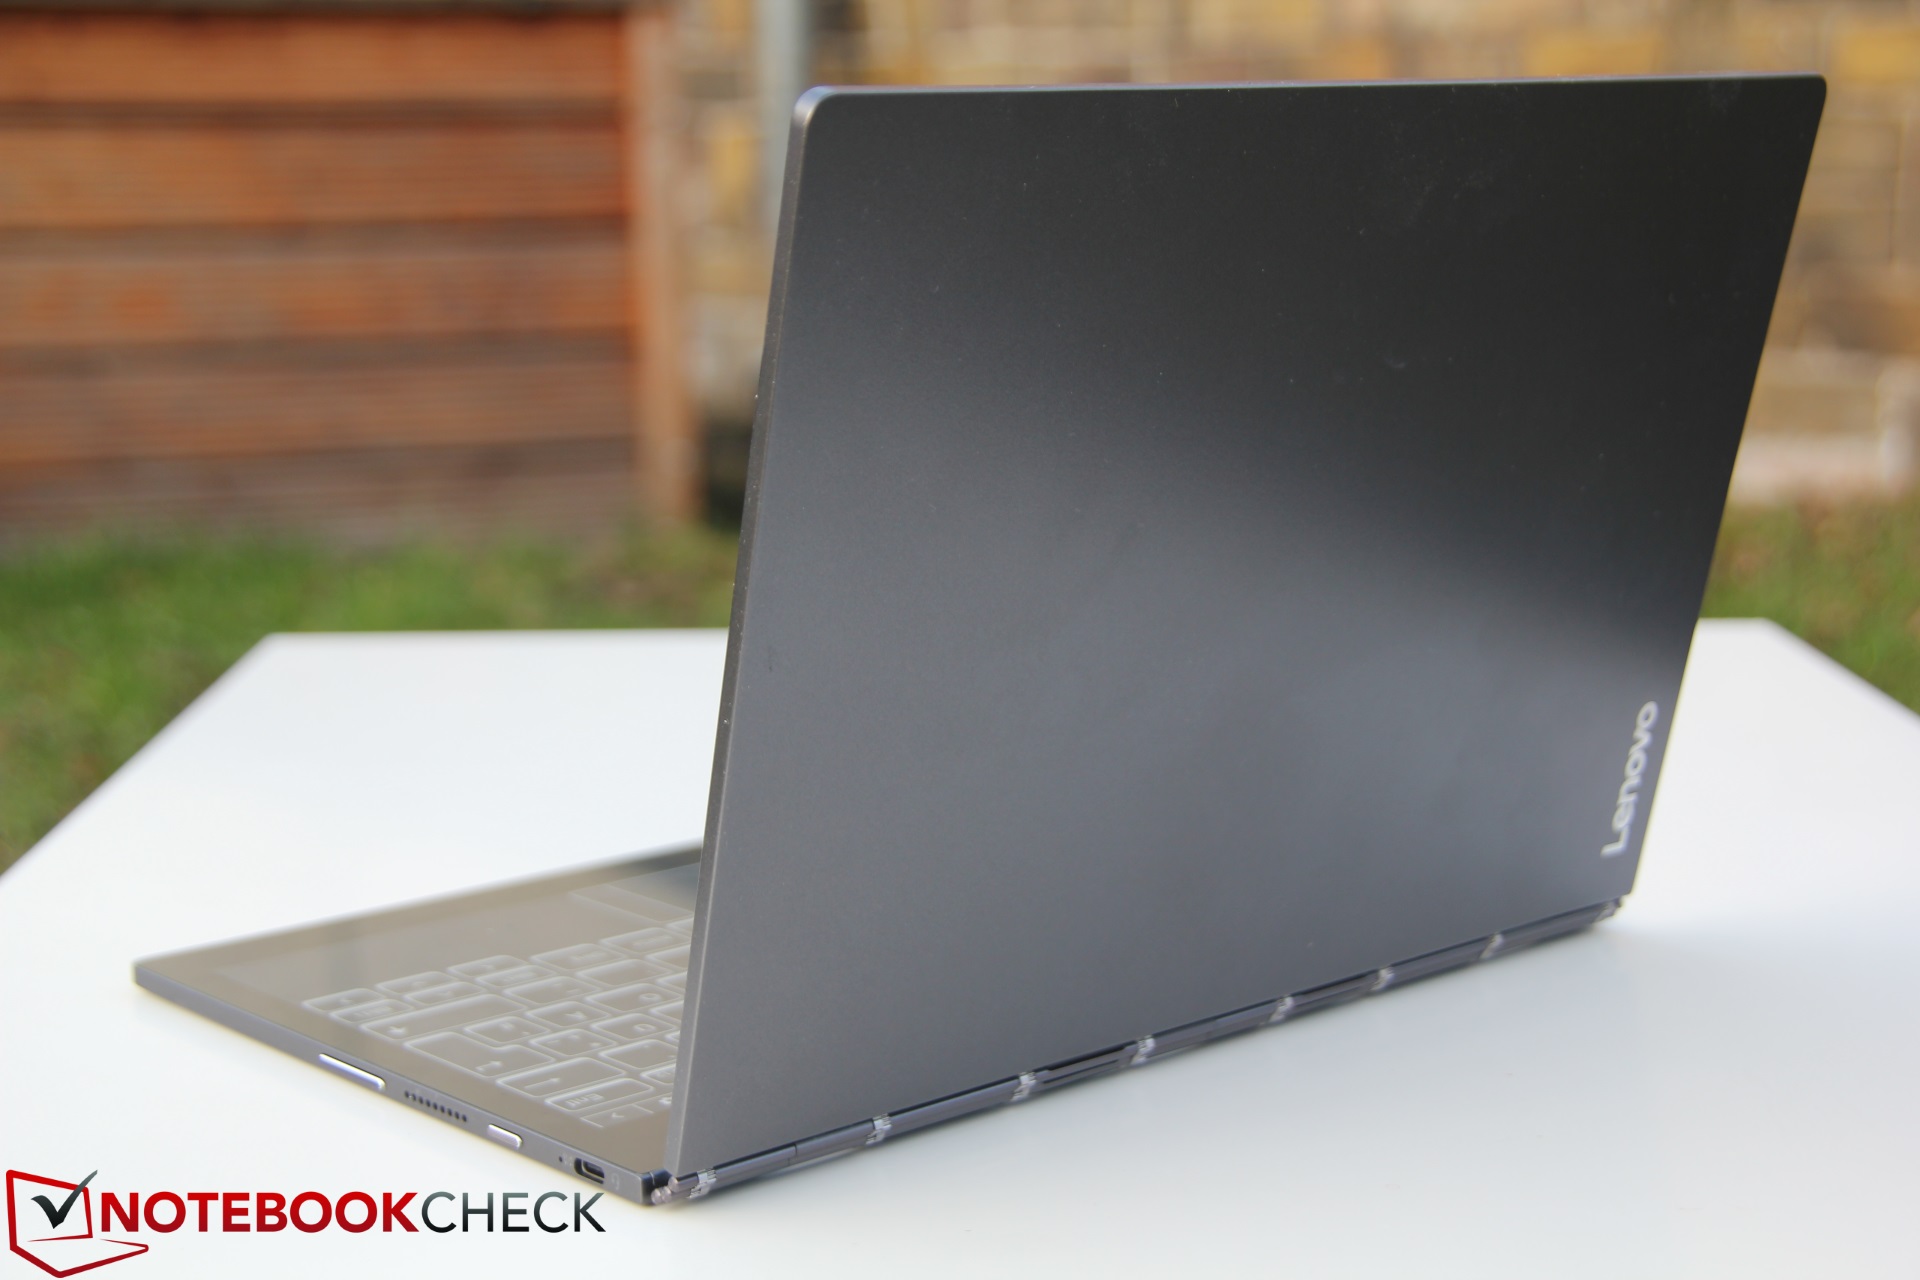
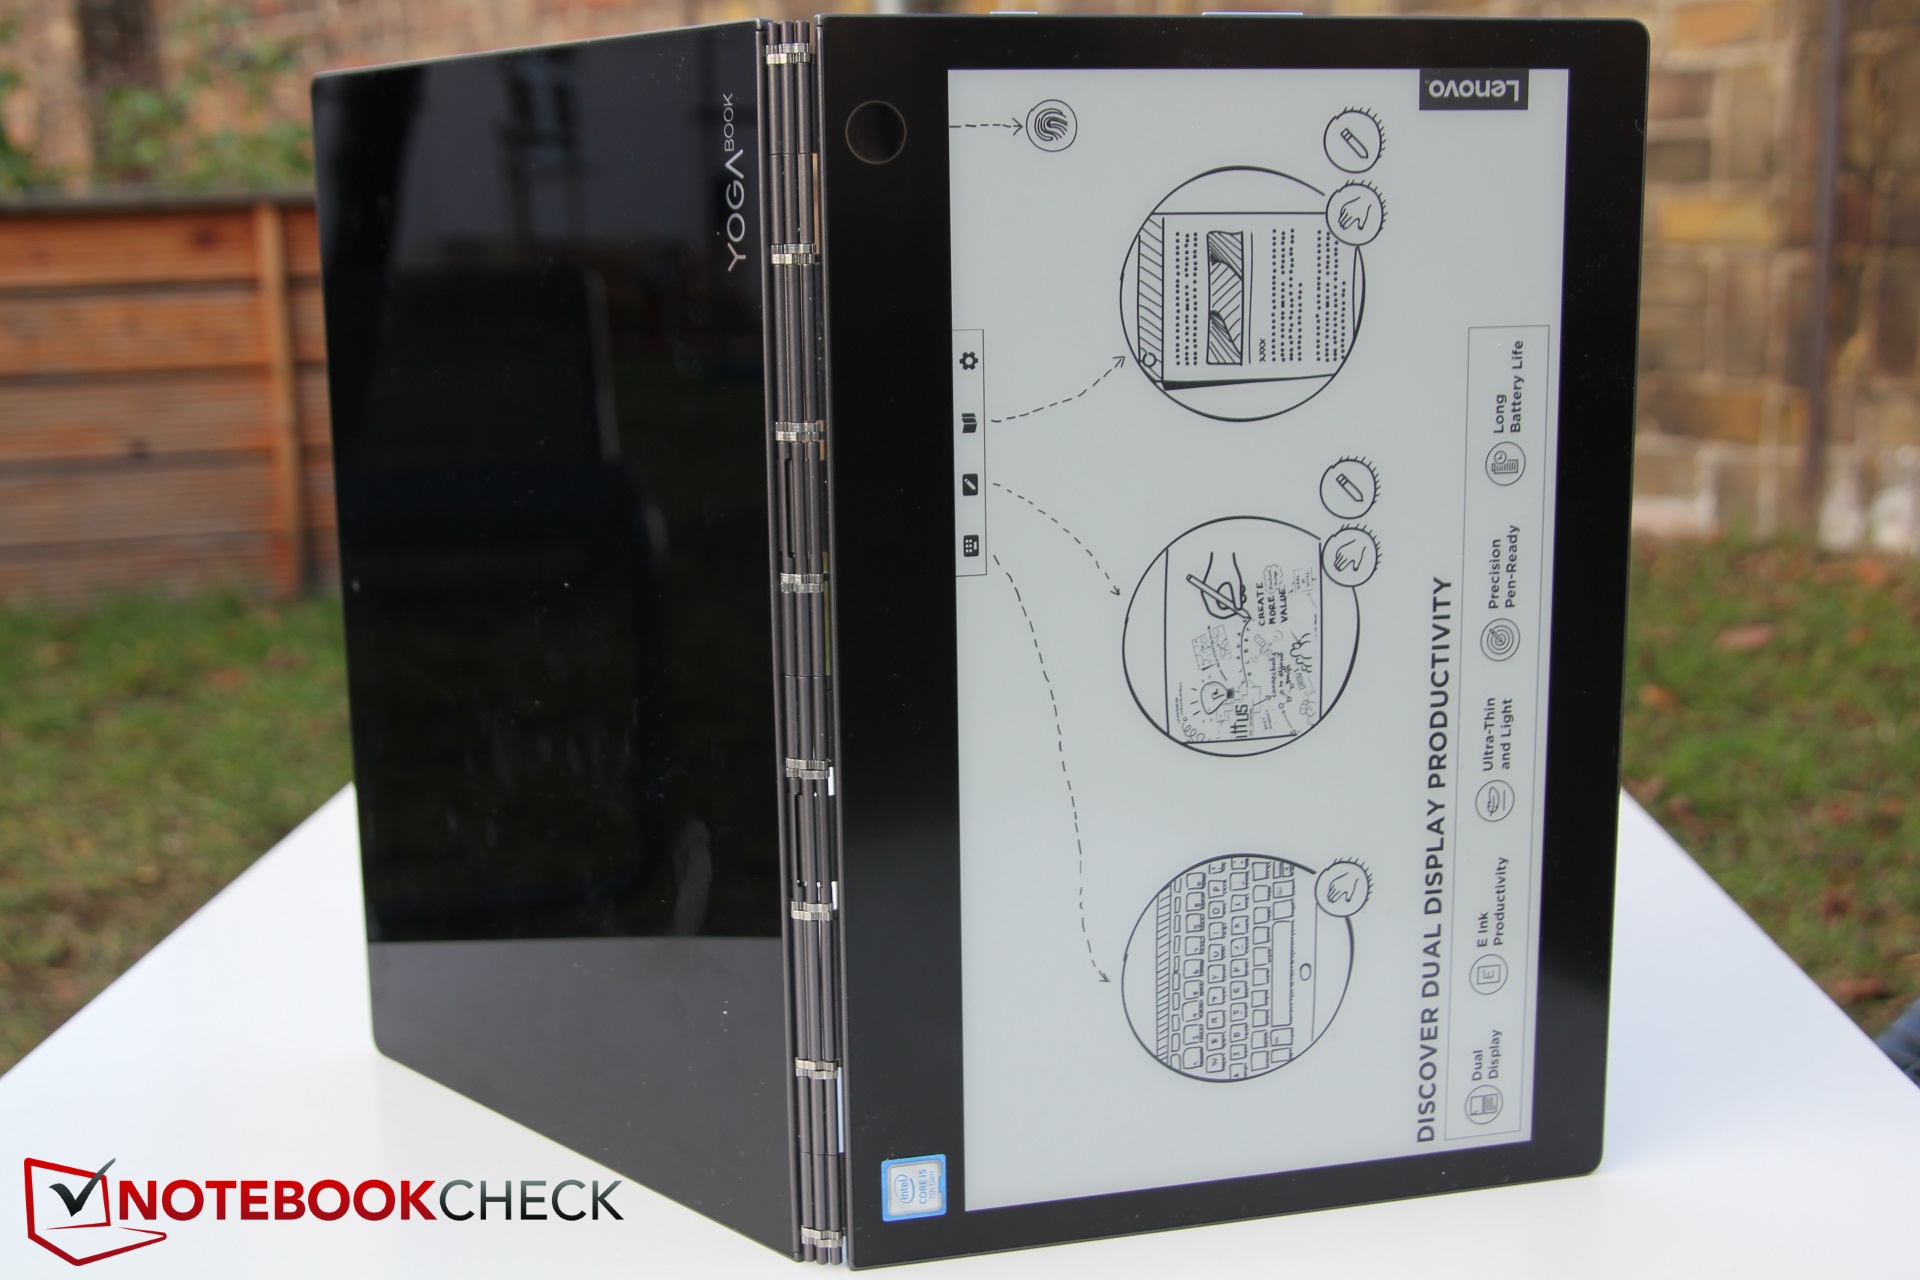
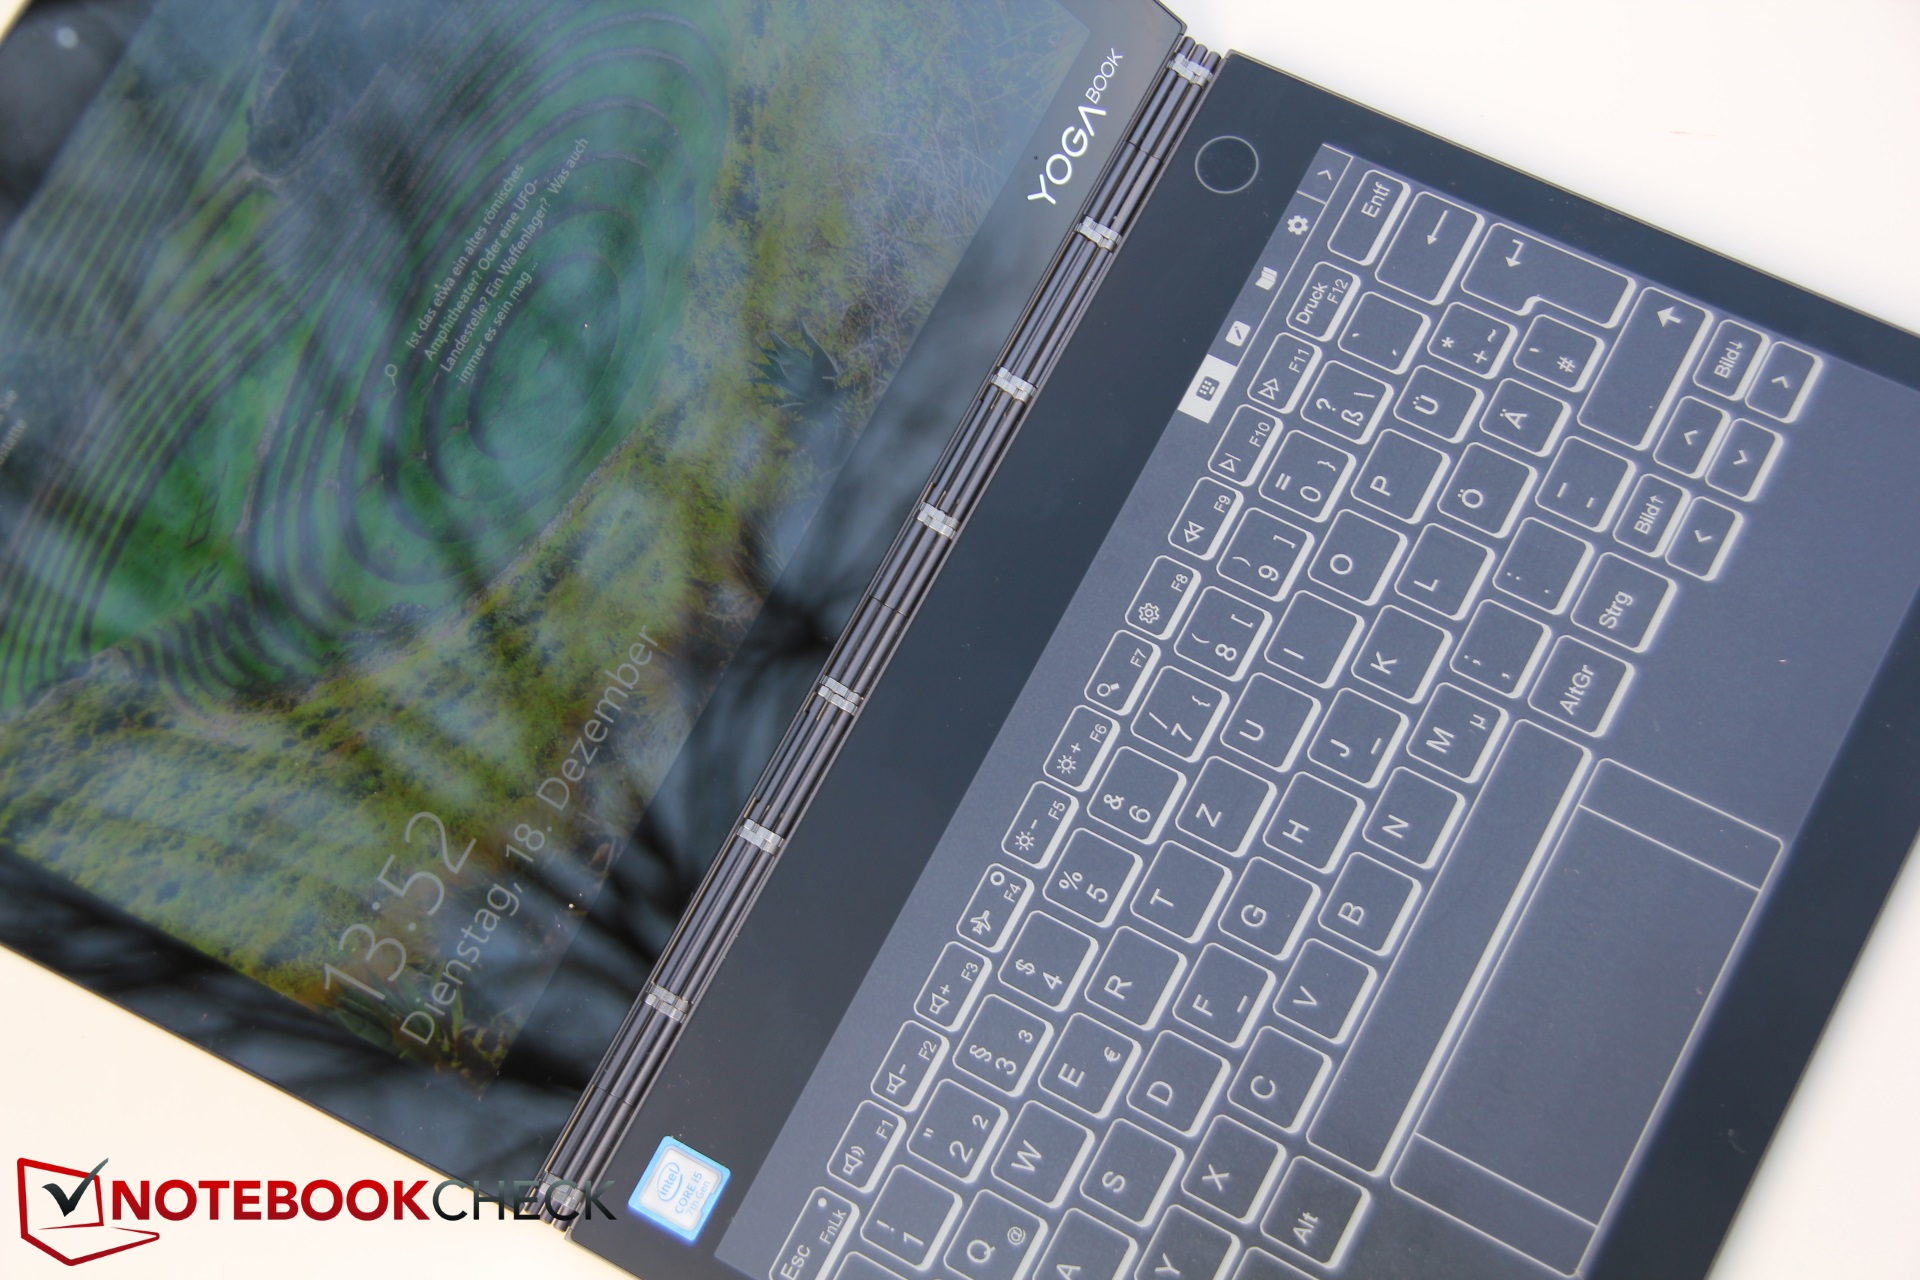
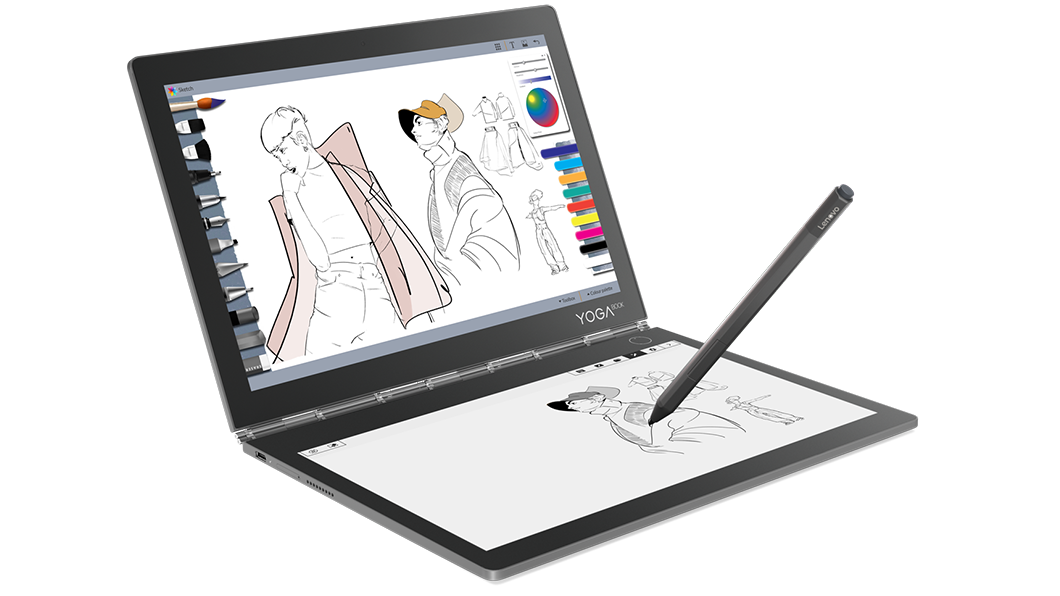
Nya Yoga Book har en E-Ink skärm som gör den väldigt unik. Den största fördelen är dess mångsidighet. Den är extremt liten och lätt och kan användas för att rita på, som en laptop, en surfplatta eller en e-läsare. Men flexibilititen resulterar också i en del kompromisser.
Som exempel är tangentbordet inte lämpat för den som skriver mycket och det är heller inte bakgrundsbelyst. Det magra portutbudet kan vara problematiskt för traditionella laptop-användare. Om det bara är en e-läsare du behöver kan du troligen hitta ännu lättare enheter.
Lenovo Book riktar sig åt personer som vill kombinera alla dess funktioner (tryckkänslighet, penna, e-läsare, osv) i en och samma enhet. Den som letar efter en normal laptop blir nog mer nöjd med en annan enhet.
Oavsett är det förvånande att se hur bra Lenovo har lyckats med att kombinera alla dessa funktioner i en såpass lätt enhet. Designen och de häftiga funktionerna (knackning) gör Book C930 riktigt iögonfallande. Eftersom vi inte har en separat kategori för E-Ink skärmar i vårt utvärderingssystem har vi lagt till två poäng till resultatet manuellt.
En del kan tänkas tycka att priset är en ytterligare nackdel. Med ett utgångspris på 10.500 kronor kostar enheten ungefär dubbelt så mycket som föregångaren gjorde. Utöver de många förbättringarna har en del funktioner också försvunnit. Möjligheten att digitalisera bilder från papper finns inte längre. Den bättre huvudkameran som fanns på den tidigare modellen saknas också och tyvärr är batteritiden betydligt kortare jämfört med föregångaren. Istället har prestandan ökat dramatiskt och dessutom är skärmen bättre. Sist men inte minst: enheten har för tillfället inga riktiga konkurrenter.
Lenovo Yoga Book C930 YB-J912F
- 12/22/2018 v6 (old)
Christian Hintze
Price comparison
