Test: Lenovo Yoga 720 12 (i5-7200U, 128 GB) Omvandlingsbar (Sammanfattning)
| |||||||||||||||||||||||||
Distribution av ljusstyrkan: 87 %
Mitt på batteriet: 285 cd/m²
Kontrast: 1239:1 (Svärta: 0.23 cd/m²)
ΔE ColorChecker Calman: 5.6 | ∀{0.5-29.43 Ø4.71}
ΔE Greyscale Calman: 5.39 | ∀{0.09-98 Ø4.96}
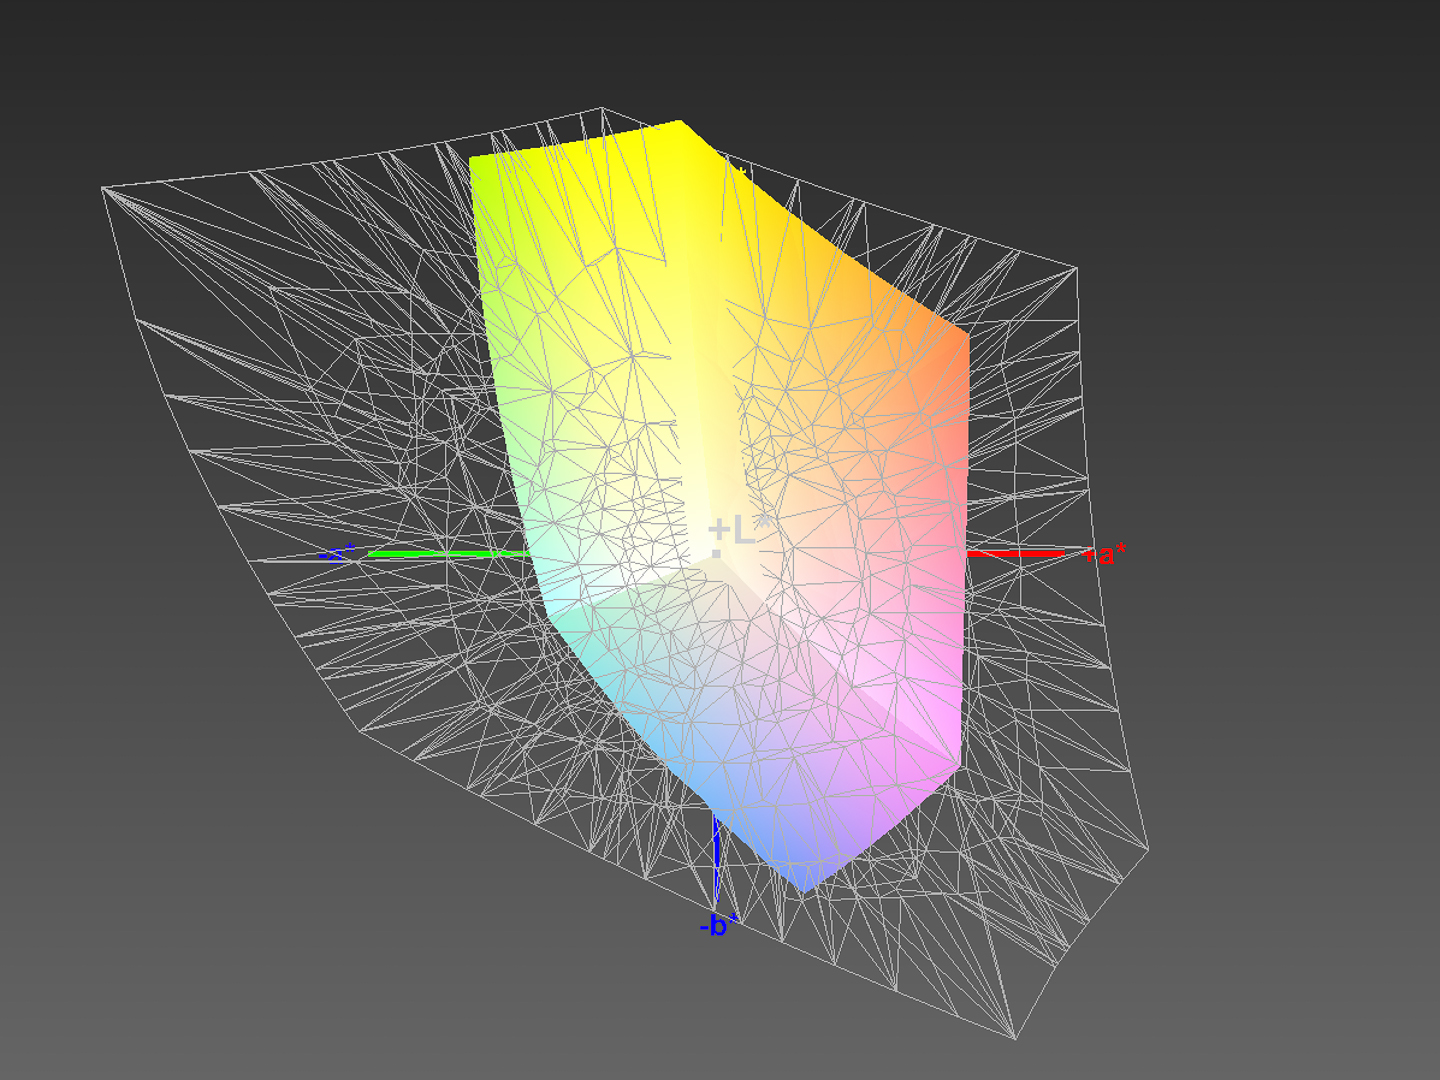
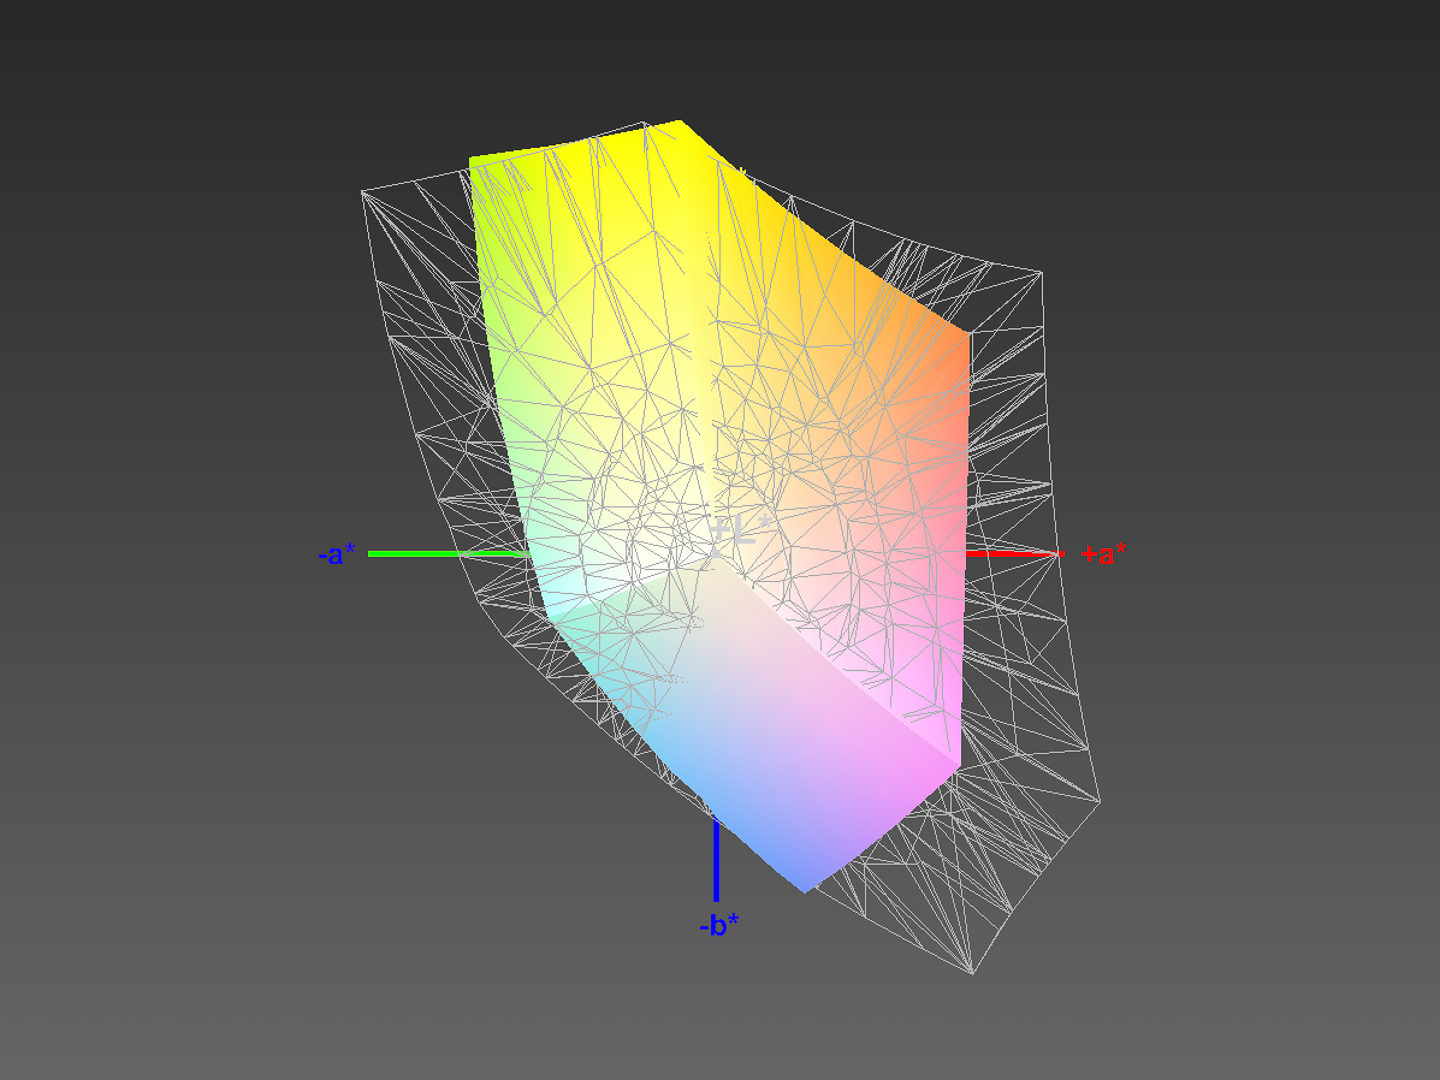
64% sRGB (Argyll 1.6.3 3D)
41% AdobeRGB 1998 (Argyll 1.6.3 3D)
45.49% AdobeRGB 1998 (Argyll 3D)
64% sRGB (Argyll 3D)
44.05% Display P3 (Argyll 3D)
Gamma: 2.2
CCT: 5925 K
| Lenovo Yoga 720-12IKB AU Optronics AUO226D / B125HAN02.2, , 1920x1080, 12.5" | Acer Spin 5 SP513-52N-54SF LC133LF102, , 1920x1080, 13.3" | Asus Zenbook Flip UX360UAK-BB351T AU Optronics B133HAN02.7, , 1920x1080, 13.3" | Lenovo Miix 520-12IKB 81CG Unknown, , 1920x1200, 12.2" | HP Pavilion x360 13-u102ng LG Philips, , 1920x1080, 13.3" | Microsoft Surface Pro (2017) m3 LG Display LP123WQ112604, , 2736x1826, 12.3" | |
|---|---|---|---|---|---|---|
| Display | 53% | 44% | 44% | -9% | 55% | |
| Display P3 Coverage (%) | 44.05 | 69.8 58% | 64.1 46% | 64.4 46% | 39.43 -10% | 68.5 56% |
| sRGB Coverage (%) | 64 | 94.6 48% | 91.8 43% | 90.8 42% | 59.1 -8% | 99.2 55% |
| AdobeRGB 1998 Coverage (%) | 45.49 | 69.3 52% | 65.2 43% | 65.4 44% | 40.76 -10% | 70.1 54% |
| Response Times | -29% | -9% | -10% | -8% | -20% | |
| Response Time Grey 50% / Grey 80% * (ms) | 32 ? | 49 ? -53% | 36 ? -13% | 35.6 ? -11% | 38 ? -19% | 42 ? -31% |
| Response Time Black / White * (ms) | 26 ? | 27 ? -4% | 27 ? -4% | 28 ? -8% | 25 ? 4% | 28 ? -8% |
| PWM Frequency (Hz) | 1000 ? | 50 ? | 198.4 ? | |||
| Screen | 21% | 14% | -14% | -10% | 33% | |
| Brightness middle (cd/m²) | 285 | 295 4% | 368 29% | 348.8 22% | 277 -3% | 461 62% |
| Brightness (cd/m²) | 274 | 276 1% | 350 28% | 339 24% | 263 -4% | 444 62% |
| Brightness Distribution (%) | 87 | 88 1% | 87 0% | 87 0% | 88 1% | 93 7% |
| Black Level * (cd/m²) | 0.23 | 0.27 -17% | 0.29 -26% | 0.4 -74% | 0.31 -35% | 0.34 -48% |
| Contrast (:1) | 1239 | 1093 -12% | 1269 2% | 872 -30% | 894 -28% | 1356 9% |
| Colorchecker dE 2000 * | 5.6 | 2.97 47% | 5.26 6% | 7 -25% | 5.57 1% | 3.43 39% |
| Colorchecker dE 2000 max. * | 10.49 | 5.67 46% | 8.78 16% | 16.2 -54% | 13.6 -30% | 5.55 47% |
| Greyscale dE 2000 * | 5.39 | 3.12 42% | 5.87 -9% | 10.1 -87% | 4.56 15% | 3.08 43% |
| Gamma | 2.2 100% | 2.45 90% | 2.42 91% | 2.22 99% | 2.28 96% | 3.03 73% |
| CCT | 5925 110% | 6676 97% | 6998 93% | 9065 72% | 6648 98% | 7014 93% |
| Color Space (Percent of AdobeRGB 1998) (%) | 41 | 62 51% | 60 46% | 58.7 43% | 38 -7% | 64 56% |
| Color Space (Percent of sRGB) (%) | 64 | 94 47% | 92 44% | 90.9 42% | 59 -8% | 99 55% |
| Totalt genomsnitt (program/inställningar) | 15% /
21% | 16% /
17% | 7% /
-2% | -9% /
-9% | 23% /
31% |
* ... mindre är bättre
Visa svarstider
| ↔ Svarstid svart till vitt | ||
|---|---|---|
| 26 ms ... stiga ↗ och falla ↘ kombinerat | ↗ 16 ms stiga | 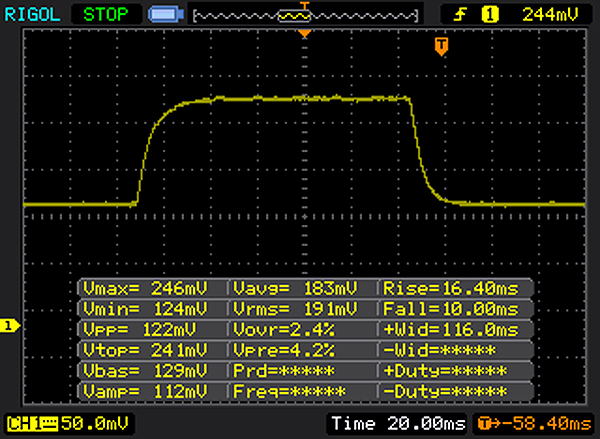 |
| ↘ 10 ms hösten | ||
| Skärmen visar relativt långsamma svarsfrekvenser i våra tester och kan vara för långsam för spelare. I jämförelse sträcker sig alla testade enheter från 0.1 (minst) till 240 (maximalt) ms. » 63 % av alla enheter är bättre. Detta innebär att den uppmätta svarstiden är sämre än genomsnittet av alla testade enheter (19.8 ms). | ||
| ↔ Svarstid 50 % grått till 80 % grått | ||
| 32 ms ... stiga ↗ och falla ↘ kombinerat | ↗ 15 ms stiga | 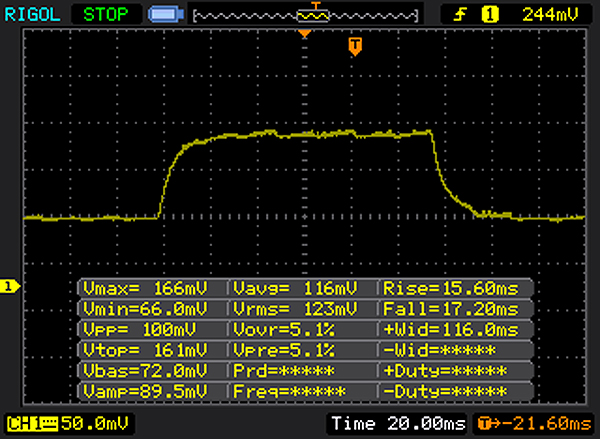 |
| ↘ 17 ms hösten | ||
| Skärmen visar långsamma svarsfrekvenser i våra tester och kommer att vara otillfredsställande för spelare. I jämförelse sträcker sig alla testade enheter från 0.165 (minst) till 636 (maximalt) ms. » 43 % av alla enheter är bättre. Det betyder att den uppmätta svarstiden liknar genomsnittet av alla testade enheter (30.9 ms). | ||
Skärmflimmer / PWM (Puls-Width Modulation)
| Skärmflimmer / PWM upptäcktes inte | ||
Som jämförelse: 52 % av alla testade enheter använder inte PWM för att dämpa skärmen. Om PWM upptäcktes mättes ett medelvärde av 7744 (minst: 5 - maximum: 343500) Hz. | ||
| PCMark 8 Home Score Accelerated v2 | 3699 poäng | |
| PCMark 8 Work Score Accelerated v2 | 4442 poäng | |
Hjälp | ||
| Lenovo Yoga 720-12IKB Liteonit CV3-8D128 | Acer Spin 5 SP513-52N-54SF Micron 1100 MTFDDAV256TBN | Asus Zenbook Flip UX360UAK-BB351T Micron SSD 1100 (MTFDDAV256TBN) | HP Pavilion x360 13-u102ng HGST Travelstar 5K1000 HTS541010A7E630 | Microsoft Surface Pro (2017) m3 Samsung PM971 KUS020203M | |
|---|---|---|---|---|---|
| CrystalDiskMark 3.0 | 52% | 38% | -86% | 59% | |
| Read Seq (MB/s) | 449.7 | 462.7 3% | 478.4 6% | 104.8 -77% | 691 54% |
| Write Seq (MB/s) | 195.6 | 439.9 125% | 419.9 115% | 91 -53% | 670 243% |
| Read 512 (MB/s) | 225.6 | 325.2 44% | 351.7 56% | 20.67 -91% | 261.1 16% |
| Write 512 (MB/s) | 153 | 361.9 137% | 294.2 92% | 45.05 -71% | 241 58% |
| Read 4k (MB/s) | 28.01 | 27.52 -2% | 24 -14% | 0.215 -99% | 40.11 43% |
| Write 4k (MB/s) | 68.1 | 91.6 35% | 87 28% | 1.037 -98% | 98.8 45% |
| Read 4k QD32 (MB/s) | 295.8 | 247.3 -16% | 199.3 -33% | 0.968 -100% | 301.8 2% |
| Write 4k QD32 (MB/s) | 153.5 | 292 90% | 232.4 51% | 1.09 -99% | 172 12% |

| 3DMark | |
| 1280x720 Cloud Gate Standard Graphics | |
| Acer Spin 5 SP513-52N-54SF | |
| Lenovo Miix 520-12IKB 81CG | |
| Lenovo Yoga 720-12IKB | |
| HP Pavilion x360 13-u102ng | |
| Microsoft Surface Pro (2017) m3 | |
| 1920x1080 Fire Strike Graphics | |
| Acer Spin 5 SP513-52N-54SF | |
| Lenovo Miix 520-12IKB 81CG | |
| Lenovo Yoga 720-12IKB | |
| HP Pavilion x360 13-u102ng | |
| Microsoft Surface Pro (2017) m3 | |
| 3DMark 11 Performance | 1658 poäng | |
| 3DMark Cloud Gate Standard Score | 6488 poäng | |
| 3DMark Fire Strike Score | 931 poäng | |
Hjälp | ||
| låg | med. | hög | ultra | |
|---|---|---|---|---|
| The Witcher 3 (2015) | 12.8 | |||
| Rise of the Tomb Raider (2016) | 19.2 | |||
| Farming Simulator 17 (2016) | 0 allvarliga grafiska problem |
Ljudnivå
| Låg belastning |
| 30.3 / 30.3 / 30.3 dB(A) |
| Hög belastning |
| 36 / 37.4 dB(A) |
 | ||
30 dB tyst 40 dB(A) hörbar 50 dB(A) högt ljud |
||
min: | ||
(±) Den maximala temperaturen på ovansidan är 42.1 °C / 108 F, jämfört med genomsnittet av 35.4 °C / 96 F , allt från 19.6 till 60 °C för klassen Convertible.
(±) Botten värms upp till maximalt 43 °C / 109 F, jämfört med genomsnittet av 36.9 °C / 98 F
(+) Vid tomgångsbruk är medeltemperaturen för ovansidan 23.8 °C / 75 F, jämfört med enhetsgenomsnittet på 30.3 °C / ### class_avg_f### F.
(+) Handledsstöden och pekplattan är kallare än hudtemperaturen med maximalt 29 °C / 84.2 F och är därför svala att ta på.
(±) Medeltemperaturen för handledsstödsområdet på liknande enheter var 28 °C / 82.4 F (-1 °C / -1.8 F).
Lenovo Yoga 720-12IKB ljudanalys
(-) | inte särskilt höga högtalare (71.8 dB)
Bas 100 - 315 Hz
(-) | nästan ingen bas - i genomsnitt 20.5% lägre än medianen
(±) | linjäriteten för basen är genomsnittlig (14% delta till föregående frekvens)
Mellan 400 - 2000 Hz
(±) | högre mellan - i genomsnitt 6% högre än median
(±) | linjäriteten för mids är genomsnittlig (10.7% delta till föregående frekvens)
Högsta 2 - 16 kHz
(+) | balanserade toppar - endast 4.7% från medianen
(±) | linjäriteten för toppar är genomsnittlig (7.9% delta till föregående frekvens)
Totalt 100 - 16 000 Hz
(±) | linjäriteten för det totala ljudet är genomsnittlig (25.8% skillnad mot median)
Jämfört med samma klass
» 79% av alla testade enheter i den här klassen var bättre, 4% liknande, 16% sämre
» Den bästa hade ett delta på 6%, genomsnittet var 20%, sämst var 57%
Jämfört med alla testade enheter
» 79% av alla testade enheter var bättre, 4% liknande, 17% sämre
» Den bästa hade ett delta på 4%, genomsnittet var 23%, sämst var 134%
Asus Zenbook Flip UX360UAK-BB351T ljudanalys
(-) | inte särskilt höga högtalare (63 dB)
Bas 100 - 315 Hz
(±) | reducerad bas - i genomsnitt 10.1% lägre än medianen
(±) | linjäriteten för basen är genomsnittlig (7.4% delta till föregående frekvens)
Mellan 400 - 2000 Hz
(+) | balanserad mellan - endast 2.6% från medianen
(+) | mids är linjära (2.8% delta till föregående frekvens)
Högsta 2 - 16 kHz
(+) | balanserade toppar - endast 2.6% från medianen
(+) | toppar är linjära (3.1% delta till föregående frekvens)
Totalt 100 - 16 000 Hz
(+) | det totala ljudet är linjärt (14.4% skillnad mot median)
Jämfört med samma klass
» 22% av alla testade enheter i den här klassen var bättre, 3% liknande, 75% sämre
» Den bästa hade ett delta på 6%, genomsnittet var 20%, sämst var 57%
Jämfört med alla testade enheter
» 18% av alla testade enheter var bättre, 4% liknande, 78% sämre
» Den bästa hade ett delta på 4%, genomsnittet var 23%, sämst var 134%
Microsoft Surface Pro (2017) m3 ljudanalys
(-) | inte särskilt höga högtalare (68.8 dB)
Bas 100 - 315 Hz
(±) | reducerad bas - i genomsnitt 12.9% lägre än medianen
(±) | linjäriteten för basen är genomsnittlig (10.5% delta till föregående frekvens)
Mellan 400 - 2000 Hz
(+) | balanserad mellan - endast 3.7% från medianen
(±) | linjäriteten för mids är genomsnittlig (9.6% delta till föregående frekvens)
Högsta 2 - 16 kHz
(+) | balanserade toppar - endast 4.1% från medianen
(±) | linjäriteten för toppar är genomsnittlig (8.6% delta till föregående frekvens)
Totalt 100 - 16 000 Hz
(±) | linjäriteten för det totala ljudet är genomsnittlig (19.1% skillnad mot median)
Jämfört med samma klass
» 46% av alla testade enheter i den här klassen var bättre, 7% liknande, 48% sämre
» Den bästa hade ett delta på 6%, genomsnittet var 20%, sämst var 57%
Jämfört med alla testade enheter
» 46% av alla testade enheter var bättre, 7% liknande, 47% sämre
» Den bästa hade ett delta på 4%, genomsnittet var 23%, sämst var 134%
| Av/Standby | |
| Låg belastning | |
| Hög belastning |
|
Förklaring:
min: | |
| Lenovo Yoga 720-12IKB i5-7200U, HD Graphics 620, Liteonit CV3-8D128, IPS, 1920x1080, 12.5" | Acer Spin 5 SP513-52N-54SF i5-8250U, UHD Graphics 620, Micron 1100 MTFDDAV256TBN, IPS, 1920x1080, 13.3" | Asus Zenbook Flip UX360UAK-BB351T i5-7200U, HD Graphics 620, Micron SSD 1100 (MTFDDAV256TBN), IPS, 1920x1080, 13.3" | Lenovo Miix 520-12IKB 81CG i5-8250U, UHD Graphics 620, Samsung PM961 MZVLW256HEHP, IPS, 1920x1200, 12.2" | HP Pavilion x360 13-u102ng i5-7200U, HD Graphics 620, HGST Travelstar 5K1000 HTS541010A7E630, IPS, 1920x1080, 13.3" | Microsoft Surface Pro (2017) m3 m3-7Y30, HD Graphics 615, Samsung PM971 KUS020203M, IPS, 2736x1826, 12.3" | |
|---|---|---|---|---|---|---|
| Power Consumption | -15% | -16% | -44% | -13% | -7% | |
| Idle Minimum * (Watt) | 3.7 | 3.9 -5% | 4.2 -14% | 5.5 -49% | 4.7 -27% | 3.1 16% |
| Idle Average * (Watt) | 5.7 | 8.2 -44% | 7.4 -30% | 8.3 -46% | 7.2 -26% | 8.8 -54% |
| Idle Maximum * (Watt) | 6.9 | 8.8 -28% | 8.6 -25% | 11.5 -67% | 7.9 -14% | 9.8 -42% |
| Load Average * (Watt) | 29.6 | 28.5 4% | 32 -8% | 38.3 -29% | 30 -1% | 22.7 23% |
| Load Maximum * (Watt) | 29.4 | 30.7 -4% | 30.2 -3% | 37.7 -28% | 29 1% | 23.6 20% |
* ... mindre är bättre
| Lenovo Yoga 720-12IKB i5-7200U, HD Graphics 620, 36 Wh | Acer Spin 5 SP513-52N-54SF i5-8250U, UHD Graphics 620, 53.9 Wh | Asus Zenbook Flip UX360UAK-BB351T i5-7200U, HD Graphics 620, 57 Wh | Lenovo Miix 520-12IKB 81CG i5-8250U, UHD Graphics 620, 38 Wh | HP Pavilion x360 13-u102ng i5-7200U, HD Graphics 620, 41 Wh | Microsoft Surface Pro (2017) m3 m3-7Y30, HD Graphics 615, 45 Wh | |
|---|---|---|---|---|---|---|
| Batteridrifttid | 38% | 95% | -9% | -12% | 82% | |
| Reader / Idle (h) | 11.5 | 12.3 7% | 9.3 -19% | 15.6 36% | ||
| WiFi v1.3 (h) | 6 | 8.3 38% | 11.7 95% | 5.6 -7% | 5.4 -10% | 11.4 90% |
| Load (h) | 1.5 | 1.1 -27% | 1.4 -7% | 3.3 120% | ||
| H.264 (h) | 5.3 | 11.1 |
För
Emot
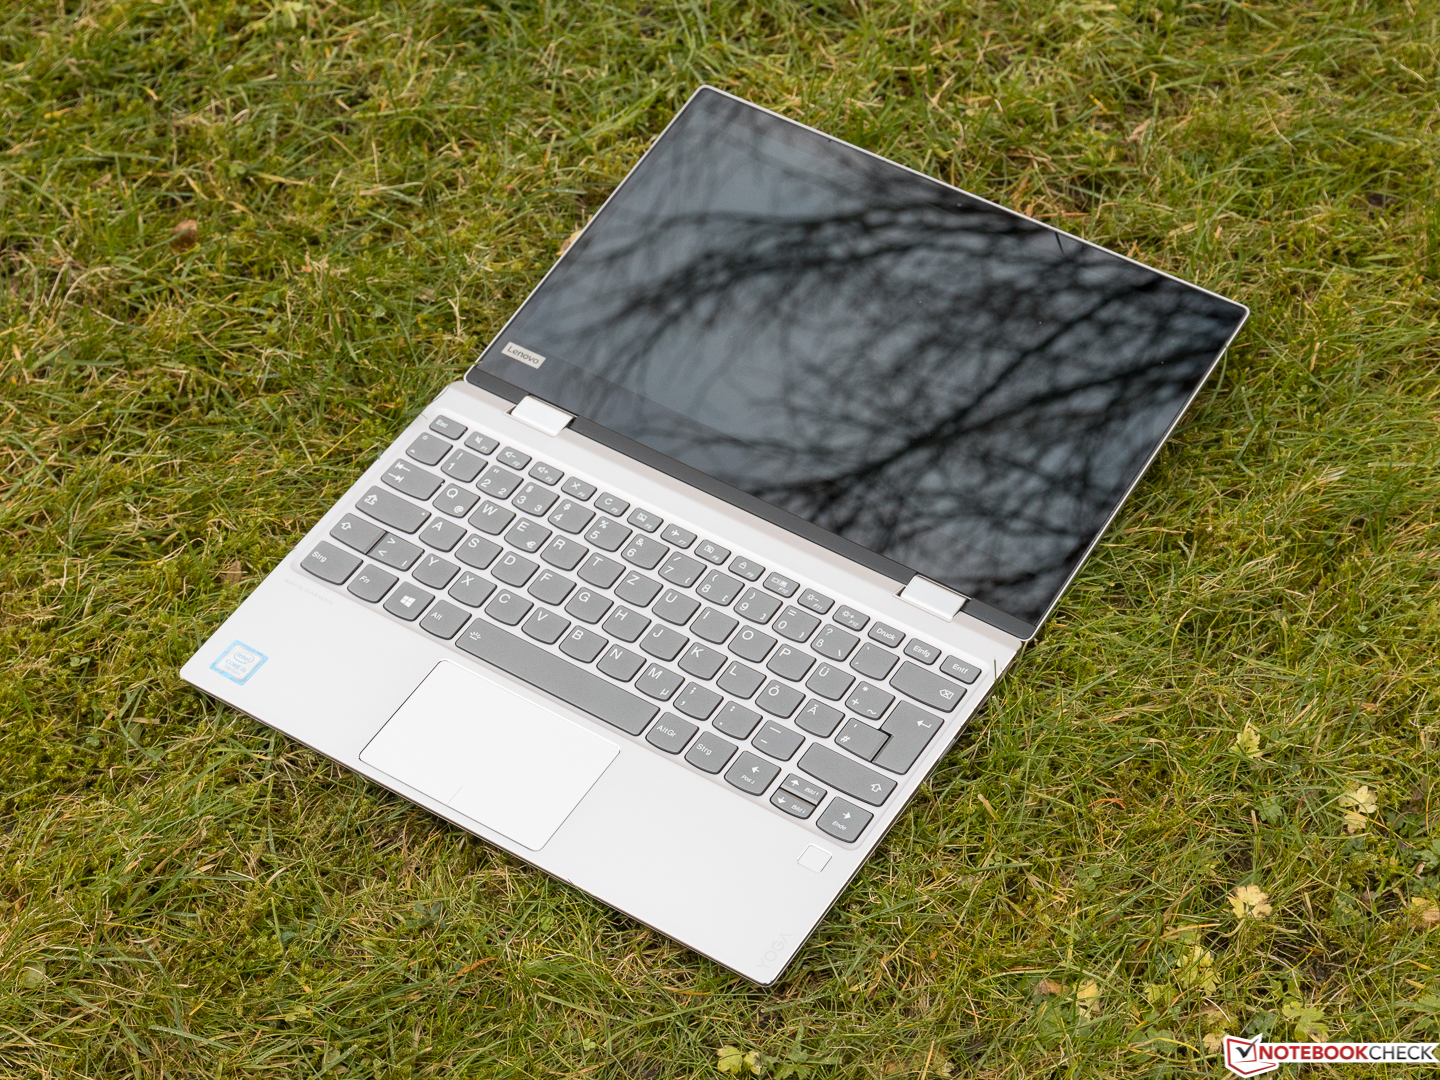
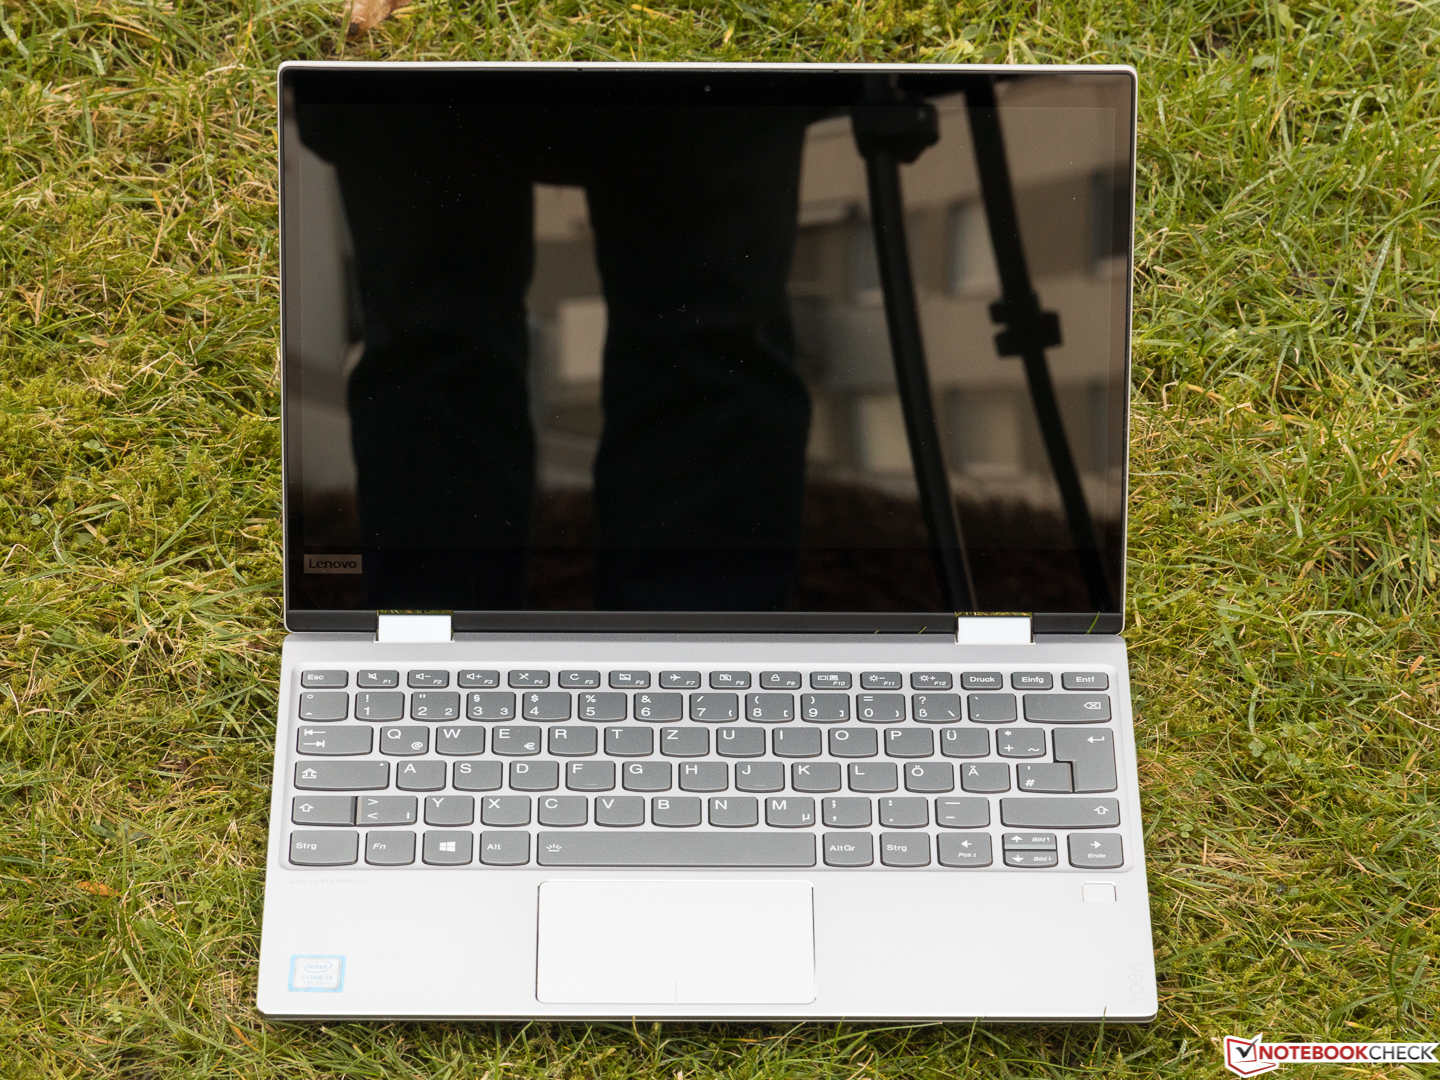
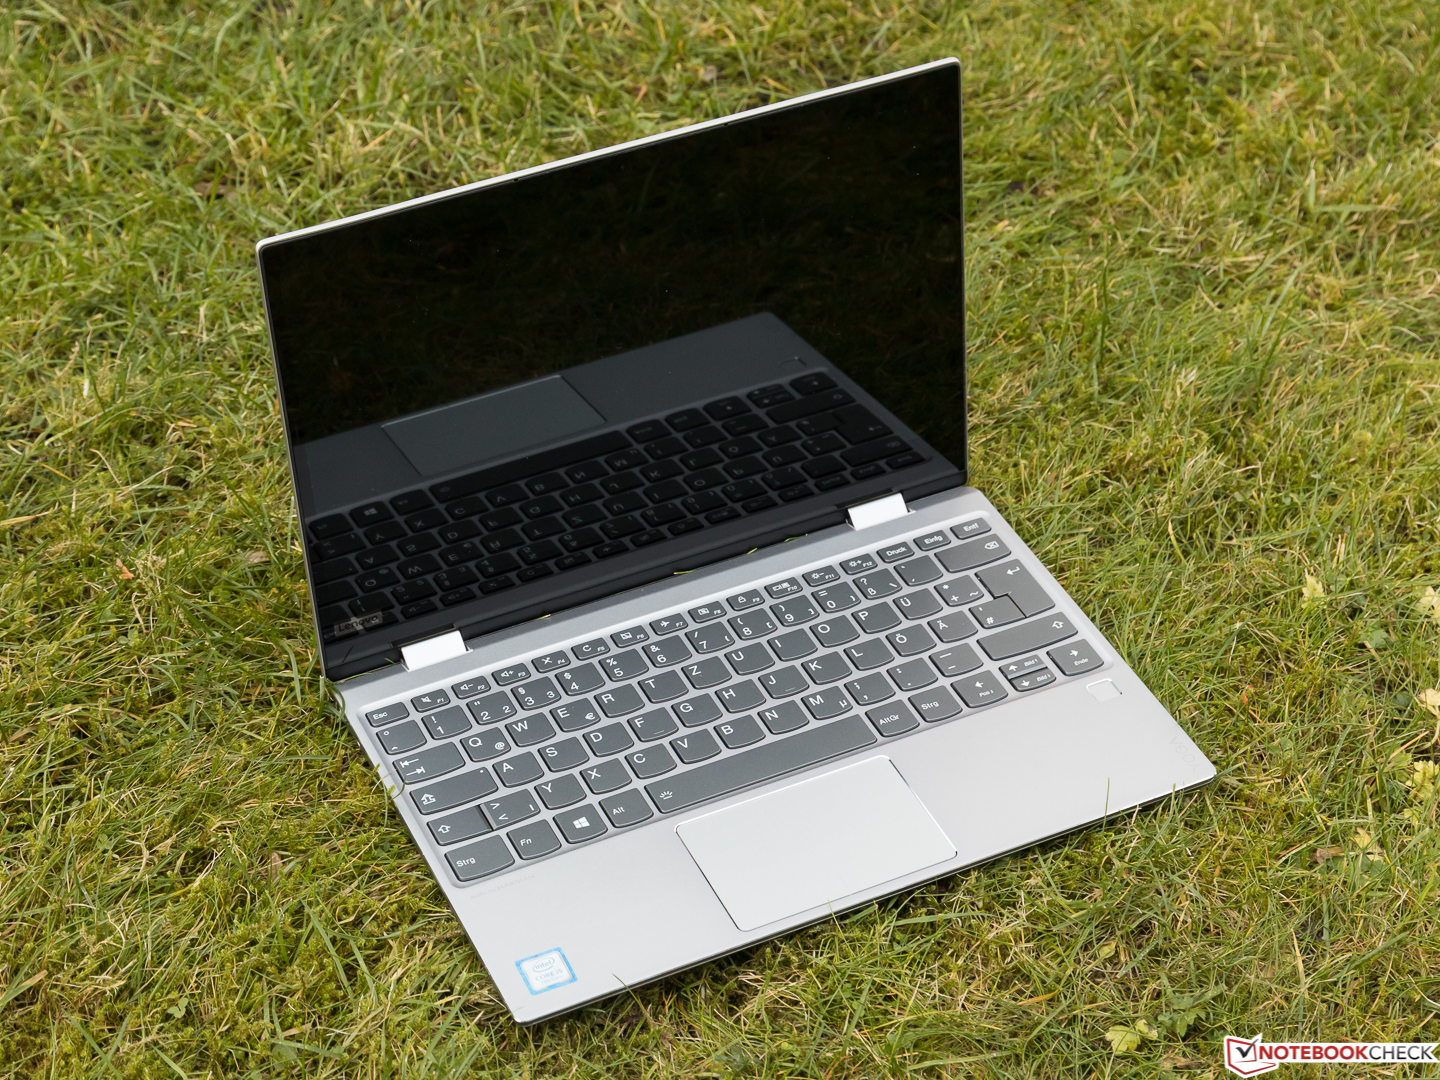
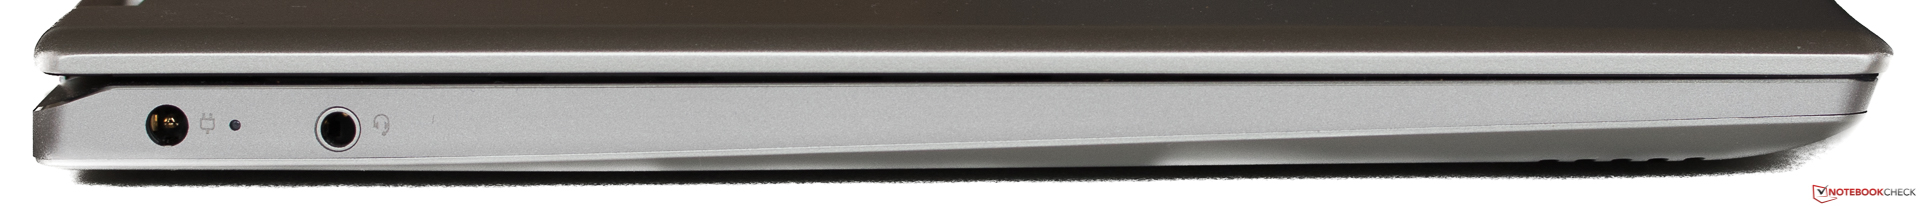
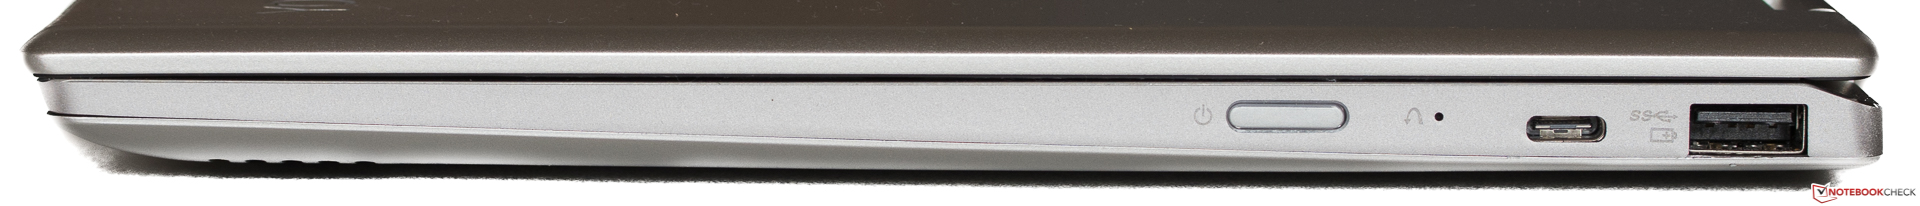
Kontorsanvändare kommer notera två nackdelar hos den annars väldesignade Lenovo Yoga 720-12IKB – den jämförelsevis långsamma WLAN-modulen och, viktigast, batteritiden täcker inte en hel arbetsdag på resande fot. Valet av skärm är väldigt bra bortsett från seriös bildredigering och de långsamma resultaten från SSD-prestandatesten påverkar inte den bra systemprestandan. Begränsat utbud av portar är vanligt bland kompakta omvandlingsbara, så vi kan knappast kritisera Yoga för det.
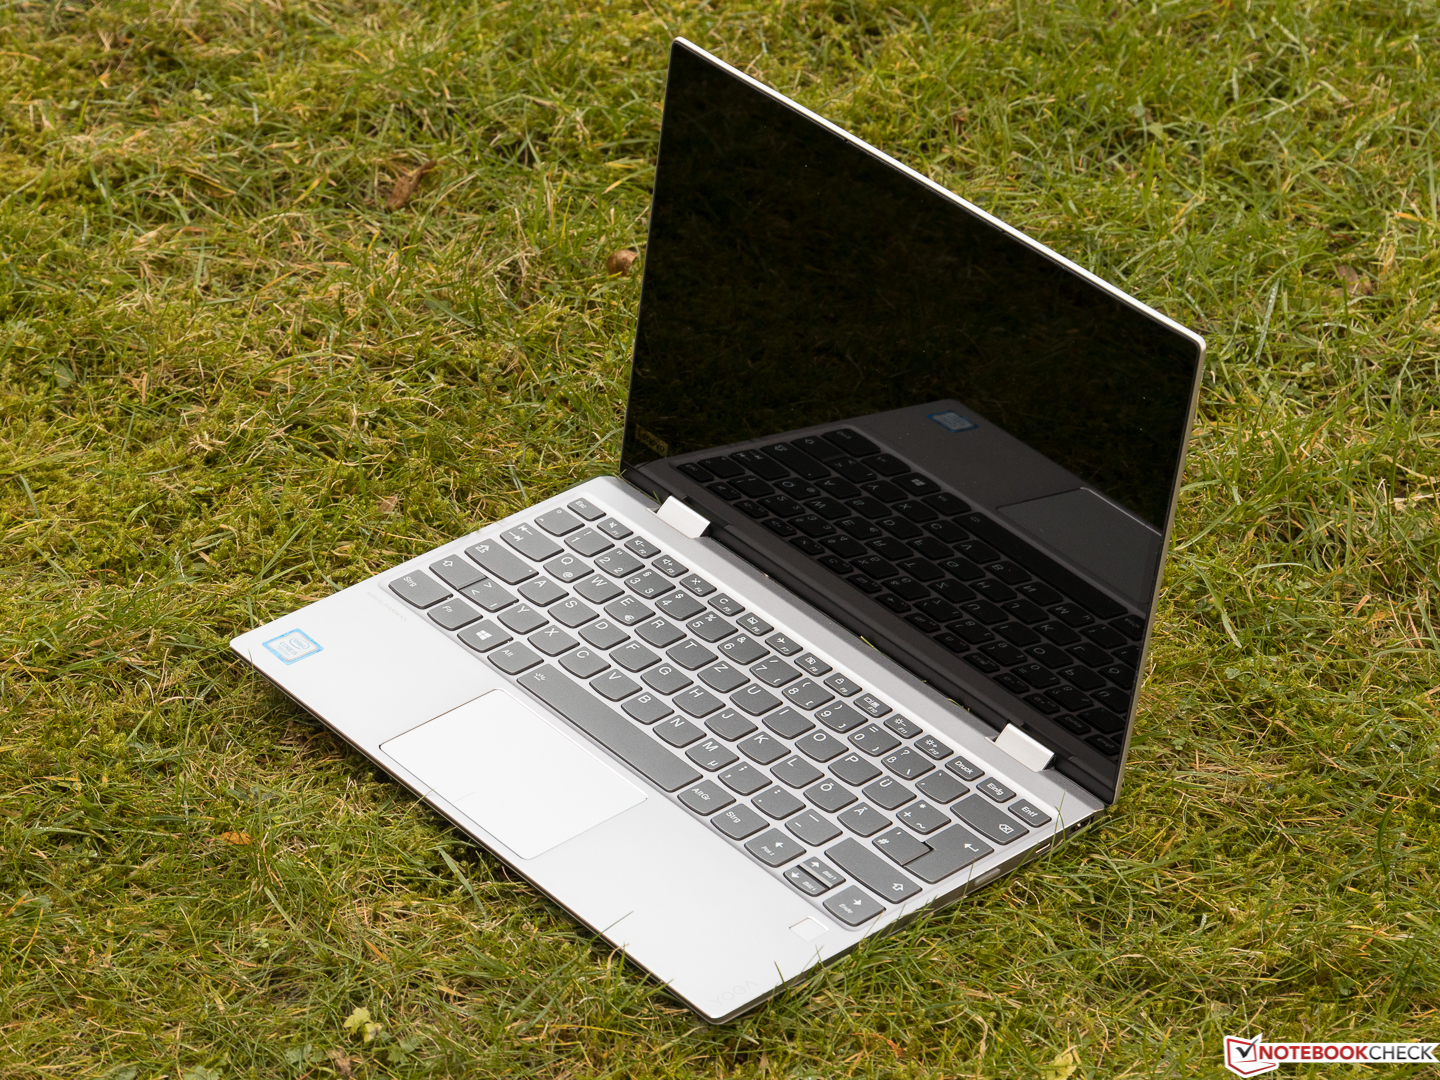
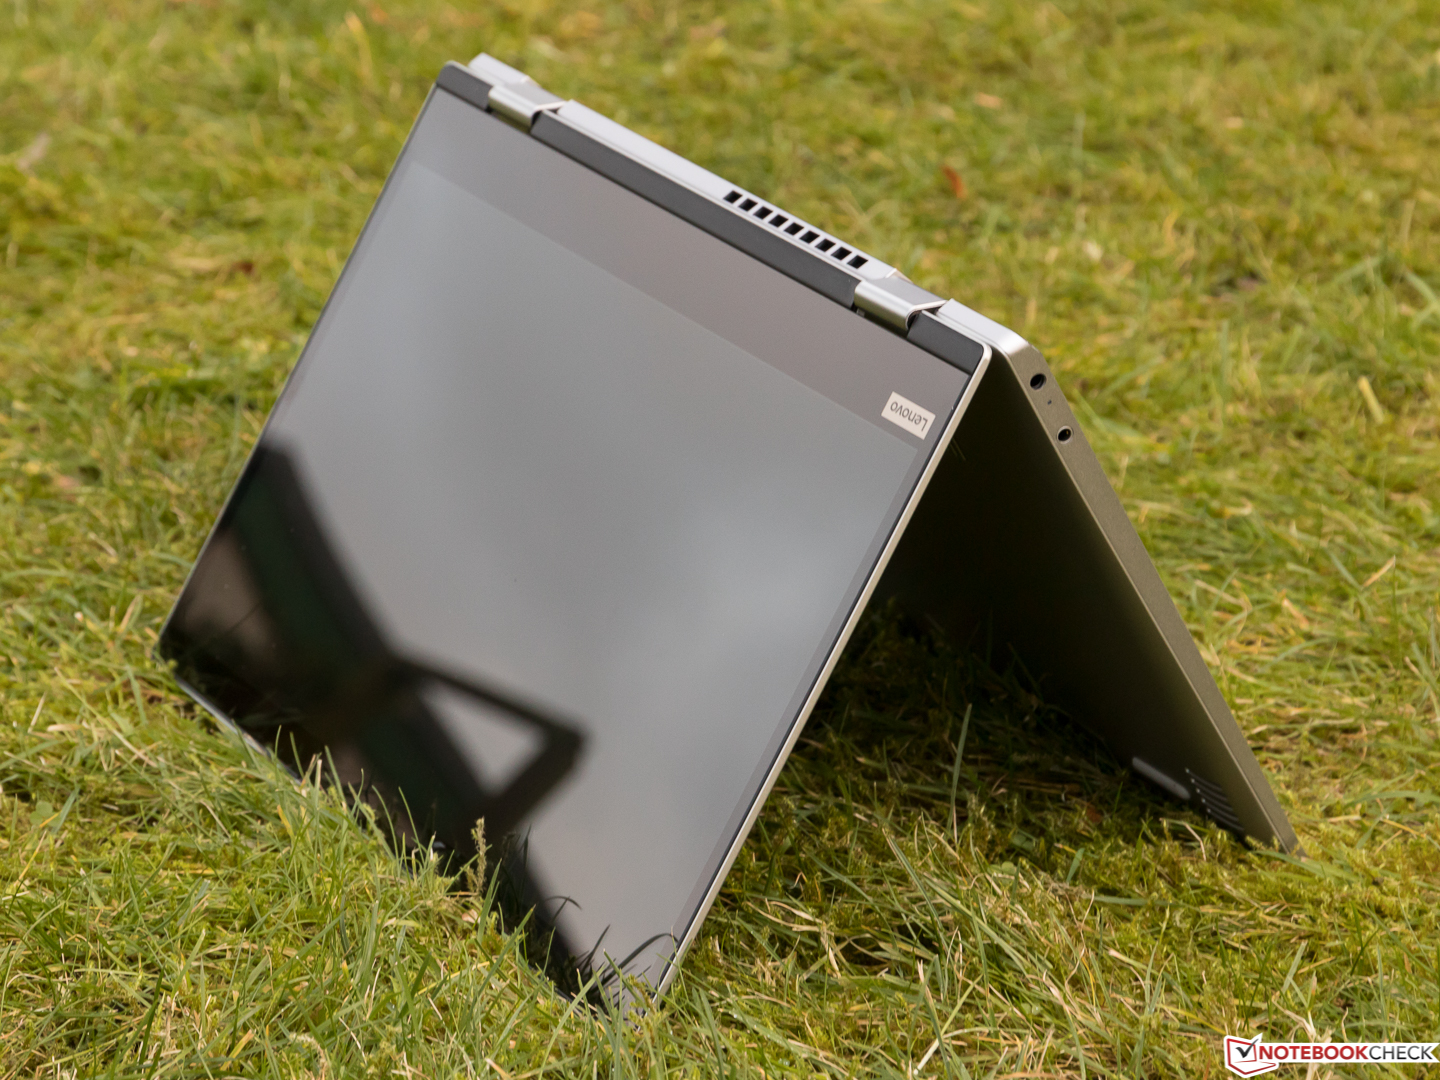
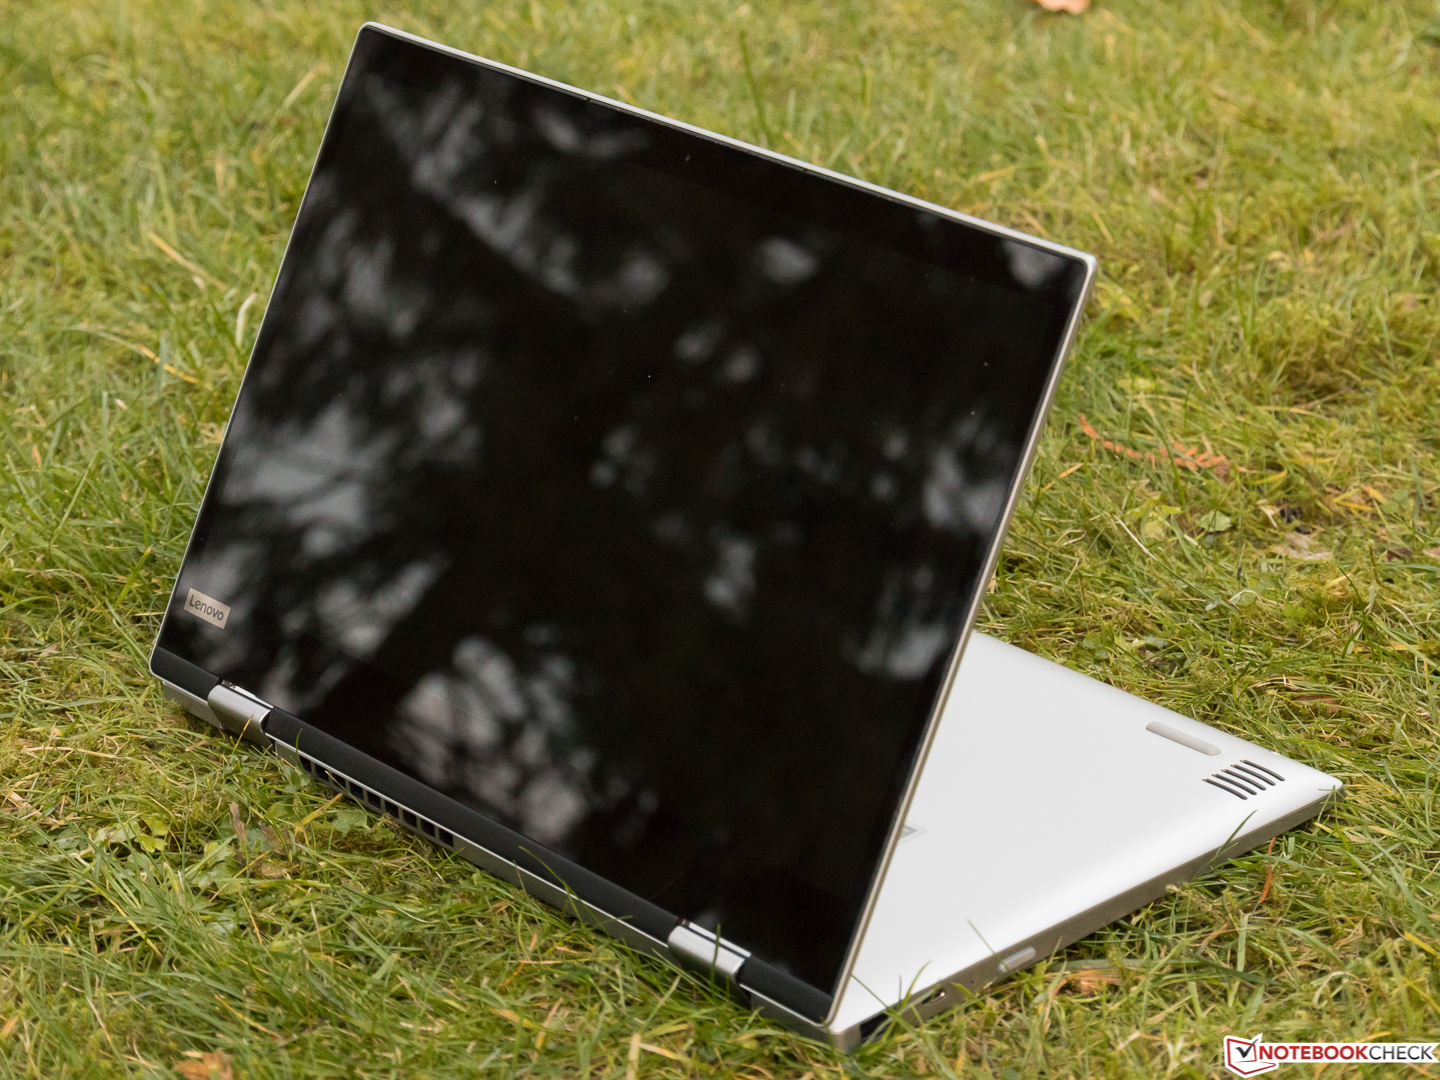
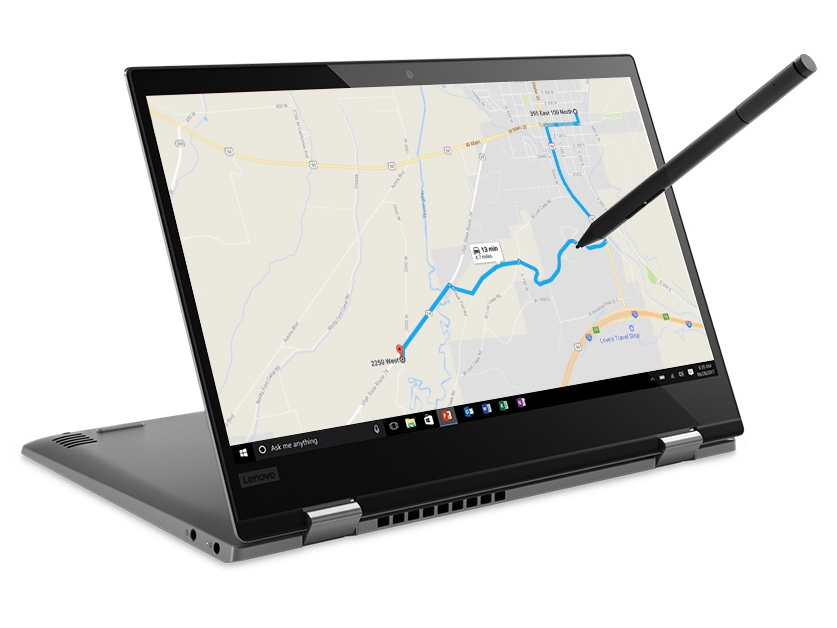
Höljets stabilitet är inte perfekt, men det är fortfarande ett lyckat chassi med en snygg design och bra konstruktionskvalitet. Active Pen, som ingår, dom hyfsade inmatningsenheterna, inklusive en tryckkänslig skärm, samt den effektiva, svala och väldigt tysta driften är andra fördelar.
Den kompakta och mångsidiga omvandlingsbara Lenovo Yoga 720 12 är billig och svarar upp mot nästan alla krav från mobila företagsanvändare. Den enda egentliga nackdelen är den begränsade uthållighet vid batteridrift.
Allt som allt så kan vi rekommendera denna testmodell.
Lenovo Yoga 720-12IKB
- 01/04/2018 v6 (old)
Sven Kloevekorn
Price comparison
